- Department of Mathematics, School of Advanced Sciences, Vellore Institute of Technology, Vellore, Tamil Nadu, India
Heart disease is a leading cause of death worldwide, highlighting the need for effective treatments for hypertension, arrhythmias, and high cholesterol. This study applies chemical graph theory to analyze the properties of seventeen heart disease drugs by evaluating minimal dominating sets and counting node appearances in these sets. Using Python, six domination degree-based topological indices from the
1 Introduction
Heart disease drugs, also known as cardiovascular drugs, are essential in treating conditions affecting the heart and blood vessels, including hypertension, coronary artery disease, heart failure, and arrhythmias. Beta blockers such as atenolol, metoprolol, esmolol, nadolol, propranolol, and timolol reduce heart rate and blood pressure, making them effective for hypertension, angina, and heart attack prevention. Diuretics like amiloride, chlortalidone, hydrochlorothiazide, furosemide, triamterene, and bumetanide manage fluid retention and high blood pressure by promoting the excretion of excess salt and water. Other drugs, including methyldopa, minoxidil, clonidine, and enalapril, lower blood pressure through various mechanisms as beta-blockers and diuretics are also anti-hypertensives. Antianginal drugs like nitroglycerin alleviate chest pain by increasing blood flow to the heart, while anticoagulants and antiplatelet drugs such as warfarin and clopidogrel prevent blood clots. Antiarrhythmics like sotalol regulate abnormal heart rhythms. These drugs play a vital role in managing heart disease by addressing both symptoms and underlying causes.
The selection of these heart disease drugs for analysis reflects their importance in treating conditions like hypertension, arrhythmias, and thrombosis, as well as their diverse pharmacological mechanisms. These drugs face unique ADMET (Absorption, Distribution, Metabolism, Excretion, and Toxicity) challenges, such as variable bioavailability due to solubility and gastrointestinal metabolism, seen with nitroglycerin and warfarin (Hardman and Limbird, 2001). Lipophilicity influences their distribution, affecting tissue targeting and blood-brain barrier permeability, particularly in drugs like propranolol and clonidine (Lipinski et al., 1997). Hepatic metabolism, often mediated by cytochrome P450 enzymes, poses risks of drug-drug interactions, as observed with clopidogrel and metoprolol. Renal clearance is a key factor for diuretics like furosemide and hydrochlorothiazide, while toxicity risks, such as arrhythmias with sotalol or severe hypotension with minoxidil, highlight safety challenges (Zanger and Schwab, 2013). Analyzing these drugs provides valuable insights into their molecular properties and enhances ADMET predictions through Quantitative Structure-Property Relationship (QSPR) modeling.
Topological indices (TIs) or molecular descriptors are mathematical representations of a compound’s molecular structure, where atoms are treated as vertices (nodes) and chemical bonds as edges (lines) in a graph. These indices capture key structural features such as atom connectivity, branching, and the overall shape of the molecule. TIs play a crucial role in various fields, particularly in QSPR and Quantitative Structure-Activity Relationship (QSAR) analyses, which predict the physicochemical and biological properties of molecules based on their structural characteristics. This provides valuable insights in drug design, environmental chemistry, and material science. The development of TIs began in the 1940s with early work in chemical graph theory. Wiener introduced molecular graphs in 1947 and proposed the Wiener index, a distance-based descriptor based on the sum of distances between all pairs of vertices in a molecule’s graph (Wiener, 1947). This laid the foundation for advancements in molecular property prediction. In 1975, Randic introduced the Randic index, which measures the balance of connectivity between atoms and predicts various physicochemical properties, including boiling point, solubility, and molecular weight (Randic, 1975). The development of computational tools and these indices enabled systematic exploration of molecular structure-property relationships, with QSPR/QSAR becoming a powerful tool in cheminformatics by the 1990s for modeling properties such as toxicity, bioactivity, and chemical reactivity. The development of more advanced indices, such as geometric and topological polar surface area, molecular volume, and electronic descriptors, further expanded the scope of QSPR/QSAR models. Using TIs and other molecular descriptors, such as electronic and geometric features, QSPR analyses develop statistical models that correlate chemical structure with desired properties. There is a potential to use QSPR indices to aid in accelerating drug discovery and material design.
Extensive research has been conducted to explore the applications of TIs in QSPR analyses, particularly in understanding the physicochemical and ADMET properties of chemical structures. Shanmukha et al. utilized degree-based TIs for anticancer drugs, combined with QSPR analysis, to establish correlations with various physicochemical properties (Shanmukha et al., 2020). Tamilarasi and Balamurugan extended QSPR studies to anti-COVID drugs targeting the Omicron variant, incorporating degree-based TIs for ADMET evaluations (Tamilarasi and Balamurugan, 2022). In a recent study (Tamilarasi and Balamurugan, 2024), new reverse sum Revan indices were introduced for analyzing the physicochemical and pharmacokinetic properties of anti-filovirus drugs, highlighting the adaptability of TIs in predicting the properties of diverse drug categories. Similarly, Mahboob et al. explored molecular descriptors in QSPR analysis for kidney cancer therapeutics (Mahboob et al., 2024b) and applied linear regression models to analyze anti-hepatitis drugs (Mahboob et al., 2024a). Muhammad Shoaib et al. conducted a QSPR analysis of Alzheimer’s compounds using TIs and regression models to effectively predict key properties (Sardar and Hakami, 2024). Chaluvaraju and T. (2024) performed a QSPR analysis of the generalized irregular neighborhood valency descriptor for some basic polycyclic aromatic hydrocarbons, while in another study (Asha et al., 2022), they investigated different types of augmented Zagreb indices for selected chemical drugs, developing a QSPR model. Additional advancements in this area can be found in the works (Sardar et al., 2024; Sardar et al., 2020; Sardar et al., 2025; Sardar and Xu, 2024). Collectively, these studies emphasize the critical role of TIs in enhancing the predictive power and reliability of QSPR models, facilitating advancements in drug design and the evaluation of therapeutic compounds.
Among the prominent contemporary TIs, domination topological indices (DTIs), introduced by Ahmed A. M. Hanan et al. (2021), are noteworthy for their innovative integration of two fundamental concepts in graph theory: topological indices and domination. These indices are intrinsically linked to the minimal dominating sets of a chemical graph, providing a unique perspective on the structural properties of molecular graphs. Although a few studies have focused on domination topological indices (Wazzan and Ahmed, 2024; Shashidhara R. et al., 2023; Shashidhara A. A. et al., 2023; Javaraju et al., 2021), research in this area remains limited. Furthermore, while several studies have focused on the QSPR analysis of the physicochemical properties of heart disease drugs (Arockiaraj et al., 2024; Hasani and Ghods, 2023; Hakeem et al., 2024), no research has been conducted on their ADMET properties. Therefore, this study is unique and can assist chemists in predicting the ADMET properties of these drugs.
There are eight sections in this article. Section 2 introduces the fundamental formulae used in the calculations. The methodology and working approach are detailed in Section 3. Section 4 presents the study’s primary findings, including the evaluation of six domination topological indices for seventeen heart disease drugs. In Section 5, inverse linear, quadratic, and cubic regression models are developed, and the correlations between the indices and properties are analyzed. This section also provides a detailed discussion on the significance of DTIs and compares the results comprehensively. Section 6 covers multilinear regression analysis, offering further insights into the relationships between the indices and drug properties. Section 7 provides a thorough analysis of the study’s findings, highlighting their potential contributions to existing literature, as well as discussing the broader implications and limitations of the research. The article concludes with a summary in Section 8, followed by a list of relevant references.
2 Basic definitions
Given a connected simple graph
Definition 2.1. (Ahmed et al., 2021a) For every node
The definitions of the first, second, and modified first Zagreb DTIs (Ahmed A. M. Hanan et al., 2021) are as given in Equations 1–3:
The following are the definitions of the forgotten, hyper and modified forgotten DTIs (Ahmed H. et al., 2021) as given in Equations 4–6:
To derive different TI’s in the scientific realm, algebraic polynomials, the significant Hosoya polynomials, and others (Ahmad et al., 2018; Diudea, 2006; Diudea et al., 2008; Knor and Tratnik, 2023; Chou and Witek, 2014; Balasubramanian, 2023; Ibrahim et al., 2022; Masmali et al., 2023; Chen, 2023; Aziz et al., 2023; Ali et al., 2022), are essential tools. These polynomials, particularly the distance-based ones such as the Wiener (1947) and hyper-Wiener index (Cash et al., 2002), provide information about the structures of molecules. According to studies (Afzal et al., 2021; Deutsch et al., 2014; Rai et al., 2020; Rasool et al., 2023), the M-polynomial, which was developed in 2015 (Afzal et al., 2020), is notable for its ability to clarify degree-based graph invariants.
Using polynomial methods, the authors introduced and produced the domination topological indices (Shashidhara R. et al., 2023). In this study,
The
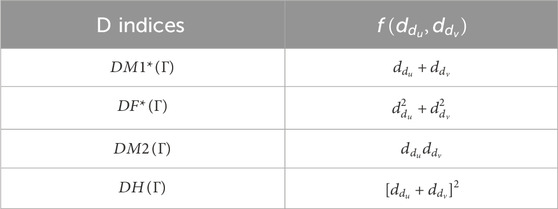
The domination (D) indices on
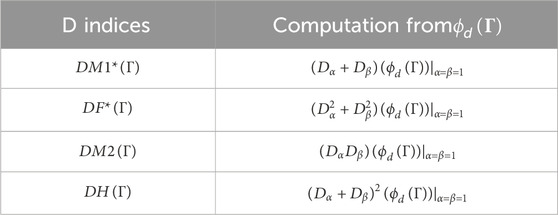
Then, Table 1 gives the detailing of some DTIs. Hence, the DTIs from
In this article, the DTIs of
3 Method and material used for computations
In this study, two primary computations are conducted: evaluating the DTIs and analyzing statistical parameters. Given that each descriptor is additive, results are obtained by summing the terms. The indices DM
4 Main results
In this section, the above mentioned DTIs are evaluated for 17 heart disease drugs (see Figure 1) using
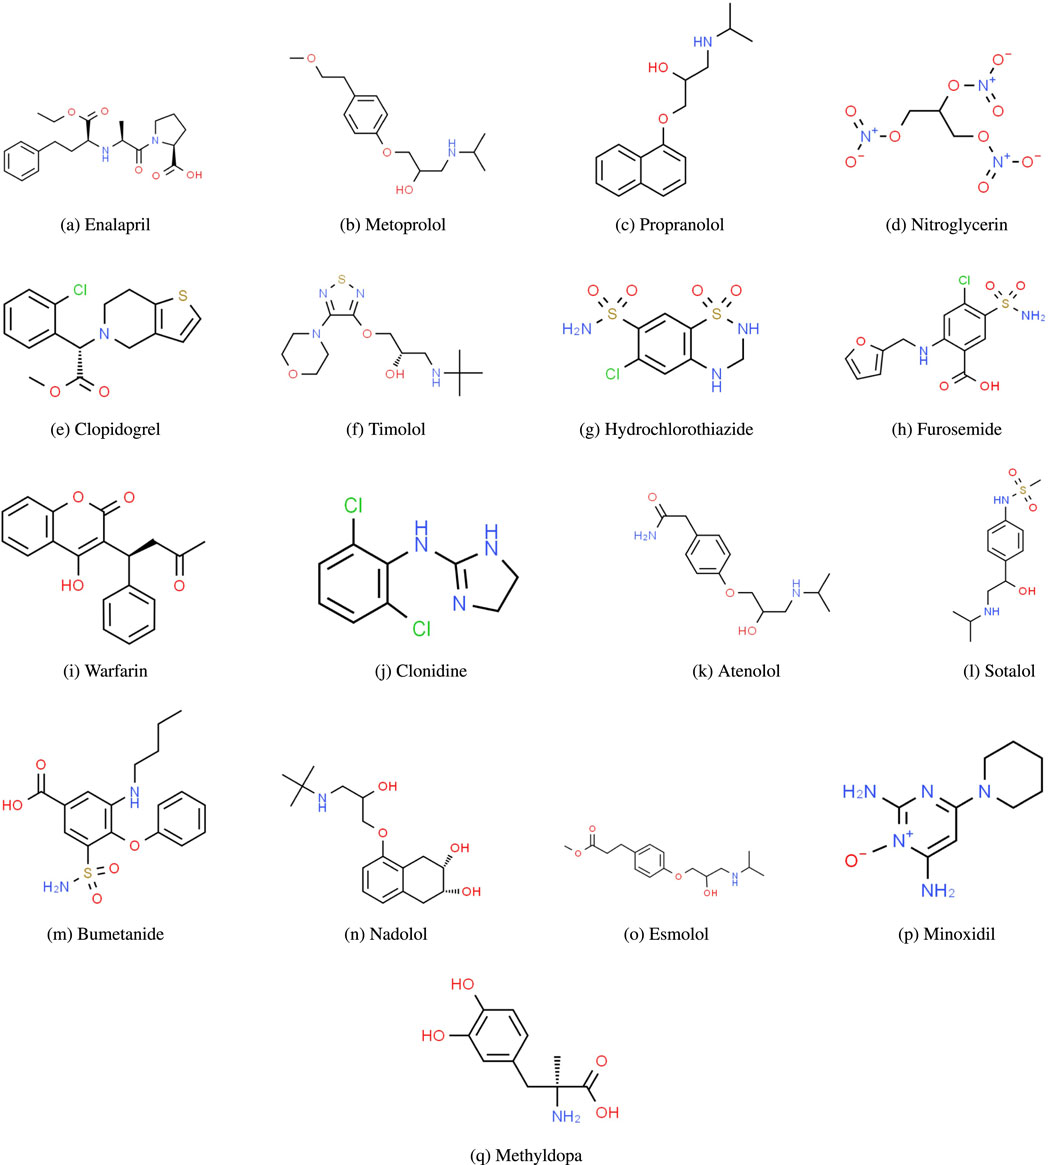
Figure 1. Molecular structures of heart disease drugs. (A) Enalapril. (B) Metoprolol, (C) Propranolol, (D) Nitroglycerin, (E) Clopidogrel, (F) Timolol, (G) Hydrochlorothiazide, (H) Furosemide, (I) Warfarin, (J) Clonidine, (K) Atenolol, (L) Sotalol, (M) Bumetanide, (N) Nadolol, (O) Esmolol, (P) Minoxidil, (Q) Methyldopa.
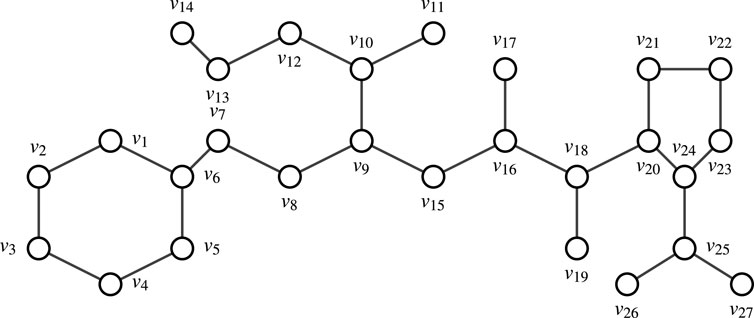
Consider Enalapril. Let
Remark 4.1. Finding all M.D.S’s in a graph with more than 10 nodes manually is challenging. Therefore, one can use Algorithm 1 to identify all M.D.S’s and determine the node appearance count in the graph. This approach leverages a combination of brute-force methods and verification steps, specifically tailored for scenarios where the graph size is manageable. The corresponding Python code for this algorithm is available on GitHub.
By evaluating the domination degree of each node of
Let
Also,
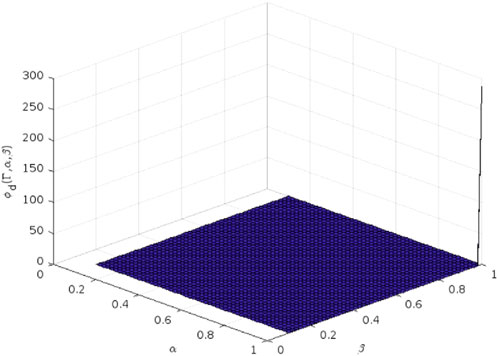
The 3D plot of the
5 Curvilinear regression analysis of heart disease drugs
Numerous statistical methods are used in regression analysis to calculate the correlations between a dependent variable and multiple independent variables. There are several varieties of this technique, including multiple linear, nonlinear, and linear regression. Among the most popular models are multiple linear regression and simple linear regression. However, nonlinear regression analysis is better suitable when there is a nonlinear relationship between the variables. Simple linear, quadratic, and cubic regression are all performed using the following model Equations 8–10 (Roustaei, 2024).
Here, DTI represents the independent variable, P (which could be a physicochemical or ADMET property) is the dependent variable,
Multivariate regression is the most common type of linear regression. It shows how a single dependent variable is linearly correlated with multiple independent variables. The model is as follows in Equation 14 (Roustaei, 2024):
Where,
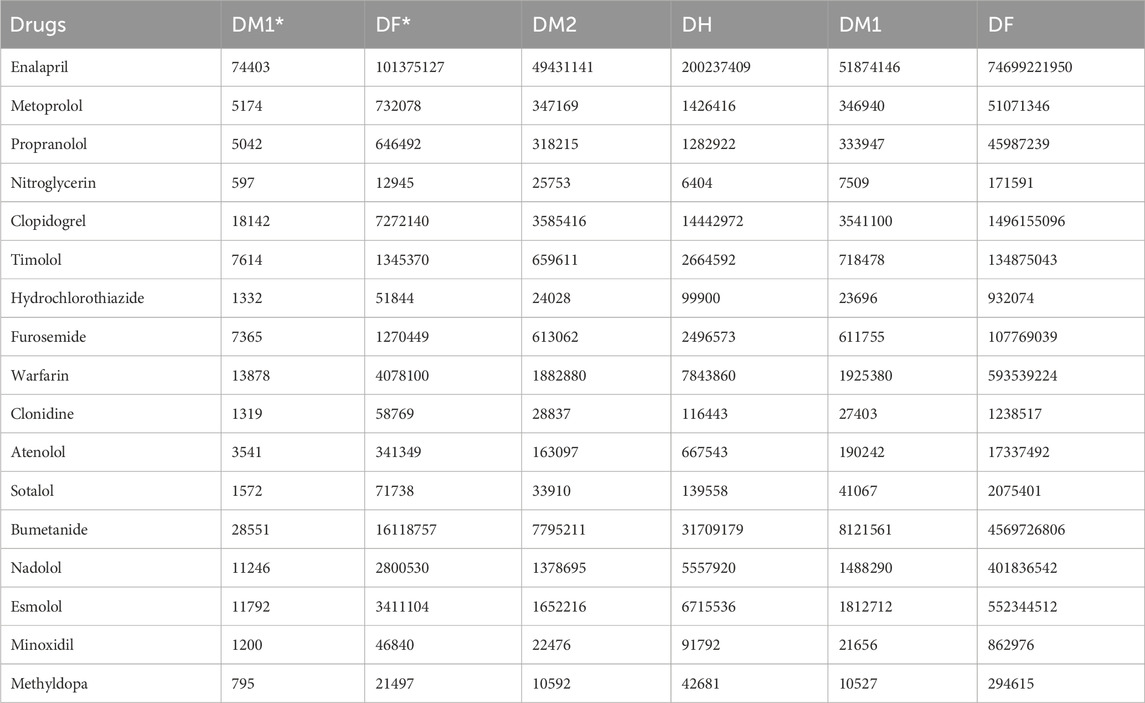
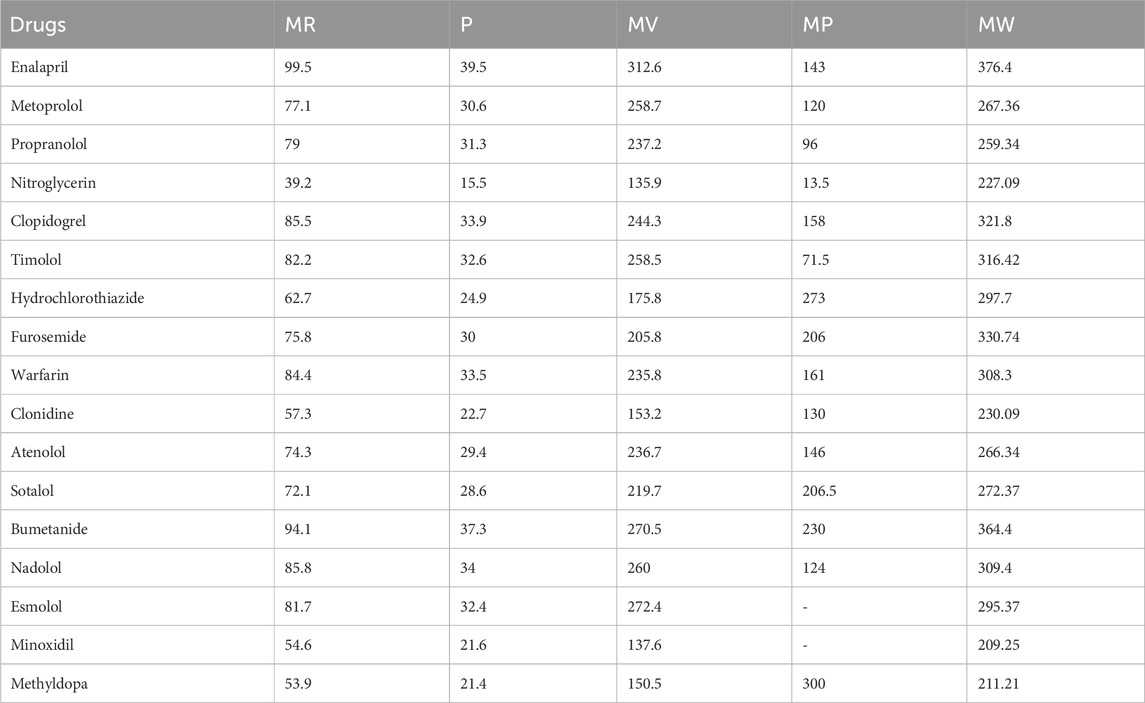
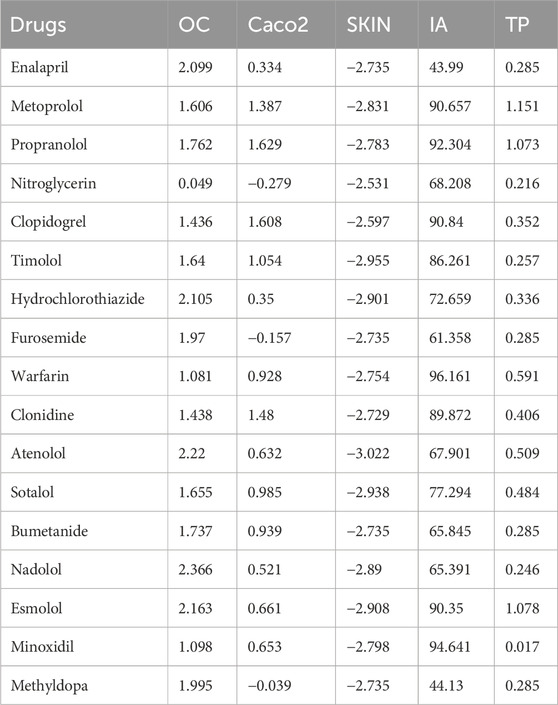
Table 5 presents the calculated DTI values for the selected heart disease drugs, which were determined using Python software. The experimental data for the drugs are obtained from ChemSpider and PubChem and are detailed in Table 6. This data includes Molar Refraction (MR), Polarizability (P), Molar Volume (MV), Melting Point (MP), and Molecular Weight (MW). Additionally, the experimental values for the ADMET properties of the drugs are sourced from pkCSM and are listed in the Table 7. These values encompass Oral Rat Chronic Toxicity (OC), Caco2 Permeability (Caco2), Skin Permeability (SKIN), Intestinal absorption (IA), and T. Pyriformis toxicity (TP).
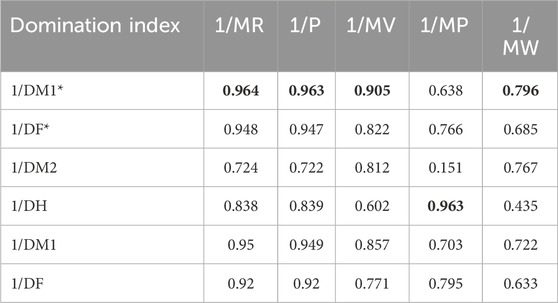
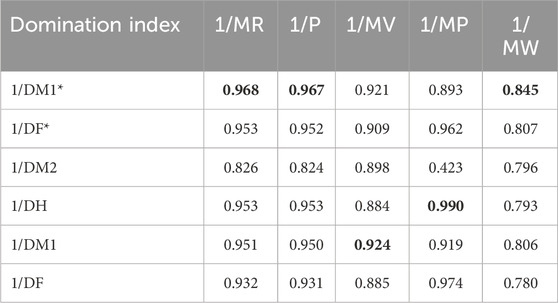
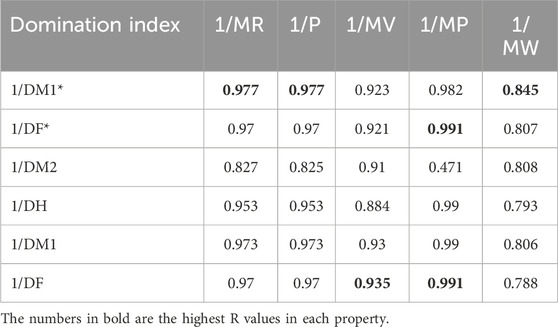
Table 8 depicts the correlation coefficient (R) between these TIs and the physicochemical properties of the drugs, derived from inverse linear regression analyses. The highest R value is emphasized in bold. Table 9 outlines the optimal linear regression equations for approximating the physicochemical properties of these drugs, characterized by the maximum R value, the minimum standard error (SE), the maximum F value and significance (P) value less than .10. Table 10 displays the R obtained from quadratic regression analyses, with the highest R value emphasized in bold. Table 11 presents the quadratic regression equations that best approximate the physicochemical properties of the drugs studied. Furthermore, Table 12 shows the R from cubic regression analyses, and Table 13 lists the corresponding cubic regression equations.
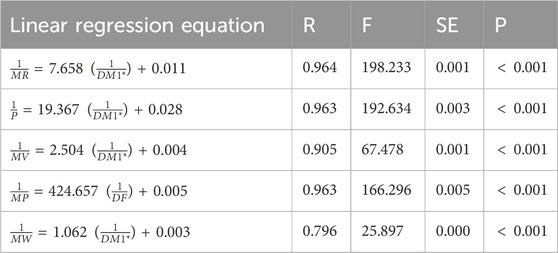
Table 9. Linear regression equations offer the most precise estimates of physicochemical properties.

Table 11. Quadratic regression equations offer the most precise estimates of physicochemical properties.

Table 13. Cubic regression equations offer the most precise estimates of physicochemical properties.
The table compares
For the linear regression model,
The quadratic regression model improves correlations, capturing nonlinear relationships. For
The cubic regression model provides the best overall fit, achieving the highest correlations across most combinations. For
The cubic regression model demonstrates consistent superiority over linear and quadratic models in predicting the physicochemical properties of heart disease drugs. However, both linear and quadratic models also show strong predictive performance and closely approximate the observed physicochemical properties in several cases. Among the indices,
The comparison of actual and predicted values for physicochemical properties using inverse linear, quadratic, and cubic regression models (Supplementary Tables S1–S3) highlights the predictive accuracy of the proposed models. All regression models demonstrate a strong correlation between actual and predicted values for most physicochemical properties, such as MR, P, MP, and MW. However, their accuracy varies depending on the specific property and regression type. For instance, in the case of MR for drugs like Enalapril and Metoprolol, the predictions from linear, quadratic, and cubic regression models exhibit close alignment with the actual values.
The results from Table 14 highlight the efficacy of cubic regression models in correlating DTIs with various ADMET properties of heart disease drugs. Among the indices, DF and DH consistently exhibit high predictive accuracy, with nearly perfect correlations (R
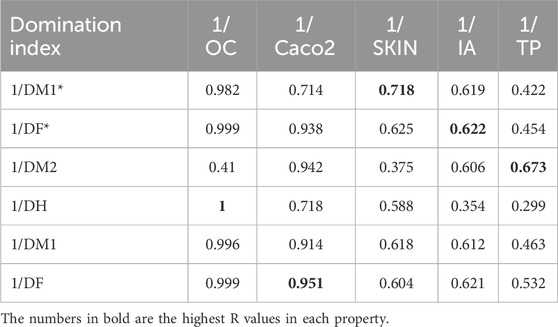
Table 14. The correlation coefficient (R) between the computed DTIs and ADMET properties determined using cubic regression models.
These findings underscore the ability of DTIs to serve as robust structural predictors, particularly for OC and Caco2, while suggesting the need for further exploration of weaker correlations, such as those observed with DM2 for OC and DH for TP. The strong performance of DF in predicting both OC and Caco2 permeability supports the hypothesis that specific domination indices may reflect critical molecular features influencing drug absorption and permeability. Additionally, the moderate correlations for properties like skin permeability and IA indicate that while cubic regression captures significant relationships.
In conclusion, the cubic regression model effectively captures the complex relationships between DTIs and ADMET properties, offering a robust framework for predicting critical drug characteristics. Table 15 highlights the most effective cubic regression models for predicting these properties. The strong correlations observed between most ADMET properties and DTIs underscore the reliability of these indices as predictors.
To further enhance prediction accuracy, future studies could explore the role of specific molecular features represented by DTIs and investigate alternative modeling techniques. Overall, the results demonstrate that DTIs are valuable tools for modeling the ADMET properties of heart disease drugs.
6 Multivariate regression analysis
Supplementary Equations S2–S6 represent the best-fitting multivariate regression models for the five physicochemical properties of heart disease drugs. Table 16 presents the statistical parameters between the computed DTIs and the physicochemical properties of heart disease drugs using multilinear regression models. The key statistical values displayed in this table are:
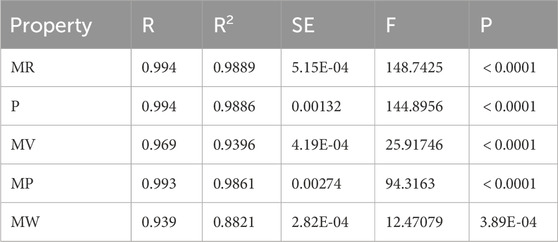
Table 16. The statistical parameters between the computed DTIs and physicochemical properties of heart disease drugs using multilinear regression models.
Supplementary Table S4 provides a comparison of the actual and predicted values for the physicochemical properties (MR, P, MV, MP, MW) of the heart disease drugs using the multilinear regression models. This Table reveals the following observations.
The results in Table 16 confirm that the multilinear regression models are highly effective in capturing the physicochemical properties of heart disease drugs, as evidenced by the very high R and R2 values, low SE, high F-statistics, and statistically significant p-values. Furthermore, the analysis of Supplementary Table S4 demonstrates that the model’s predictions for the various physicochemical properties are remarkably accurate, affirming the model’s strong predictive power. This highlights the effectiveness of the proposed regression models in drug property prediction and their potential for further applications in computational drug design.
The best-fitting multivariate regression models for the ADMET properties of heart disease drugs are presented in Supplementary Equations S7–S11. The multilinear regression models for predicting the ADMET properties of heart disease drugs, presented in Table 17, exhibit strong performance for certain properties while being less effective for others. The model for OC demonstrates exceptional accuracy, with an R value of 0.999, a low standard error, and a highly significant F-statistic, indicating near-perfect prediction. Similarly, the model for Caco-2 permeability performs well, achieving an R value of 0.961. In contrast, the models for SKIN, IA, and TP show varying levels of effectiveness. The SKIN model provides a good fit with an R value of 0.812, while the IA and TP models, with R values of 0.704 and 0.603, respectively, exhibit moderate predictive power, particularly for TP. Overall, these results highlight the potential of multilinear regression models to predict ADMET properties of heart disease drugs, with varying degrees of accuracy depending on the specific property being analyzed.
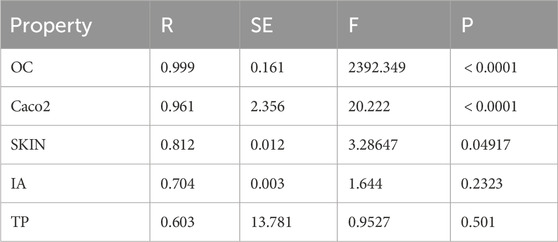
Table 17. The statistical parameters between the computed DTIs and ADMET properties of heart disease drugs using multilinear regression models.
Although several studies have concentrated on the QSPR analysis of the physicochemical properties of heart disease drugs, there is no research on their ADMET properties. Additionally, our proposed cubic and multilinear regression models demonstrate a strong correlation between the indices and the ADMET properties of these drugs. Therefore, our model is valuable for predicting the ADMET properties of these drugs.
7 Discussion
This study offers significant improvements over traditional methods by enhancing both efficiency and accuracy. By using chemical graph theory and computational algorithms, it streamlines the evaluation of minimal dominating sets and computation of domination degree-based indices, reducing manual effort and potential errors. Unlike traditional methods that rely on time-consuming experimental measurements, the
Our study offers a significant advancement over existing QSPR investigations. In Hasani and Ghods (2023), QSPR analysis was conducted on four calcium channel-blocking heart treatment drugs, resulting in higher correlation values. However, it is not directly feasible to compare these regression models with our proposed models, which are based on a data set of 17 drug molecules. Similarly, the study (Hakeem et al., 2024) reports higher correlation coefficients for certain physicochemical properties compared to our models. Nevertheless, our models yield more accurate property predictions than the models referenced in these studies. This enhanced accuracy can be attributed to the extended dataset used in our analysis, which represents a significant increase compared to the existing datasets employed in previous QSPR models.
The carefully chosen 17 drug molecules not only provide a strong correlation between DTIs and drug properties but also reflect a diverse set of molecular structures, which enhances the generalizability of the resulting QSPR models. By incorporating drugs from different cardiovascular drug classes, such as antihypertensives, antiarrhythmic agents, and lipid-lowering medications, the selection allows for a deeper understanding of how variations in molecular architecture can influence key physicochemical and ADMET properties. This diversity ensures that the developed models are versatile and applicable to a wider range of compounds. Additionally, the focus on these 17 molecules enables efficient computation, which is critical for maintaining reproducibility and reliability in the predictive analysis. The use of DTIs as a core feature of the model further enhances its scientific value, offering valuable insights into the relationship between molecular structure and drug behavior. This approach also establishes a methodological framework that can be extended to future studies, promoting a more comprehensive understanding of drug properties across different classes and chemical spaces.
The inverse regression method is selected for its capability to effectively capture complex, nonlinear relationships between variables, providing greater flexibility compared to regression models. This method is particularly suited for scenarios where the relationship between independent and dependent variables is nonlinear, enabling more precise modeling. Using SPSS software, we implemented the inverse regression models (linear, quadratic and cubic) to calculate the constants and coefficients that minimize the error between observed and predicted values, ensuring a superior fit for the dataset. In QSPR analysis, the statistical evaluation incorporates R, SE, and P-value. The R value quantifies the strength of the relationship between variables, indicating the proportion of variance in the dependent variable explained by the model. SE measures the square root of the average squared differences between observed and predicted values, while a P-value less than 0.10 signifies the statistical significance of the model. An ideal regression model is characterized by a high R value, low SE, and a significant P-value. SPSS software is employed to calculate these metrics, ensuring accurate and reliable analysis.
The correlation coefficient (R) is chosen for this study because it effectively measures how well the regression model aligns with the data, providing a clear indication of the strength of relationships between variables. Its simplicity and widespread use in statistical analysis make it an ideal choice. In this work, the evaluation of DTIs is based on their correlation with selected physicochemical and ADMET properties, ensuring that indices with stronger correlations are prioritized. Previous studies, such as those by Gutman and Tošović (2013) and Sardar and Hakami (2024), have employed similar approaches to assess the ability of graphical indices to explain physicochemical characteristics. Our findings reveal that
The practical interpretability of DTIs offers valuable insights for pharmaceutical applications, particularly in the design and optimization of drug candidates. DTIs, which quantify the structural properties of molecules by modeling them as graphs, provide a quantitative measure of how the connectivity and arrangement of atoms in a molecule can influence its physicochemical and pharmacokinetic properties. Medicinal chemists can use DTIs to gain a deeper understanding of the molecular structure of potential drug candidates and how these structures might influence important properties like solubility, stability, and permeability. By analyzing the relationship between specific topological features (such as connectivity, branching, or ring structure) and desired properties (e.g., boiling point, logP, or water solubility), chemists can prioritize molecular designs that are more likely to exhibit optimal characteristics. This enables more efficient identification of candidates with favorable physicochemical profiles, reducing the time and cost involved in the drug development process.
Extending DTIs to other therapeutic areas, such as antimicrobial, anticancer, or neurological drugs, could enhance their utility in drug discovery by predicting specialized properties required for different diseases. Incorporating domain-specific knowledge could improve predictions for drug properties like cellular uptake or receptor binding. Integrating DTIs with machine learning models, such as random forests or neural networks, offers the potential to capture complex, nonlinear relationships, improving prediction accuracy for drug properties, including ADMET profiles and efficacy. This integration could also enhance scalability, accelerating the drug discovery process and leading to more personalized therapeutic approaches.
7.1 Implications
DTIs have the potential to aid in predicting potential drug-drug interactions, and therefore improve the safe use of drugs. Understanding the structural properties may help pharmacists and chemists enhance treatment outcomes and optimize medication development, leading to more efficient drug creation.
7.2 Limitations
The scalability of DTIs is challenging especially when applied to larger datasets. As the size of the drug database grows, the computational complexity of calculating the minimal dominating sets and corresponding topological indices can also increase significantly. This issue could potentially slow down the analysis or require additional computational resources. However, optimization techniques and more efficient algorithms may be developed to address these scalability concerns.
8 Conclusion
In this study, we computed domination degree-based topological indices for chemical drugs used in the treatment of heart disease and applied them in QSPR analysis to predict their physicochemical and ADMET properties. The findings reveal that inverse linear, quadratic, and cubic regression models have the potential to predict physicochemical properties, with the cubic regression model demonstrating superior predictive performance for ADMET properties. Multivariate regression models also show potential for predicting physicochemical and ADMET properties. However, the DTIs serve as potential predictors rather than replacements for laboratory experiments. These findings highlight the significance of these indices in establishing a theoretical foundation for drug synthesis, offering a valuable predictive tool for chemists and the pharmaceutical industry. By minimizing the reliance on time-intensive laboratory experiments, these analyses facilitate the efficient design of new drugs by leveraging the strong correlations between critical properties. Additionally, the methodologies presented in this study can be adapted for other drugs targeting different diseases, using computed topological descriptors to predict their respective physicochemical and ADMET properties. Future directions include extending this approach to a broader range of drug classes and exploring the integration of machine learning techniques to further enhance the predictive power of the models. Additionally, further studies may focus on refining the accuracy of predictions for specific ADMET properties by incorporating more complex molecular descriptors.
Data availability statement
The original contributions presented in the study are included in the article/Supplementary Material, further inquiries can be directed to the corresponding author.
Author contributions
GK: Conceptualization, Data curation, Formal Analysis, Investigation, Methodology, Resources, Software, Validation, Visualization, Writing–original draft, Writing–review and editing. AP: Conceptualization, Data curation, Formal Analysis, Funding acquisition, Investigation, Methodology, Resources, Software, Supervision, Validation, Visualization, Writing–original draft, Writing–review and editing.
Funding
The author(s) declare that financial support was received for the research, authorship, and/or publication of this article. The article processing fee for open access is funded by the Vellore Institute of Technology, Vellore, Tamil Nadu, India.
Acknowledgments
The authors would like to thank the reviewers and editor for their detailed comments that improved the presentation and quality of the paper.
Conflict of interest
The authors declare that the research was conducted in the absence of any commercial or financial relationships that could be construed as a potential conflict of interest.
Generative AI statement
The author(s) declare that no Generative AI was used in the creation of this manuscript.
Publisher’s note
All claims expressed in this article are solely those of the authors and do not necessarily represent those of their affiliated organizations, or those of the publisher, the editors and the reviewers. Any product that may be evaluated in this article, or claim that may be made by its manufacturer, is not guaranteed or endorsed by the publisher.
Supplementary material
The Supplementary Material for this article can be found online at: https://www.frontiersin.org/articles/10.3389/fchem.2025.1536199/full#supplementary-material
References
Abdlhusein, M. A., and Al-Harere, M. N. (2021). New parameter of inverse domination in graphs. Indian J. Pure Appl. Math. 52 (1), 281–288. doi:10.1007/s13226-021-00082-z
Afzal, M., Farooq, T., and Imran, M. (2020). Analysis of domination degree based topological indices for predicting molecular properties. J. Appl. Math. Comput. 63 (1-2), 67–83. doi:10.1007/s12190-019-01240-7
Afzal, M., Farooq, T., and Imran, M. (2021). A new family of topological indices based on domination degree and its applications. J. Math. Chem. 59 (8), 1821–1834. doi:10.1007/s10910-021-01208-1
Ahangar, H. A., Chellali, M., Sheikholeslami, S. M., and Valenzuela-Tripodoro, J. C. (2022). Maximal double roman domination in graphs. Appl. Math. Comput. 414, 126662. doi:10.1016/j.amc.2021.126662
Ahmad, M., Saeed, M., Arshad, M., Cheema, I. Z., and Hussain, M. (2018). Algebraic polynomials and invariants of certain chemical networks. J. Comput. Theor. Nanosci. 15 (4), 1340–1347. doi:10.1166/jctn.2018.7312
Ahmed, A. M. H., Alwardi, A., and Salestina, R. M. (2021a). On domination topological indices of graphs. Int. J. Analysis Appl. 19 (1), 47–64.
Ahmed, H., Alwardi, A., Salestina, R. M., and Soner, N. D. (2021b). Forgotten domination, hyper domination, and modified forgotten domination indices of graphs. J. Discrete Math. Sci. Cryptogr. 24 (2), 353–368. doi:10.1080/09720529.2021.1885805
Ali, A. M., Abdullah, H. O., and Saleh, G. A. M. (2022). Hosoya polynomials and wiener indices of carbon nanotubes using mathematica programming. J. Discrete Math. Sci. Cryptogr. 25 (1), 147–158. doi:10.1080/02522667.2021.1968578
Arockiaraj, M., Greeni, A. B., Kalaam, A. R. A., Aziz, T., and Alharbi, M. (2024). Mathematical modeling for prediction of physicochemical characteristics of cardiovascular drugs via modified reverse degree topological indices. Eur. Phys. J. E 47, 53. doi:10.1140/epje/s10189-024-00446-3
Asha, T. V., Chaluvaraju, B., and Kulli, V. R. (2022). Different types of augmented Zagreb indices of some chemical drugs: a QSPR model. Eurasian Chem. Commun. 4, 513–524. doi:10.22034/ecc.2022.324379.1297
Aziz, A., Mohammed, H. N., and Ali, A. M. (2023). Schultz and modified schultz polynomials of edges induce chain and ring for hexagonal graphs. Eur. J. Pure Appl. Math. 16 (3), 1580–1591. doi:10.29020/nybg.ejpam.v16i3.4783
Balasubramanian, K. (2023). Topological indices, graph spectra, entropies, laplacians, and matching polynomials of n-dimensional hypercubes. Symmetry 15 (2), 557. doi:10.3390/sym15020557
Cash, T., Dean, A., and Noble, S. D. (2002). The tutte polynomial of a graph. J. Comb. Theory, Ser. B 84 (1), 133–144. doi:10.1006/jctb.2001.2078
Chaluvaraju, B., and T., V. (2024). QSPR analysis of the generalized irregular neighborhood valency descriptor of some basic polycyclic aromatic hydrocarbons. Polycycl. Aromat. Compd. 44 (5), 3272–3288. doi:10.1080/10406638.2023.2232578
Chen, H. (2023). The tutte polynomial of a class of compound graphs and its applications. Discrete Math. Algorithms Appl. 15 (1), 2250058. doi:10.1142/S1793830922500586
Chou, C. P., and Witek, H. A. (2014). Closed-form formulas for the zhang-zhang polynomials of benzenoid structures: chevrons and generalized chevrons. MATCH Commun. Math. Comput. Chem. 72 (1), 105–124.
Deutsch, E., Wang, H., Rapaport, I., Rica, S., and Theyssier, G. (2014). Strict majority bootstrap percolation in the r-wheel. Inf. Process. Lett. 114 (6), 277–281. doi:10.1016/j.ipl.2014.01.005
Diudea, M. V., Simona, C., and Peter, E. J. (2008). Omega and related counting polynomials. MATCH Commun. Math. Comput. Chem. 60 (1), 237–250.
Gutman, I., and Tošović, J. (2013). Testing the quality of molecular structure descriptors: vertex-degree-based topological indices. J. Serbian Chem. Soc. 78 (6), 805–810. doi:10.2298/jsc121002134g
Hakeem, A., Katbar, N. M., Muhammad, F., and Ahmed, N. (2024). QSPR analysis of some important drugs used in heart attack treatment via degree-based topological indices and regression models. Polycycl. Aromat. Compd. 44 (8), 5237–5246. doi:10.1080/10406638.2023.2262697
Hardman, J. G., and Limbird, L. E. (2001). Goodman and gilman’s: the pharmacological basis of therapeutics. McGraw-Hill.
Hasani, M., and Ghods, M. (2023). Calculation of topological indices along with MATLAB coding in QSPR analysis of calcium channelchannel-blocking cardiac drugs. J. Math. Chem. 62, 2456–2477. doi:10.1007/s10910-023-01570-9
Ibrahim, M., Husain, S., Zahra, N., and Ahmad, A. (2022). Vertex-edge degree based indices of honey comb derived network. Comput. Syst. Sci. Eng. 40 (1), 247–258. doi:10.32604/CSSE.2022.018227
Javaraju, S., Ahmed, H., Alsinai, A., and Soner, N. D. (2021). Domination topological properties of carbidopa-levodopa used for treatment of Parkinson’s disease by using -polynomial. Eurasian Chem. Commun. 3 (9), 614–621. doi:10.22034/ecc.2021.295039.1203
Knor, M., and Tratnik, N. (2023). A new alternative to szeged, mostar, and PI polynomials: the SMP polynomials. Mathematics 11 (4), 956. doi:10.3390/math11040956
Lipinski, C. A., Lombardo, F., Dominy, B. W., and Feeney, P. J. (1997). Experimental and computational approaches to estimate solubility and permeability in drug discovery and development settings. Adv. Drug Deliv. Rev. 23 (1-3), 3–25. doi:10.1016/S0169-409X(96)00423-1
Mahboob, A., Rasheed, M. W., Amin, L., and Hanif, I. (2023). A study of novel molecular descriptors and quantitative structure–property relationship analysis of blood cancer drugs. Eur. Phys. J. Plus 138 (9), 856–865. doi:10.1140/epjp/s13360-023-04499-9
Mahboob, A., Rasheed, M. W., Dhiaa, A. M., Hanif, I., and Amin, L. (2024a). On quantitative structure-property relationship (QSPR) analysis of physicochemical properties and anti-hepatitis prescription drugs using a linear regression model. Heliyon 10 (1), e25908. doi:10.1016/j.heliyon.2024.e25908
Mahboob, A., Rasheed, M. W., Hanif, I., Amin, L., and Alameri, A. (2024b). Role of molecular descriptors in quantitative structure-property relationship analysis of kidney cancer therapeutics. Int. J. Quantum Chem. 124 (1), 88–96. doi:10.1002/qua.27241
Masmali, I., Nadeem, M., Yousaf, A., Akbar, A., and Razzaque, A. (2023). An effective technique for developing the graphical polynomials of certain molecular graphs. Sci. Rep. 13 (1), 4764. doi:10.1038/s41598-023-31623-7
Rai, D., Pandey, P., and Sharma, M. (2020). A comparative study of domination related topological indices and their applications. J. Math. Chem. 58 (9), 1987–2004. doi:10.1007/s10910-020-01126-0
Raju, S., and Nayaka, S. R. (2023). On the second domination hyper index of graph and some graph operations. Adv. Appl. Discrete Math. 39 (1), 125–143. doi:10.17654/0974165823041
Randic, M. (1975). Characterization of molecular branching. J. Am. Chem. Soc. 97 (23), 6609–6615. doi:10.1021/ja00856a001
Rasool, M., Khan, A., and Imran, M. (2023). Novel domination degree-based topological indices for QSAR/QSPR analysis. J. Comput. Theor. Nanosci. 20 (5), 1257–1266. doi:10.1166/jctn.2023.10347
Roustaei, N. (2024). Application and interpretation of linear-regression analysis. Med. Hypothesis, Discov. Innovation Ophthalmol. 13 (3), 151–159. doi:10.51329/mehdiophthal1506
Sardar, M. S., and Hakami, K. H. (2024). QSPR analysis of some Alzheimer’s compounds via topological indices and regression models. J. Chem. 1 5520607. doi:10.1155/2024/5520607
Sardar, M. S., Pan, X. F., and Xu, S. A. (2020). Computation of resistance distance and Kirchhoff index of the two classes of silicate networks. Appl. Math. Comput. 381, 125283. doi:10.1016/j.amc.2020.125283
Sardar, M. S., Pan, X. F., and Xu, S. J. (2024). Computation of the resistance distance and the Kirchhoff index for the two types of claw-free cubic graphs. Appl. Math. Comput. 473, 128670. doi:10.1016/j.amc.2024.128670
Sardar, M. S., and Xu, S. J. (2024). Extremal values on the Kirchhoff index of the line graph of unicyclic networks. Circuits, Syst. Signal Process. doi:10.1007/s00034-024-02924-7
Sardar, M. S., Xu, S. J., and Pan, X. F. (2025). Extremal values on the Kirchhoff index of the line graph of trees. Kuwait J. Sci. 52 (1), 100327. doi:10.1016/j.kjs.2024.100327
Shanmukha, M. C., Basavarajappa, N. S., Shilpa, K. C., and Usha, A. (2020). Degree-based topological indices on anticancer drugs with QSPR analysis. Heliyon 6 (6), e04235. doi:10.1016/j.heliyon.2020.e04235
Shashidhara, A. A., Ahmed, H., Nandappa, S., and Cancan, M. (2023b). Domination version: sombor index of graphs and its significance in predicting physicochemical properties of butane derivatives. Eurasian Chem. Commun. 5 (1), 91–102. doi:10.22034/ecc.2023.357241.1522
Shashidhara, R., Manju, P. S., and Murali, K. N. (2023a). Combinatorial analysis of domination degree indices in chemical graph theory. MATCH Commun. Math. Comput. Chem. 90 (2), 353–368.
Tamilarasi, W., and Balamurugan, B. J. (2022). ADMET and quantitative structure property relationship analysis of anti-covid drugs against Omicron variant with some degree-based topological indices. Int. J. Quantum Chem. 122 (20), e26967. doi:10.1002/qua.26967
Tamilarasi, W., and Balamurugan, B. J. (2024). New reverse sum Revan indices for physicochemical and pharmacokinetic properties of anti-filovirus drugs. Front. Chem. 12, 1486933. doi:10.3389/fchem.2024.1486933
Wazzan, S., and Ahmed, H. (2024). Advancing computational insights: domination topological indices of polysaccharides using special polynomials and QSPR analysis. Contemp. Math. 5 (1), 26–49. doi:10.37256/cm.5120243419
Wiener, H. (1947). Structural determination of paraffin boiling points. J. Am. Chem. Soc. 69, 17–20. doi:10.1021/ja01193a005
Keywords: domination degree, minimal dominating sets, domination topological indices, ADMET properties, QSPR study
Citation: Kuriachan G and Parthiban A (2025) Computation of domination degree-based topological indices using python and QSPR analysis of physicochemical and ADMET properties for heart disease drugs. Front. Chem. 13:1536199. doi: 10.3389/fchem.2025.1536199
Received: 28 November 2024; Accepted: 17 February 2025;
Published: 12 March 2025.
Edited by:
Xingxing Jiang, Chinese Academy of Sciences (CAS), ChinaReviewed by:
Karthik Muthusamy, Bristol Myers Squibb, United StatesMuhammad Ahsan Binyamin, Government College University, Faisalabad, Pakistan
Lokesha V., Vijayanagara Sri Krishnadevaraya University, India
Copyright © 2025 Kuriachan and Parthiban. This is an open-access article distributed under the terms of the Creative Commons Attribution License (CC BY). The use, distribution or reproduction in other forums is permitted, provided the original author(s) and the copyright owner(s) are credited and that the original publication in this journal is cited, in accordance with accepted academic practice. No use, distribution or reproduction is permitted which does not comply with these terms.
*Correspondence: A. Parthiban, cGFydGhpYmFuLmFAdml0LmFjLmlu
 Geethu Kuriachan
 A. Parthiban