 Yan-Duo Wang1†
 Cheng-Gang Song2†
 Jian Yang3
 Tao Zhou4
 Yu-Yang Zhao3Jian-Chun Qin2*
 Lan-Ping Guo3*
 Gang Ding1*
- 1Key Laboratory of Bioactive Substances and Resources Utilization of Chinese Herbal Medicine, Ministry of Education, Institute of Medicinal Plant Development, Chinese Academy of Medical Sciences and Peking Union Medical College, Beijing, China
- 2College of Plant Sciences, Jilin University, Changchun, China
- 3State Key Laboratory Breeding Base of Dao-di Herbs, National Resource Center for Chinese Materia Medica, China Academy of Chinese Medical Sciences, Beijing, China
- 4Guizhou University of Traditional Chinese Medicine, Guiyang, China
Analysis, purification, and characterization of AFB1 degraded products are vital steps for elucidation of the photocatalytic mechanism. In this report, the UPLC-Q-TOF-MS/MS technique was first coupled with purification and NMR spectral approaches to analyze and characterize degraded products of AFB1 photocatalyzed under UV irradiation. A total of seventeen degraded products were characterized based on the UPLC-Q-TOF-MS/MS analysis, in which seven ones (1–7) including four (stereo) isomers (1,2, 5, and 6) were purified and elucidated by NMR experiments. According to the structural features of AFB1 and degraded products (1–7), the possible photocatalytic mechanisms were suggested. Furthermore, AFB1 and degraded products (1–7) were evaluated against different cell lines. The results indicated that the UPLC-Q-TOF-MS/MS technique combined with purification, NMR spectral experiments, and biological tests was an applicable integrated approach for analysis, characterization, and toxic evaluation of degraded products of AFB1, which could be used to evaluate other mycotoxin degradation processes.
Introduction
Aflatoxins (AFBs), a group of mycotoxins (including AFB1, AFB2, AFBG1, AFG2, and other derivatives) with highly toxic, mutagenic, and carcinogenic activities, are mainly produced by Aspergillus flavus and A. parasiticus (Massey et al., 1995; Rustom, 1997). These two fungi could infect plants, grains, food, and animals which could lead to significant food safety problems and economic losses. The core skeleton of AFBs is dihydrofuro [2,3-b]furan combined with a coumarin ring, in which the double bond on the furan ring is the key toxic group. The double bond (C-8/C-9) could be transformed to AFB-8,9-epoxide in the human body, which then quickly combines with DNA, glutathione S-transferase, or N7 guanine to form highly toxic adducts (Garner et al., 1971; Essigmann et al., 1977; Lin et al., 1977; Croy et al., 1978).
Aflatoxin B1 is the most notorious type with potential teratogenic, mutagenic, and hepatocarcinogenic toxicity, and it is classified as a group I carcinogen by the International Agency for Research in Cancer (IARC) (Cancer, 1993). Thus, degradation or reduction of AFB1 becomes a hot spot worldwide. Diverse approaches including physical, chemical, and biological methods are used to degrade or reduce AFBs (Alberts et al., 2009; Mendez-Albores et al., 2009; Liu et al., 2010; Liu et al., 2011; Luo et al., 2014; Kumar et al., 2017; Peng et al., 2018). Physical methods mainly include high temperature, irradiation, adsorption, and ultrasonic methods, among which UV irradiation is often employed as an effective method to degrade or reduce AFBs based on the photosensitive characteristics (Calado et al., 2014). Liu investigated the photodegradation of AFB1 in water/acetonitrile solution and characterized three degraded products based on UPLC-Q-TOF MS data (Liu et al., 2010). Later, they analyzed AFB1 photodegradation in peanut oil under UV irradiation and concluded that the mutagenic effects of UV-treated samples were completely lost compared with those of untreated samples (Liu et al., 2011). Mao analyzed the degraded products of AFB1 in peanut oil using the UPLC-Q-TOF-MS/MS technique (Mao et al., 2016). Wang investigated the degraded products using the LC-MS/MS approach and postulated toxicity of AFB1 in methanol–water solution irradiated with Co60 gamma-rays (Wang et al., 2011). Recently, Li’s group investigated the photodegraded inactivation mechanism of the hypertoxic site in aflatoxin B1 by HPLC-MS (Mao et al., 2019).
Obtaining pure AFB1-degraded products and elucidating their structures are very important to establish the photodegradation mechanism and toxic evaluation. Usually, due to limited amounts, purification of AFB1-degraded products was significantly difficult. Thus, most mycotoxin-degraded products were mainly characterized by LC-MS/MS techniques without further separation. The LC-MS/MS technique is a high-efficient and sensitive approach for analysis and structural characterization of different metabolites in mixtures, which is often used to dereplicate or detect new compounds from extracts or characterize mycotoxin-degraded products. Yet, this technique could not differentiate (stereo) isomers easily. The nuclear magnetic resonance (NMR) spectral technique is a standard and universal approach for structural elucidation (Wang et al., 2018; Song et al., 2019; Li et al., 2020; Wang et al., 2020). In this study, UPLC-Q-TOF-MS/MS analysis combined with purification and NMR spectral experiments was used to characterize AFB1-degraded products under UV irradiation. The possible photocatalytic mechanism was elucidated, and toxicities of AFB1 and degraded products (1–7) were evaluated, which provided a thought for other mycotoxin degradation processes.
Experimental
Chemicals and Reagents
Aflatoxin B1 was purchased from Pribolab (Qingdao, China). Chromatographic-grade methanol and acetone were obtained from Tianjin Saifu Rui Technology Company (Tianjin, China). Analytical-grade methanol, acetone, and DMSO were obtained from Chron Chemicals (Chengdu, China). For NMR analysis, all deuterium reagents were purchased from Sigma (St. Louis, MO, USA).
Standard solutions of AFB1 were placed in a 2-ml sealed centrifugal tube, prepared in methanol–DMSO (9:1 v/v), and fully dissolved in methanol using an ultrasound device from Beijing Tianlin Hengtai Technology Company (Beijing, China), and then, it was submitted to be degraded.
UV Irradiation
To investigate the degradation of AFB1, a UV lamp (20 W, 72 μws/cm2, GGZ250-1, Shanghai Jiming Special Lighting Appliance Factory) at 365 nm wavelength was used to perform the irradiation experiments. 18 mg of pure AFB1 was added to acetone solvent, and 10 mg of pure AFB1 was added to methanol solvent, and both of them were placed in a sealed centrifugal tube and illuminated at room temperature for 45 h (Liu et al., 2010).
HPLC Operation
The degraded products were analyzed and isolated by semipreparative HPLC on SEP LC-52 with an MWD UV detector (Separation (Beijing) Technology Co. Ltd., Beijing, China) using a 250 mm × 10 mm i. d., 5 μm, ODS-A column (YMC, Kyoto, Japan). The mixture in methanol was purified by semipreparative HPLC (55–60% CH3OH in H2O, v/v, 2 ml/min, 30 min) and yielded 4 (0.6 mg, tR = 18.6 min), 3 (0.5 mg, tR = 22.3 min), 1 (0.5 mg, tR = 23.8 min), and 2 (0.4 mg, tR = 27.0 min), respectively. The mixture in acetone was isolated by semipreparative HPLC (40% CH3OH in H2O, v/v, 2 ml/min, 3 min; 40–100% CH3OH in H2O, v/v, 2 ml/min, 20 min) and yielded 5, 6 (7.0 mg, tR = 18.7 min), and 7 (1.5 mg, tR = 21.2 min).
Determination of Degraded Products
The degraded products were identified by NMR experiments. Compounds were analyzed by UPLC-Q-TOF-MS/MS in positive ion mode. 1D and 2D-NMR spectra were acquired using solvent signals (CD3OD: δH 3.31/δC 49.9; C3D6O: δH 2.05/δC 49.9; Pyridine-d5: δH 8.74, 7.58, 7.22/δC 150.4, 135.9, and 123.9) on a Bruker 600 spectrometer (1H: 600 MHz) and a Bruker Avance III 500 spectrometer (1H: 500 MHz; 13C: 125 MHz) (Bruker, Rheinstetten, Germany).
UPLC-Q-TOF MS Analysis
AFB1 and degraded products were analyzed using a UPLC-Q-TOF-MS/MS system (Waters, United States). Chromatographic analysis was carried out with a Waters Acquity UPLC-PDA system equipped with an analytical reverse-phase C-18 column (2.1 × 100 mm, 1.7 μm, Acquity BEH, Waters, United States) with an absorbance range of 200–400 nm. The column temperature was maintained at 40°C. 0.1% formic acid in water (A) and 0.1% formic acid in acetonitrile (B) were used as the mobile phase. The gradient conditions were as follows: 0–10 min, 10 %–60% B; 10–12.5 min, 60 %–95% B; and 12.6–15 min, 10% B. The flow rate from the UPLC system into the ESI-Q-TOF-MS detector was 0.3 ml/min. The auto-injected volume was 3 μl. Time-of-flight MS detection was performed with a Waters SYNAPT G2 HDMS (Waters Corp., Manchester, United Kingdom) TOF mass spectrometer combined with an ESI source in the positive ion scan mode. The desolvation temperature was set at 400°C with desolvation gas flow at 600 L/h, and the source temperature was 100°C. The lock mass in all analyses was leucine–enkephalin ([M + H]+ = 556.2771), used at a concentration of 0.5 g/ml and infused at a flow rate of 10 L/min. Raw data were acquired using the centroid mode, and the mass range was set from m/z 50 to 1200. The capillary voltage was set at 3.0 kV with 40 and 4.0 V of the sample and extraction cone voltage. The collision energy was set as 20 eV for low-energy scan and a ramp from 20 to 30 eV for high-energy scan. The instrument was controlled by MassLynx 4.1 software.
Toxic Evaluation of Degraded Products and AFB1
All the degraded products and AFB1 were tested for their cytotoxicity against human normal hepatocytes LO-2 and cancer cell lines Hep-G2 and MCF-7. Cells were incubated in a DMEM high glucose medium (Gibco, USA), added with 10% fetal bovine serum (Gibco, United States) and cultured in a 5% CO2 incubator at 37°C. The cytotoxicity tests were performed using the MTS (Promega, United States) (Ahmed et al., 2019).
Results and Discussion
UPLC-Q-TOF-MS/MS Base Peak Intensity and the UPLC Chromatogram of Degraded Products
The UPLC-Q-TOF-MS/MS BPI of AFB1 and its degraded products in methanol–H2O and acetone–H2O solvents are shown in Figures 1 and 2. The retention time and molecular weight of AFB1 were 6.09 min and m/z 313 ([M+1]), respectively. A series of degraded products with different retention times (RTs) and molecular weights are shown in Table 1. Some ion peaks as (stereo) isomers possessed the same molecular weights (such as m/z 345) but with different RTs.
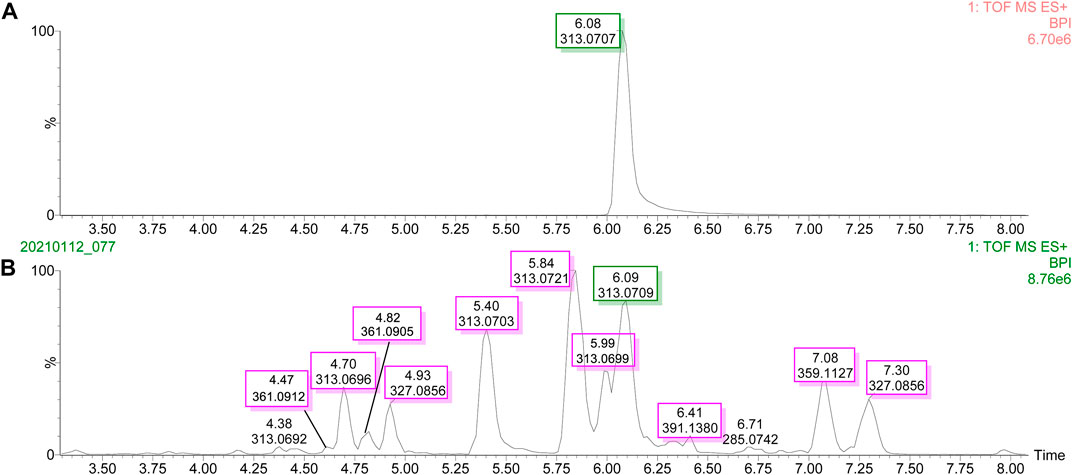
FIGURE 1. UPLC-Q-TOF-MS/MS profiles of the degradation products of aflatoxin B1 in methanol solvent. (A) Base peak intensity (BPI) of aflatoxin B1. (B) Base peak intensity (BPI) of degradation products of aflatoxin B1.
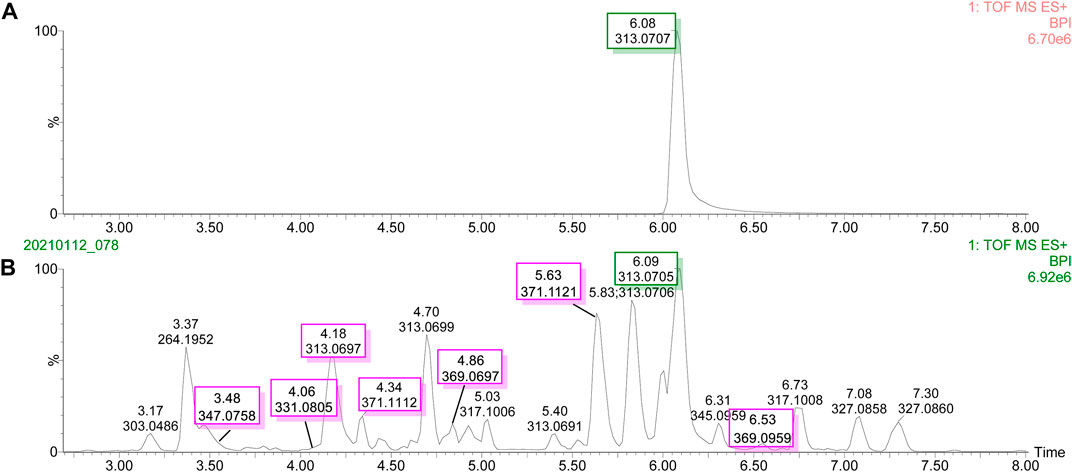
FIGURE 2. UPLC-Q-TOF-MS/MS profiles of the degradation products of aflatoxin B1 in acetone solvent. (A) Base peak intensity (BPI) of aflatoxin B1. (B) Base peak intensity (BPI) of degradation products of aflatoxin B1.

TABLE 1. HR-ESI and MS/MS data of seventeen degraded products and aflatoxin B1.
Structural Analysis of Degraded Products Based on Exact Molecular Weights and Fragment Ions
Different free radicals such as reactive hydroxyl (OH•), hydrated electrons (eaq−), hydrogen atoms (H•), and methoxy species (OCH3•) were produced when methanol–H2O and acetone–H2O solvents were irradiated under UV (White, 2001; Azrague et al., 2005). These free radicals could attack the AFB1 structure to form different degraded products. The double bond C8-C9 in AFB1 was broken easily by these free radicals via addition reactions. Ten and seven main degraded products in methanol–H2O and acetone–H2O solvents were characterized based on molecular weights and fragment ions of compounds (Supplementary Tables S1, S2). The other degraded product fragmentation rules are provided in supporting information, considering a similar fragmentation pathway with AFB1 (Figure 3 and Supplementary Figures S2–S9).
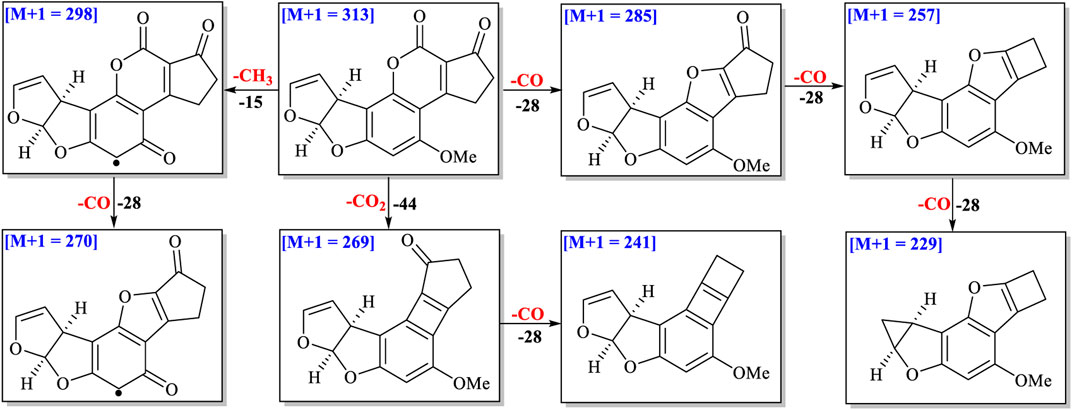
FIGURE 3. Fragmentation pathway of AFB1.
Four ions as (stereo) isomers (m/z 345, C18H16O7) appeared at tR = 4.70, 5.40, 5.84 and 5.99 min in methanol–H2O solvent with 32 Da (CH4O) more than that of AFB1 (Supplementary Figure S2). After a neutral loss of CH3OH from ion (m/z 345), the fragmentation pathways of these four ions were nearly the same as those of AFB1. It is suggested that these four degraded compounds might be addition products of CH3OH with AFB1 at C-8/C-9. The possible fragmentation pathways of these four (stereo) isomers are depicted in Supplementary Figure S2.
The molecular formula of the ion at m/z 361 ([M+1], tR = 4.47 and 4.82 min) was determined to be C18H16O8 based on HR-ESI-MS with 16 Da (O) more than that of degraded products (m/z 345) (Supplementary Figure S3), suggesting one more oxygen atom connected on C8 or C9. Both of them were suggested to be the addition products from free radical hydrogen atoms (OH•) and methoxy species (OCH3•) with C8/C9 or C9/C8 of AFB1 under UV irradiation. The possible fragmentation pathway of the ion (m/z 361) is shown in Supplementary Figure S3.
Three ions at m/z 359 ([M+1], tR = 4.94, 7.08 and 7.30 min) gave the molecular formula as C19H18O7 based on HR-ESI-MS. The neutral loss of -CO, -CH3OH, and -C2H2 was observed in the MS/MS profiles (Supplementary Figure S4). The possible structure and fragmentation pathway of these three ions is suggested in Supplementary Figure S4.
The molecular formula of the degraded product at m/z 391 ([M+1], tR = 6.41 min) was determined to be C20H22O8 based on HR-ESI-MS (Supplementary Figure S5). Sequential losses of two -CH3OH (391→359→327), one -CH2O (327→297), and one -CH2 (297→283) implied that four methoxyls might be present in degraded products. Two methoxyls might be connected on C-8/C-9 and the keto-carboxyl group might be transformed to another methoxyl through reduction and addition reactions, and the remaining -OMe was anchored on the aromatic ring. The possible fragmentation pathway of these three ions is suggested in Supplementary Figure S5.
The molecular formula of ions at m/z 331 ([M+1, C17H14O7] in acetone–H2O at 4.06 and 4.18 min) possessed 18 Da (H2O) more than that of AFB1, which indicated these two degraded products were (stereo) isomers (Supplementary Figure S6). The fragmentation pathways of these two ions were nearly the same as those of AFB1 after the loss of a molecule of H2O, which implied that two degraded products were the adducts of H2O with the double bond C-8/C-9. Though the molecular formulas and fragmentation pathways of these two degraded products were the same, the retention time and abundance of fragment ions were different. A higher abundance of ion at m/z 313 (tR = 4.18 min) was observed than the other (tR = 4.06 min). This suggested that the position of OH on the furan ring was different in two degraded products. The possible fragmentation pathway of two ions is suggested in Supplementary Figure S6.
The molecular formula of the ion at m/z 347 ([M+1], tR = 3.48 min) was determined to be C18H14O8 based on HR-ESI-MS with 16 Da (O) more than that of degraded products (m/z 331), indicating two hydroxyl groups connected on C8 and C9, respectively (Supplementary Figure S7). The possible fragmentation pathway is suggested in Supplementary Figure S7.
The molecular formula of the ion at m/z 371 ([M+1], tR = 4.34 and 5.63 min) was determined to be C20H18O7 based on HR-ESI-MS with 58 Da (CH3COCH3) more than that of AFB1 (m/z 313) (Supplementary Figure S8), which implied that one molecule of acetone attacked on C-8 or C-9 under UV irradiation. The possible fragmentation pathway of them is suggested in Supplementary Figure S8.
The molecular formulas of ions at m/z 401 ([M+1], tR = 4.86 and 6.54 min) were determined to be C21H20O8 based on HR-ESI-MS. The loss of 32 Da from m/z 401 to m/z 369 and the loss of 58 Da from m/z 401 to m/z 343 suggested that a methoxyl and acetone were connected on C-8/C-9 or C-9/C-8 (Supplementary Figure S9). The possible fragmentation pathway of these two ions is suggested in Supplementary Figure S9.
Though seventeen degraded products were characterized by molecular formula and fragment ions, the planar structures and configurations of some degraded products could not be determined only based on UPLC-Q-TOF-MS/MS analysis. Thus, further purification and NMR experiments are needed to elucidate their structures and stereochemistry.
Purification and Elucidation of Seven Degraded Products Structures
Seven main degraded products with limited amounts were purified by HPLC and then elucidated by NMR spectra (Figure 4). Compounds 1–3 were isolated as the photochemical adducts of 6-methoxydifurocoumarone, which were analyzed based on the 1H-NMR spectrum (Waiss and Wiley, 1969). In this study, the structures of these three degraded products were elucidated in detail by analyzing 1H, 13C, and 2D-NMR spectra (Figure 5). The 1H-NMR data of 1–3 and 13C-NMR data of 1 and 3 are shown in Table 2 and Table 3. The relative configurations of 1 and 3 were determined by NOESY correlations (Figure 5). Compound 4 was a new degraded product isolated from methanol solution. The molecular formula of 4 was determined to be C18H17O8 on the basis of HR-ESI-MS with 16 more daltons than that of 1, implying that an additional hydroxyl group was present in 4, which was supported by the NMR spectra (Table 2 and Table 3). The 1H–1H COSY and HMBC correlations confirmed that the additional hydroxyl group was connected on C-9 (Figure 5). The NOESY correlations determined the relative configuration of 8-OMe and 9-OH to be β and α configuration, respectively (Figure 5).
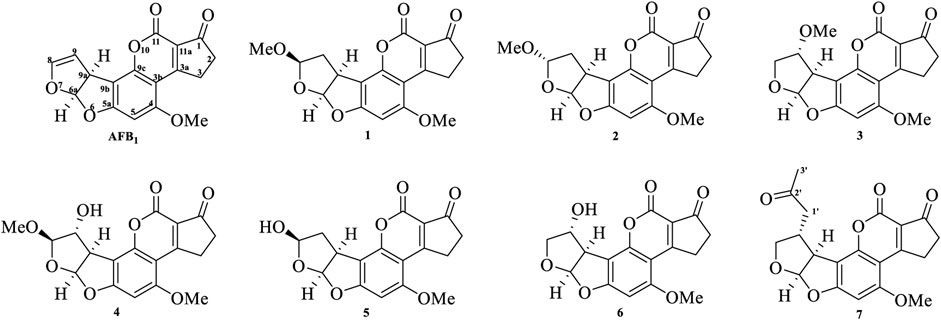
FIGURE 4. Structures of AFB1 and 1-7
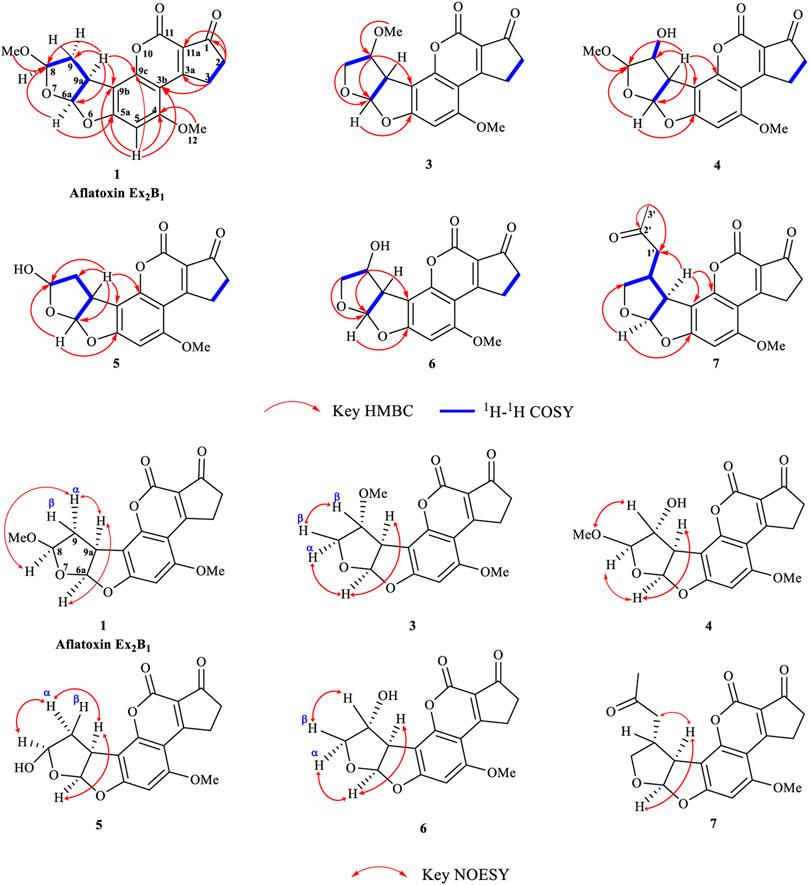
FIGURE 5. Key 2D-NMR and NOESY correlations of 1 and 3-7
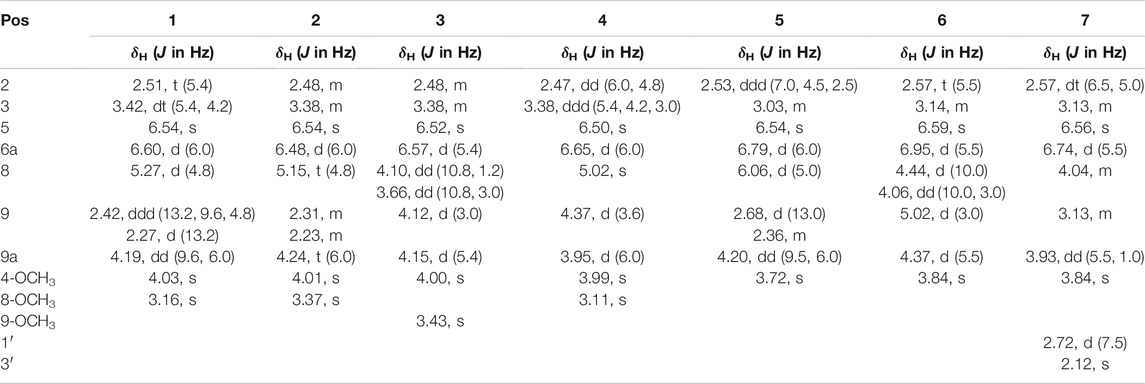
TABLE 2. 1H NMR data of compounds 1-4 in acetone-d6 at 600 MHz and 5-7 in pyridine-d5 at 500 MHz.
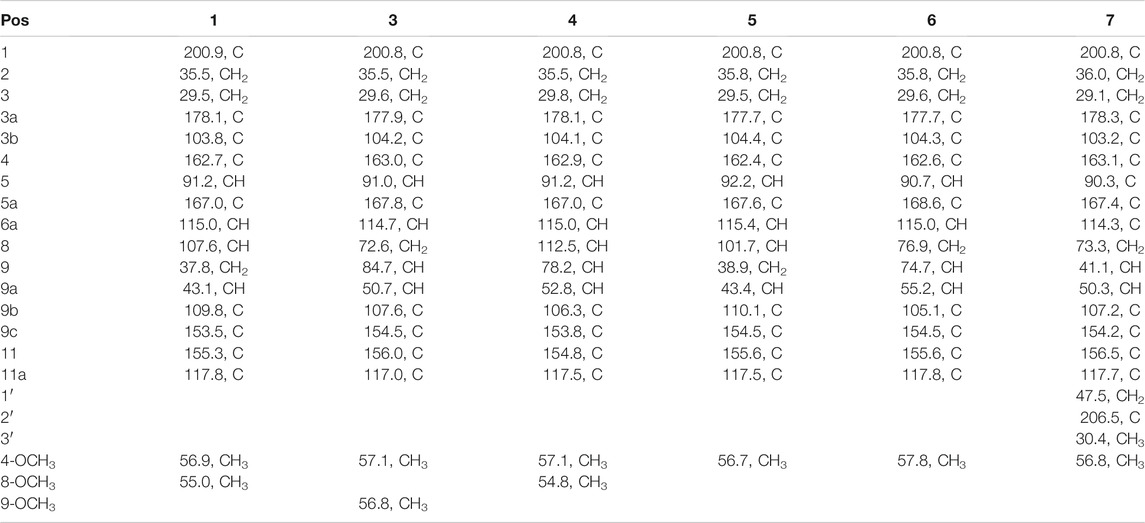
TABLE 3. 13C NMR data of compounds 1, 3, 4 in acetone-d6 and 5-7 in pyridine-d5 at 125 MHz.
Compounds 5 and 6 were obtained as an inseparable mixture through HPLC with various stationary and mobile phases, whereas well-resolved NMR spectra determined the structures of 5 and 6 as isomers. The 1H and 13C spectra data of 5 were reported, and 6 was a new degraded product reported for the first time (Cox and Cole, 1977; Liu, Jin, Tao, Shan, et al., 2010; Wang et al., 2011; Wang et al., 2012; Stanley et al., 2020). The molecular formula of 5 and 6 was determined to be C17H14O7 on the basis of HR-ESI-MS, with 18 more daltons than that of AFB1, implying that 5 and 6 might be transformed from AFB1 through an addition reaction with H2O on the double bond (C-8/C-9). The planar and relative configurations of 5 and 6 were established based on 2D-NMR data (Figure 5). Compound 7 was a new degraded product isolated from acetone solvent. The molecular formula of 7 was established to be C20H19O7 based on HR-ESI-MS. In the 1H NMR spectrum, an additional methyl (δH = 2.12 ppm) and an additional methylene unit (δH = 2.72 ppm) were observed compared with that of AFB1, which indicated that one molecule of acetone might be connected on C-8 or C-9. The 1H–1H COSY and HMBC correlations confirmed that the acetonyl group was connected with C-9 (Figure 5). The NOESY correlations from H-9a (δH = 3.93 ppm) to H-1' (δH = 2.72 ppm) determined the acetonyl group to be α-configuration (Figure 5). Considering that the stereochemistry of C-6a and C-9a were not changed in the photocatalytic reaction, the absolute configurations of (1–7) are shown in Figure 4.
Elucidation of the Photodegraded Mechanism of Degraded Products
According to the structural features of AFB1 and degraded products (1–7), the possible photocatalytic reactions were suggested: 1) addition reactions happened between MeOH, H2O, or acetone with AFB1 under UV irradiation to produce compounds such as 1–3 and 5–7; 2) compound 4 might be originated from the oxygen free radical attacking the double bond (C-8/C-9) to form an epoxide, which was further attacked by OMe• or OH• (Figure 6) (Waiss and Wiley, 1969; Iyer et al., 1994). The photocatalytic mechanism was suggested: MeOH, H2O, or CH3COCH3 formed potential free radicals (H•, OH•, OMe•, or CH3COCH2•) under UV irradiation. Then, H• attacked on the double bond (C-8 or C-9) leading to form carbon-free radicals, which was then coupled with OH•, OMe•, or CH3COCH2• to shape degraded products 1–3 and 5–7 (Waiss and Wiley, 1969; Iyer et al., 1994; Jamil et al., 2017; Mao et al., 2019). In addition, O2 in the air under UV irradiation could form O2•-, which could attack on the double bond C-8/C-9 to produce 8,9-epoxide-AFB1. Addition reactions then happened fast by the highly unstable intermediate 8,9-epoxide-AFB1 with OMe• to form the degraded products of 4 (Figure 6) (Waiss and Wiley, 1969; Iyer et al., 1994; Jamil et al., 2017).

FIGURE 6. Possibly photocatalytic mechanism of AFB1 in MeOH and acetone.
From the structural features of degraded products (1–7), an interesting phenomenon was also observed that the group of C-9 (in 3, 4, 6, and 7) was α-configuration, whereas the group of C-8 in 1 and 2 was α- or β-configuration. This demonstrated that steric hindrance (from right part of AFB1 structure) might exist and prevent different groups (OH•, OMe•, or CH3COCH2•) attacking C-9 from the positive face (β-position), whereas C-8 could be attacked from two sides (α- or β-configuration) without steric hindrance. The crystal structure of AFB1 (Cheung and Sim, 1964; van Soest and Peerdeman, 1970) revealed that the right part of the AFB1 structure was indeed closer to C-9 than C-8 in space, which might preclude different groups to attack C-9 from the positive face (β-position) due to spatial hindrance. The photocatalytic reactions are depicted in Figure 7.
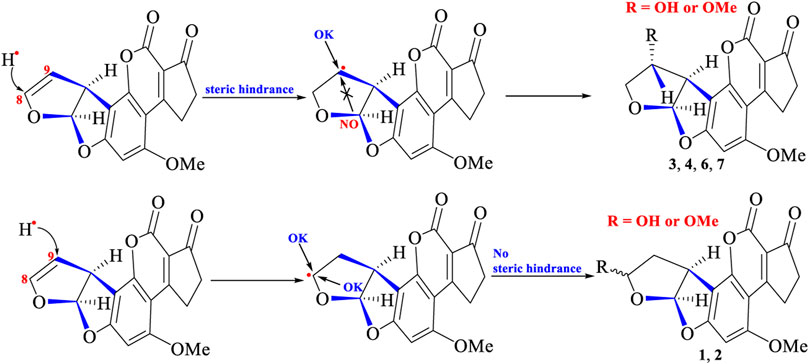
FIGURE 7. Possible catalytic reaction happened at C-8 and C-9
Toxic Evaluation of Degraded Products
The cytotoxicity of AFB1 and seven degraded products (1–7) was evaluated against human normal hepatocytes LO-2 and cancer cell lines Hep-G2 and MCF-7 using the MTS method, with cis-platinum as the positive control; the results are shown in Table 4. AFB1 displayed stronger cytotoxicity to three cell lines than the degraded products, further supporting that the double bond (C-8/C-9) in the furan ring was the key toxic group, and the toxicity was markedly reduced after the double bond was broken.
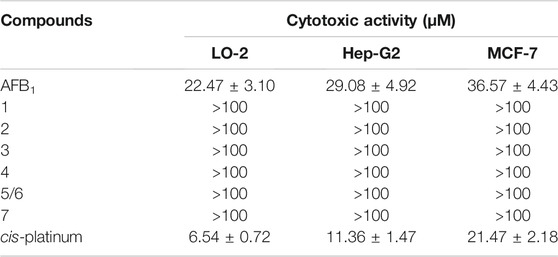
TABLE 4. Cytotoxic activity of seven degraded products and aflatoxin B1.
Conclusion
In this work, the degraded products of AFB1 under UV irradiation were analyzed through UPLC-Q-TOF-MS/MS, and seventeen degraded products were characterized. Seven degraded products were purified and elucidated by NMR experiments. The double bond (C-8/C-9) of all degraded products was broken, which was coupled with different groups such as OH•, H•, and OCH3• through addition reactions under UV irradiation. The cytotoxic evaluation revealed that the toxicity of AFB1-degraded products was markedly reduced after their double bond in the furan ring was cleaved. The results demonstrated that the UPLC-Q-TOF-MS/MS technique coupled with purification NMR analysis and biological tests was an applicably integrated approach for the analysis, characterization, and toxic evaluation of degraded products of AFB1, which can also be used to evaluate other mycotoxin degradation processes.
Data Availability Statement
The datasets presented in this study can be found in online repositories. The names of the repository/repositories and accession number(s) can be found in the article/Supplementary Material.
Author Contributions
Methodology, Y-DW and C-GS; formal analysis, GD; resources, JY; bioassay, TZ and Y-YZ; writing—original draft preparation, GD; and writing—review and editing, J-CQ and L-PG.
Funding
This work was supported by the Key Project at Central Government Level: The Ability Establishment of Sustainable Use for Valuable Chinese Medicine Resources (2060302), the National Natural Science Foundation of China (No. 81891014), the National Key R&D Program of China (No. 2017YFC1700701), and the Fundamental Research Funds for the Central public welfare research institutes (No. ZZXT201906).
Conflict of Interest
The authors declare that the research was conducted in the absence of any commercial or financial relationships that could be construed as a potential conflict of interest.
Publisher’s Note
All claims expressed in this article are solely those of the authors and do not necessarily represent those of their affiliated organizations, or those of the publisher, the editors, and the reviewers. Any product that may be evaluated in this article, or claim that may be made by its manufacturer, is not guaranteed or endorsed by the publisher.
Supplementary Material
The Supplementary Material for this article can be found online at: https://www.frontiersin.org/articles/10.3389/fchem.2021.789249/full#supplementary-material
References
Ahmed, M. Y., Salah, M. M., Kassim, S. K., Abdelaal, A., Elayat, W. M., Mohamed, D. A.-W., et al. (2019). Evaluation of the Diagnostic and Therapeutic Roles of Non-Coding RNA and Cell Proliferation Related Gene Association in Hepatocellular Carcinoma. Gene. 706, 97–105. doi:10.1016/j.gene.2019.04.054
Alberts, J. F., Gelderblom, W. C. A., Botha, A., and van Zyl, W. H. (2009). Degradation of Aflatoxin B1 by Fungal Laccase Enzymes. Int. J. Food Microbiol. 135, 47–52. doi:10.1016/j.ijfoodmicro.2009.07.022
Azrague, K., Bonnefille, E., Pradines, V., Pimienta, V., Oliveros, E., Maurette, M. T., et al. (2005). Hydrogen Peroxide Evolution during V-UV Photolysis of Water. Photochem. Photobiol. Sci. 4, 406–408. doi:10.1039/b500162e
Calado, T., Venâncio, A., and Abrunhosa, L. (2014). Irradiation for Mold and Mycotoxin Control: A Review. Compr. Rev. Food Sci. Food Saf. 13, 1049–1061. doi:10.1111/1541-4337.12095
Cancer, I. (1993). Some Naturally Occurring Substances: Food Items and Constituents, Heterocyclic Aromatic Amines and Mycotoxins. Carcinogenesis. 56, 245–395.
Cheung, K. K., and Sim, G. A. (1964). Aflatoxin G1: Direct Determination of the Structure by the Method of Isomorphous Replacement. Nature. 201, 1185–1188. doi:10.1038/2011185a0
Colin Garner, R., Miller, E. C., Miller, J. A., Garner, J. V., and Hanson, R. S. (1971). Formation of a Factor Lethal for S. Typhimurium TA1530 and TA1531 on Incubation of Aflatoxin B1 With Rat Liver Microsomes. Biochem. Biophysical Res. Commun. 45, 774–780. doi:10.1016/0006-291x(71)90484-0
Cox, R. H., and Cole, R. J. (1977). Carbon-13 Nuclear Magnetic Resonance Studies of Fungal Metabolites, Aflatoxins, and Sterigmatocystins. J. Org. Chem. 42, 112–114. doi:10.1021/jo00421a022
Croy, R. G., Essigmann, J. M., Reinhold, V. N., and Wogan, G. N. (1978). Identification of the Principal Aflatoxin B1-DNA Adduct Formed In Vivo in Rat Liver. Proc. Natl. Acad. Sci. 75, 1745–1749. doi:10.1073/pnas.75.4.1745
Essigmann, J. M., Croy, R. G., Nadzan, A. M., Busby, W. F., Reinhold, V. N., Buchi, G., et al. (1977). Structural Identification of the Major DNA Adduct Formed by Aflatoxin B1In Vitro. Proc. Natl. Acad. Sci. 74, 1870–1874. doi:10.1073/pnas.74.5.1870
Iyer, R. S., Coles, B. F., Raney, K. D., Thier, R., Guengerich, F. P., and Harris, T. M. (1994). DNA Adduction by the Potent Carcinogen Aflatoxin B1: Mechanistic Studies. J. Am. Chem. Soc. 116, 1603–1609. doi:10.1021/ja00084a001
Jamil, T. S., Abbas, H. A., Nasr, R. A., El-Kady, A. A., and Ibrahim, M. I. M. (2017). Detoxification of Aflatoxin B1 Using Nano-Sized Sc-Doped SrTi0.7 Fe0.3 O3 Under Visible Light. J. Photochem. Photobiol. A: Chem. 341, 127–135. doi:10.1016/j.jphotochem.2017.03.023
Kumar, P., Mahato, D. K., Kamle, M., Mohanta, T. K., and Kang, S. G. (2017). Aflatoxins: a Global Concern for Food Safety, Human Health and Their Management. Front. Microbiol. 07, 2170. doi:10.3389/fmicb.2016.02170
Li, Y. Y., Tan, X. M., Wang, Y. D., Yang, J., Zhang, Y. G., Sun, B. D., et al. (2020). Bioactive Seco-Sativene Sesquiterpenoids from an Artemisia Desertorum Endophytic Fungus, Cochliobolus Sativus. J. Nat. Prod. 83, 1488–1494. doi:10.1021/acs.jnatprod.9b01148
Lin, J. K., Miller, J. A., and Miller, E. C. (1977). 2,3-Dihydro-2-(guan-7-yl)-3-hydroxy-aflatoxin B1, a Major Acid Hydrolysis Product of Aflatoxin B1-DNA or -ribosomal RNA Adducts Formed in Hepatic Microsome-Mediated Reactions and in Rat Liver In Vivo. Cancer Res. 37, 4430–4438.
Liu, R., Jin, Q., Huang, J., Liu, Y., Wang, X., Mao, W., et al. (2011). Photodegradation of Aflatoxin B1 in Peanut Oil. Eur. Food Res. Technol. 232, 843–849. doi:10.1007/s00217-011-1452-6
Liu, R., Jin, Q., Tao, G., Shan, L., Huang, J., Liu, Y., et al. (2010). Photodegradation Kinetics and Byproducts Identification of the Aflatoxin B1 in Aqueous Medium by Ultra-Performance Liquid Chromatography-Quadrupole Time-Of-Flight Mass Spectrometry. J. Mass. Spectrom. 45, 553–559. doi:10.1002/jms.1741
Liu, R., Jin, Q., Tao, G., Shan, L., Liu, Y., and Wang, X. (2010). LC-MS and UPLC-Quadrupole Time-Of-Flight MS for Identification of Photodegradation Products of Aflatoxin B1. Chroma. 71, 107–112. doi:10.1365/s10337-009-1354-y
Luo, X., Wang, R., Wang, L., Li, Y., Zheng, R., Sun, X., et al. (2014). Analyses by UPLC Q-TOF MS of Products of Aflatoxin B1after Ozone Treatment. Food Additives & Contaminants: A. 31, 105–110. doi:10.1080/19440049.2013.853323
Mao, J., He, B., Zhang, L., Li, P., Zhang, Q., Ding, X., et al. (2016). A Structure Identification and Toxicity Assessment of the Degradation Products of Aflatoxin B1 in Peanut Oil under UV Irradiation. Toxins. 8, 332. doi:10.3390/toxins8110332
Mao, J., Li, P., Wang, J., Wang, H., Zhang, Q., Zhang, L., et al. (2019). Insights into Photocatalytic Inactivation Mechanism of the Hypertoxic Site in Aflatoxin B1 over Clew-Like WO3 Decorated with CdS Nanoparticles. Appl. Catal. B: Environ. 248, 477–486. doi:10.1016/j.apcatb.2019.01.057
Massey, T. E., Stewart, R. K., Daniels, J. M., and Liu, L. (1995). Biochemical and Molecular Aspects of Mammalian Susceptibility to Aflatoxin B1 Carcinogenicity. Exp. Biol. Med. 208, 213–227. doi:10.3181/00379727-208-43852a
Méndez-Albores, A., Veles-Medina, J., Urbina-Álvarez, E., Martínez-Bustos, F., and Moreno-Martínez, E. (2009). Effect of Citric Acid on Aflatoxin Degradation and on Functional and Textural Properties of Extruded Sorghum. Anim. Feed Sci. Techn. 150, 316–329. doi:10.1016/j.anifeedsci.2008.10.007
Peng, Z., Chen, L., Zhu, Y., Huang, Y., Hu, X., Wu, Q., et al. (2018). Current Major Degradation Methods for Aflatoxins: a Review. Trends Food Sci. Techn. 80, 155–166. doi:10.1016/j.tifs.2018.08.009
Rustom, I. Y. S. (1997). Aflatoxin in Food and Feed: Occurrence, Legislation and Inactivation by Physical Methods. Food Chem. 59, 57–67. doi:10.1016/s0308-8146(96)00096-9
Song, B., Li, L.-Y., Shang, H., Liu, Y., Yu, M., Ding, G., et al. (2019). Trematosphones A and B, Two Unique Dimeric Structures from the Desert Plant Endophytic Fungus Trematosphaeria Terricola. Org. Lett. 21, 2139–2142. doi:10.1021/acs.orglett.9b00454
Stanley, J., Patras, A., Pendyala, B., Vergne, M. J., and Bansode, R. R. (2020). Performance of a UV-A LED System for Degradation of Aflatoxins B1 and M1 in Pure Water: Kinetics and Cytotoxicity Study. Sci. Rep. 10, 13473. doi:10.1038/s41598-020-70370-x
van Soest, T. C., and Peerdeman, A. F. (1970). The crystal Structures of Aflatoxin B1. II. The Structure of an Orthorhombic and a Monoclinic Modification. Acta Crystallogr. Sect B. 26, 1947–1955. doi:10.1107/s056774087000523x
Waiss, A. C., and Wiley, M. (1969). Anomalous Photochemical Addition of Methanol to 6-Methoxydifurocoumarone. J. Chem. Soc. D. 10, 512–513. doi:10.1039/c29690000512
Wang, F., Xie, F., Xue, X., Wang, Z., Fan, B., and Ha, Y. (2011). Structure Elucidation and Toxicity Analyses of the Radiolytic Products of Aflatoxin B1 in Methanol-Water Solution. J. Hazard. Mater. 192, 1192–1202. doi:10.1016/j.jhazmat.2011.06.027
Wang, H., Lu, Z., Qu, H.-J., Liu, P., Miao, C., Zhu, T., et al. (2012). Antimicrobial Aflatoxins from the marine-derived Fungus Aspergillus flavus 092008. Arch. Pharm. Res. 35, 1387–1392. doi:10.1007/s12272-012-0808-1
Wang, M.-H., Hu, Y.-C., Sun, B.-D., Yu, M., Niu, S.-B., Guo, Z., et al. (2018). Highly Photosensitive Poly-Sulfur-Bridged Chetomin Analogues from Chaetomium Cochliodes. Org. Lett. 20, 1806–1809. doi:10.1021/acs.orglett.8b00304
Wang, M.-H., Zhang, X.-Y., Tan, X.-M., Niu, S.-B., Sun, B.-D., Yu, M., et al. (2020). Chetocochliodins A-I, Epipoly(Thiodioxopiperazines) from Chaetomium Cochliodes. J. Nat. Prod. 83, 805–813. doi:10.1021/acs.jnatprod.9b00239
Keywords: aflatoxin B1, UPLC-Q-TOF-MS/MS, degraded products, purification, NMR
Citation: Wang Y-D, Song C-G, Yang J, Zhou T, Zhao Y-Y, Qin J-C, Guo L-P and Ding G (2021) Accurate Identification of Degraded Products of Aflatoxin B1 Under UV Irradiation Based on UPLC-Q-TOF-MS/MS and NMR Analysis. Front. Chem. 9:789249. doi: 10.3389/fchem.2021.789249
Received: 04 October 2021; Accepted: 25 October 2021;
Published: 24 November 2021.
Edited by:
Wei-Lung Tseng, National Sun Yat-sen University, TaiwanReviewed by:
Santhana Krishna Kumar, AGH University of Science and Technology, PolandChi-Yu Lu, Kaohsiung Medical University, Taiwan
Copyright © 2021 Wang, Song, Yang, Zhou, Zhao, Qin, Guo and Ding. This is an open-access article distributed under the terms of the Creative Commons Attribution License (CC BY). The use, distribution or reproduction in other forums is permitted, provided the original author(s) and the copyright owner(s) are credited and that the original publication in this journal is cited, in accordance with accepted academic practice. No use, distribution or reproduction is permitted which does not comply with these terms.
*Correspondence: Gang Ding, Z2RpbmdAaW1wbGFkLmFjLmNu; Lan-Ping Guo, Z2xwMDFAMTI2LmNvbQ==; Jian-Chun Qin, cWluamNAamx1LmVkdS5jbg==
†These authors have contributed equally to this work and share the first authorship