 Wenjia Wang1,2Xiaoxing Wang1*Guanghui Zhang2Ke Wang3Fu Zhang3Tianyu Yan4Jeffrey T. Miller5Xinwen Guo2Chunshan Song1,2,4,6*
- 1Clean Fuels and Catalysis Program and PSU-DUT Joint Center for Energy Research, EMS Energy Institute, and John and Willie Leone Family Department of Energy and Mineral Engineering, The Pennsylvania State University, University Park, PA, United States
- 2PSU-DUT Joint Center for Energy Research, State Key Laboratory of Fine Chemicals, School of Chemical Engineering, Dalian University of Technology, Dalian, China
- 3Department of Materials Science and Engineering, and Center for 2‐Dimensional and Layered Materials, The Pennsylvania State University, University Park, PA, United States
- 4Department of Chemical Engineering, The Pennsylvania State University, University Park, PA,United States
- 5Davidson School of Chemical Engineering, Purdue University, West Lafayette, IN, United States
- 6Department of Chemistry, Faculty of Science, The Chinese University of Hong Kong,Hong Kong,China
Previously, we reported a strong Fe-Cu synergy in CO2 hydrogenation to olefin-rich C2+ hydrocarbons over the γ-Al2O3 supported bimetallic Fe-Cu catalysts. In this work, we aimed to clarify such a synergy by investigating the catalyst structure, Fe-Cu interaction, and catalyst surface properties through a series of characterizations. H2-TPR results showed that the addition of Cu made both Fe and Cu easier to reduce via the strong interaction between Fe and Cu. It was further confirmed by X-ray absorption spectroscopy (XAS) and TEM, which showed the presence of metallic Fe and Fe-Cu alloy phases in the reduced Fe-Cu(0.17) catalyst induced by Cu addition. By correlating TPD results with the reaction performance, we found that the addition of Cu enhanced both the moderately and strongly adsorbed H2 and CO2 species, consequently enhanced CO2 conversion and C2+ selectivity. Adding K increased the adsorbed-CO2/adsorbed-H2 ratio by greatly enhancing the moderately and strongly adsorbed CO2 and slightly suppressing the moderately and strongly adsorbed H2, resulting in a significantly increased O/P ratio in the produced hydrocarbons. The product distribution analysis and in situ DRIFTS suggested that CO2 hydrogenation over the Fe-Cu catalyst involved both an indirect route with CO as the primary product and a direct route to higher hydrocarbons.
Introduction
Waste CO2 can be utilized as a carbon source to synthesize valuable chemicals and transportation fuels. Recently, using renewable energy to conduct catalytic CO2 conversion is attracting increased attention, as it has the potential on mitigating both CO2 emissions and the fossil fuel dependence (Song, 2006; Wang et al., 2011; Hu et al., 2013a; Meylan et al., 2015). CO2 is a highly thermodynamically stable molecule (ΔG° = −394 kJ/mol). Thus, a high energy input is normally required for CO2 conversion, especially when CO2 is the solo reactant. However, such an energy demand could be much reduced and CO2 conversion would become thermodynamically easier when one or more molecules with high Gibbs free energy such as hydrogen (ΔG° = 0 kJ/mol) could co-react with CO2 (Song, 2006). The synthesis of oxygenates (Jiang et al., 2015; Sun et al., 2015; Prašnikar et al., 2019; Prašnikar et al., 2021) [such as methanol over Cu-based catalysts (Huš et al., 2017; Prašnikar et al., 2019; Prašnikar et al., 2021)] and hydrocarbons (Willauer et al., 2013; Satthawong et al., 2015; Zhang et al., 2015) from CO2 and H2, where CO2 is captured from flue gas and H2 is produced using renewable energy sources (e.g., such as solar or wind) (Pontzen et al., 2011), is one promising approach for sustainable production of chemicals and fuels. Among them, C2-C4 light olefins are primary building blocks for various chemicals and polymers. Therefore, developing effective catalysts for selective conversion of CO2 to light olefins is highly desired (Riedel et al., 1999; Song, 2002; Song, 2006; Centi and Perathoner, 2009; Wang et al., 2011).
Fe catalysts have shown activities for both the reverse water-gas shift (RWGS) reaction and Fisher–Tropsch synthesis (FTS) reaction, hence have also been studied for CO2 hydrogenation to synthesize hydrocarbons. However, monometallic Fe catalysts often exhibit low CO2 conversion and primarily produce methane (Wang et al., 2018). To improve CO2 conversion and C2+ selectivity, different promoters have been evaluated (Nam et al., 1997; Yan et al., 2000; Riedel et al., 2001; Ngantsoue-Hoc et al., 2002; Lögdberg et al., 2009; Dorner et al., 2011; Satthawong et al., 2013a; Hu et al., 2013b; Satthawong et al., 2013b; Rodemerck et al., 2013; Fischer et al., 2015; Amoyal et al., 2017; Liu et al., 2018; Wei et al., 2018). For example, the use of CeO2 increases both CO2 conversion and olefin formation (Dorner et al., 2011). Adding V, Cr, Mn, and Zn can also increase CO2 conversion by promoting generation of the iron carbide phase (Nam et al., 1997). Furthermore, the addition of alkali metals enhances catalytic activity as those substances can increase CO2 uptake and facilitate Fe carburization (Riedel et al., 2001; Ngantsoue-Hoc et al., 2002; Fischer et al., 2015; Visconti et al., 2017). However, more studies are still needed to well understand the mechanistic roles of these promoters.
Whether hydrocarbons from CO2 hydrogenation are through a direct or indirect mechanism is under debate. Many believe in the indirect mechanism because CO2 hydrogenation is considered as a modified version of FTS, where CO2 is converted to hydrocarbons through a process involving two steps: CO2 is first reduced to CO (which is the so-called RWGS reaction) and the formed CO is then converted to hydrocarbons through FTS (Lee et al., 2009; Saeidi et al., 2014). It is also suggested by some literature that CO2 is directly hydrogenated to methane, which contributes to the majority of hydrocarbons formation (Fujita et al., 1987; Schild et al., 1991; Wei and Jinlong, 2010).
In our previous work, we discovered a strong bimetallic Fe-Cu synergy in CO2 conversion and C2+ hydrocarbons formation when Cu was added to Fe at a certain composition. Adding Cu to Fe enhanced the formation of CO and C2+ hydrocarbons and suppressed CH4 formation. The production of C2-C4 olefin-rich hydrocarbons was promoted dramatically when K was incorporated into the Fe-Cu bimetallic catalysts, in which, the C2-C4 olefin to paraffin ratio reached as much as 5.2 (Wang et al., 2018). The DFT simulation suggested that the addition of Cu dramatically shifted the reaction pathway. On mono-metallic Cu and Fe catalysts, the main pathway included the formation of CO and subsequent CO hydrogenation to CH* species (Riedel et al., 2001; Satthawong et al., 2015). In contrast, over the Fe-Cu bimetallic catalysts, a new and completely different reaction pathway was favored, which did not go through CO as the intermediate (Nie et al., 2016; Nie et al., 2017). As a result, more C2+ hydrocarbons were produced, exhibiting a strong Fe-Cu synergetic effect.
To better understand such Fe-Cu synergetic effects observed in our previous work, in this study, we performed a detailed catalyst characterization and investigated the relationship between the physical structure and catalytic performance of Fe-Cu catalysts in CO2 hydrogenation to C2+ hydrocarbons. A series of fresh, reduced, and spent Fe-Cu catalysts with different Cu/Fe atomic ratios were investigated by various characterization techniques including H2 temperature-programmed reduction (H2-TPR), transmission electron microscopy (TEM), scanning transmission electron microscopy/energy dispersive X-ray spectroscopy (STEM/EDS), Fe K-edge X-ray absorption spectroscopy (XAS), in situ diffuse reflectance infrared Fourier transform spectroscopy (DRIFTS), and temperature-programmed desorption of hydrogen and carbon dioxide (H2-TPD and CO2-TPD). In combination with the catalytic reaction data, we systematically examined the mechanistic roles of Fe-Cu bimetallic composition and K promoter, and their influences on CO2 conversion and the formation of olefin-rich C2+ hydrocarbons.
Experiment
Catalyst Preparation
A pore-filling incipient wetness impregnation (IWI) method was used to prepare Fe, Cu monometallic, and Fe-Cu bimetallic catalysts by adding an aqueous solution of Fe(NO3)3·9H2O (Aldrich, 99.99%) and Cu(NO3)2·2.5H2O (Alfa Aesar ≥98%) onto the γ-alumina (Sasol PURALOX TH 100/150) support. The total metal loading (Fe + Cu) was kept at 15 wt% (based on the support weight). To obtain the desired Cu/(Fe + Cu) atomic ratios, the Fe and Cu concentrations were adjusted. After impregnation, the catalysts were dried at 383 K for 3 h and then calcined in an electric furnace at 673 K for 2 h. The detailed procedure was reported elsewhere (Wang et al., 2018). The K-promoted catalysts were prepared by using a sequential impregnation in two steps. First, K was impregnated onto the alumina support using K2CO3 aqueous solution, which was dried at 383 K overnight. Then Fe and Cu were co-impregnated on the K-loaded alumina support using the mixed Fe and Cu aqueous solution, followed by drying and calcination under the same conditions. The Cu/(Fe + Cu) atomic ratios varied in the range of 0.0–1.0. The catalysts are termed as Fe-Cu(X)/K(Y)/Al2O3, where X and Y represent the Cu/(Fe + Cu) and K/Fe atomic ratios, respectively.
Activity Test
CO2 hydrogenation was carried out in a high-temperature and high-pressure fixed-bed flow reactor system. Typically, about 0.2 g of catalyst mixed with amorphous SiO2 (75–250 μm particle size, about 0.5 g) was loaded into a stainless-steel tube, which had an internal diameter of 6 mm (The catalyst bed volume was about 1.2 cm3). The catalyst was pretreated at 673 K with H2 (50 ml min-1) for 2 h. After cooling down to 573 K, the feed gas, CO2/H2/Ar (24/72/4, vol%, 99.995%) was then introduced and the system pressure was increased to 1.1 MPa (GHSV = 3600 ml g-cat-1 h-1). The reactor system was maintained at 573 K for the catalytic reaction. The gas flow rate and reactor pressure were regulated with mass flow controllers and a backpressure regulator, respectively. An Agilent 3000 Micro-GC with TCD was used for the online analysis of gas products including Ar, CO, CH4, and CO2 while the gas-phase hydrocarbon products were analyzed online with SRI 8610C GC-FID.
Catalyst Passivation
After CO2 hydrogenation at 573 K and 1.1 MPa for 20 h, the catalyst was cooled down to 298 K under the feed gas and subsequently passivated with 1 vol% O2/He (purity >99.999%) at a flow rate of 30 ml min-1. The area of O2 peak in the effluent measured by the Agilent Micro-GC-TCD was used as an indicator for the catalyst passivation. When the O2 peak area became constant, the catalyst passivation was complete. Then the catalyst was collected for characterization, which hereafter is denoted as spent catalyst. Freshly reduced catalysts after the typical H2-pretreatment procedure were also preserved through the same passivating procedure, which are denoted as reduced catalysts.
Catalyst Characterization
Hydrogen Temperature-Programmed Reduction
Hydrogen temperature-programmed reduction (H2-TPR) was carried out at ambient pressure using a Micromeritics AutoChem 2910 instrument. About 100 mg of catalyst was loaded in a U-shaped quartz tube reactor (held by quartz wool). To remove the adsorbed species on the surface, the catalyst was pretreated at 393 K (10 K min-1) under Ar (purity >99.999%, 25 ml min-1) for 1 h prior to reduction. After being cooled down to 323 K, the carrier gas was subsequently switched to 10 vol% H2/Ar at 20 ml min-1 and sustained throughout the analysis. After a stable baseline was established, the temperature program was started by increasing the temperature to 1173 K at a ramp of 10 K min-1 and then maintained at 1173 K for 30 min. For the quantitative analysis of the H2 consumption, the TCD signal was calibrated with the standard Ag2O powder (100%).
Fe K-Edge X-Ray Absorption Spectroscopy
Fe K-edge X-ray absorption spectroscopy (XAS) was performed at the insertion-device beamline of the Materials Research Collaborative Access Team (MRCAT) at the Advanced Photon Source (APS), Argonne National Laboratory. In brief, the X-ray passed through a cryogenically cooled double-crystal Si (111) monochromator in conjunction with an uncoated glass mirror to minimize the presence of higher harmonics, and focused onto the sample. The XAS data were collected in a transmission mode using I0 and I ionization chambers filled with N2/He and 20% Ar/N2, respectively.
In situ measurements were conducted using a continuous-flow XAS reactor cell (18 in. long, 0.75 in. diam.). Calcined Fe/Al2O3 and Fe-Cu/Al2O3 catalyst samples were pressed into a cylindrical holder with a thickness chosen to give a total absorbance (μt) at the Fe K-edge of about 2.0 and an edge step (Δμt) of ca. 0.5, and then reduced in a stream of H2 at 673 K for 30 min followed by CO2/H2 at 573 K for 30 min. After treatment, X-ray absorption spectra at Fe K-edge were obtained at ambient temperature. The spectrum of the Fe foil was acquired simultaneously with those of Fe-based catalysts for energy calibration. The obtained Fe K-edge XAS was analyzed in a conventional manner including background subtraction and normalization followed by Fourier filtering. The X-ray absorption near-edge structure (XANES) and extended X-ray absorption fine structure (EXAFS) data were recorded near the K-edge of Fe and treated using the Athena software package.
High Resolution Transmission Electron Microscopy
The reduced Fe-Cu catalysts were analyzed by the transmission electron microscopy (TEM, Talos, 80 kV, FEI Company). Reduced samples were first collected after the passivation and then ultrasonically dispersed in ethanol. A few droplets of ethanol suspension were dripped onto a carbon-coated copper grid followed by drying at ambient temperature. Typically, about 30 micrograms were taken for each sample. Alloys of Fe-Cu particle size histograms were generated by counting at least 200 particles.
The morphological properties and elemental distribution of the reduced Fe-Cu catalysts were examined by the scanning transmission electron microscope in conjunction with the energy-dispersive X-ray spectroscopy (STEM/EDS) using the FEI Titan 60–300 microscope equipped with a spherical aberration corrector on the probe-forming lens at an accelerating voltage of 300 kV with a monochromatic beam and spherical aberration correction, providing sub-angstrom imaging resolution. EDS maps were acquired using a high-angle annular dark-field (HAADF) detector. A collection angle of 51–300 mrad was used for the HAADF–STEM imaging. A camera length of 115 mm, beam current of 45 pA, and beam convergence of 30 mrad were used for STEM image acquisition. The sample preparation procedure was the same as that for the TEM analysis. Noteworthy, an Au-coated molybdenum grid, with Mo washer and clip was applied instead of the traditional copper grid to avoid the interference of Cu signal from the copper grid in both mapping and quantifying.
In situ Diffuse Reflectance Infrared Fourier Transform Spectroscopy
The possible adsorbed surface species during CO2 hydrogenation over the mono- and bi-metallic Fe-Cu catalysts were investigated by in situ DRIFTS over a Nicolet Nexus 470 spectrometer equipped with a smart collector environmental chamber. About 20 mg of sample was mounted on the chamber for each measurement. The sample was initially purged by N2 (50 ml min-1) at 373 K for 1 h, followed by the reduction in a UHP H2 flow (50 ml min-1) at 523 K (ramping rate, 10 K min-1) for 1 h. The sample was purged again by N2 at this temperature for 30 min. An interferogram was then collected at this condition and used as the background. After that, the CO2/H2/Ar (24/72/4, vol%) mixture gas was introduced at a flow rate of 50 ml min-1 to initiate the reaction. The IR spectra were then recorded at the reaction time of 10, 20, and 30 min, respectively. The spectra were acquired by 128 scans at a resolution of 4 cm-1. OMNIC ver. 7 software was used for data collection and processing.
It should be pointed out that our target is to differentiate the formed and adsorbed species over the catalyst surface during the reaction through this series of experiments, rather than the change of the catalyst in the conditions of H2/N2 purge. Thus, the interferogram of the catalyst sample itself was used as the background instead of KBr.
Temperature-Programmed Desorption
Micromeritics AutoChem 2910 was used to perform the temperature-programmed desorption (TPD) experiments at ambient pressure. For H2-TPD, typically, about 150 mg of the calcined catalyst was placed in a U-shaped quartz tube reactor and reduced at 673 K (5 K min-1) under a 50 ml min-1 H2 flow (purity >99.999%) for 2 h. The reactor was then cooled down to 200 K under H2 flow using an isopropanol-liquid-N2 mixture to prevent desorption of weakly adsorbed hydrogen. To remove H2 gas remained within the reactor and the gas line, the system was then purged with 0.95 vol% Ar/He flow (purity >99.999%, 30 ml min-1) to remove residual gaseous H2. When the H2 pressure (observed from an on-line mass spectrometer) became constant, the H2-TPD experiment was performed by raising the reactor temperature from ∼280 to 1173 K at a ramp of 10 K min-1 under 0.95 vol% Ar/He (purity >99.999%) flow (30 ml min-1). Here, Ar was used as an internal standard for the quantitative analysis of the effluent gas detected by an on-line mass spectroscopy (AMETEK Dycor Dymaxion Mass Spectrometer DM200M).
In CO2-TPD, after the catalyst was reduced at 673 K, the temperature was reduced to 573 K under H2 flow, and then the catalyst was purged with 0.95 vol% Ar/He (purity >99.999%, 30 ml min-1) for 30 min. CO2 adsorption was then performed at 573 K by introducing 12 vol% CO2/He mixture gas at a flow rate of 30 ml min-1 for 1 h, followed by cooling down to room temperature. The catalyst was purged with 0.95 vol% Ar/He (purity >99.999%, 30 ml min-1) again to remove any trace of gaseous CO2 until CO2 pressure became constant as indicated by the mass spectrometer. The CO2-TPD experiment was carried out using the same procedure as that for H2-TPD.
Results and Discussions
Reducibility of Supported Fe-Cu Catalysts
The H2-TPR profiles of the calcined Fe-Cu/Al2O3 catalysts with different Cu/(Fe + Cu) atomic ratios are shown in Figure 1. A major reduction peak was observed at 604 K for the calcined Fe/Al2O3 catalyst along with two smaller peaks at 735 and 961 K. The reduction of iron oxide usually involves three sequential steps of Fe2O3 to Fe3O4, Fe3O4 to FeO, and FeO to metallic Fe (Lögdberg et al., 2009; Jozwiak et al., 2007), occurring at different temperatures. The reduction temperatures can also vary with the particle size, morphology, and the interaction between iron oxide phase and the alumina support. Nonetheless, the two smaller peaks at higher temperatures (735 and 961 K) and its low degree of reduction (41%, Figure 2) indicates the strong interaction between iron oxide and Al2O3 support in the calcined Fe catalyst, resulting in the formation of large amount of reduction-resistant Fe-Al-O species (Lögdberg et al., 2009).
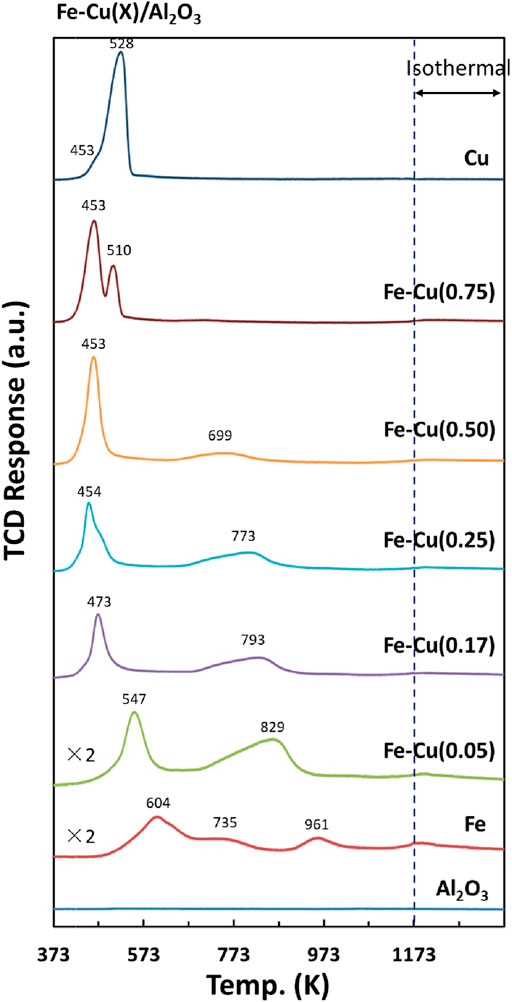
FIGURE 1. H2-TPR profiles of Fe-Cu(X)/Al2O3 catalysts.
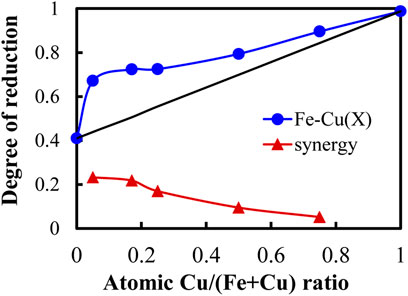
FIGURE 2. The degree of reduction (DR) as a function of atomic Cu/(Fe + Cu) ratio for Fe-Cu(X)/Al2O3 catalysts measured by H2-TPR.
With the addition of Cu, all the reduction peaks of Fe-Cu(X)/Al2O3 catalysts shifted to lower temperature. The more Cu amount, the lower reduction temperature. It suggests that the addition of Cu made the reduction of iron oxide easier. It is worth mentioning that the reduction peaks of Fe-Cu(0.75)/Al2O3 sample located at lower temperatures than those for the Cu/Al2O3 sample, indicating that the presence of Fe also promoted the reduction of Cu species. Furthermore, the first reduction peak at 453–547 K for the Fe-Cu(X)/Al2O3 samples involved the reduction of both Fe and Cu oxide species, which may form Fe-Cu alloy after reduction. No definitive peak corresponding to the Fe-Cu alloy was observed because its amount was low or it was overlapped with the reduction peak of Fe and Cu.
Based on H2 consumption, we calculated the degree of reduction (DR) for all the samples. The DR of the supported metal oxides is defined as the ratio of the actual measured H2 consumption to the total theoretical H2 consumption based on the composition of metal oxides. The actual measured H2 consumption was calculated by integrating the TPR profile, while the theoretical H2 consumption was the amount of H2 required for the reduction of the supported Fe and Cu oxides toward their metallic states according to the stoichiometry of the equations shown below (Eqs 1, 2).
Figure 2 shows the DR as a function of the Cu/(Fe + Cu) atomic ratio. The DR increased with the increase of Cu content in the catalyst (the blue line). Because the Cu/Al2O3 catalyst itself had a high DR of 98.8%, the increased DR could be attributed to Cu alone and/or the synergistic effect of Fe and Cu. Assuming there was no interaction between Fe and Cu, we could calculate the DR for each Fe-Cu(X)/Al2O3 sample by adding their corresponding DRs in proportion to their composition (the black line). Obviously, all the measured DRs of Fe-Cu(X)/Al2O3 samples were higher than the sum of the individual DR when using the Fe/Al2O3 and Cu/Al2O3 separately, confirming the Fe-Cu synergy when combining Fe and Cu in the Fe-Cu(X)/Al2O3 catalyst.
To further compare the Fe-Cu synergy among the Fe-Cu(X)/Al2O3 samples, we used the DR difference (ΔDR) as an indicator to the Fe-Cu synergy, which was calculated by subtracting the summed DR value (the black line) from the measured DR value (the blue line), which is also plotted in Figure 2 (the red line). As seen, the Fe-Cu synergy was almost the same for the Fe-Cu(0.05)/Al2O3 and Fe-Cu(0.17)/Al2O3 samples and showed the highest among all samples. On further increasing the Cu content, the content of Fe decreased as the total metal loading was fixed. The DR contribution from Cu became larger, whereas the DR difference decreased. As a result, a decreasing trend in the Fe-Cu synergy was obtained.
Fe K-Edge XAS
Figure 3 shows the XAS data for the reduced Fe/Al2O3 and Fe-Cu/Al2O3 catalysts with the Fe2O3, Fe3O4, and Fe foil as the reference compounds. The Fe K-edges of the reduced Fe/Al2O3 and Fe-Cu/Al2O3 catalysts were observed at 7,133.6 and 7,133.0 eV, respectively, while the K-edge value for Fe foil was 7,112.0 eV. The adsorption energies of the Fe2O3 and Fe3O4 were at 7,134.6 and 7,133.5 eV, respectively, which reflect electronic transitions from 1s orbitals to unoccupied p-d hybrid molecular orbitals (Li et al., 2001). The XANES spectra (Figure 3A) of the reduced Fe/Al2O3 and Fe-Cu/Al2O3 catalysts were similar to that of the Fe3O4 sample, especially the pre-edge peaks of the reduced Fe/Al2O3 and Fe-Cu/Al2O3 catalysts as shown in Supplementary Figure S1. The results reveal that iron oxide was not reduced to Fe0 under the conditions used for the XAS analysis.
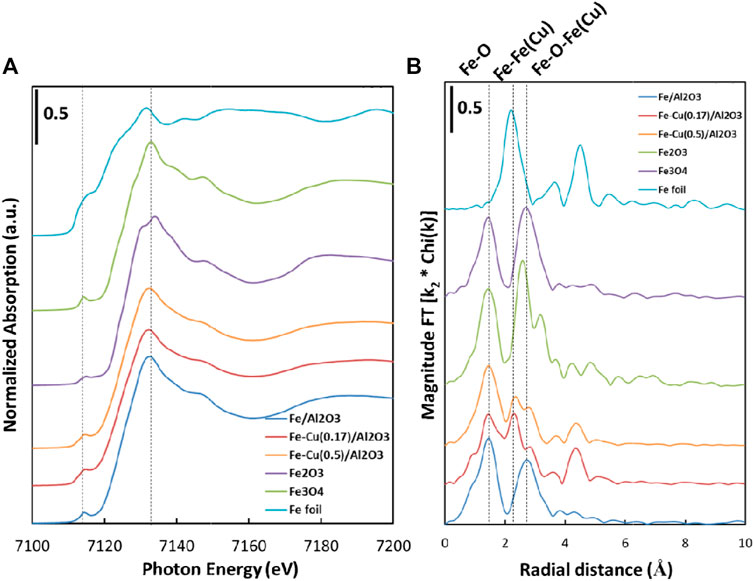
FIGURE 3. (A) Fe K-edge XANES spectra and (B)k3-weighted EXAFS Fourier-transform magnitude spectra of the Fe/Al2O3, Fe-Cu(0.17)/Al2O3, Fe-Cu(0.5)/Al2O3 catalysts and the reference samples.
As shown in Supplementary Figure S1, the peak in the pre-edge region of the reduced Fe-Cu(0.17)/Al2O3 was broadened relative to that of the reduced Fe/Al2O3 catalyst at 7,114.4 eV. The peak in the pre-edge region of Fe-Cu(0.17)/Al2O3 shifted to lower energy, while there was also an increase in intensity at higher energy. This shift suggests that there was a small amount of metallic Fe in the reduced Fe-Cu(0.17)/Al2O3 catalyst. Similar changes in the pre-edge region occurred for reduced Fe-Cu(0.5)/Al2O3, but with less contribution from metallic Fe. It is consistent with the catalyst composition where the Fe-Cu(0.17) sample contains more Fe content than Fe-Cu(0.5) sample.
Similar to the XANES profiles, the EXAFS spectra in Figure 3B also suggests that the reduced Fe/Al2O3 catalyst was more like Fe3O4. It had an Fe-O peak (phase uncorrected distance) at 1.47 Å, and an Fe-O-Fe scattering peak at 2.82 Å (phase uncorrected distance). Over the reduced Fe-Cu(0.17)/Al2O3 catalyst, besides the Fe-O and Fe-O-Fe(Cu) distances, a new distance of 2.36 Å emerged, which can be assigned to the metallic Fe-Fe(Cu) distance. It is a clear evidence showing that the addition of Cu increased the reduction degree of Fe in the Fe-Cu bimetallic catalyst. Similarly, the radial distances from the reduced Fe-Cu(0.5)/Al2O3 catalyst were not much different from the reduced Fe-Cu(0.17)/Al2O3 catalyst, implying that the types of the reduced elements are similar, but the amounts are different likely due to the difference in the Fe-Cu compositions.
Morphological Properties of Fe and Cu Species and Element Distribution
Figure 4 presents TEM images of the reduced Fe-Cu(0.17)/Al2O3. Due to the low contrast between the alumina support and Fe-Cu elements, the particles were hardly discerned directly by eyes. We had to use the elemental analysis to confirm the distribution of the particles, which were widely dispersed over the support as shown in Supplementary Figure S2. The average particle size mainly lied in the range of 4–7 nm (Figure 4D). The lattice space was measured to be 2.01 Å and 2.53 Å (Figure 4C), which corresponds to FeCu alloy (110) and Fe3O4 (311) (Omar, 2016; Wei et al., 2017), respectively. The alloy lattice space matches the d-spacing of the FeCu alloy from the XRD results reported in our prior work (Wang et al., 2018). It should be noted that the d-spacing values for the Fe-Cu alloys are similar. Additionally, according to the binary phase diagrams of Fe and Cu, there is no specific ratio of Fe and Cu in alloys. Thus, it is impossible to distinguish them both in XRD and TEM.
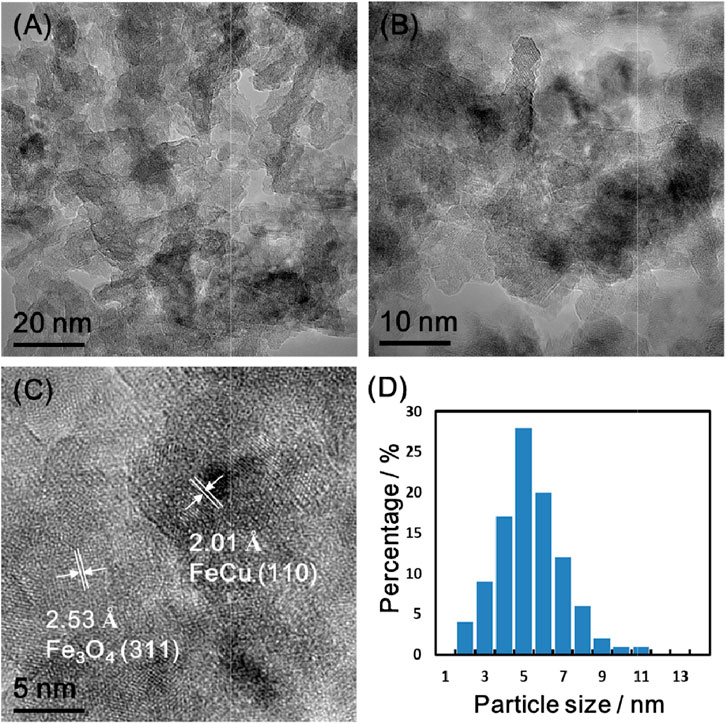
FIGURE 4. TEM images of the reduced Fe-Cu(0.17)/Al2O3 with different magnifications (A–C) and its particle size distribution based on approximately 200 particles of TEM image (D).
The presence of Fe-Cu alloy particles was also confirmed by Z-contrast in the high-angle annular dark-field image (HAADF) of the reduced Fe-Cu(0.17)/Al2O3 catalyst as shown in Figure 5. The corresponding EDS mapping images for Al, O, Fe, and Cu elements are shown in Supplementary Figure S2. Both Al and O species distributed uniformly across the sample island, while Fe and Cu species existed in close proximity but at different relative concentrations. Evidently, Fe and Cu were well-dispersed, which is consistent with the observations from the TEM images. Comparing the Fe and Cu distributions, we observed that most Fe and Cu elements were located at the same places, especially at the large Fe areas, indicating the combination of Fe and Cu. It was further confirmed by measuring the d-spacing. The magnified inset in Figure 5A shows a representative particle with a relatively clear lattice fringe alignment. The measured average d-spacing was ca. 2.01 Å, which is in accordance with the results from both TEM images and XRD patterns (Wang et al., 2018). Thus, these particles are representative Fe-Cu alloy particles.
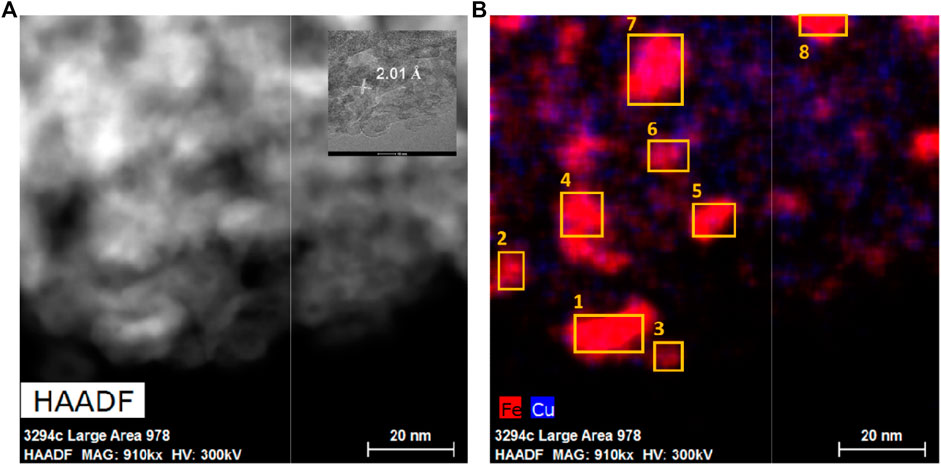
FIGURE 5. (A) HAADF STEM image of the reduced Fe-Cu(0.17)/Al2O3 catalyst and (B) corresponding STEM/EDS overlap maps for Fe and Cu elements.
To confirm the alloy formation, these eight representative alloy particles (with the d-spacing = 2.01 Å) in the HADDF and EDS images (the same area of TEM images) were scanned by the energy-dispersive X-ray spectroscopy mapping technique in STEM mode (STEM/EDS). This technique allows for the identification of the elemental compositions of individual bimetallic nanoparticles on the catalyst surface. Their compositions are listed in Table 1. The Cu/(Fe + Cu) ratios were in the range of 0.17–0.48, more centered between 0.2 and 0.3 with the mean at 0.29. It is consistent with the best Cu/(Fe + Cu) ratio for the Fe-Cu alloy composition suggested by the DFT simulation (Nie et al., 2016; Nie et al., 2017).
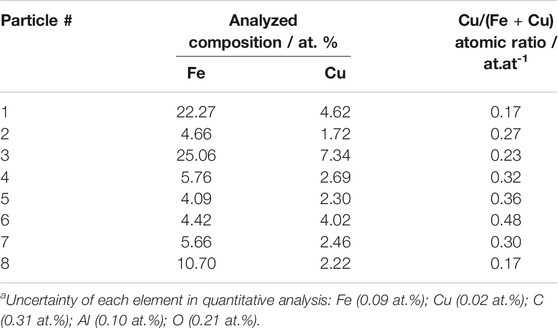
TABLE 1. Quantified phase compositions in the alloyed Fe-Cu nanoparticles from the STEM/EDS maps for the reduced Fe-Cu(0.17)/Al2O3 with total metal loading of 15 wt%a.
Therefore, the STEM/EDS results demonstrated a uniform distribution of Fe and Cu in the nanosized alloy particles after reduction, which is in good agreement with the XRD results over the same sample (Wang et al., 2018).
Surface Adsorbed Species
To investigate the surface species on the bimetallic Fe-Cu catalysts during CO2 hydrogenation, in situ diffuse reflectance FT-IR spectra were recorded after the CO2 hydrogenation reaction was initiated at 523 K and atmospheric pressure for 30 min. Before the reaction, all samples were reduced with pure H2 at 523 K for 1 h. The obtained DRIFT spectra are shown in Figure 6.
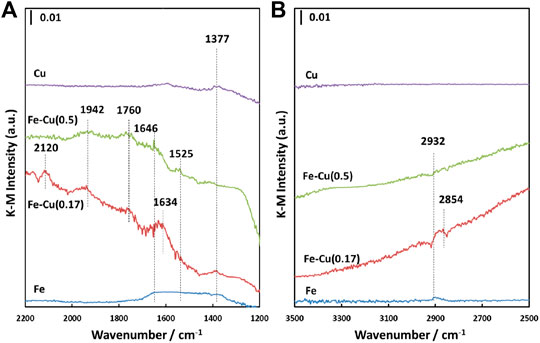
FIGURE 6. In situ DRIFT spectra of Fe-Cu(X)/Al2O3 catalysts after CO2 hydrogenation at 523 K and atmospheric pressure for 30 min (A) 1,200–2,200 cm-1 and (B) 2,500–3500 cm-1.
As seen, IR bands at 1,377, 1,634, 1,760, 1,942, and 2,120 cm-1 were observed within the range of 1,200–2,200 cm-1 over the Fe-Cu(0.17) catalyst, while the Fe-Cu(0.5) sample displayed the IR bands at 1,525, 1,646, 1,760, and 1942 cm-1. The bands at 1,634 and 1,646 cm-1 can be attributed to the adsorbed bicarbonates with different vibrational modes (Busca and Lorenzelli, 1982; Rethwisch and Dumesic, 1986; Gopal et al., 1987), while the 1,525 cm-1 IR band is the characteristic of carbonates (Peri, 1966; Parkyns, 1971; Morterra and Orio, 1990; Turek et al., 1992; Morterra and Magnacca, 1996). These IR bands confirm the formation of adsorbed bicarbonate and carbonate species on both bimetallic Fe-Cu catalysts during CO2 hydrogenation. The 1,942 and 2,120 cm-1 bands can be attributed to the adsorbed CO species (Bando et al., 1997; Hadjiivanov et al., 2001), which were not observed on either Cu/Al2O3 or Fe/Al2O3 catalysts. It indicates that the combination of Fe and Cu promoted the RWGS reaction, generating more adsorbed CO species. Although Cu/Al2O3 can promote the RWGS reaction, the formed CO species are quickly released into the gas phase due to the weak interaction between Cu and CO. As a result, such two bands were not observed over the Cu/Al2O3 catalyst.
Besides, the IR bands at 1,377, 2,854, and 2,932 cm-1 represent different vibrational modes of adsorbed formate species (Millar et al., 1991; Clarke and Bell, 1995; Cabilla, 2003) and the 1760 cm-1 IR band is the characteristic of formic acid (Shimanouchi, 1972). The observation of the adsorbed formate and formic acid species provides an evidence for one potential CO2 hydrogenation pathway on the bimetallic Fe-Cu/Al2O3 catalysts that the reaction could go through a direct hydrogenation via formate, then formic acid as main intermediates to C2+ hydrocarbons, which was also proposed on the basis of DFT simulation (Nie et al., 2016; Nie et al., 2017).
The intensities of these IR bands on the Fe-Cu(0.17) catalyst were much stronger than those of the Fe-Cu(0.5) catalyst, indicating that the Fe-Cu synergy in the Fe-Cu(0.17) catalyst is stronger than that in the Fe-Cu(0.5) catalyst in terms of CO2 hydrogenation. It is in good agreement with H2-TPR results shown in Figure 2. On the contrast, the Fe/Al2O3 catalyst only showed a broad IR peak at 1,300–1,700 cm-1 along with a band at ∼2,932 cm-1.
Besides the IR spectra after 30 min of CO2 hydrogenation reaction, we also recorded the DRIFT spectra at different reaction time including 10, 20, and 30 min over the Fe-Cu(0.17)/Al2O3 catalyst, which is shown in Supplementary Figure S3. No change was detected in these spectra, revealing that the adsorbed species are stable.
H2 Adsorption Properties
Figure 7 shows the H2-TPD profiles of the reduced Fe/Al2O3, Fe-Cu(0.17)/Al2O3, Fe-Cu(0.5)/Al2O3, and Cu/Al2O3 catalysts. The H2-TPD profile of the Al2O3 support is also presented as the baseline. Their direct comparison is presented in Supplementary Figure S4. The H2 desorption on the reduced Fe/Al2O3 catalyst mainly occurred at 800 K with several minor desorption peaks at 440, 584, and 1030 K. The H2-TPD profiles of the Fe-Cu bimetallic catalysts generally showed similar features to that of the monometallic Fe catalyst, suggesting the reduced iron sites are responsible for H2 adsorption on the Fe-Cu catalyst surface. Compared to the Fe/Al2O3 catalyst, the combination of Fe and a small amount of Cu (X = 0.17) enhanced the H2 desorption at 800 K. Upon further increasing the Cu content to X = 0.5, however, the H2 desorption peak at 800 K became smaller. On the other hand, the desorption peak at 380–600 K was much promoted with the increase of Cu amount. Interestingly, the H2-TPD profile of the reduced Cu/Al2O3 catalyst was significantly different from those of the Fe-based catalysts, but close to that of the Al2O3 support, suggesting that Cu has low ability in H2 adsorption. The H2 desorption in the range of 600–900 K on the Cu catalyst was negligible.
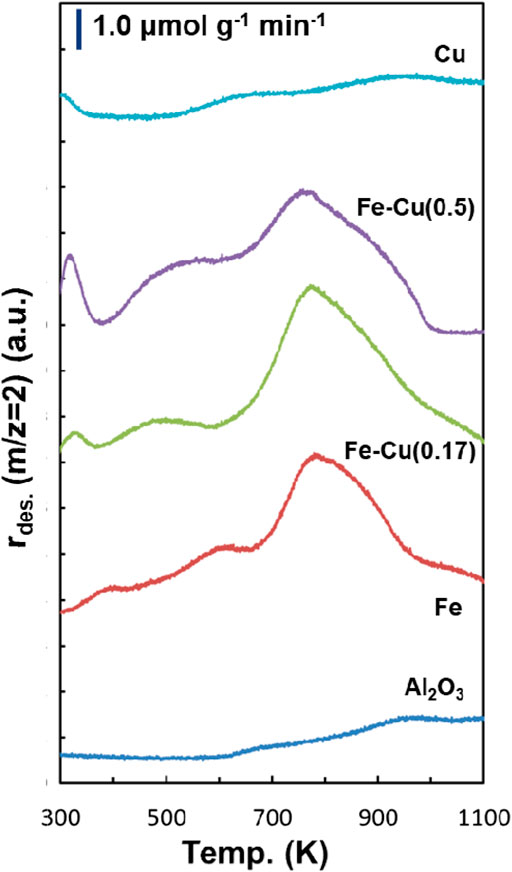
FIGURE 7. H2-TPD profiles of the Fe/Al2O3, Fe-Cu(X)/Al2O3 and Cu/Al2O3 catalysts and Al2O3 support.
To quantitatively analyze the H2 adsorption amount, the H2-TPD peaks were deconvoluted using 50% Gaussian plus 50% Lorentzian functions. As shown in Figure 8 with the reduced Fe-Cu(0.17)/Al2O3 catalyst as a typical example, the final curve generated from the summation of the deconvoluted peaks fitted the experimental data well. The deconvoluted peaks were arbitrarily denoted as I-IV from low to high temperature, representing four different types of adsorbed hydrogen species on the catalyst surface. Types I and II represent the weakly adsorbed H2 at lower temperatures (below 600 K), which can be ascribed to atomic hydrogen adsorbed on the metal surface (Bozso et al., 1977). While the H2 desorption observed at higher temperatures (>600 K, type III as moderately adsorbed H2 and type IV as strongly adsorbed H2) are the H2 species adsorbed on the metallic Fe0 and/or Fe-Cu alloy surface decorated with unreduced metal oxide (Zowtiak and Bartholomew, 1983; Bartholomew, 1990).
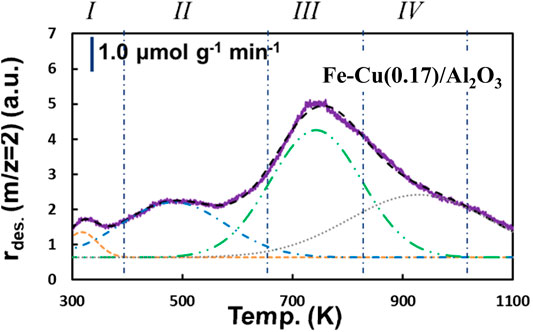
FIGURE 8. Typical peak deconvolution of H2-TPD profile obtained on the Fe-Cu(0.17)/Al2O3 catalyst.
Based on the peak deconvolution, we were able to quantitatively estimate the amount of different types of adsorbed H2 by integrating each peak, which are listed in Supplementary Table S1 for all Fe-Cu(X)/Al2O3 samples. Figure 9A shows the amounts of type III + IV adsorbed H2 on the Fe-Cu(X)/Al2O3 catalysts. Adding a small amount of Cu greatly promoted the amount of type III + IV adsorbed H2, especially at the Cu/(Fe + Cu) atomic ratio of 0.10 and 0.17, the amount of type III + IV adsorbed H2 of which was 238.1 and 240.0 μmol g-cat-1, respectively, about 50% higher than that of the Fe/Al2O3 catalyst. Further increasing Cu content, however, resulted in the decrease of type III + IV adsorbed H2. When the Cu/(Fe + Cu) ratio was 0.75, the amount of type III + IV adsorbed H2 became 113.5 μmol g-cat-1, which was even lower than that of the Fe/Al2O3 catalyst. Such a trend is consistent with the change in the Fe-Cu synergy characterized by the degree of reduction of the Fe-Cu catalyst with the addition of Cu shown in Figure 2.
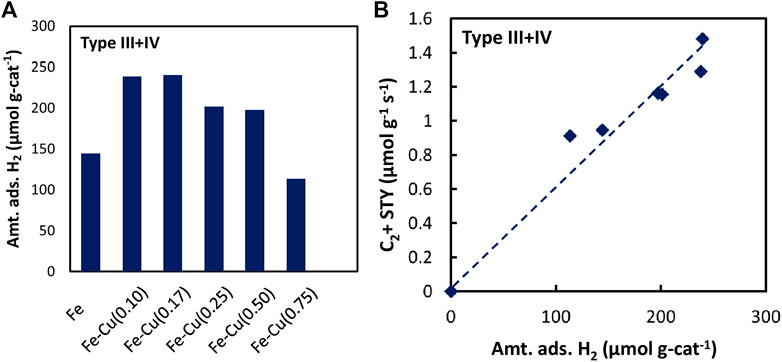
FIGURE 9. (A) The amount of type III + IV adsorbed H2 on the Fe-Cu(X)/Al2O3 catalysts, and (B) The effect of amount of type III + IV adsorbed H2 on the space-time yield (STY) of C2+ hydrocarbons over the Fe-Cu(X)/Al2O3 catalysts.
We then correlated the space-time yield (STY) of C2+ hydrocarbons with each type of adsorbed H2 species. The amount of moderately plus strongly adsorbed H2 (type III + IV) showed a good relationship with C2+ hydrocarbons production (Figure 9B). Such a strong correlation evidently displays that the moderately and strongly adsorbed H2 species played an important role in the formation of C2+ hydrocarbons. In other words, the Fe-Cu synergy in CO2 hydrogenation could be attributed to the enhancement in H2 adsorption induced by the combination of Fe and Cu.
CO2 Adsorption Properties
The effect of Fe-Cu combination on the CO2 adsorption properties of the reduced Fe-Cu(X)/Al2O3 catalysts was examined by CO2-TPD, which is presented in Figure 10. The γ-Al2O3 support was also evaluated as a reference. It showed a CO2 desorption peak at 350 K, which is known as the decomposition of the surface bicarbonate species (Pan et al., 2008). Over the monometallic Fe catalyst, another strong CO2 desorption peak was observed at around 480 K, which can be ascribed to the decomposition of the surface carbonate species (Pan et al., 2008). With the addition of Cu, another new small CO2 desorption peak at 550–700 K emerged over the Fe-Cu bimetallic catalysts, which can be referred to the bidentate carbonate species (Pan et al., 2008). The observed bicarbonate and carbonate species are in a good agreement with the DRIFTS results. In contrast, the monometallic Cu catalyst exhibited a similar profile to the γ-Al2O3 support, indicating that Cu itself does not contribute to CO2 adsorption. Therefore, the new peak induced by the addition of Cu could be attributed to the Fe-Cu strong interaction and/or Fe-Cu alloys. Correlating to CO2 hydrogenation performance, it also suggests that the observed Fe-Cu synergy is because the combination of Fe and Cu enhanced CO2 adsorption.
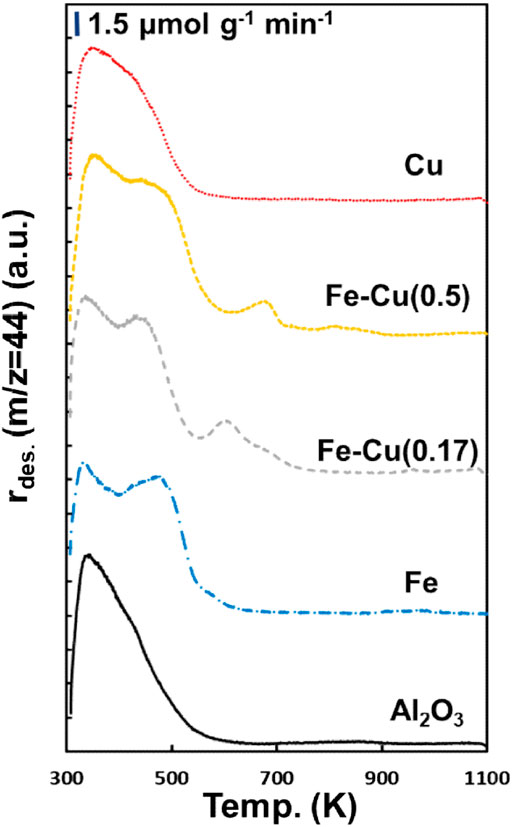
FIGURE 10. CO2-TPD profiles of the reduced Fe-Cu(X)/Al2O3 catalysts and the Al2O3 support.
It is projected that the addition of K could greatly enhance CO2 adsorption due to its basic nature. Consequently, we also examined the CO2 desorption behavior of K-promoted catalysts, i.e., the Fe-Cu(0.17)/K(Y)/Al2O3 catalysts. As shown in Figure 11A, compared to the Fe-Cu(0.17) catalyst, the addition of K increased all types of the adsorbed CO2 species with desorption peaks at around 350 K, 450 K, and 550–700 K. Additionally, a new desorption peak at higher temperatures (>700 K) emerged, which could be ascribed to the adsorbed CO2 on potassium ferrite (K2Fe2O4) (Zowtiak and Bartholomew, 1983). Similar desorption peak after K addition was also observed on the Fe-Zn-K catalysts (Zhang et al., 2015).
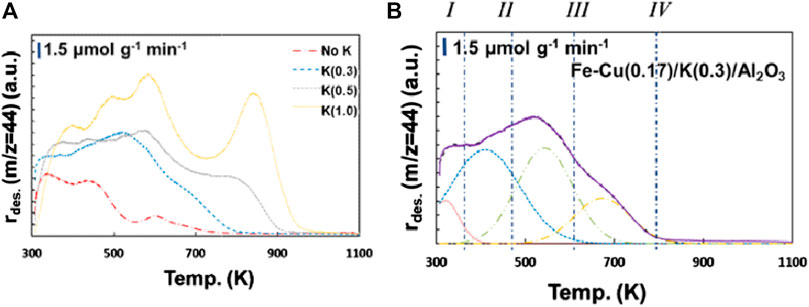
FIGURE 11. (A) CO2-TPD profiles of the Fe-Cu(0.17)/K(Y)/Al2O3 catalysts and (B) Peak deconvolution of CO2-TPD profile of the Fe-Cu(0.17)/K(0.3)/Al2O3 catalyst.
To find out the relationship between the adsorbed CO2 species and CO2 hydrogenation reaction, the desorption profiles of the Fe-Cu(0.17)/K(Y)/Al2O3 catalysts were deconvoluted and quantitatively analyzed. Using the Fe-Cu(0.17)/K(0.3)/Al2O3 catalyst as an example (Figure 11B), four peaks denoted as types I–IV were identified from low to high temperatures, suggesting four different CO2 adsorption states on the catalyst surface. The quantities of deconvoluted peaks for all CO2-TPD profiles are summarized in Supplementary Table S2.
As described above, the moderately adsorbed CO2 (Type III at 550–700 K) is related to the Fe-Cu interaction. The addition of K changed the moderately adsorbed CO2, suggesting that K also interacted with Fe and Cu. In addition, it is responsible for the emergence of strongly adsorbed CO2 (Type IV at 600–900 K), as no such peak was observed over the corresponding catalyst without K addition. It is mainly because K could increase the surface basicity by donating the electron to the Fe-based catalyst (i.e., acting as an electronic promoter) (Dorner et al., 2010). Thus, we correlated the STY of C2+ hydrocarbons with each type of adsorbed CO2. It was found that the C2+ hydrocarbons production rate is dependent on the amount of moderately plus strongly adsorbed CO2 (type III + IV) (Supplementary Figure S6). It suggests that the moderately and strongly adsorbed CO2 may be responsible for the formation of C2+ hydrocarbons. It also means the Fe-Cu synergy comes from the Fe-Cu strong interaction, which enhances CO2 adsorption (both amount and strength) on the catalyst surface.
Effect of H2 and CO2 Adsorption Properties on Olefin Formation
In CO2 hydrogenation, we observed that the olefin selectivity increased significantly with the addition of K, resulting in an increased O/P (olefin/paraffin) ratio, which may be related to the change in the H2 and CO2 adsorption properties of the catalysts with K. Consequently, the H2-TPD experiments were also performed over the Fe-Cu(0.17)/K(Y)/Al2O3 catalysts, and the results are presented in Supplementary Figure S5. The quantitative results via peak deconvolution are listed in Supplementary Table S1. Adding a small amount of K (K/Fe = 0.3) enhanced H2 adsorption on Fe-Cu(0.17) catalyst, especially the weakly adsorbed H2, due likely to the electronic enhancement of K to metals. However, further increasing K content (K/Fe = 0.5 and 1.0) resulted in the decrease of the moderately and strongly adsorbed H2, due likely to that overloaded K could cover the metal surface for H2 adsorption.
As discussed in the H2 adsorption properties and CO2 adsorption properties sections, both the moderately and strongly adsorbed H2 species (Type III + IV) and the moderately and strongly adsorbed CO2 (Type III + IV) showed good relationship to the formation of C2+ hydrocarbons. On the other hand, in CO2 hydrogenation, the production of paraffins requires more H2 than olefins. Hence we used the ratio of the amount of the moderately and strongly adsorbed CO2 over the amount of the moderately and strongly adsorbed H2 to correlate with the olefin/paraffin ratio (O/P) obtained from CO2 hydrogenation over the Fe-Cu(0.17)/K(Y)/Al2O3 catalysts. The result is presented in Figure 12.
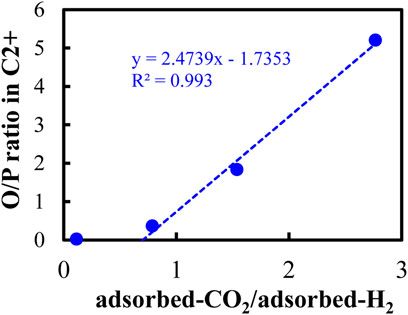
FIGURE 12. Relationship between the olefin/paraffin ratio and the ratio of the amount of type III + IV adsorbed CO2 over the amount of type III + IV adsorbed H2.
Here we observed a clear and very strong relationship between the O/P ratio and the ratio of the amount of the moderately and strongly adsorbed CO2 over the amount of the moderately and strongly adsorbed H2 with the R-square value of more than 0.99. It reflects that both the moderately and strongly adsorbed CO2 and H2 played a critical role in determining the olefin selectivity in CO2 hydrogenation. In other words, it is possible to obtain more olefins than paraffins by controlling the ratio of the moderately and strongly adsorbed CO2 over the moderately and strongly adsorbed H2 when we design a proper catalyst for CO2 hydrogenation to higher hydrocarbons.
When we compared the Fe-Cu catalyst with relevant studies of Fe-based catalyst, we found that this CO2/H2 adsorption behavior is the key to light olefin formation. For instance, Zhang et al. reported a promotion of Fe-Zn-K catalyst on CO2 conversion, but they reported Zn addition had almost no effect on light olefin selectivity. And they also found that adding Zn decreased CO2 uptake (Zhang et al., 2015). These results proved that Zn acted more like a structural promoter that can help Fe to be better dispersed and reduced. It is not an actual synergetic effect. We will further discuss the importance of light olefin formation and its role in the whole CO2 hydrogenation process in next section.
The comprehensive investigation on the relationship between the adsorbed CO2 and H2 species and the catalyst activity and product selectivity shall thus be conducted to improve our fundamental understanding of CO2 hydrogenation to higher hydrocarbons over the Fe-Cu bimetallic catalysts.
Pathways of CO2 Hydrogenation
To investigate the pathways of CO2 hydrogenation, the Fe-Cu(0.17)/K(0.3)/Al2O3 catalyst was tested over a wide range of residence time (W/F) at 573 K and 1.1 MPa. The CO2 conversion as a function of W/F is shown in Supplementary Figure S7. Clearly, the CO2 conversion increased with increasing the residence time and gradually became constant at high W/F values.
Figure 13 shows the CO, CH4, and C2+ hydrocarbons selectivities as a function of CO2 conversion. With the increase of CO2 conversion, the CO selectivity decreased while the selectivity of C2+ hydrocarbons increased, indicating that CO is a primary product while C2+ hydrocarbons are produced from CO, probably via a process similar to FTS (Riedel et al., 2001). It is noticed that at the CO2 conversion less than 10%, the CO selectivity, CH4 selectivity, and C2+ hydrocarbons selectivity were almost constant at 90, 4, and 6%, respectively. It hints that small parts of CH4 and C2+ hydrocarbons may come from direct hydrogenation of CO2 without through CO intermediate (Riedel et al., 2001). In addition, CH4 selectivity did not change much with the increase of CO2 conversion whereas the CO selectivity decreased sharply, suggesting that CH4 formation is not closely related to CO formation.
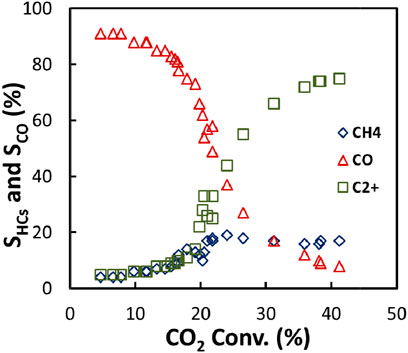
FIGURE 13. C2+ hydrocarbons, CH4, and CO selectivity as a function of CO2 conversion during CO2 hydrogenation over the Fe-Cu(0.17)/K (0.3)/Al2O3 catalyst at 573 K and 1.1 MPa.
Among the C2+ hydrocarbons, the paraffin selectivity increased drastically with the increase of CO2 conversion, while the olefin selectivity only increased a bit, leading to a rapid decrease in the C2-C4 olefin/paraffin ratio (Figure 14). It suggests that light olefins could be the primary product from CO2 hydrogenation, and then are further hydrogenated to paraffins. Hence, to achieve olefin-rich hydrocarbons, it would be crucial to suppress the consequent hydrogenation of olefins by tailoring the surface coverage of CO2 and H2 in CO2 hydrogenation.
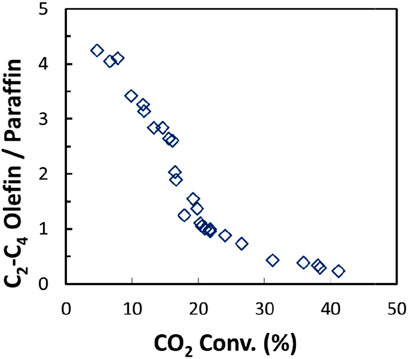
FIGURE 14. C2-C4 olefin/paraffin ratio as a function of CO2 conversion from CO2 hydrogenation over the Fe-Cu(0.17)/K (0.3)/Al2O3 catalyst at 573 K and 1.1 MPa.
Conclusion
This work focused on catalyst characterizations to better understand the Fe-Cu synergistic effect in CO2 hydrogenation, where the Fe-Cu(0.17) catalyst showed the best performance. Adding Cu to Fe promoted the reduction of iron oxide to Fe0 and the formation of Fe-Cu alloy as evidenced by H2-TPR, high resolution TEM, and XAS. It also influenced the adsorbed surface species during CO2 hydrogenation as observed by in situ DRIFTS. Furthermore, the addition of Cu promoted the adsorption of the moderately and strongly adsorbed H2 species and moderately adsorbed CO2 species, which were responsible for the increased CO2 conversion and C2+ selectivity. Adding K further increased the moderately and strongly adsorbed CO2, but slightly reduced the moderately and strongly adsorbed H2, resulting in an increased adsorbed-CO2/adsorbed-H2 ratio and consequently producing olefin-rich hydrocarbons with a significantly increased O/P ratio. Both the in situ DRIFTS and the product distribution analysis suggested that C2+ hydrocarbons were largely produced from consequent reduction of CO via the FT-like process, along with a small portion formed via a direct CO2 hydrogenation pathway.
Data Availability Statement
The original contributions presented in the study are included in the article/Supplementary Material; further inquiries can be directed to the corresponding authors.
Author Contributions
CS, XW, and WW contributed to conception and design of the study. GZ conducted the XAS analysis, KW and FZ performed the TEM analysis and WW completed all other experiments. WW wrote the first draft of the manuscript. All authors contributed to data analysis and visualization, manuscript revision, read, and approved the submitted version.
Funding
This work was supported in part by the Pennsylvania State University through the EMS Energy Institute and the Institutes of Energy and the Environment. Use of the Advanced Photon Source was supported by the U.S. Department of Energy, Office of Basic Energy Sciences, Office of Science, under Contract No. DE-AC02-06CH11357. Materials Research Collaborative Access Team (MRCAT) operations and the beamline 10-ID were supported by the Department of Energy and the MRCAT member institutions.
Conflict of Interest
The authors declare that the research was conducted in the absence of any commercial or financial relationships that could be construed as a potential conflict of interest.
Publisher’s Note
All claims expressed in this article are solely those of the authors and do not necessarily represent those of their affiliated organizations, or those of the publisher, the editors and the reviewers. Any product that may be evaluated in this article, or claim that may be made by its manufacturer, is not guaranteed or endorsed by the publisher.
Supplementary Material
The Supplementary Material for this article can be found online at: https://www.frontiersin.org/articles/10.3389/fceng.2021.708014/full#supplementary-material
References
Amoyal, M., Vidruk-Nehemya, R., Landau, M. V., and Herskowitz, M. (2017). Effect of Potassium on the Active Phases of Fe Catalysts for Carbon Dioxide Conversion to Liquid Fuels through Hydrogenation. J. Catal. 348, 29–39. doi:10.1016/j.jcat.2017.01.020
Bando, K. K., Sayama, K., Kusama, H., Okabe, K., and Arakawa, H. (1997). In-situ FT-IR Study on CO2 Hydrogenation over Cu Catalysts Supported on SiO2, Al2O3, and TiO2. Appl. Catal. A: Gen. 165, 391–409. doi:10.1016/s0926-860x(97)00221-4
Bartholomew, C. H. (1990). Hydrogen Adsorption on Supported Cobalt, Iron, and Nickel. Catal. Lett. 7, 27–51.
Bozso, F., Ertl, G., Grunze, M., and Weiss, M. (1977). Chemisorption of Hydrogen on Iron Surfaces. Appl. Surf. Sci. 1, 103–119. doi:10.1016/0378-5963(77)90009-5
Busca, G., and Lorenzelli, V. (1982). Infrared Spectroscopic Identification of Species Arising from Reactive Adsorption of Carbon Oxides on Metal Oxide Surfaces. Mater. Chem. 7, 89–126. doi:10.1016/0390-6035(82)90059-1
Cabilla, G. (2003). Infrared Study of the Adsorption of Formic Acid on Clean and Ca-Promoted Pd/SiO2 Catalysts. Appl. Catal. A: Gen. 255, 181–195. doi:10.1016/s0926-860x(03)00546-5
Centi, G., and Perathoner, S. (2009). Opportunities and Prospects in the Chemical Recycling of Carbon Dioxide to Fuels. Catal. Today 148, 191–205. doi:10.1016/j.cattod.2009.07.075
Clarke, D. B., and Bell, A. T. (1995). An Infrared Study of Methanol Synthesis from CO2 on Clean and Potassium-Promoted Cu/SiO2. J. Catal. 154, 314–328. doi:10.1006/jcat.1995.1173
Dorner, R. W., Hardy, D. R., Williams, F. W., and Willauer, H. D. (2011). C2-C5+ Olefin Production from CO2 Hydrogenation Using Ceria Modified Fe/Mn/K Catalysts. Catal. Commun. 15, 88–92. doi:10.1016/j.catcom.2011.08.017
Dorner, R. W., Hardy, D. R., Williams, F. W., and Willauer, H. D. (2010). K and Mn Doped Iron-Based CO2 Hydrogenation Catalysts: Detection of KAlH4 as Part of the Catalyst's Active Phase. Appl. Catal. A: Gen. 373, 112–121. doi:10.1016/j.apcata.2009.11.005
Fischer, N., Henkel, R., Hettel, B., Iglesias, M., Schaub, G., and Claeys, M. (2015). Hydrocarbons via CO2 Hydrogenation over Iron Catalysts: The Effect of Potassium on Structure and Performance. Catal. Lett. 146, 509–517. doi:10.1007/s10562-015-1670-9
Fujita, S., Terunuma, H., Kobayashi, H., and Takezawa, N. (1987). Methanation of Carbon Monoxide and Carbon Dioxide over Nickel Catalyst under the Transient State. React. Kinet Catal. Lett. 33, 179–184. doi:10.1007/bf02066720
Gopal, P., Schneider, R. L., and Watters, K. L. (1987). Evidence for Production of Surface Formate upon Direct Reaction of CO with Alumina and Magnesia. J. Catal. 105, 366–372. doi:10.1016/0021-9517(87)90066-2
Hadjiivanov, K., Venkov, T., and Knözinger, H. (2001). FTIR Spectroscopic Study of CO Adsorption on Cu/SiO2: Formation of New Types of Copper Carbonyls. Catal. Lett. 75, 55–59. doi:10.1023/a:1016759123842
Hu, B., Frueh, S., Garces, H. F., Zhang, L., Aindow, M., Brooks, C., et al. (2013). Selective Hydrogenation of CO2 and CO to Useful Light Olefins over Octahedral Molecular Sieve Manganese Oxide Supported Iron Catalysts. Appl. Catal. B: Environ. 132-133, 54–61. doi:10.1016/j.apcatb.2012.11.003
Hu, B., Guild, C., and Suib, S. L. (2013). Thermal, Electrochemical, and Photochemical Conversion of CO2 to Fuels and Value-Added Products. J. CO2 Utilization 1, 18–27. doi:10.1016/j.jcou.2013.03.004
Huš, M., Kopač, D., Štefančič, N. S., Jurković, D. L., Dasireddy, V. D. B. C., and Likozar, B. (2017). Unravelling the Mechanisms of CO2 Hydrogenation to Methanol on Cu-Based Catalysts Using First-Principles Multiscale Modelling and Experiments. Catal. Sci. Tech. 7, 5900–5913. doi:10.1039/c7cy01659j
Jiang, X., Koizumi, N., Guo, X., and Song, C. (2015). Bimetallic Pd-Cu Catalysts for Selective CO2 Hydrogenation to Methanol. Appl. Catal. B: Environ. 170-171, 173–185. doi:10.1016/j.apcatb.2015.01.010
Jozwiak, W. K., Kaczmarek, E., Maniecki, T. P., Ignaczak, W., and Maniukiewicz, W. (2007). Reduction Behavior of Iron Oxides in Hydrogen and Carbon Monoxide Atmospheres. Appl. Catal. A: Gen. 326, 17–27. doi:10.1016/j.apcata.2007.03.021
Lee, S.-C., Kim, J.-S., Shin, W. C., Choi, M.-J., and Choung, S.-J. (2009). Catalyst Deactivation during Hydrogenation of Carbon Dioxide: Effect of Catalyst Position in the Packed Bed Reactor. J. Mol. Catal. A: Chem. 301, 98–105. doi:10.1016/j.molcata.2008.11.016
Li, S., Meitzner, G. D., and Iglesia, E. (2001). Structure and Site Evolution of Iron Oxide Catalyst Precursors during the Fischer−Tropsch Synthesis. J. Phys. Chem. B 105, 5743–5750. doi:10.1021/jp010288u
Liu, J., Zhang, A., Jiang, X., Liu, M., Sun, Y., Song, C., et al. (2018). Selective CO2 Hydrogenation to Hydrocarbons on Cu-Promoted Fe-Based Catalysts: Dependence on Cu-Fe Interaction. ACS Sustain. Chem. Eng. 6, 10182–10190. doi:10.1021/acssuschemeng.8b01491
Lögdberg, S., Tristantini, D., Borg, Ø., Ilver, L., Gevert, B., Järås, S., et al. (2009). Hydrocarbon Production via Fischer-Tropsch Synthesis from H2-Poor Syngas over Different Fe-Co/γ-Al2O3 Bimetallic Catalysts. Appl. Catal. B: Environ. 89, 167–182. doi:10.1016/j.apcatb.2008.11.037
Meylan, F. D., Moreau, V., and Erkman, S. (2015). CO2 Utilization in the Perspective of Industrial Ecology, an Overview. J. CO2 Utilization 12, 101–108. doi:10.1016/j.jcou.2015.05.003
Millar, G. J., Rochester, C. H., and Waugh, K. C. (1991). Infrared Study of the Adsorption of Formic Acid on Silica-Supported Copper and Oxidised Copper Catalysts. Faraday Trans. 87, 1491–1496. doi:10.1039/ft9918701491
Morterra, C., and Magnacca, G. (1996). A Case Study: Surface Chemistry and Surface Structure of Catalytic Aluminas, as Studied by Vibrational Spectroscopy of Adsorbed Species. Catal. Today 27, 497–532. doi:10.1016/0920-5861(95)00163-8
Morterra, C., and Orio, L. (1990). Surface Characterization of Zirconium Oxide. II. The Interaction with Carbon Dioxide at Ambient Temperature. Mater. Chem. Phys. 24, 247–268. doi:10.1016/0254-0584(90)90089-s
Nam, S.-S., Lee, S.-J., Kim, H., Jun, K.-W., Choi, M.-J., and Lee, K.-W. (1997). Catalytic Conversion of Carbon Dioxide into Hydrocarbons over Zinc Promoted Iron Catalysts. Energ. Convers. Manage. 38, S397–S402. doi:10.1016/s0196-8904(96)00301-9
Ngantsoue-Hoc, W., Zhang, Y., O’Brien, R. J., Luo, M., and Davis, B. H. (2002). Fischer−Tropsch Synthesis: Activity and Selectivity for Group I Alkali Promoted Iron-Based Catalysts. Appl. Catal. A: Gen. 236, 77–89. doi:10.1016/s0926-860x(02)00278-8
Nie, X., Wang, H., Janik, M. J., Chen, Y., Guo, X., and Song, C. (2017). Mechanistic Insight into C-C Coupling over Fe-Cu Bimetallic Catalysts in CO2 Hydrogenation. J. Phys. Chem. C 121, 13164–13174. doi:10.1021/acs.jpcc.7b02228
Nie, X., Wang, H., Janik, M. J., Guo, X., and Song, C. (2016). Computational Investigation of Fe-Cu Bimetallic Catalysts for CO2 Hydrogenation. J. Phys. Chem. C 120, 9364–9373. doi:10.1021/acs.jpcc.6b03461
Omar, H. D. (2016). The Analysis of Copper-Iron Metallic Mixture by Means of XRD and XRF. Ilcpa 64, 130–134. doi:10.18052/www.scipress.com/ilcpa.64.130
Pan, Y., Liu, C.-j., and Ge, Q. (2008). Adsorption and Protonation of CO2on Partially Hydroxylated γ-Al2O3 Surfaces: A Density Functional Theory Study. Langmuir 24, 12410–12419. doi:10.1021/la802295x
Parkyns, N. D. (1971). Influence of thermal Pretreatment on the Infrared Spectrum of Carbon Dioxide Adsorbed on Alumina. J. Phys. Chem. 75, 526–531. doi:10.1021/j100674a014
Peri, J. B. (1966). Infrared Study of Adsorption of Carbon Dioxide, Hydrogen Chloride, and Other Molecules on "Acid" Sites on Dry Silica-Alumina and γ-Alumina1. J. Phys. Chem. 70, 3168–3179. doi:10.1021/j100882a026
Pontzen, F., Liebner, W., Gronemann, V., Rothaemel, M., and Ahlers, B. (2011). CO2-based Methanol and DME - Efficient Technologies for Industrial Scale Production. Catal. Today 171, 242–250. doi:10.1016/j.cattod.2011.04.049
Prašnikar, A., Jurković, D. L., and Likozar, B. (2021). Reaction Path Analysis of CO2 Reduction to Methanol through Multisite Microkinetic Modelling over Cu/ZnO/Al2O3 Catalysts. Appl. Catal. B: Environ. 292, 120190. doi:10.1016/j.apcatb.2021.120190
Prašnikar, A., Pavlišič, A., Ruiz-Zepeda, F., Kovač, J., and Likozar, B. (2019). Mechanisms of Copper-Based Catalyst Deactivation during CO2 Reduction to Methanol. Ind. Eng. Chem. Res. 58, 13021–13029. doi:10.1021/acs.iecr.9b01898
Rethwisch, D. G., and Dumesic, J. A. (1986). Effect of Metal-Oxygen Bond Strength on Properties of Oxides. 1. Infrared Spectroscopy of Adsorbed Carbon Monoxide and Carbon Dioxide. Langmuir 2, 73–79. doi:10.1021/la00067a013
Riedel, T., Claeys, M., Schulz, H., Schaub, G., Nam, S.-S., Jun, K.-W., et al. (1999). Comparative Study of Fischer-Tropsch Synthesis with H2/CO and H2/CO2 Syngas Using Fe- and Co-based Catalysts. Appl. Catal. A: Gen. 186, 201–213. doi:10.1016/s0926-860x(99)00173-8
Riedel, T., Schaub, G., Jun, K.-W., and Lee, K.-W. (2001). Kinetics of CO2Hydrogenation on a K-Promoted Fe Catalyst. Ind. Eng. Chem. Res. 40, 1355–1363. doi:10.1021/ie000084k
Rodemerck, U., Holeňa, M., Wagner, E., Smejkal, Q., Barkschat, A., and Baerns, M. (2013). Catalyst Development for CO2Hydrogenation to Fuels. ChemCatChem 5, 1948–1955. doi:10.1002/cctc.201200879
Saeidi, S., Amin, N. A. S., and Rahimpour, M. R. (2014). Hydrogenation of CO2 to Value-Added Products-A Review and Potential Future Developments. J. CO2 Utilization 5, 66–81. doi:10.1016/j.jcou.2013.12.005
Satthawong, R., Koizumi, N., Song, C., and Prasassarakich, P. (2013). Bimetallic Fe-Co Catalysts for CO2 Hydrogenation to Higher Hydrocarbons. J. CO2 Utilization 3-4, 102–106. doi:10.1016/j.jcou.2013.10.002
Satthawong, R., Koizumi, N., Song, C., and Prasassarakich, P. (2013). Comparative Study on CO2 Hydrogenation to Higher Hydrocarbons over Fe-Based Bimetallic Catalysts. Top. Catal. 57, 588–594. doi:10.1007/s11244-013-0215-y
Satthawong, R., Koizumi, N., Song, C., and Prasassarakich, P. (2015). Light Olefin Synthesis from CO2 Hydrogenation over K-Promoted Fe-Co Bimetallic Catalysts. Catal. Today 251, 34–40. doi:10.1016/j.cattod.2015.01.011
Schild, C., Wokaun, A., and Baiker, A. (1991). On the Hydrogenation of CO and CO2 over Copper/zirconia and Palladium/zirconia Catalysts. Fresenius J. Anal. Chem. 341, 395–401. doi:10.1007/bf00321943
Shimanouchi, T. (1972). National Standards of Reference Data Services, 1. Washington, DC, USA: National Bureau of Standards.
Song, C. (2002). CO2 Conversion and Utilization: An Overview, CO2 Conversion and Utilization. American Chemical Society2002, 2–30.
Song, C. (2006). Global Challenges and Strategies for Control, Conversion and Utilization of CO2 for Sustainable Development Involving Energy, Catalysis, Adsorption and Chemical Processing. Catal. Today 115, 2–32. doi:10.1016/j.cattod.2006.02.029
Sun, K., Fan, Z., Ye, J., Yan, J., Ge, Q., Li, Y., et al. (2015). Hydrogenation of CO2 to Methanol over In2O3 Catalyst. J. CO2 Utilization 12, 1–6. doi:10.1016/j.jcou.2015.09.002
Turek, A. M., Wachs, I. E., and DeCanio, E. (1992). Acidic Properties of Alumina-Supported Metal Oxide Catalysts: an Infrared Spectroscopy Study. J. Phys. Chem. 96, 5000–5007. doi:10.1021/j100191a050
Visconti, C. G., Martinelli, M., Falbo, L., Infantes-Molina, A., Lietti, L., Forzatti, P., et al. (2017). CO2 Hydrogenation to Lower Olefins on a High Surface Area K-Promoted Bulk Fe-Catalyst. Appl. Catal. B: Environ. 200, 530–542. doi:10.1016/j.apcatb.2016.07.047
Wang, W., Jiang, X., Wang, X., and Song, C. (2018). Fe-Cu Bimetallic Catalysts for Selective CO2 Hydrogenation to Olefin-Rich C2+ Hydrocarbons. Ind. Eng. Chem. Res. 57, 4535–4542. doi:10.1021/acs.iecr.8b00016
Wang, W., Wang, S., Ma, X., and Gong, J. (2011). Recent Advances in Catalytic Hydrogenation of Carbon Dioxide. Chem. Soc. Rev. 40, 3703–3727. doi:10.1039/c1cs15008a
Wei, J., Ge, Q., Yao, R., Wen, Z., Fang, C., Guo, L., et al. (2017). Directly Converting CO2 into a Gasoline Fuel. Nat. Commun. 8, 15174. doi:10.1038/ncomms15174
Wei, J., Yao, R., Ge, Q., Wen, Z., Ji, X., Fang, C., et al. (2018). Catalytic Hydrogenation of CO2 to Isoparaffins over Fe-Based Multifunctional Catalysts. ACS Catal. 8, 9958–9967. doi:10.1021/acscatal.8b02267
Wei, W., and Jinlong, G. (2010). Methanation of Carbon Dioxide: an Overview. Front. Chem. Sci. Eng. 5, 2–10. doi:10.1007/s11705-010-0528-3
Willauer, H. D., Ananth, R., Olsen, M. T., Drab, D. M., Hardy, D. R., and Williams, F. W. (2013). Modeling and Kinetic Analysis of CO2 Hydrogenation Using a Mn and K-Promoted Fe Catalyst in a Fixed-Bed Reactor. J. CO2 Utilization 3-4, 56–64. doi:10.1016/j.jcou.2013.10.003
Yan, S.-R., Jun, K.-W., Hong, J.-S., Choi, M.-J., and Lee, K.-W. (2000). Promotion Effect of Fe-Cu Catalyst for the Hydrogenation of CO2 and Application to Slurry Reactor. Appl. Catal. A: Gen. 194-195, 63–70. doi:10.1016/s0926-860x(99)00354-3
Zhang, J., Lu, S., Su, X., Fan, S., Ma, Q., and Zhao, T. (2015). Selective Formation of Light Olefins from CO2 Hydrogenation over Fe-Zn-K Catalysts. J. CO2 Utilization 12, 95–100. doi:10.1016/j.jcou.2015.05.004
Keywords: CO2 hydrogenation, characterization, Fe-Cu catalyst, K promotion, CO2 adsorption, H2 adsorption
Citation: Wang W, Wang X, Zhang G, Wang K, Zhang F, Yan T, Miller JT, Guo X and Song C (2021) CO2 Hydrogenation to Olefin-Rich Hydrocarbons Over Fe-Cu Bimetallic Catalysts: An Investigation of Fe-Cu Interaction and Surface Species. Front. Chem. Eng. 3:708014. doi: 10.3389/fceng.2021.708014
Received: 11 May 2021; Accepted: 03 August 2021;
Published: 07 October 2021.
Edited by:
Florent Allais, AgroParisTech Institut des Sciences et Industries du Vivant et de L’environnement, FranceReviewed by:
Pattarapan Prasassarakich, Chulalongkorn University, ThailandBlaž Likozar, National Institute of Chemistry, Slovenia
Yong Yang, Qingdao Institute of Bioenergy and Bioprocess Technology, (CAS), China
Farhad Larki, layeroo, Iran
Copyright © 2021 Wang, Wang, Zhang, Wang, Zhang, Yan, Miller, Guo and Song. This is an open-access article distributed under the terms of the Creative Commons Attribution License (CC BY). The use, distribution or reproduction in other forums is permitted, provided the original author(s) and the copyright owner(s) are credited and that the original publication in this journal is cited, in accordance with accepted academic practice. No use, distribution or reproduction is permitted which does not comply with these terms.
*Correspondence: Xiaoxing Wang, xuw4@psu.edu; Chunshan Song, ChunshanSong@cuhk.edu.hk