 Carolina Luchetta
 Erica C. Oliveira Munsignatti
 Heloise O. Pastore
- Institute of Chemistry, University of Campinas, Campinas, Brazil
CO2 is the most important greenhouse gas involved in climate change; it has been a concern for many years and will remain as such in the years to come. CO2 adsorption and CO2 utilization have been studied as methods to mitigate the concentration of the gas in the atmosphere by sequestering and transforming it into a value-added product, capable of being commercialized. With those aims in mind, CO2 reduction into 3D graphene was studied using a Zn–Mg mixture. The results show that Mg is the only reducing agent, and Zn acted as a porogen during graphene formation as the energy released by the reaction between CO2 and Mg is enough to evaporate Zn. Thus, Zn vapor increases graphene porosity and increases the contact of CO2 with Mg, yielding larger masses of graphene. A relationship between the Zn–Mg ratio and the reaction yield was found.
Introduction
Global warming, resulting from the emission of greenhouse gases, has been a concern for several years. CO2 represents more than 60% of these gases, with an emission rate above 33 Gt/year. In the 1990s, the growth in CO2 emissions from fossil energy sources was around 0.9%/year. In the 2000s, the growth rate jumped more than three times to around 3%/year, decreasing again to 0.9%/year from 2010 onward (A (org.) (2020). Global, 2020). Although emission reductions in the United States and EU have been observed, emerging countries drive the growth of this rate. Investment in low-carbon technologies must go hand in hand, with the implementation of public policies aimed at the progressive reduction until the elimination of the use of fossil fuels (Peters et al., 2020).
Graphene is a carbon material; in fact, it is a single layer of graphite. Despite being studied for many years, interest in graphene has been growing in recent years, as it has very interesting physical, chemical, and mechanical properties. In 1940, a series of theoretical analyses suggested that a single layer of graphite, if isolated, could have particularly useful electrical characteristics, such as high conductivity (Dai et al., 2012). It is possible to obtain graphene by two different routes: top-down, the method to designate the preparation of graphene from graphite; bottom-up, which refers to obtaining graphene from the synthesis, starting from varied carbon sources (Huang et al., 2012). Pure graphene can be obtained by mechanical exfoliation of graphite (Novoselov et al., 2005). However, the most used method is the oxidation of graphite followed by its exfoliation (Huang et al., 2011). This work will focus on a specific bottom-up method: magnesiothermic reaction.
The ability of magnesium to reduce CO2 by forming graphitic structures (Luo et al., 2013) is known in the literature. There are some problems when the reaction is considered, the most important of which is the usual low yield and quality of graphene. In an attempt to eliminate these two drawbacks, an auxiliary metal could be a solution. By its physicochemical properties, zinc seemed to be adequate to improve yield and could also improve graphene quality (Luo et al., 2013).
The most used method for CO2 separation in post-combustion processes is the use of solvents, mainly amine-based (Ben-Mansour et al., 2016). The advantages are the high efficiency for CO2 capture (almost 98%), requirement of low gas pressure, and the possibility of recovery after use. There are disadvantages such as equipment corrosion, high cost of solvent regeneration, and the toxicity of amine-based solvents (Sevilla and Fuertes, 2011). To eliminate the corrosion problem and to reduce costs of regeneration, solid materials were studied, such as zeolites, activated carbons, alumina, and hollow fibers (Lee and Park, 2015; Bakhtyari et al., 2020), to name just a few.
Porous carbon materials are quite promising in CO2 capture and could be an option to amine solutions (Lee and Park, 2015; Bakhtyari et al., 2020). Porous carbons have some characteristics that could be of interest in the area of CO2 adsorption, such as thermal and chemical stabilities and large surface areas (Wang et al., 2012). Studies show that the adsorption of CO2 in porous materials is more efficient when subjected to an environment with high pressure when the material’s pores are larger than 1 nm. Materials with smaller pores favor the adsorption of carbon dioxide at 1 atm (Lee and Park, 2015). Therefore, the graphene produced here, in the absence and in the presence of Zn, was tested in CO2 capture at 1 atm pressure and compared with commercial graphene under the same reaction conditions.
Materials and Methods
Graphene Synthesis
Graphene synthesis was performed following the magnesiothermic method described in the literature (Luo et al., 2013), with modifications. The reactant metals were magnesium ribbon (99.5% Vetec) and granular zinc (99.5%, Sigma Aldrich).
The synthesis procedures were carried out using Zn/Mg M ratios of 0, 0.5, 1, 2, 3, 4, 5, and 6. The metals were transferred to an alumina boat, placed inside a tubular quartz reactor, and purged with CO2 (air liquid, 99,999%), at room temperature for 30 min. After this process, the reactor was subjected to a controlled flow of 70 cm3 min−1 CO2 (the flow was previously optimized using Mg), while heating was started at a rate of 3°C.min−1 up to the final temperature of 680°C; then CO2 flow and temperature were maintained for 3 h. After cooling the reactor, the product was removed from the boat, placed in a beaker containing 600 ml of 2 mol L−1 HCl solution, and kept under stirring at 500 rpm for 16 h, to remove the oxide by-products of the reaction and the unreacted metals. This suspension was then filtered through a cellulose filter. The remaining solid was washed with distilled water until the pH of the washing water was around 7. Finally, the filtrate was placed in an oven at 60°C for 24 h.
Graphene Characterization
X-ray diffraction (XRD) analyses were performed on a Shimadzu XRD 7000 diffractometer, operating in the continuous scanning mode using Cu Kα radiation, 40 kV voltage, and 30 mA current, at λ = 1.5418 Å, at room temperature, in the range of 10.0°–50.0° 2θ.
The Raman spectra were obtained on a Raman confocal spectrometer model Horiba Jobin Yvon T64000, using a laser source at 532 nm. The graphenization index is an average of, at least, three measurements.
The porosity of the materials was determined by nitrogen adsorption at cryogenic temperatures using the Autosorb equipment model Quantachrome Instruments Nova 4200 e. The samples were dehydrated under vacuum at temperatures of 100°C for about 16 h, and then subjected to increasing and cumulative aliquots of nitrogen, while being maintained at cryogenic temperature.
The CO2 adsorption capacity of graphene was determined through thermogravimetric analysis (TGA) using the Setaram SetSys Evolution 16/18 equipment. The samples were placed inside an alumina crucible, and the solid was submitted to inert atmosphere during heating to 150°C; it was maintained at that temperature, for 3 h, for dehydration and removal of any molecule adsorbed on the surface of the solid. After that time, the temperature was lowered to the adsorption temperature (25, 50, or 75°C) and the material was subjected to a CO2 flow at 1 atm, for 3 h. Then, the CO2 flow was replaced by He flow and maintained for 1 h to start the CO2 desorption. Right after, the temperature was again raised to 150°C for another 1 h to finish desorption.
Atomic force microscopy (AFM) analyses were performed on Nanosurf, model Easy Scan2 FlexAFM equipment. The samples were placed on a silicon wafer by dropping a sonicated graphene/benzene (0.5 mg/ml) dispersion and dried in an oven.
Results
Figure 1 shows the graphene x-ray diffractograms of samples prepared in this work, in the absence of Zn (Figure 1A) and with increasing concentrations of the second metal (Figure 1B–H). Two characteristic peaks can be observed at 26.0 and 43.5° 2θ, related to the 002 and 100 diffractions (Cai et al., 2014), respectively. The weak halo between 20 and 30° 2θ is the result of a certain extension of material disorganization.
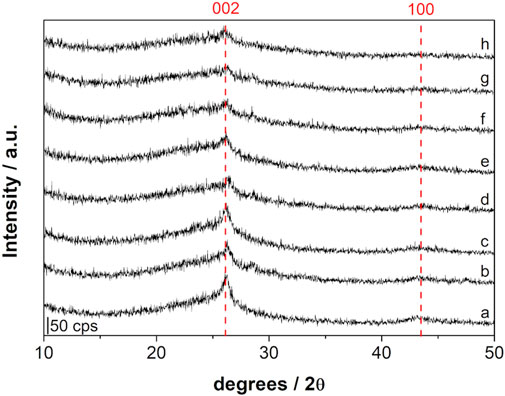
FIGURE 1. X-ray diffraction of samples obtained using. (A) only Mg (Zn/Mg = 0) and using Zn/Mg of. (B) 0.5, (C) 1.0, (D) 2.0, (E) 3.0, (F) 4.0, (G) 5.0, and (H) 6.0.
Raman spectroscopy was used to determine the graphenization index. This is the intensity ratio between the two characteristic bands of graphitic materials, the D band and the G band, that is the ID/IG index, presented in Figure 2. The D band, at 1,346 cm−1, corresponds to the bonds between sp (Dai et al., 2012) carbon atoms in the material, indicating the number of defects present in the structure of the material obtained, while the G band, at 1,579 cm−1, represents the characteristic bonds of graphene, between sp (Peters et al., 2020) carbon atoms. There is also a third band, called G’ or 2D (since it is approximately twice the frequency of the D band), which indicates the number of layers in the material, when it is not aggregated (Tian et al., 2016). Table 1 shows the values of ID/IG indexes and the standard deviation which provides the homogeneity of the solid: the lower the standard deviation, the more homogeneous the solid is. It is important to note that the measured graphenization index is close to one, or, in other words, the solids display a close concentration of C–C sp (Peters et al., 2020) bonds and C–C sp (Dai et al., 2012) defect. Only the samples prepared with Zn/Mg M ratios 3 and 4 present different graphenization indexes, being considered the best samples.
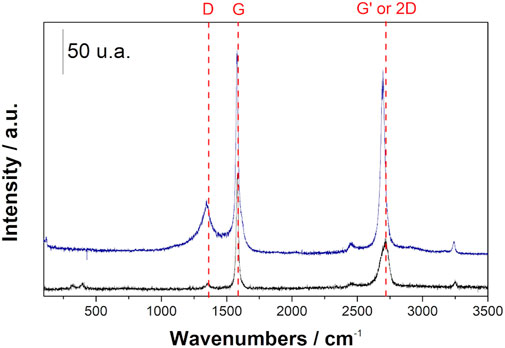
FIGURE 2. Raman spectra showing the D band, G band, and G’ or 2D band of commercial graphene.
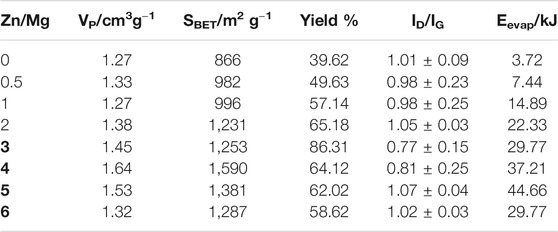
TABLE 1. Pore volume and yield of samples obtained using only Mg (ratio Zn/Mg = 0) and using zinc as an auxiliary metal with the Zn/Mg ratio between 0.5 and 6, graphenization index, and energy needed for total Zn evaporation at each particular Zn/Mg M ratio, in kJ.
Another important graphene characteristic is the porosity. Through the analysis of the N2 adsorption isotherm, as shown in Figure 3 (and Supplementary Material), pore volumes were obtained and are presented in Table 1. It is possible to see a large increase in the pore volume when zinc was added to the reaction: from 1.27 cm3 g−1 in Zn/Mg = 0 to 1.64 cm3 g−1 at Zn/Mg = 4, and decreasing again when Zn/Mg > 4.
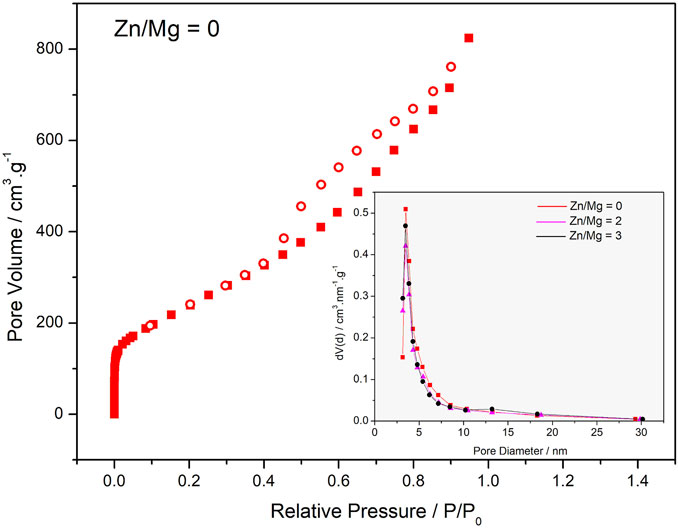
FIGURE 3. N2 adsorption isotherm of Zn/Mg = 0 sample, insert: BJH pore size distribution of samples Zn//Mg = 0(■), 2(▲) e 3 (●).
The adsorption isotherm of the sample Zn/Mg = 0, as shown in Figure 3, is a mixture of two types of isotherms: Type I(a) and Type IV(a).
Type I(a) isotherm presents adsorption of N2 at very low P/Po; it is related to the formation of a single layer of adsorbate on the solid surface. This is due to the adsorption on micropores. Type IV(a) isotherms are characteristics of mesoporous adsorbents where capillary condensation is accompanied by hysteresis. This is because the pore size exceeds the critical limit, which for adsorption of N2 at cryogenic temperatures is approximately 4 nm (Dreyer et al., 2010).
The desorption hysteresis of this material is Type H2(b) and is associated with cylindrical pores with necks whose diameter is smaller than the diameter of the cylinders, with a wide distribution of the pore neck width, through which N2 is released into the atmosphere (Dreyer et al., 2010).
The reaction yield, also presented in Table 1, shows us a trend of increased yields up to Zn/Mg = 3, decreasing after that. When only Mg was used to obtain graphene, the reaction yield was about 40%, increasing as the Zn/Mg ratios increase and reaching a maximum value of about 86% when the Zn/Mg M ratio was 3, at Zn/Mg > 3, decreased yields are observed. It is possible to conclude that the presence of zinc increases yield, more than duplicating it, but is deleterious at larger Zn/Mg M ratios.
Figure 4 shows the results of CO2 adsorption in the materials prepared by the method discussed here as compared with the performance of commercial graphene. It is clear that commercial graphene, as shown in Figure 4A, adsorbs very small amounts of CO2 under 1 atm: 0.02 mmol g−1 at 50°C. When graphene is prepared by the metallothermal method, using only magnesium, the performance changes considerably. The solid adsorbs CO2 in the three temperatures tested, being more efficient at the lowest temperature tested, 25°C. The values of adsorbed capacities for each temperature and material are shown in Table 2. When Zn is also present during graphene synthesis, an even better performance is observed, still at low temperatures. In this case, the material behaves very differently in the three temperatures. Another point to call attention is the fact that under certain conditions, not all CO2 adsorbed is released.
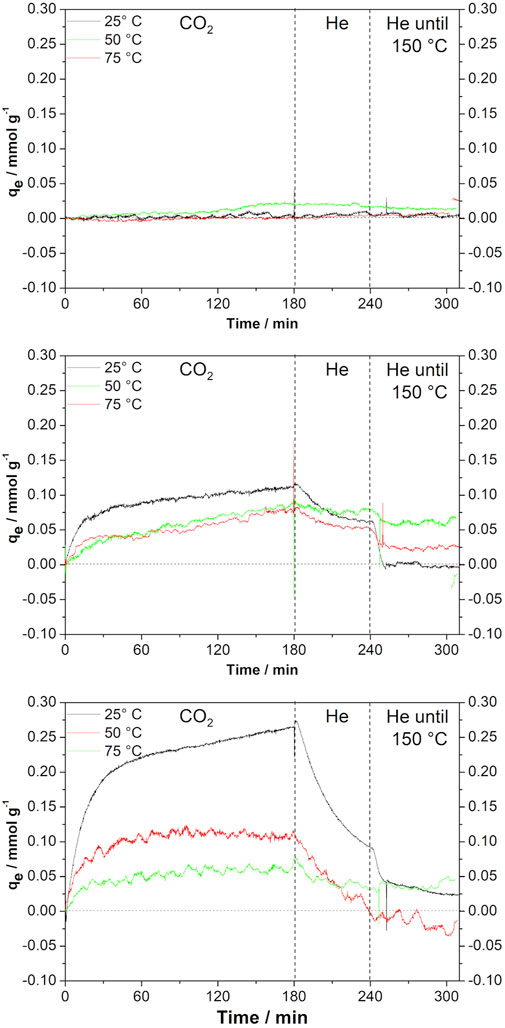
FIGURE 4. CO2 adsorption curves of (A) commercial graphene, (B) sample obtained using only Mg, and (C) sample using Zn/Mg = 3.
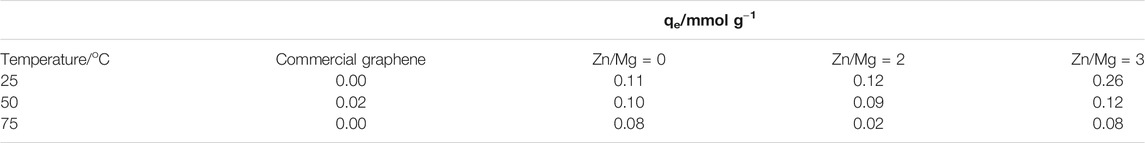
TABLE 2. Adsorption capacity, qe, of samples obtained using only Mg (ratio Zn/Mg = 0) and using zinc as the second metal with molar ratios of Zn/Mg = 2 and 3, at different temperatures.
The sample prepared with Zn/Mg M ratio 3 was characterized by AFM, as shown in Figure 5. Figure 5A shows the potential difference at various points in the sample: the green area of the image is the potential applied by the AFM tip when in contact with the sample holder; the small red dots correspond to positions where less conductive materials are deposited: the darker blue areas are those where the potential drop is greater, resulting in regions with larger conductivities in the sample. This potential drop is not uniform due to the large porosity presented by the material. The topography collected at the AFM shows the particle size range as 1.2–0.3 µm, as shown in Figura 5B, but there are also smaller particles in the range from 4 to 6 nm, as shown in Figure 5C.
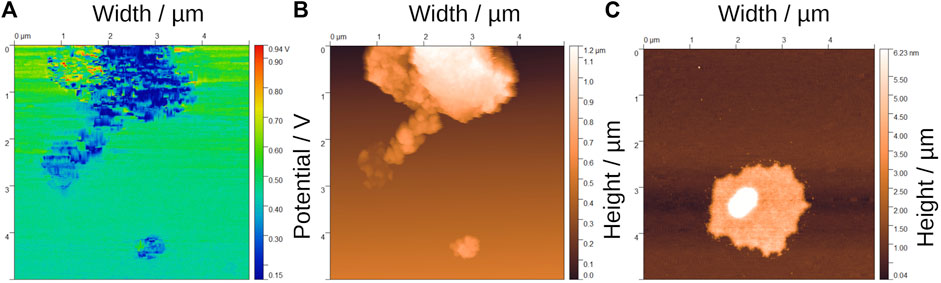
FIGURE 5. Atomic force microscopy (AFM) analyses of Zn/Mg = 3: (A) difference potential and (B) topology in the sample (C) topology of an isolated particle.
Discussion
Graphene Formation and Porosity in Metallothermal Reactions
The results show that the metallothermal preparation of graphene in the presence of zinc improves several characteristics in the material. To ascertain the role of zinc in the synthesis and assure that zinc was not another CO2 reductant with Mg, under the reaction conditions, a synthesis using only the auxiliary metal was performed, and, as expected, there was only the evaporation of a portion of the metal without the production of graphene.
The melting point of zinc is 4,195°C, so when the furnace achieves the reaction temperature, 680°C, zinc is in the liquid state, depositing on magnesium that is still in the solid state. Magnesium melting point is 650°C; as soon as the magnesium ribbons melt the reaction with CO2 starts. This reaction is extremely exothermic, releasing large amounts of heat. The heat released helps to explain the important role that zinc plays during CO2 reduction reaction.
The enthalpy of the CO2 reduction, with the Mg mass, was calculated from the enthalpies of formation of reagents and products, which is 24.99 kJ. The energies required to heat Zn to the boiling temperature and evaporate it in each Zn/Mg M ratio are presented in Table 1.
The comparison of the enthalpy of CO2 reduction with the values of energy needed to evaporate the zinc, in Table 1, shows that the heat released by the reduction reaction is enough to evaporate the zinc when the Zn/Mg M ratio is 3 and 4, that is, up to these molar ratios, the enthalpy of the reaction exceeds the heat absorbed by Zn for total evaporation, the question is then that there is not enough Zn to display the full effect of its presence.
Zinc vapor creates paths as it moves through Mg melt contained in the reaction boat. In turn, the part of magnesium internal in the drops and inaccessible to CO2 becomes available to react as the gas permeates the melt. That could explain both the increase in the yield and the porosity of the samples in going from Zn/Mg 0 to 3-4 at which values porosity, BET area, and yield achieve the maximum values.
At Zn/Mg M ratios of 5 and 6, the heat released by the CO2 reduction is not enough to evaporate the entire amount of Zn which is a melt at the reaction temperature. The liquid zinc possibly covers part of the Mg and hinders its contact with CO2, decreasing the reaction yield.
Figure 1 shows that the peak at 26°2θ has its intensity diminished as the Zn/Mg ratio increased while, at the same time, an increase in the halo starting at 20°2θ becomes more visible. This may have the same origin as the pore volume variation: the excess zinc prevents complete reaction and disorganizes the material.
CO2 Adsorption and Desorption
In relation to CO2 adsorption, it is clear the material obtained by the metallothermal method is rather different from the commercial graphene. In fact, the reduction of CO2 with Mg produces a material whose adsorption capacity is 10 times larger than the solid commercially available. Moreover, if Mg is assisted by Zn in the synthesis of graphene, then the adsorption capacity increases 25 times. The difference in adsorption capacity is important and advocates towards metallothermal graphene as a cheap, easily prepared solid for CO2 adsorption.
Another point to call attention on CO2 adsorption on metallothermal graphene is that the adsorption capacity qe diminishes as the temperature of adsorption increases from 25 to 755°C regardless of the Zn/Mg M ratio used in the synthesis; the decrease is more important for the most porous sample. This behavior could indicate a physisorption-based process.
There are some features in the CO2 desorption that deserve attention. A slow desorption process begins as soon as the CO2 flow stops, at the same temperature of adsorption, see Figure 3. This effect supports the idea that the adsorption is conducted by physisorption, but not entirely. Especially in the case of the most porous sample, curves in Figures 3A,C certain amount of CO2 is removed only at the temperature of 150°C, very fast in the first minutes at that temperature and slowly in 1 h. After that time, a small amount of CO2 is not desorbed, the curve for 25°C in Figure 3C for example, does not return to the dashed line at zero qe. This behavior suggests that there is a degree of chemisorption in the process of CO2 adsorption on metallothermal graphene.
The CO2 adsorption isotherms were conducted with the parameters adequate for open environments at atmospheric pressure, despite the knowledge that high gas pressures are needed for adsorption onto porous carbon materials with pores larger than 1 nm. Therefore, pore size does not seem to play a particularly important role; in fact, it seems that defects and superficial functional groups are the key elements in the studied process. As we can see in the insert of Figure 3, all samples present high concentration of pores with diameters around 4 nm. However, for the sample prepared with the Zn/Mg M ratio of 3, a slight mesopore formation is observed at approximately 13 nm.
Conclusion
CO2 can be reduced with Mg to graphene under certain reaction conditions. The solid obtained is more porous than commercial graphene and displays a graphenization index that suggests that it contains defects in the form of sp3 C atoms. The addition of Zn during graphene synthesis increases porosity even more, as well as the yield in graphene; if its concentration remains within a certain range, larger or smaller concentrations of Zn do not improve the porosity or yield. Metallothermal graphene can adsorb CO2 at temperatures as low as ambient; the desorption of the gas indicates that there may be two adsorption processes, one of them is physical and can be reverted at room temperature and the other bears characteristics of chemisorption, demanding higher temperatures for desorption.
Data Availability Statement
The original contributions presented in the study are included in the article/Supplementary Material; further inquiries can be directed to the corresponding author.
Author Contributions
Conceptualization, supervision, project financing, and final writing: HP. Bench supervision, experimental work, and initial writing: EO. Experimental work and initial writing: CL.
Funding
This work was completely funded by Petrobras. The authors are indebted to the PETROBRAS for the financial support and scholarship.
Conflict of Interest
The authors declare that the research was conducted in the absence of any commercial or financial relationships that could be construed as a potential conflict of interest.
Publisher’s Note
All claims expressed in this article are solely those of the authors and do not necessarily represent those of their affiliated organizations, or those of the publisher, the editors and the reviewers. Any product that may be evaluated in this article, or claim that may be made by its manufacturer, is not guaranteed or endorsed by the publisher.
Supplementary Material
The Supplementary Material for this article can be found online at: https://www.frontiersin.org/articles/10.3389/fceng.2021.707855/full#supplementary-material
References
Bakhtyari, A., Mofarahi, M., and Lee, C.-H. (2020). CO2 Adsorption by Conventional and Nanosized Zeolites. Adv. Carbon Capture 9, 193–228. doi:10.1016/B978-0-12-819657-1.00009-8
Ben-Mansour, R., Habib, M. A., Bamidele, O. E., Basha, M., Qasem, N. A. A., Peedikakkal, A., et al. (2016). Carbon Capture by Physical Adsorption: Materials, Experimental Investigations and Numerical Modeling and Simulations - A Review. Appl. Energ. 161, 225–255. doi:10.1016/j.apenergy.2015.10.011
Cai, J., Lv, X., Xing, Y., and Zhao, X. (2014). Carbon Dioxide Adsorption on Poly(vinylidene Chloride)-Based Carbons with Ultrahigh Microporosities Prepared by Facile Carbonization. Mater. Lett. 114, 37–39. doi:10.1016/j.matlet.2013.10.004
Dai, L., Chang, D. W., Baek, J.-B., and Lu, W. (2012). Carbon Nanomaterials for Advanced Energy Conversion and Storage. Small 8 (8), 1130–1166. doi:10.1002/smll.201101594
Dreyer, D. R., Ruoff, R. S., and Bielawski, C. W. (2010). From conception to Realization: an Historial Account of Graphene and Some Perspectives for its Future. Angew. Chem. Int. Ed. 49 (49), 9336–9344. doi:10.1002/anie.201003024
Huang, X., Qi, X., Boey, F., and Zhang, H. (2012). Graphene-based Composites. Chem. Soc. Rev. 41 (2), 666–686. doi:10.1039/C1CS15078B
Huang, X., Yin, Z., Wu, S., Qi, X., He, Q., Zhang, Q., et al. (2011). Graphene-Based Materials: Synthesis, Characterization, Properties, and Applications. small 7 (14), 1876–1902. doi:10.1002/smll.201002009
IEA (org.) (2020). Global CO2 Emissions in 2019. Available at: https://www.iea.org/articles/global-co2-emissions-in-2019 (Accessed on April 30 2021).
Lee, S.-Y., and Park, S.-J. (2015). A Review on Solid Adsorbents for Carbon Dioxide Capture. J. Ind. Eng. Chem. 23, 1–11. doi:10.1016/j.jiec.2014.09.001
Luo, W., Wang, B., Wang, X., Stickle, W. F., and Ji, X. (2013). Production of Graphene by Reduction Using a Magnesiothermic Reaction. Chem. Commun. 49 (91), 10676–10678. doi:10.1039/C3CC46368K
Malard, L. M., Pimenta, M. A., Dresselhaus, G., and Dresselhaus, M. S. (2009). Raman Spectroscopy in Graphene. Phys. Rep. 473 (5-6), 51–87. doi:10.1016/j.physrep.2009.02.003
Novoselov, K. S., Jiang, D., Schedin, F., Booth, T. J., Khotkevich, V. V., Morozov, S. V., et al. (2005). Two-dimensional Atomic Crystals. Proc. Natl. Acad. Sci. 102 (30), 10451–10453. doi:10.1073/pnas.0502848102
Peters, G. P., Andrew, R. M., Canadell, J. G., Friedlingstein, P., Jackson, R. B., Korsbakken, J. I., et al. (2020). Carbon Dioxide Emissions Continue to Grow amidst Slowly Emerging Climate Policies. Nat. Clim. Chang. 10 (1), 3–6. doi:10.1038/s41558-019-0659-6
Sevilla, M., and Fuertes, A. B. (2011). Sustainable Porous Carbons with a superior Performance for CO2 Capture. Energy Environ. Sci. 4 (5), 1765–1771. doi:10.1039/C0EE00784F
Thommes, M., Kaneko, K., Neimark, A. V., Olivier, J. P., Rodriguez-Reinoso, F., Rouquerol, J., et al. (2015). Physisorption of Gases, with Special Reference to the Evaluation of Surface Area and Pore Size Distribution (IUPAC Technical Report). Pure Appl. Chem. 87 (9-10), 1051–1069. doi:10.1515/pac-2014-1117
Tian, Z., Qiu, Y., Zhou, J., Zhao, X., and Cai, J. (2016). The Direct Carbonization of Algae Biomass to Hierarchical Porous Carbons and CO 2 Adsorption Properties. Mater. Lett. 180, 162–165. doi:10.1016/j.matlet.2016.05.169
Wang, R., Wang, P., Yan, X., Lang, J., Peng, C., and Xue, Q. (2012). Promising Porous Carbon Derived from Celtuce Leaves with Outstanding Supercapacitance and CO2 Capture Performance. ACS Appl. Mater. Inter. 4 (11), 5800–5806. doi:10.1021/am302077c
Keywords: carbon dioxide, capture, transformation, graphene, metallothermal reaction
Citation: Luchetta C, Oliveira Munsignatti EC and Pastore HO (2021) CO2 Metallothermal Reduction to Graphene: The Influence of Zn. Front. Chem. Eng. 3:707855. doi: 10.3389/fceng.2021.707855
Received: 10 May 2021; Accepted: 08 July 2021;
Published: 18 August 2021.
Edited by:
Moises Boises-Neto, Federal University of Ceara, BrazilCopyright © 2021 Luchetta, Oliveira Munsignatti and Pastore. This is an open-access article distributed under the terms of the Creative Commons Attribution License (CC BY). The use, distribution or reproduction in other forums is permitted, provided the original author(s) and the copyright owner(s) are credited and that the original publication in this journal is cited, in accordance with accepted academic practice. No use, distribution or reproduction is permitted which does not comply with these terms.
*Correspondence: Heloise O. Pastore, bG9sbHlAdW5pY2FtcC5icg==