 Yiwen Wang1,2
 Yue Wang1,2Wenjie Han1,2
 Mengzhen Han1,2
 Xiaolin Liu3Jianying Dai4
 Yuesheng Dong4
 Tao Sun1,5,6*
 Junnan Xu1,2,6*
- 1Department of Breast Medicine 1, Cancer Hospital of China Medical University, Liaoning Cancer Hospital, Shenyang, China
- 2Department of Pharmacology, Cancer Hospital of China Medical University, Liaoning Cancer Hospital, Shenyang, China
- 3Department of Bioinformatics, Kanghui Biotechnology Co., Ltd., Shenyang, China
- 4School of Bioengineering, Dalian University of Technology, Dalian, Liaoning, China
- 5Department of Oncology Medicine, Key Laboratory of Liaoning Breast Cancer Research, Shenyang, Liaoning, China
- 6Department of Breast Medicine, Cancer Hospital of Dalian University of Technology, Liaoning Cancer Hospital, Shenyang, China
Background: The relationship between dysbiosis of the gastrointestinal microbiota and gastric cancer (GC) has been extensively studied. However, microbiota alterations in GC patients vary widely across studies, and reproducible diagnostic biomarkers for early GC are still lacking in multiple populations. Thus, this study aimed to characterize the gastrointestinal microbial communities involved in gastric carcinogenesis through a meta-analysis of multiple published and open datasets.
Methods: We analyzed 16S rRNA sequencing data from 1,642 gastric biopsy samples and 394 stool samples across 11 independent studies. VSEARCH, QIIME and R packages such as vegan, phyloseq, cooccur, and random forest were used for data processing and analysis. PICRUSt software was employed to predict functions.
Results: The α-diversity results indicated significant differences in the intratumoral microbiota of cancer patients compared to non-cancer patients, while no significant differences were observed in the fecal microbiota. Network analysis showed that the positive correlation with GC-enriched bacteria increased, and the positive correlation with GC-depleted bacteria decreased compared to healthy individuals. Functional analyses indicated that pathways related to carbohydrate metabolism were significantly enriched in GC, while biosynthesis of unsaturated fatty acids was diminished. Additionally, we investigated non-Helicobacter pylori (HP) commensals, which are crucial in both HP-negative and HP-positive GC. Random forest models, constructed using specific taxa associated with GC identified from the LEfSe analysis, revealed that the combination of Lactobacillus and Streptococcus included alone could effectively discriminate between GC patients and healthy individuals in fecal samples (area under the curve (AUC) = 0.7949). This finding was also validated in an independent cohort (AUC = 0.7712).
Conclusions: This study examined the intratumoral and fecal microbiota of GC patients from a dual microecological perspective and identified Lactobacillus, Streptococcus, Roseburia, Faecalibacterium and Phascolarctobacterium as intratumoral and intestinal-specific co-differential bacteria. Furthermore, it confirmed the validity of the combination of Lactobacillus and Streptococcus as GC-specific microbial markers across multiple populations, which may aid in the early non-invasive diagnosis of GC.
1 Introduction
Gastric cancer (GC) ranks as the fifth most common cancer and the fourth leading cause of cancer deaths globally (Yang et al., 2023). While GC’s incidence and mortality rates have declined over recent decades, in China, GC remains the third most prevalent and deadly among all malignant tumors (Huang et al., 2023; Yang et al., 2023). Conversely, in Japan and South Korea, where GC also presents high incidence rates, significant reductions in mortality have been achieved through widespread endoscopic screening, which facilitates the early detection of GC (Namasivayam, 2023). This fact highlights the significance of early screening. Currently, the gold standard for early diagnosis of GC involves endoscopy and biopsy, both costly and invasive techniques that have resulted in low screening acceptance (Mejía-Guarnizo et al., 2023). Consequently, there is a pressing need for more precise, accessible, low-cost, and non-invasive biomarkers to assist in the early diagnosis of GC and monitoring for relapse.
Helicobacter pylori (HP) is classified as a class I carcinogen for GC (Weng et al., 2019; Yang et al., 2021). Effective eradication of HP can significantly reduce the risk of developing GC (Li et al., 2023; Yarahmadi and Afkhami, 2024). However, eradicating HP does not entirely prevent the development of GC (Cheung and Leung, 2018). Many studies have observed that as HP-positive GC progresses, the relative abundance of HP tends to decrease, concomitant with an increase in the relative abundance of some other bacteria (Ferreira et al., 2018; Hsieh et al., 2018; Liu et al., 2022a). Additionally, HP-negative GC constitutes approximately 0.42% to 5.4% of all GC cases (Yamamoto et al., 2015). Thus, other gastric microorganisms apart from HP may also play roles in gastric carcinogenesis. Lertpiriyapong et al. observed that HP mice colonized with complex or restricted microbiota were more susceptible to developing GC than germ-free and HP-monoassociated mice (Lertpiriyapong et al., 2014). Furthermore, even in the absence of HP infection, three commensal bacteria have been shown to induce gastritis and dysplasia in mice (Lertpiriyapong et al., 2014). These findings suggest that non-HP microorganisms may contribute to the development of GC, either alongside or independent of HP, necessitating further investigation.
With the continuous advancement of microbial analysis techniques and methods, many independent studies employing 16S ribosomal RNA (rRNA) sequencing have revealed changes in the gastric microbiota of non-GC populations and GC patients (Castaño-Rodríguez et al., 2017; Yu et al., 2017; Coker et al., 2018; Chen et al., 2019; Peng et al., 2023). Notably, the intestinal microbiota from GC patients, a critical source of gastric microbiota, also exhibits changes (Qi et al., 2019; Wu et al., 2020; Liu et al., 2021b; He et al., 2022b). Microbial markers based on fecal samples offer more accessible and non-invasive alternatives than those based on gastric tissue samples. Nevertheless, the reports of changes in intratumoral and fecal microbiota in GC are inconsistent across studies, likely due to variations in subjects’ age and gender, geographic locations, and sequencing techniques. Additionally, few studies have focused on predicting GC by microbial markers based on fecal samples, and the reproducibility and accuracy of these markers remain uncertain. Hence, a comprehensive multi-cohort analysis is necessary to minimize the interference of various confounding factors and establish consistency across multiple studies (Wu et al., 2021). In this study, we integrated and reanalyzed 16S rRNA sequencing data from 1,642 gastric biopsy samples and 394 stool samples across 11 independent studies. We detailed changes in the composition and taxonomic classification of the gastrointestinal microbiota during GC progression. Differences in associated networks and functions between healthy individuals and GC patients in gastric tissue samples were investigated. Moreover, we characterized the microbiota changes associated with developing of HP-negative and HP-positive GC. Finally, microbial markers capable of distinguishing GC patients from healthy individuals were identified and validated. Our goal is to combine the intratumoral microbiota and fecal microbiota of GC patients in a meta-analysis so as to explore the key differential flora during gastric carcinogenesis from a dual microecological perspective and to provide a new method for early screening of GC by constructing random forest models.
2 Methods
2.1 Literature search and study selection
An exhaustive literature search was conducted on August 9, 2023, utilizing PubMed, Web of Science, and Embase databases. Detailed search formulas are documented in (Supplementary Table S1). The language was restricted to English, and types such as reviews, meta-analyses, and case reports were excluded. Two authors independently reviewed the title and abstract of each study, and the full text was retrieved if the abstract content warranted further examination. Additional manual searches of the reference lists were conducted to ensure a thorough literature search. The selected studies had to meet the following criteria: (1) raw gene sequencing data could be downloaded and grouped; (2) used fecal or gastric tissues as samples; (3) included GC and normal or benign controls. However, patients who had undergone radiotherapy or chemotherapy or had been treated with antibiotics or probiotics within the past month were excluded.
2.2 Data acquisition and processing
The accession number (BioProject ID) was entered into the Sequence Read Archive (SRA) database to download the sequencing and biosample data. After the FASTQ files were extracted, they were de-multiplied. Raw data were integrated using VSEARCH software (v2.18.0) to cut out primers and barcodes and filter low-quality data (Rognes et al., 2016). After removing duplicates and denoising, the obtained clean data were integrated again to generate feature tables and representative sequences. Operational taxonomic units (OTUs) with relative abundance means of less than 0.01% were discarded, and the remaining sequences constituted the final representative sequences. Microbiome analysis and clustering of the final representative sequences were conducted using Quantitative Insights Into Microbial Ecology (QIIME1), and comparisons were made with the Greengenes database (version 13.8). We annotated the OTUs with species classification information using the Ribosomal Database Project (RDP) Classifier, counted the relative abundance of species separately, from phylum to genus, and plotted the species relative abundance distribution. The OTUs table generated was utilized for subsequent analyses.
2.3 Data analysis
2.3.1 Confounder analysis
Analysis of variance (ANOVA)-type analyses quantified the influence of potential confounders and disease status associated with GC on individual genera (Wirbel et al., 2019). The total variance in a given genus abundance was compared to that explained by disease status and confounders (age, body mass index (BMI), HP, biopsy site, sex, and study), similar to a linear model. Given the non-Gaussian distribution of microbiota abundance, variance calculations were performed on rankings. Continuous values of potential confounders were converted to discrete variables, either to quartiles or by categorizing individuals according to BMI as (thin < 25, 25 < obese < 30, and overweight > 30) (Wang et al., 2022).
2.3.2 Microbial diversity analysis
Microbial diversity analysis was conducted using the vegan package in R. The Shannon and Chao 1 indices estimated the microbial alpha diversity based on the OTUs table, and the Wilcoxon Rank-Sum test was employed to compare differences between the two groups. The Beta diversity of the microbiota between the samples was measured using the phyloseq package in R, according to the Bray-Curtis difference matrix, and visualized with principal coordinate analysis (PCoA). Additionally, analysis of similarities (Anosim) was applied to assess the significance of differences between different groups.
2.3.3 Species difference analysis
Based on the feature table and species annotation results, linear discriminant analysis (LDA) effect size (LEfSe) (LDA > 2.0, p < 0.05) was utilized to identify biomarkers between groups, which are species or genes with significant differences between groups (Chang et al., 2022). The Kruskal-Wallis Rank-Sum test was employed for LEfSe analysis.
2.3.4 Microbial correlation network analysis
Spearman correlation coefficients were used to assess the correlations between differential genera identified from the LEfSe analysis using the R package cooccur (Zou et al., 2017). Visualization was performed using Cytoscape V.3.7.2, which displayed significant co-occurrence and co-exclusion interactions (correlation coefficients ≥ 0.3, p < 0.01).
2.3.5 Function prediction
Functional prediction was conducted using Phylogenetic Investigation of Communities by Reconstruction of Unobserved States (PICRUSt) (v2.4.2) software (Langille et al., 2013). The Kyoto Encyclopedia of Genes and Genomes (KEGG) database was used for functional annotation, and functional abundance profiles were obtained (Kanehisa et al., 2021). The pathways that were significantly altered between the two groups were identified using LEfSe (Logarithm value > 3.0, p < 0.01) at the KEGG level 3.
2.3.6 Construction and validation of the machine learning models
The random forest (RF) package in R was utilized for modeling, employing default parameters to differentiate between GC and healthy individuals. Based on species annotation results, the relative abundance dataset was randomized into training and test sets, which were separately trained and validated for performance in a 7:3 ratio at the genus level (Liu et al., 2022b). “Mean decrease accuracy” was employed as a screening metric to identify core biomarkers for modeling. Subsequently, a ten-fold cross-validation of the RF model was conducted to determine the model error values. The diagnostic capability of the model was evaluated by plotting the receiver operating characteristic (ROC) curve using the R package pROC and calculating the area under the curve (AUC) (Han et al., 2023). External validation was also performed, incorporating additional independent data to confirm the model’s reproducibility. Furthermore, study-to-study transfer and leave-one-dataset-out (LODO) validations were conducted to demonstrate the model’s generalizability. In study-to-study transfer validation, one study was used to construct the RF model, and the remaining studies served as external test data to evaluate the model. In LODO validation, data from one study was used as the test set, while the remaining data served as the training set. AUC crossover calculations were then performed on the identified important features, and heat maps were plotted (Wirbel et al., 2019).
3 Results
3.1 Characteristics of the data sets in meta-analysis
According to the inclusion criteria, 998 articles retrieved from PubMed, Web of Science, and Embase databases were critically reviewed, and one additional record was identified by reviewing references in the included literature. Figure 1A illustrates the screening process for this study. A total of 14 studies met our inclusion criteria. One study was excluded because species information could not be annotated during data processing (Ferreira et al., 2018). Ultimately, 16S rRNA sequencing datasets from 11 studies were included to estimate the signatures of gastrointestinal microbial communities associated with gastric carcinogenesis. Two additional studies were used to validate classification models. Ethical approval and written informed consent from patients were obtained for all included studies. Details of all cohorts used in this meta-analysis are provided in Table 1, which included 394 stool samples and 1,642 gastric tissue samples. Sample collection methods (Figure 1B) and processing methods for each study are detailed in Supplementary Table S2 and Supplementary Table S3. These studies involved populations from China, South Korea, and Colombia, with a majority focused on Asia, particularly China (Figure 1C).
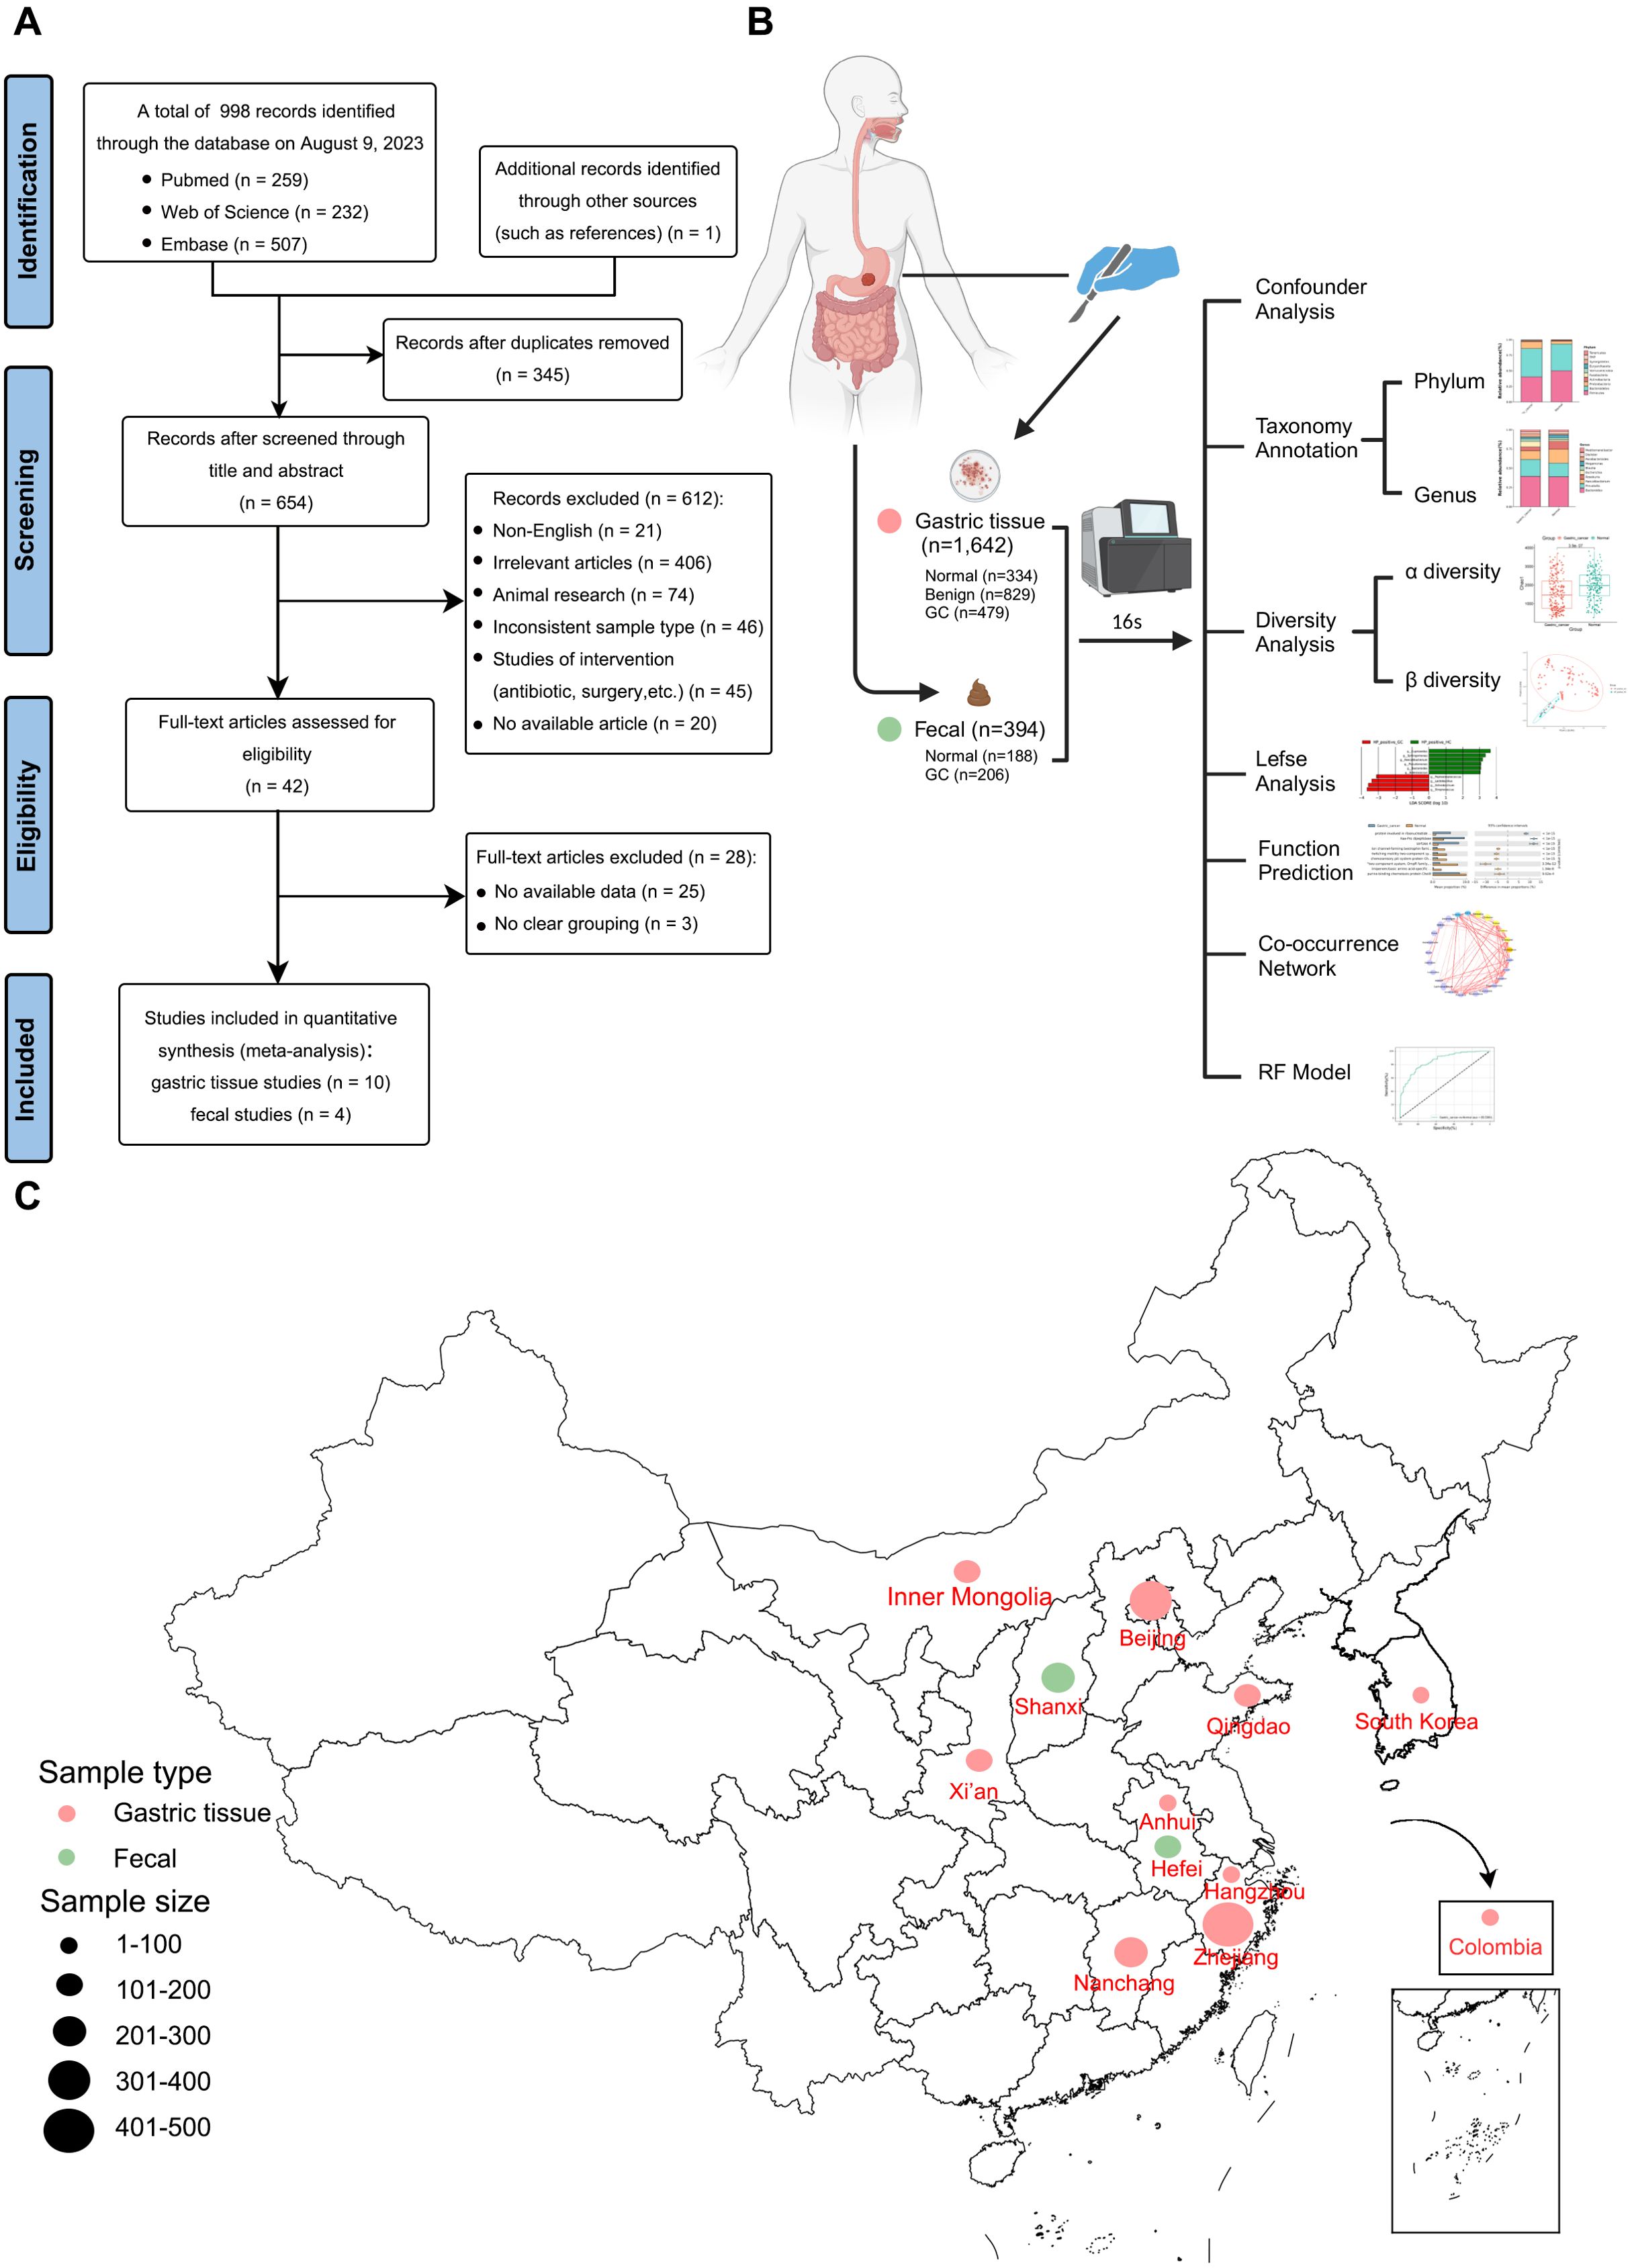
Figure 1. Meta-analysis flowchart. (A) Flowchart of the screening article process. (B) Schematic diagram of sample collection and bioinformatics workflow (Created with BioRender.com). (C) Geographic location of the dataset used in this study, with larger points representing larger sample sizes.
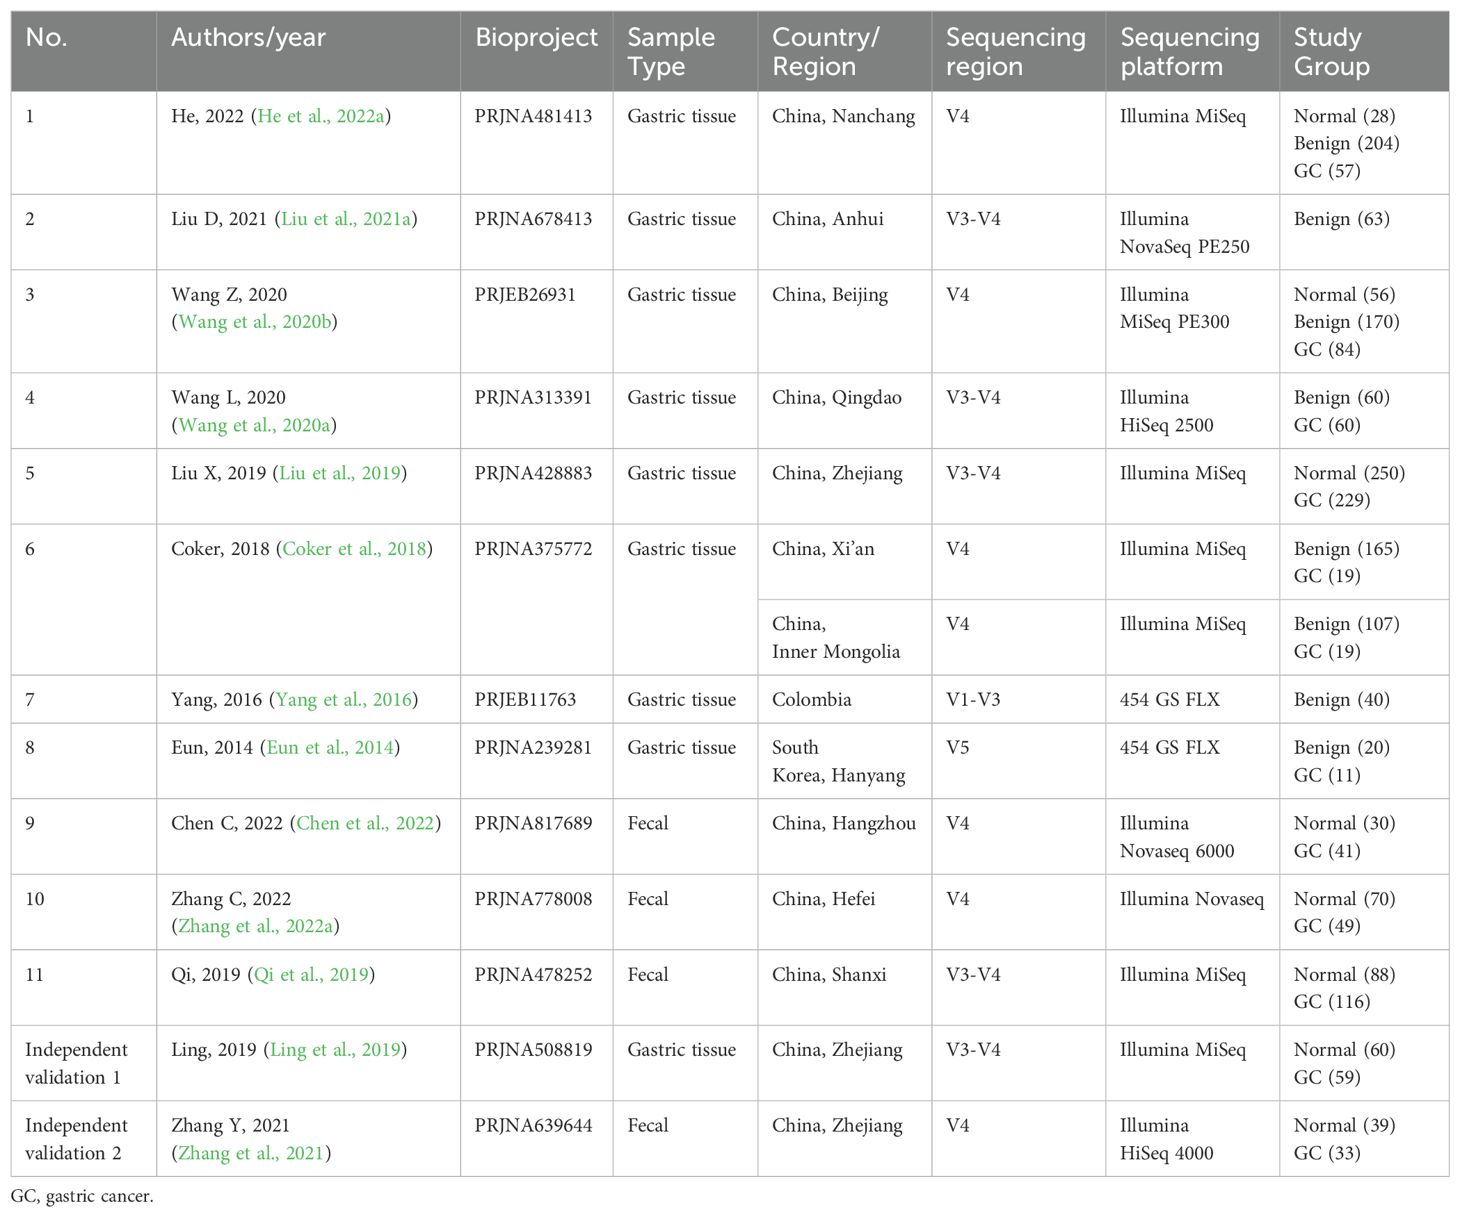
Table 1. Study characteristics of gastric tissue and intestinal datasets included in the meta-analysis.
3.2 Confounder analysis of microbiota associated with GC
Considering the biological and technical variations among studies, we quantified the impact of all possible confounders associated with GC (age, BMI, HP, biopsy site, sex, and study) on gastrointestinal microbiota composition and compared these with disease status. The results indicated that the study, biopsy site, and HP status exerted the most significant impacts on microbiota composition (Supplementary Figures S1–S3).
3.3 Alterations in the composition of the gastric microbiota and its functions and networks in GC
3.3.1 Alterations in the composition of the gastric microbiota in GC
The Shannon index revealed the highest microbial diversity was in the normal group compared to other stages. No significant difference was found between the benign and GC groups (Figure 2A). The Chao1 index (Supplementary Figure S4A) indicated the highest abundance in the benign group, followed by the normal group, with the lowest in the GC group, likely influenced by the larger sample size of the benign group. PCoA demonstrated that the diversity captured by the first two principal coordinates accounted for about 23% (Figure 2B). Due to the large size of the gastric tissue samples, some samples appeared to overlap. Still, the ANOSIM (R = 0.3749, P = 0.001) confirmed significant differences between the three stages, indicating that the samples could still be separated.
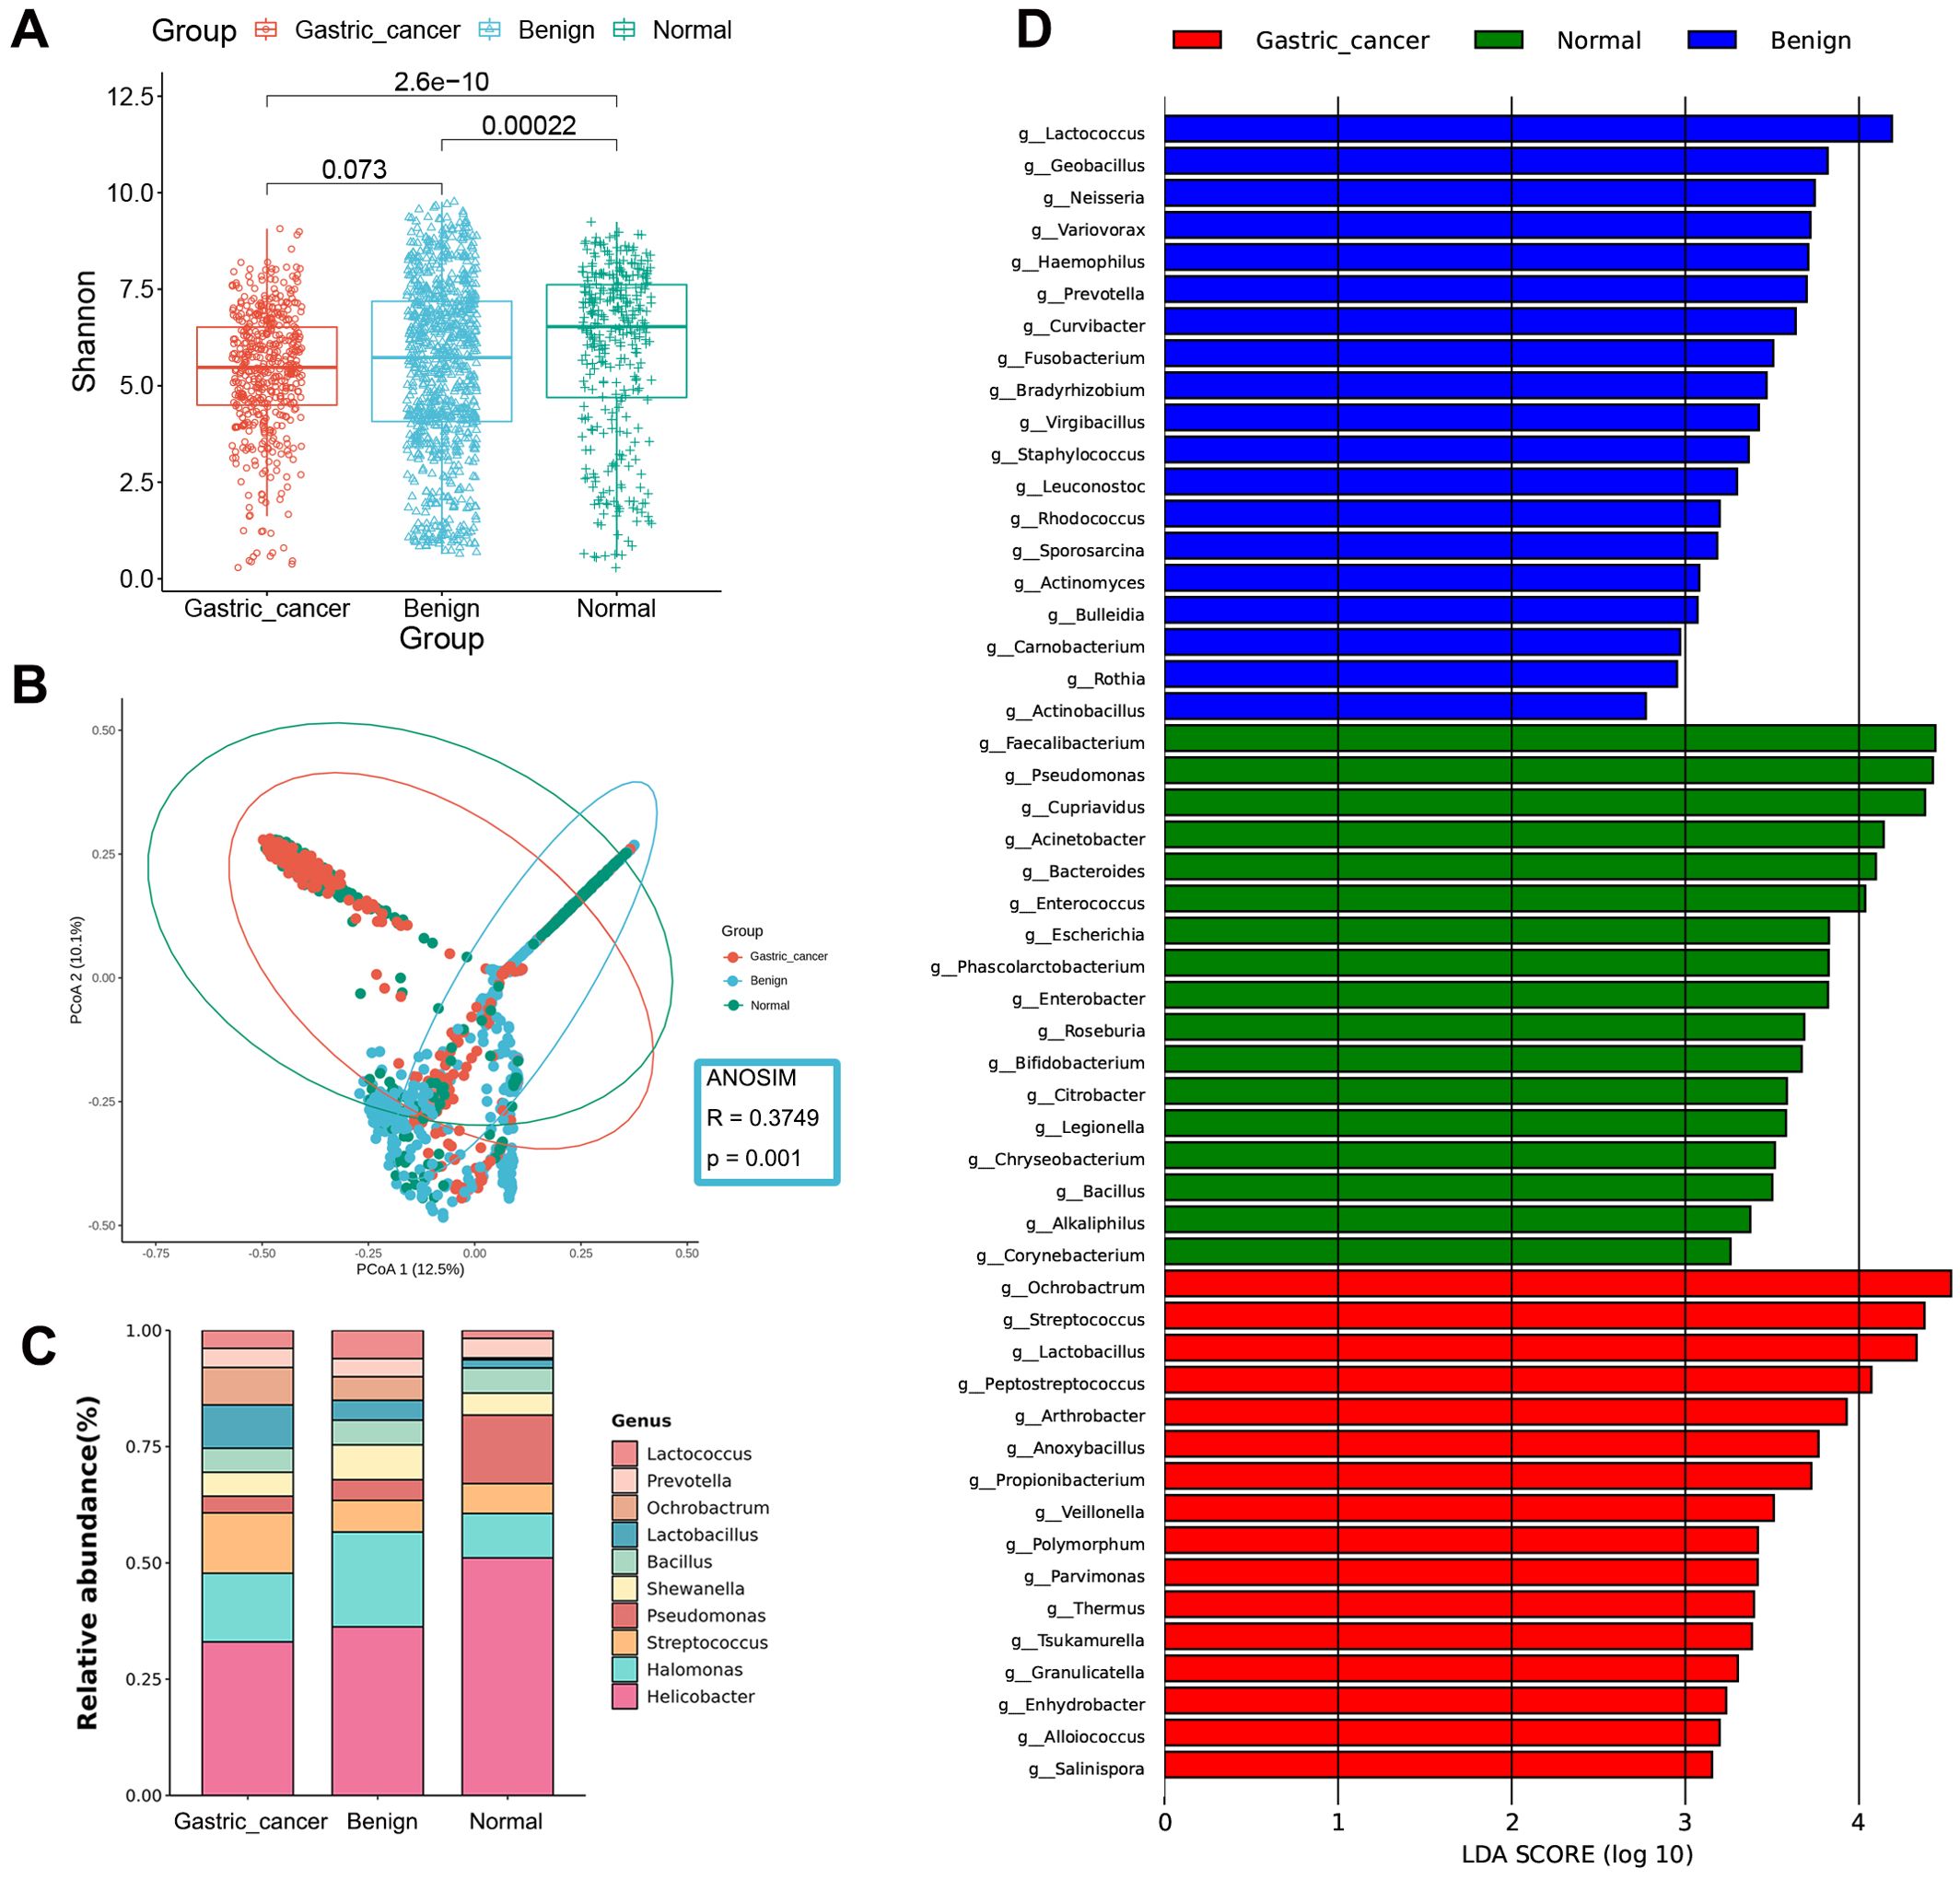
Figure 2. Gastric microbial composition and differential analysis of gastric cancer, benign, and normal groups. (A) Comparison of α-diversity among the three groups using the Shannon index. (B) PCoA plots based on the Bray-Curtis distance show differences in β-diversity between samples. (C) Taxonomic composition of gastric tissue samples at the genus level. (D) Bar chart of the distribution of LDA values (LDA > 2). PCoA, principal coordinate analysis; LDA, linear discriminant analysis.
At the phylum level, the gastric microbiota was dominated by Proteobacteria, Firmicutes, Bacteroidetes, Actinobacteria, and Cyanobacteria (Supplementary Figure S5A). Firmicutes and Actinobacteria increased sequentially over the course of the disease, whereas Bacteroidetes decreased. At the genus level, the abundance of Streptococcus, Lactobacillus, and Ochrobactrum was significantly higher in the GC stage compared to the non-cancerous stages, while Helicobacter and Pseudomonas were significantly less abundant (Figure 2C).
LEfSe analysis was employed to identify differences in bacterial taxa between the GC, benign, and normal groups. The GC group was characterized by a higher presence of Ochrobactrum and Streptococcus, the benign group by Lactococcus and Geobacillus, and the normal group by Faecalibacterium and Pseudomonas (Figure 2D, Supplementary Figure S6A and Supplementary Table S4).
3.3.2 Association network analysis of the gastric microbiota
To examine the interactions between GC-enriched and GC-depleted bacteria from the LEfSe analysis, we constructed association networks of the gastric microbiota by calculating correlations in the normal and GC groups using the Spearman correlation coefficient. As illustrated in Figure 3A, interactions within the gastric microbiota primarily occurred between Firmicutes and Proteobacteria, the two dominant phyla. The networks in the GC group were more tightly clustered and exhibited more complex co-occurring interactions compared to the normal group, indicating that the development of GC may enhance pre-existing interactions within the gastric microbiota. Positive correlations between GC-enriched bacteria, such as those between Polymorphum and Arthrobacter, gradually increased with GC progression. Conversely, positive correlations between GC-depleted bacteria decreased over the course of GC development, notably between Bifidobacterium and Phascolarctobacterium. Meanwhile, negative correlations between GC-enriched and GC-depleted bacteria gradually increased with the development of GC, such as the interactions between Arthrobacter and Bifidobacterium, Thermus and Faecalibacterium.

Figure 3. Correlation network analysis and differential functional prediction of gastric microbiota. (A) Correlation network of gastric cancer-associated differential bacteria in normal and gastric cancer groups. The Spearman algorithm estimated correlation strengths (|ρ| ≥ 0.3, p < 0.01). The left circle shows gastric cancer-associated depleted bacteria and the right circle shows gastric cancer-associated enriched bacteria. The depleted bacteria are marked in green font, while the enriched bacteria are marked in red font. Different colored dots indicate different phylum levels. Red lines indicate co-occurrence, gray lines indicate co-exclusion and the thickness of the line indicates the strength of the interaction. (B) The differential functions between normal and gastric cancer groups were predicted. The LDA bar plot displays the top 20 pathways that are significantly altered (Logarithm value > 3.0, P < 0.01). LDA, linear discriminant analysis.
3.3.3 Microbial functional changes in the GC
The functional potential of the gastric microbiota in the GC and normal groups was predicted using PICRUSt. Lefse analysis identified a total of 75 differential pathways between the two groups, with 35 KEGG pathways significantly up-regulated and 40 significantly down-regulated in GC (Figure 3B, Supplementary Table S5). Specifically, pathways related to carbohydrate metabolism, nucleotide metabolism, and DNA damage repair were enriched in the GC group compared to the normal group. Conversely, pathways related to biosynthesis of unsaturated fatty acids, epithelial cell signaling in HP infection, and bacterial synthesis and motility were reduced in GC.
3.4 Changes in the microbiota associated with the development of HP-negative and HP-positive GC
All gastric tissue studies in this meta-analysis declared in their methods section that HP testing was performed (Supplementary Table S2). However, many of them did not have explicit supplementary tables or information about HP status, which made it difficult for us to conduct discussions between HP-positive and HP-negative groups. Therefore, we attempted to take the approach of Kim et al. who determined that 1% could be used as a cutoff value for HP colonization by 16S rRNA gene pyrosequencing (Kim et al., 2015). Finally, we categorized samples with HP relative abundance greater than 1% as the HP-positive group and those with less than 1% as the HP-negative group (Supplementary Table S6).
In HP-negative samples, the abundance and diversity of the gastric microbiota were significantly higher in the normal group than in the GC group, as determined by the Chao 1 index and the Shannon index (Supplementary Figure S4C, Figure 4A). In addition, based on the PCoA analysis of the Bray-Curtis distance, we found a significant difference in the distribution of the gastric microbiota between these two stages, with a distribution change of 12.7% for PCoA1 and 9.4% for PCoA2 (Figure 4B). Anosim further supported this conclusion (R = 0.1302, P = 0.001). The above results indicated significant differences in species diversity and composition of gastric microbiota between the HP-negative GC group and the HP-negative normal group. Proteobacteria, Firmicutes and Bacteroidetes were the dominant phyla in both groups (Supplementary Figure S5C). At the genus level, there was a significant increase in the abundance of Lactobacillus, Streptococcus, and Ochrobactrum and a decrease in the abundance of Pseudomonas and Faecalibacterium (Figure 4C). Twenty-one genera were identified by LEfSe analysis (Figure 4D, Supplementary Table S7), with nine genera enriched in the HP-negative GC group, including Arthrobacter, Geobacillus, Lactobacillus, Lactococcus, Streptococcus, and Peptostreptococcus. Conversely, twelve genera were depleted in this group, including Bifidobacterium, Bacteroides, Enterococcus, Roseburia, Faecalibacterium, and Phascolarctobacterium.
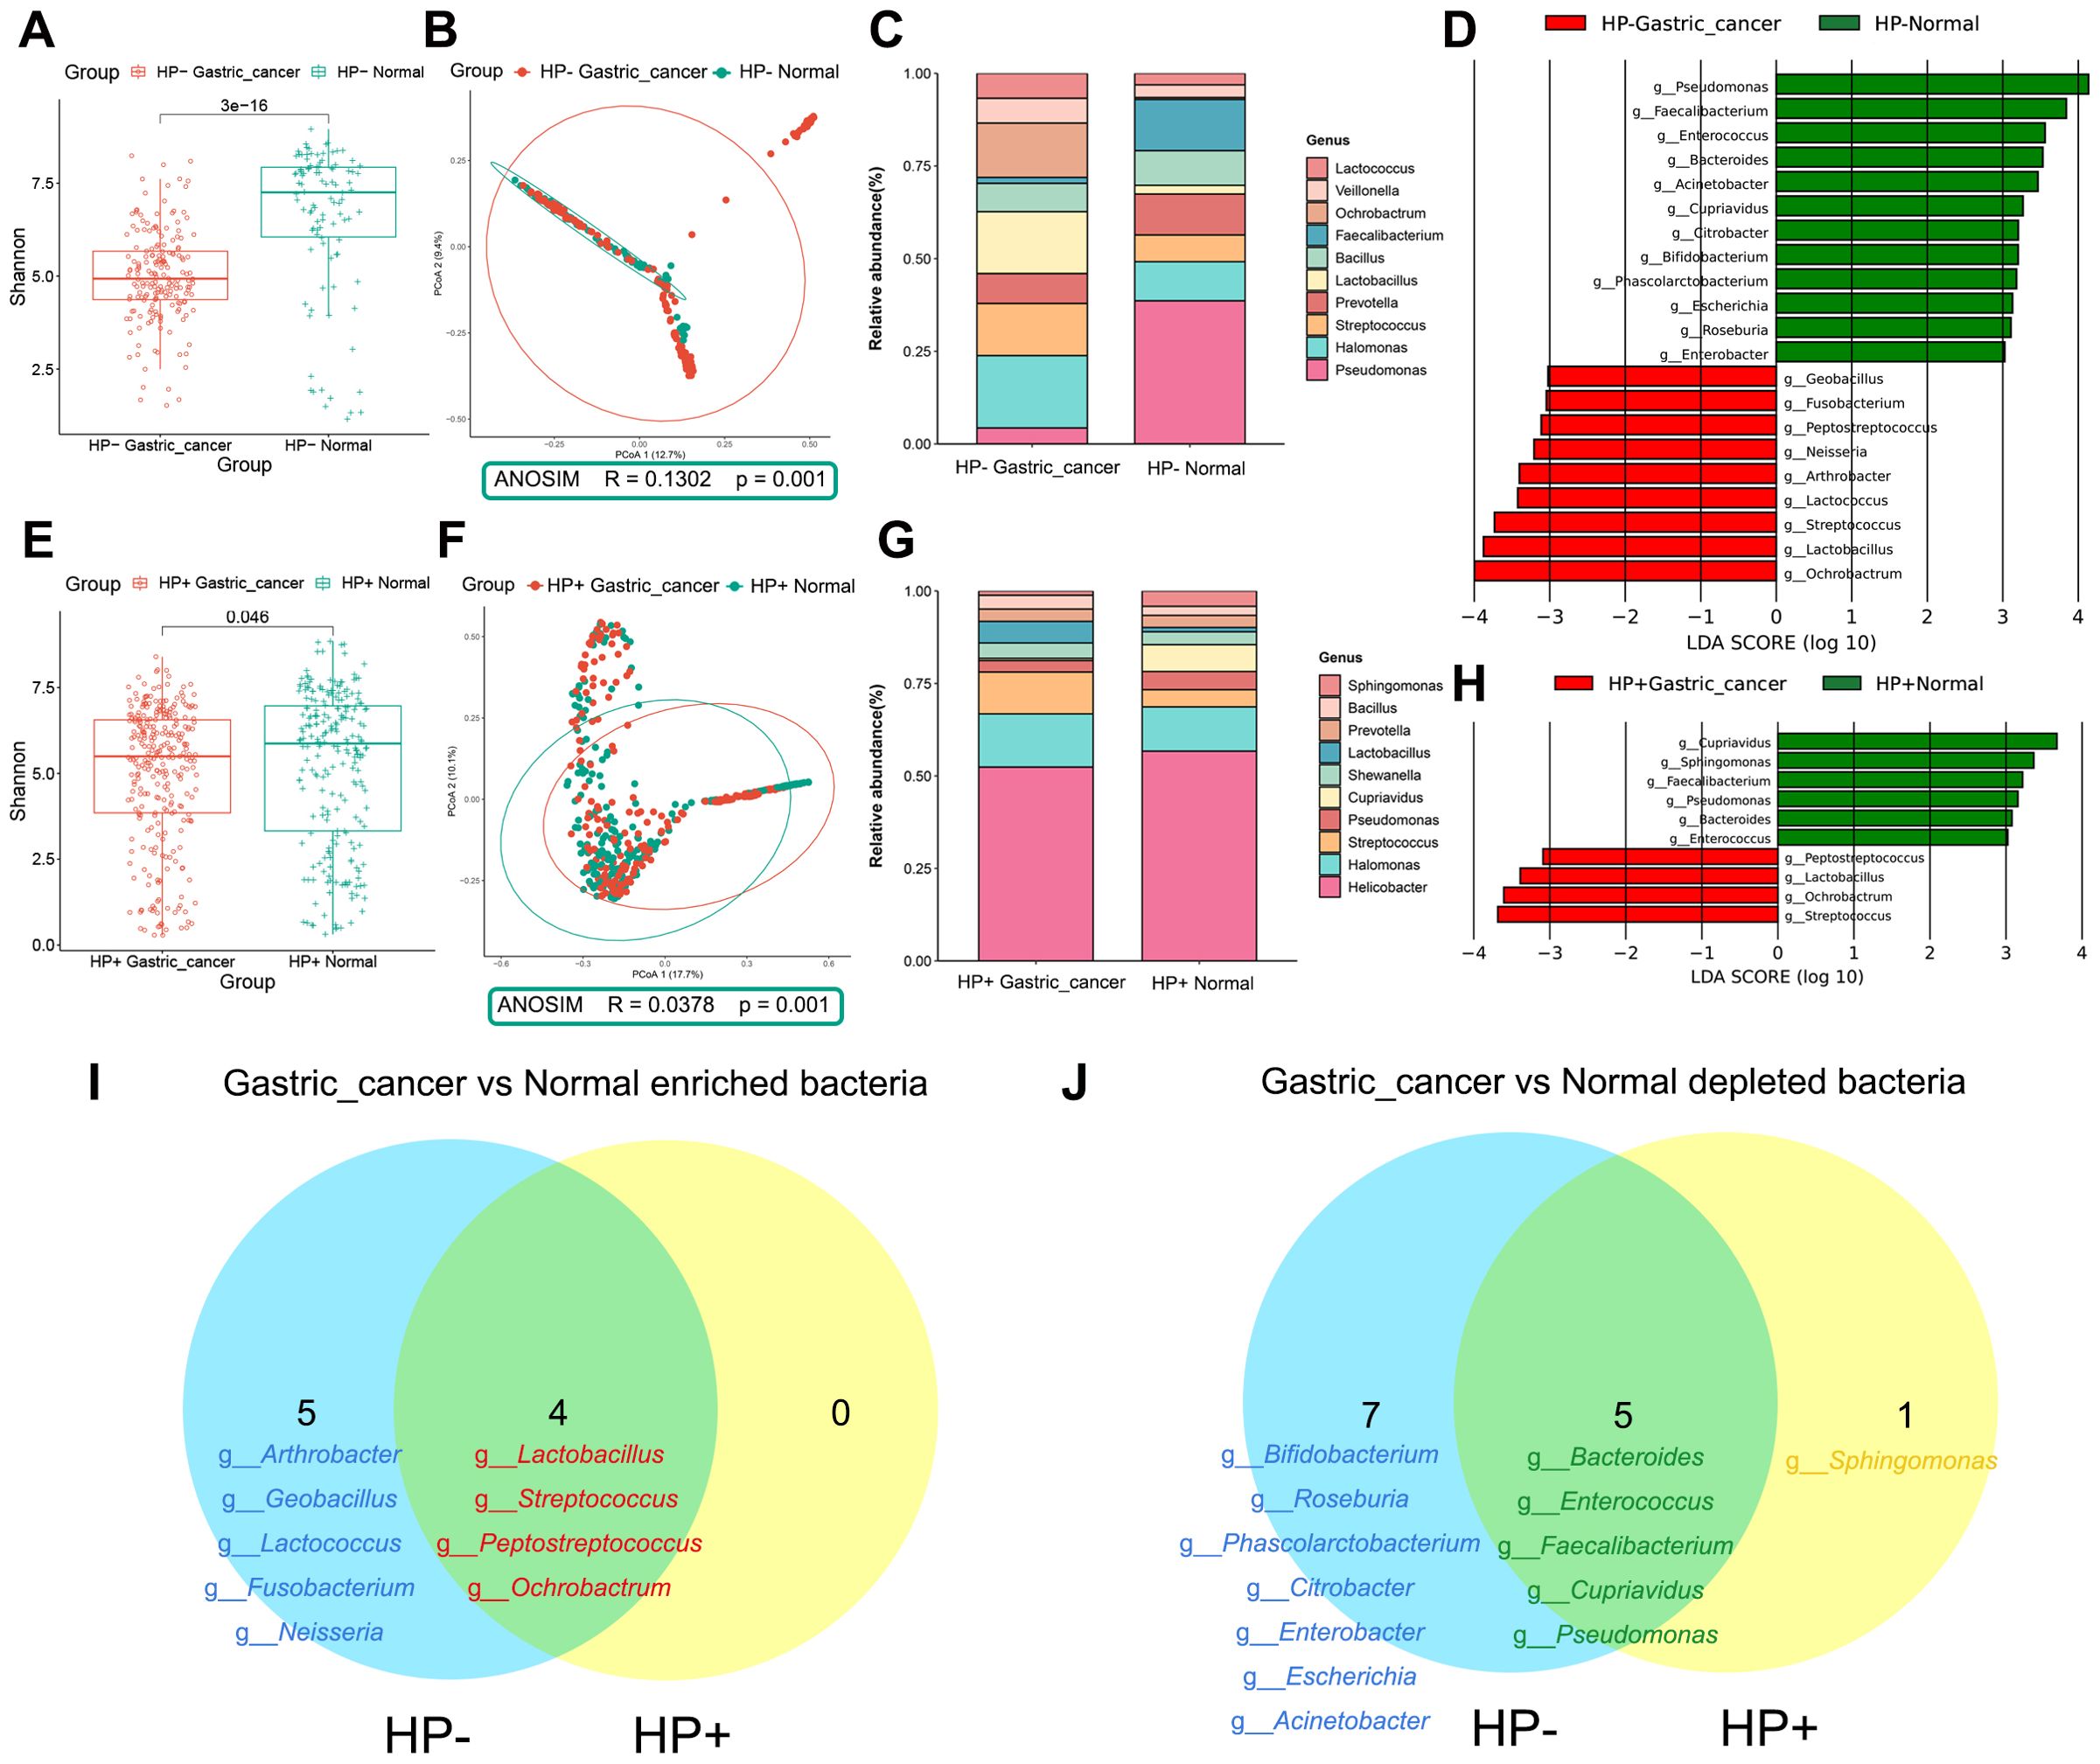
Figure 4. Composition and differential analysis of the gastric microbiota in the HP-/HP+ gastric cancer and normal groups. (A) Comparison of α-diversity between HP-negative normal and HP-negative gastric cancer groups using the Shannon index. (B) β-diversity was evaluated by PCoA based on Bray Curtis distance, indicating differences in composition between HP-negative normal and HP-negative gastric cancer groups. (C) Taxonomic composition of genus level of HP-negative samples. (D) LEfSe discriminating taxa (LDA > 3) of HP-negative samples. (E) Comparison of α-diversity between HP-positive normal and HP-positive gastric cancer groups using the Shannon index. (F) β-diversity was evaluated by PCoA based on Bray Curtis distance, indicating differences in composition between HP-positive normal and HP-positive gastric cancer groups. (G) Taxonomic composition of HP-positive samples at the genus level. (H) LEfSe discriminating taxa of HP-positive samples (LDA > 3). Venn diagram shows the intersection of (I) gastric cancer-associated enriched and (J) gastric cancer-associated depleted bacteria in HP-negative and HP-positive groups. HP-, Helicobacter pylori-negative; HP+, Helicobacter pylori-positive; PCoA, principal coordinate analysis; LDA, linear discriminant analysis; LEfSe, linear discriminant analysis effect size.
In HP-positive samples, the abundance and diversity of the gastric microbiota were also higher in the normal group than in the GC group (Supplementary Figure S4D, Figure 4E). The PCoA result showed a significant separation between the HP-positive normal group and the HP-positive GC group (Figure 4F, Anosim, R = 0.0378, P = 0.001). Proteobacteria was predominant at the phylum level, especially in the HP-positive normal group (Supplementary Figure S5D). At the genus level, changes in Lactobacillus and Streptococcus in the HP-positive normal and GC groups paralleled those in the HP-negative group (Figure 4G). LEfSe analysis indicated that Lactobacillus, Streptococcus, Peptostreptococcus, and Ochrobactrum were enriched, whereas Bacteroides, Enterococcus, Faecalibacterium, Sphingomonas, Cupriavidus, and Pseudomonas were depleted in the HP-positive GC group compared to the HP-positive normal group (Figure 4H, Supplementary Table S8).
Finally, the Venn diagram revealed that Lactobacillus, Streptococcus, Peptostreptococcus, and Ochrobactrum were enriched, whereas Bacteroides, Enterococcus, Faecalibacterium, Cupriavidus, and Pseudomonas were depleted in both HP-negative and HP-positive GCs. (Figures 4I, J). However, genera such as Arthrobacter, Geobacillus, Lactococcus, Fusobacterium, and Neisseria only promote the development of HP-negative GC.
3.5 Alterations in the composition of the gut microbiota in GC
The abundance of gut microbiota was higher in healthy individuals compared to those in GC patients (Supplementary Figure S4B) However, the two groups did not differ significantly in α-diversity (Figure 5A), aligning with previous findings (Liu et al., 2021b; He et al., 2022b; Li et al., 2022; Chen et al., 2022). However, a notable difference in β-diversity between the two groups was observed (Figure 5B, ANOSIM, R = 0.0287, P = 0.001). Next, the microbial composition of the fecal samples was synthesized at the phylum and genus levels. Bacteroidetes, Firmicutes and Proteobacteria dominated the intestinal microbiota as phylum, which accounted for more than 95% of the sequence (Supplementary Figure S5B). Prevotella and Escherichia were enriched in GC at the genus level compared to the normal group, while the abundance of Faecalibacterium and Roseburia was significantly reduced in GC (Figure 5C). LEfSe difference comparisons identified Lactobacillus, Streptococcus, Succinivibrio, Enterobacter, Escherichia and Klebsiella as enriched in the GC group compared to the normal group. Meanwhile, there were ten genera reduced in GC, including Clostridium, SMB53, Lachnoclostridium, Lachnospira, Roseburia and Faecalibacterium (Figure 5D, Supplementary Figure S6B and Supplementary Table S9).
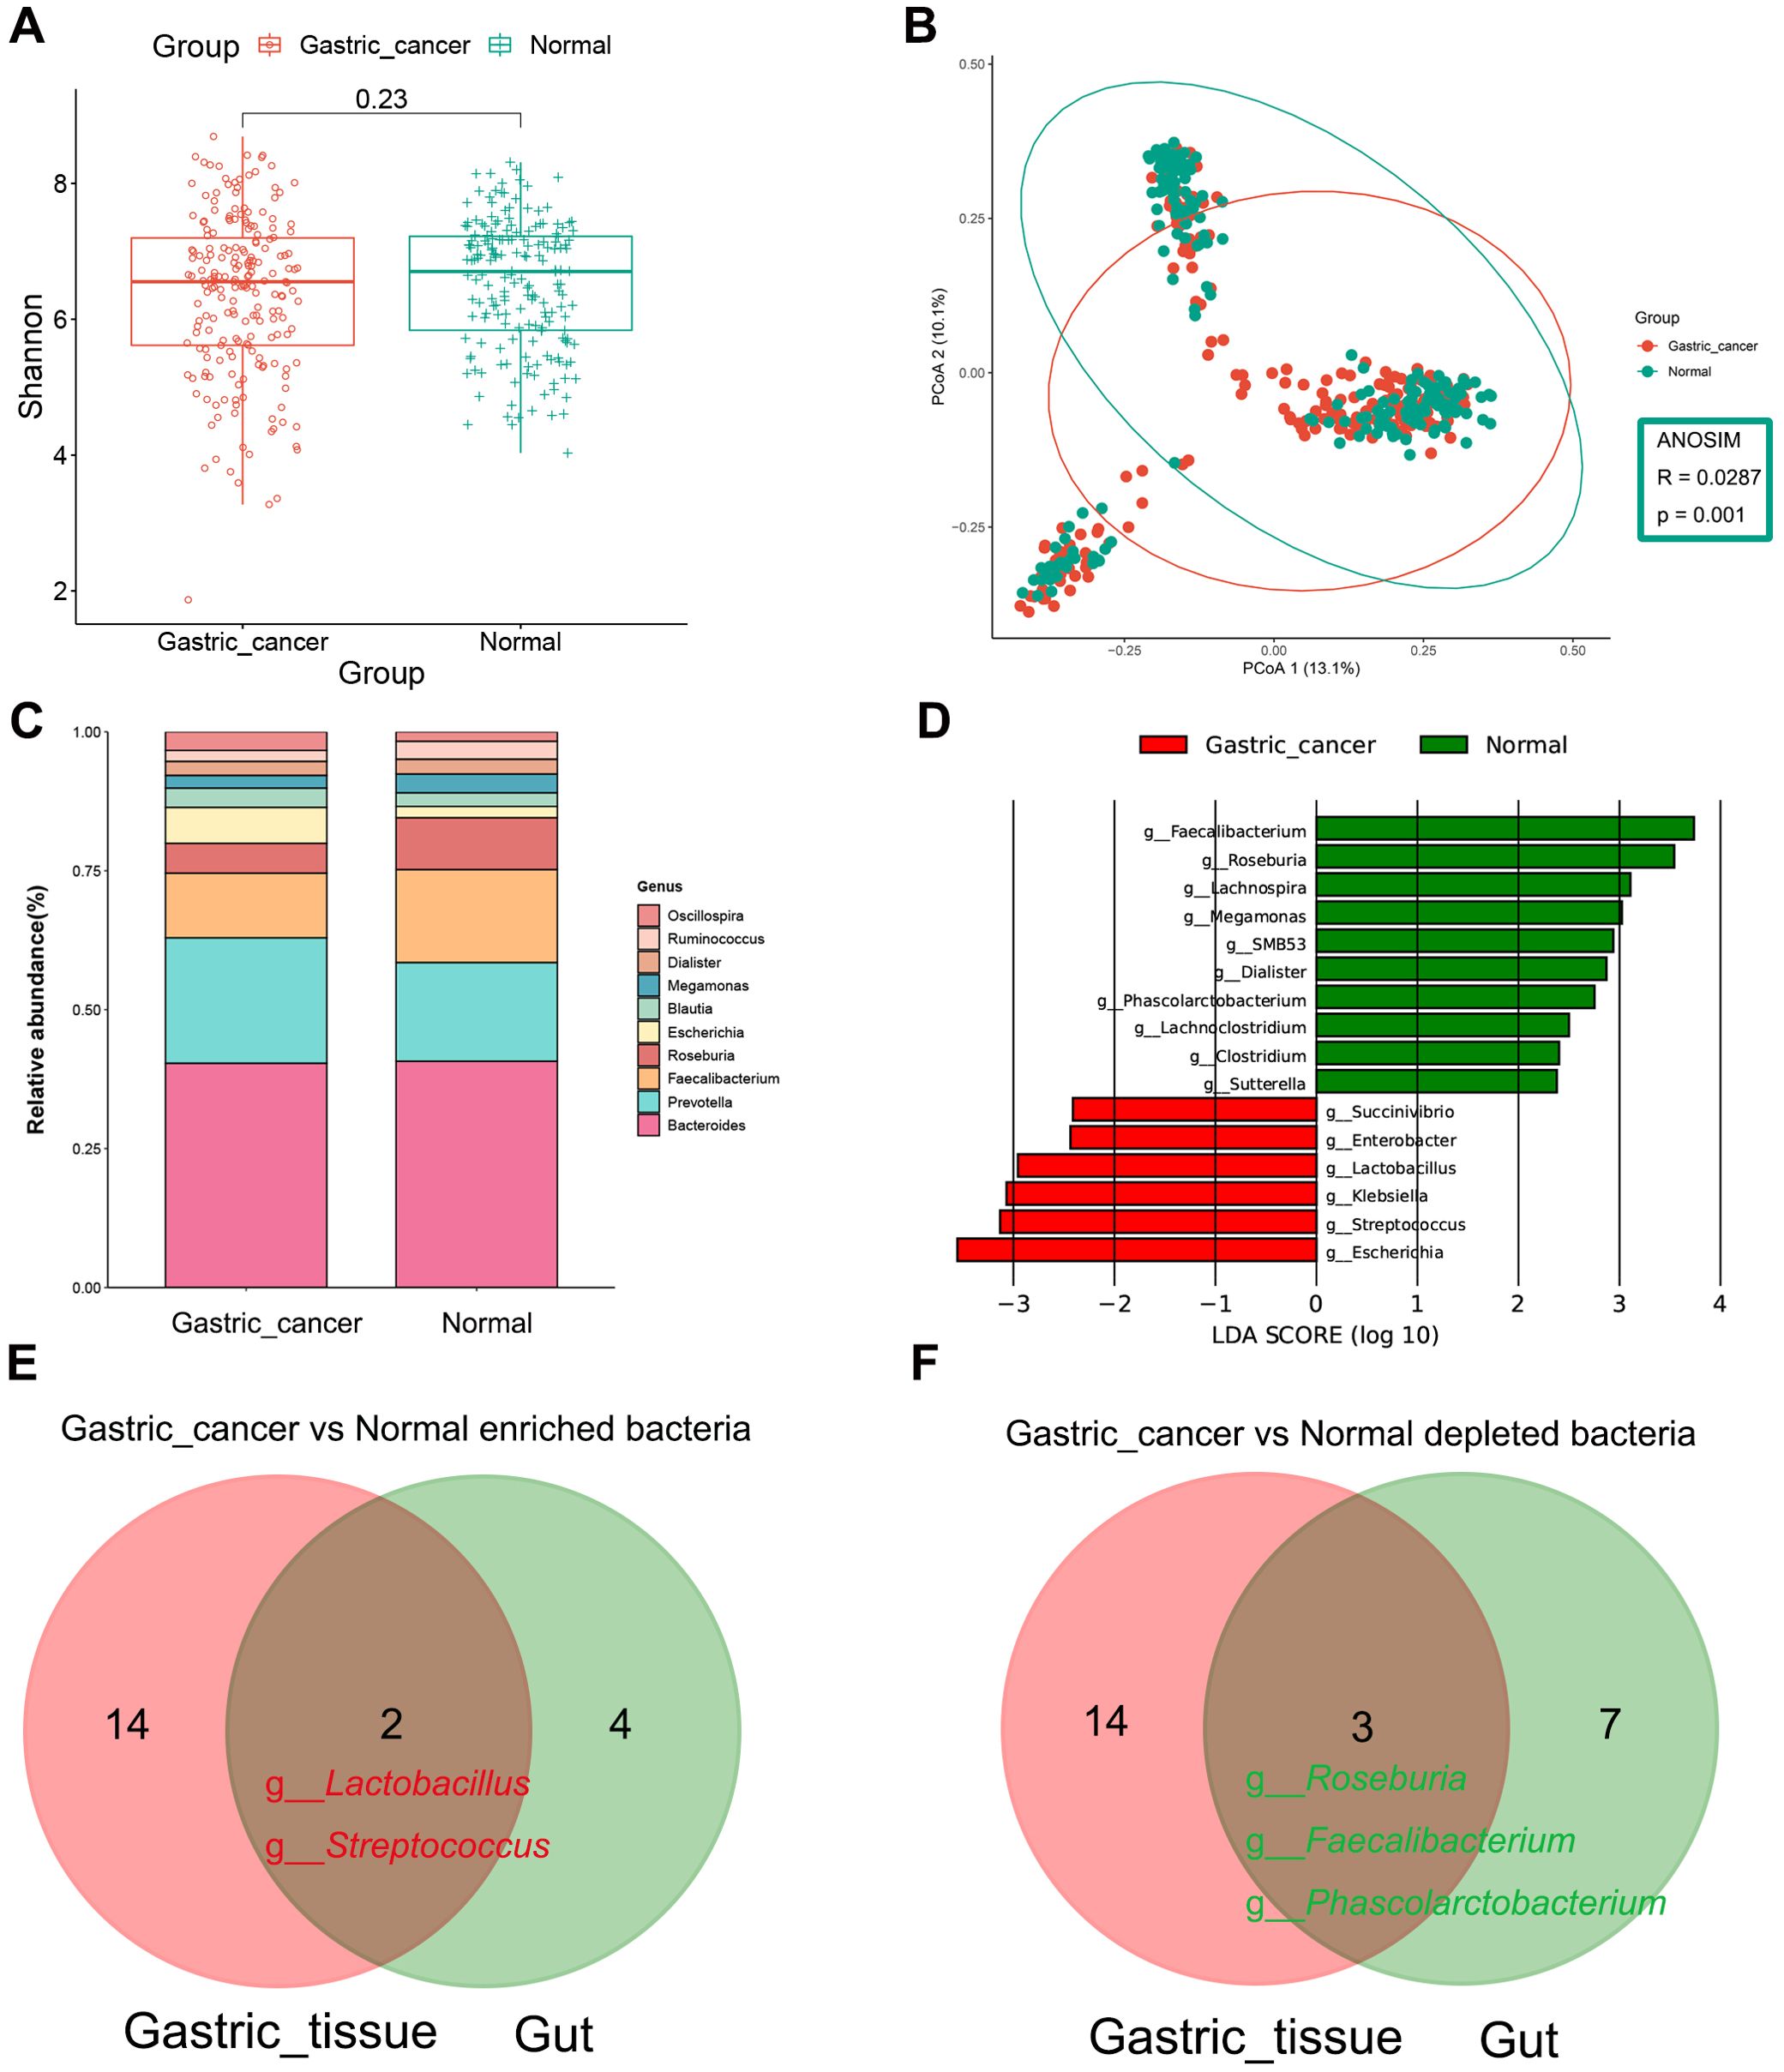
Figure 5. Composition and differential analysis of the gut microbiota in gastric cancer patients and healthy individuals. (A) α-diversity was compared between gastric cancer and normal groups using the Shannon index. (B) β-diversity was evaluated by PCoA based on Bray Curtis distance, indicating differences in composition between groups. (C) Genus-level classification profiles of gastric cancer patients and healthy individuals. (D) Bar chart of the distribution of LDA values (LDA > 2). Venn diagram shows the intersection of (E) gastric cancer-associated enriched and (F) gastric cancer-associated depleted bacteria in gastric tissues and gut. PCoA, principal coordinate analysis; LDA, linear discriminant analysis.
Venn diagrams highlighted co-differentiating bacteria in the stomach and intestines, including the GC-enriched bacteria, Lactobacillus and Streptococcus, and the GC-depleted bacteria, Roseburia, Faecalibacterium and Phascolarctobacterium (Figures 5E, F).
3.6 Microbial markers for distinguishing GC patients from healthy individuals
Using the results from the LEfSe analysis, we developed RF models to investigate the ability of gastrointestinal microbiota to differentiate between GC patients and healthy individuals. In the gastric tissue, the taxa that significantly changed between normal and GC groups included 16 GC-enriched genera and 17 GC-depleted genera (Figure 2D, Supplementary Table S4), which 33 genera were able to maximize the differentiation between healthy individuals and patients with GC (AUC = 0.8539, Figures 6A, B). In addition, in the intestine, 16 genera (six enriched in GC and ten depleted in GC) demonstrated significant changes between the normal and GC groups (Figure 5D, Supplementary Table S9). The results showed that a minimal set of 8 genera effectively distinguished healthy individuals from GC patients (AUC = 0.8533, Figures 6C, D). Lactobacillus and Streptococcus accounted for a significant share in this RF model. For better clinical dissemination, we reconstructed an RF model based on Lactobacillus and Streptococcus in fecal samples (AUC = 0.7949, Figure 6C).
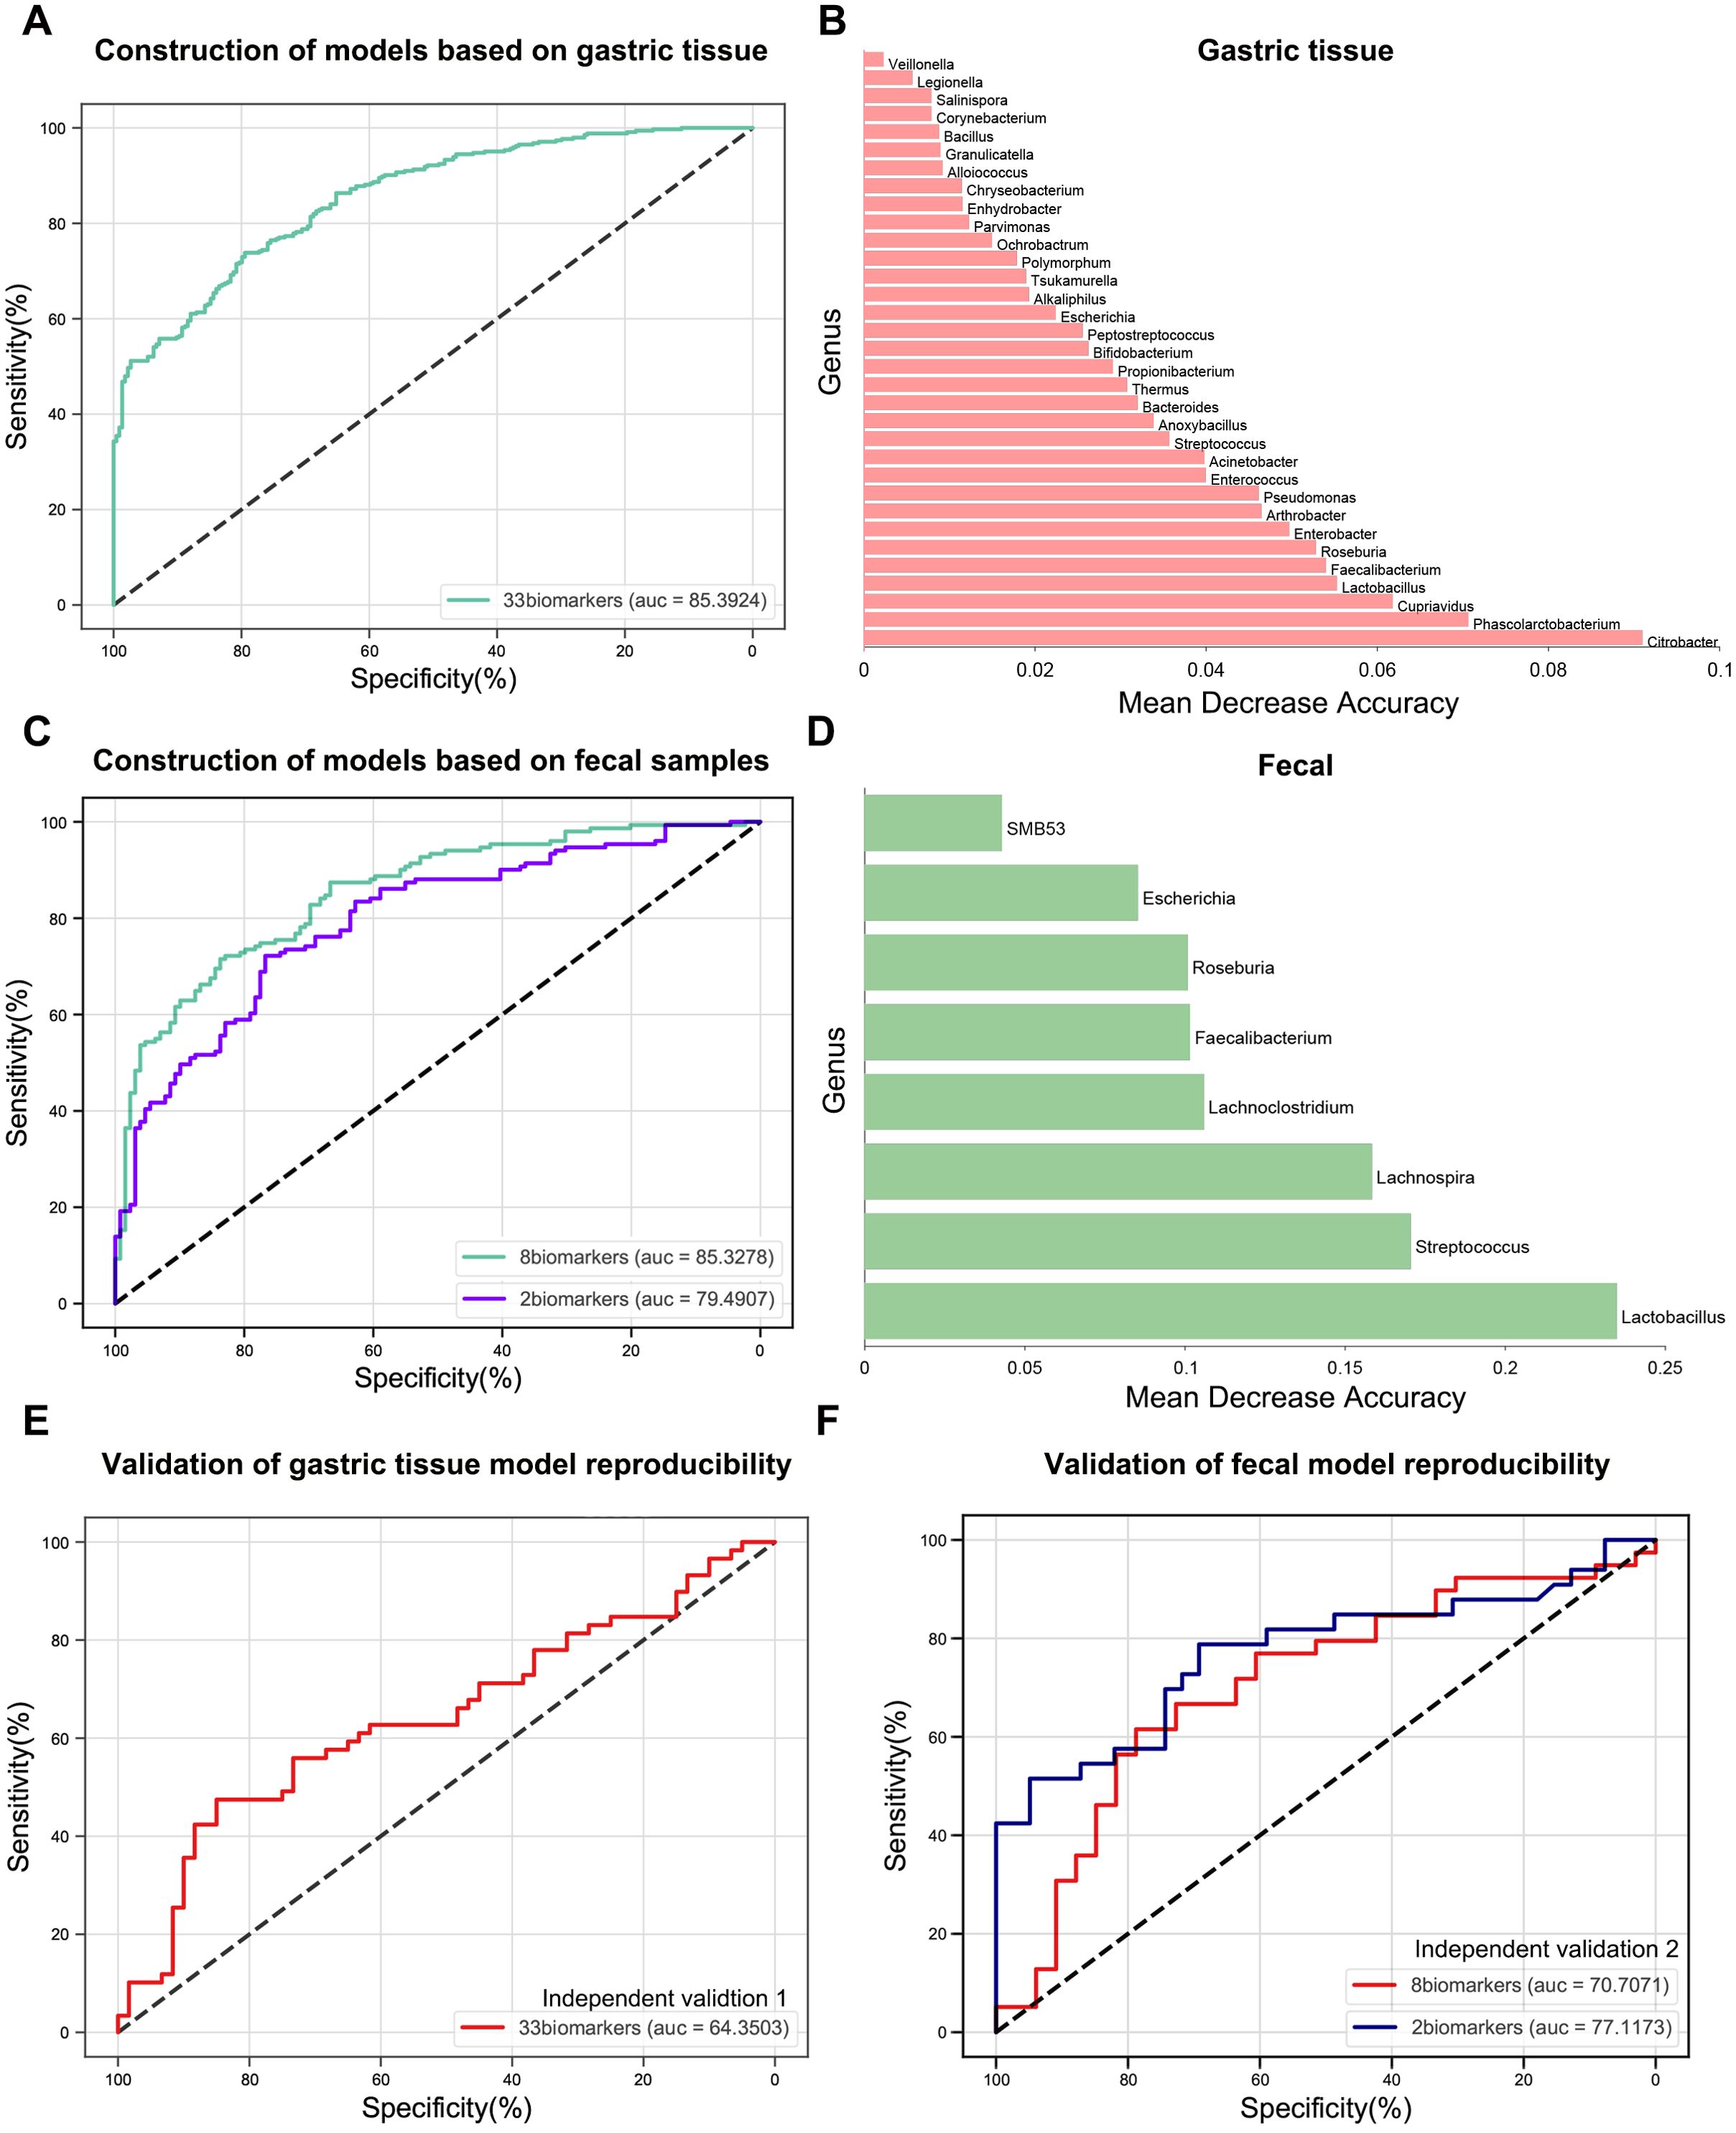
Figure 6. Construction and validation of gastric cancer diagnostic models based on gastric and gut-specific microbiota. (A) The RF model of GC versus normal groups was constructed in gastric tissue samples. (B) The weight shares of mean decrease accuracy for the 33 most discriminatory bacterial taxa identified in the RF model in (A). (C) RF models for the GC versus normal groups were constructed in fecal samples. (D) The weight shares of mean decrease accuracy for the 8 most discriminatory bacterial taxa identified in the RF model in (C). (E) In independent validation 1, the RF model in (A) was validated. (F) In independent validation 2, two RF models in (C) were validated. RF, random forest; GC, gastric cancer.
3.7 Validation of microbial classifiers
Two additional independent cohorts from Zhejiang (Independent Validation 1 and Independent Validation 2) were included in this study to validate the RF models’ reproducibility. Independent Validation 1 comprised 60 normal and 59 GC tissue samples. Independent Validation 2 consisted of raw data from the gut microbiome of 39 healthy individuals and 33 GC patients (Table 1). The RF model based on gut microbiota demonstrated higher reproducibility than that of gastric microbiota (Figures 6E, F). Furthermore, the AUC value of the model validated with the combination of Lactobacillus and Streptococcus (AUC = 0.7712) was higher than that of eight microbial markers (AUC = 0.7071) (Figure 6F). These results suggest that the combination of Lactobacillus and Streptococcus offers strong discriminatory capability and high reproducibility as biomarkers.
Additionally, to mitigate the impacts of geographic and technological differences, study-to-study transfer and LODO validations were conducted for all cohorts involved in the gut study to assess the generalizability of the Lactobacillus and Streptococcus combination across multiple studies. The AUC values for the study-to-study transfer validation ranged from 0.68 to 0.89 (mean AUC = 0.79), and AUC values for LODO validation ranged from 0.76 to 0.86 (mean AUC = 0.81) (Supplementary Figure S7).
4 Discussion
In this study, we conducted a meta-analysis of multiple published 16S rRNA datasets and, for the first time, incorporated fecal samples to characterize the gastric and gut microbial communities associated with gastric carcinogenesis, as well as to evaluate the potential of microbial markers in distinguishing between GC patients and healthy individuals.
Our results showed that the abundance and diversity of the gastric microbiota are significantly reduced in GC compared to the precancerous stage, aligning with prior research (Wang et al., 2020b; Liu et al., 2022a; Sun et al., 2022). However, the changes in the α-diversity of the gastric microbiota across the GC cascade lack consistency (Eun et al., 2014; Castaño-Rodríguez et al., 2017), which could be addressed by enlarging the sample size and standardizing the metrics used for assessing diversity. Moreover, the phyla and genera dominating the gastric and gut microbiota derived from our meta-analysis also align with previous studies (Zhang et al., 2021; Liu et al., 2022a), although with minor variations in the proportions of specific phyla and genera. These differences may stem from unavoidable factors such as analytical methods, geographic location, and racial heterogeneity. LEfSe analysis identified Lactobacillus and Streptococcus as GC-enriched bacteria in both the stomach and intestines. Conversely, Roseburia, Faecalibacterium and Phascolarctobacterium were found to be GC-depleted bacteria in both sites. The enrichment of Lactobacillus and Streptococcus in GC has been observed in many current studies (Ferreira et al., 2018; Wang et al., 2020b), and they have also been shown to promote the development of GC through various pathways. First, Lactobacillus produces lactic acid, which can serve as the energy source for tumor cells and promote their proliferation (Vinasco et al., 2019). Moreover, Lactobacillus can upregulate inflammatory factors such as Ptger4 and Tgf-β, which promote inflammatory responses (Lertpiriyapong et al., 2014). In addition, both Lactobacillus and Streptococcus can contribute to producing N-nitroso compounds, which are highly carcinogenic (Jo et al., 2016; Li and Perez Perez, 2018). In contrast, Roseburia, Faecalibacterium and Phascolarctobacterium, which are beneficial bacteria, produce butyrate, acetate and propionate. These short-chain fatty acids are crucial in inhibiting the development of GC, particularly butyrate (Chattopadhyay et al., 2022). Butyrate can inhibit the Warburg effect in GC, thereby depriving tumor cells of the necessary energy for growth (Li et al., 2018). Additionally, butyrate promotes the production of Caspase 9, leading to the apoptosis of tumor cells (Zhang et al., 2022b).
Changes in the correlations between bacteria can reflect differences between the intratumor-specific microenvironment and healthy individuals, thereby improving our understanding of gastric carcinogenesis. The positive correlation between GC-enriched bacteria, which contribute to gastric carcinogenesis, increased during the GC stage, while the positive correlation between GC-depleted bacteria, crucial for maintaining the balance of the gastric microbiota, decreased compared to that in healthy individuals. Moreover, the gradual increase in negative correlations between GC-enriched and GC-depleted bacteria suggested a mutually antagonistic relationship. These findings indicate that alterations in the gastric microbial community may be associated with the development of GC.
Functional analysis sheds light on potential pathogenic mechanisms in GC, which could inform new approaches for its prevention and treatment. Carbohydrate metabolism and nucleotide metabolism pathways were significantly enriched in GC compared with the normal group, potentially providing more energy for tumor growth and promoting the division and proliferation of tumor cells (Martínez-Reyes and Chandel, 2021). Notably, the pathway of unsaturated fatty acid biosynthesis was significantly reduced in the GC group compared to the normal group. The biosynthesis of unsaturated fatty acids may be closely linked to the central mechanism of ferroptosis, namely lipid peroxidation aggregation. Lee et al. reported that an increase in the biosynthesis of unsaturated fatty acids such as arachidonic acid or adrenic acid could significantly enhance the sensitivity of GC to ferroptosis (Lee et al., 2020). Ferroptosis, a novel form of cell death tightly regulated by Fe2+, the System Xc-/glutathione/glutathione peroxidase 4 (System Xc-/GSH/GPX4) pathway and lipid metabolic pathways, differs from apoptosis and necrosis (Lei et al., 2022). There has been substantial evidence suggesting that abnormalities in the regulatory mechanisms of ferroptosis are closely linked to cancer development (Zhang et al., 2018; Jian et al., 2023). Induction of ferroptosis inhibits tumor cell growth and improves GC prognosis. Conversely, inhibition of ferroptosis promotes the development of GC. Thus, targeting ferroptosis may be a promising strategy for treating GC.
We examined the microbiota playing essential roles in developing HP-negative and HP-positive GCs separately and identified bacterial genera that changed in both conditions through Venn analysis. Some bacterial genera changed exclusively in either HP-negative or HP-positive GC. Characterizing the flora changes associated with developing HP-negative and HP-positive GCs is crucial for early intervention in HP-negative GC and late treatment of HP-positive GC. Current methods for early diagnosis of GC are predominantly HP-specific, including rapid urease tests, urea breath tests, and immunohistochemical analyses, leaving a gap in the detection of non-HP infections. This gap hinders timely detection in HP-negative GC. For HP-positive GC, many studies have found that HP colonization gradually decreases with GC progression (Ferreira et al., 2018; Hsieh et al., 2018; Liu et al., 2019). At the same time, some non-HP commensals, such as Lactobacillus and Streptococcus, gradually increase (Coker et al., 2018; Ferreira et al., 2018; Wang et al., 2020b), so studying these non-HP commensals can help us better treat advanced HP-positive GC.
The gastric and gut microbiota were comprehensively evaluated for their capability to detect early GC, demonstrating good predictive abilities with AUCs of 0.8539 and 0.8533, respectively. Given the ease of use, cost-effectiveness, and non-invasiveness, the gut microbiota-based model was deemed more suitable for early GC screening. By ranking the important features of the gut microbiota model, it was found that the combination of Lactobacillus and Streptococcus alone effectively differentiated between GC patients and healthy individuals (AUC = 0.7949). These two important features were validated in an independent cohort (AUC = 0.7712). Finally, through study-to-study transfer (mean AUC of 0.79) and LODO (mean AUC of 0.81) validations, it was demonstrated that the combination of Lactobacillus and Streptococcus could overcome technical and geographical differences to be generalizable across multiple populations. It has been found that fecal microbiota can be used as biomarkers for the non-invasive diagnosis of GC. A diagnostic model constructed by Qi et al. based on the combination of Lachnospira, Lactobacillus, Streptococcus, Veillonella, and Tyzzerella_3 was able to discriminate well between GC patients and healthy individuals (AUC=0.95) (Qi et al., 2019). However, this model was confined to a single region and lacked independent validation, rendering its accuracy and reproducibility indeterminate (Qi et al., 2019). It is important to note that the structure and composition of the gut microbiota may be altered due to various factors. Previous studies have demonstrated a significant decrease in the richness and diversity of the gut microbiota following antibiotic use (Becattini et al., 2016). Conversely, oral probiotics may optimize the structure of the gut microbiota, potentially restoring its homeostasis (Wang et al., 2023). Additionally, it has been reported that intestinal diseases such as constipation, colorectal cancer, and ulcerative colitis are usually accompanied by varying degrees of intestinal microbiota dysbiosis or abnormalities, which are mainly characterized by a relative decrease in beneficial bacteria (e.g., Lactobacillus and Bifidobacterium), a relative increase in pathogenic bacteria (e.g., Fusobacterium nucleatum and Escherichia coli), and a decrease in species richness and diversity (Quaglio et al., 2022; Yang et al., 2022). However, the studies we included already excluded these potential factors when screening the study population, so there was no way to explore their impact on the model predictions further.
Most current studies on GC are monoecological, but joint diagnosis of GC through multiecology has also shown good performance. The RF model constructed by Zhang et al. combining oral and fecal microbiota had high accuracy (AUC= 0.922) in distinguishing between GC patients and healthy individuals (Zhang et al., 2022a). Our study also started from a multi-ecological perspective to identify shared microbiota, which may play a pivotal role in GC pathogenesis. Subsequently, based on these key microbiota, RF models were constructed in the stomach and the intestine, respectively. Compared to multi-ecological co-modeling, our models are more cost-effective and offer greater clinical translational potential, which can be achieved by only performing single-sample sampling.
Despite diligent efforts, this study faces several limitations and challenges. Its predominant focus on the Asian population may restrict the generalizability of our model to other regions, notably Europe and America. Additionally, the absence of accessible clinical information regarding tumor stage, histologic typing, and dietary behaviors limits a comprehensive evaluation of their potential influences. Furthermore, the utilization of our model for individual screening may be impacted by medication usage, specifically antibiotics and probiotics, as well as by an individual’s underlying health conditions, such as constipation, colorectal cancer, and ulcerative colitis. Therefore, future research should focus on increasing the sample size and geographic diversity while also considering a broader range of influencing factors to improve the applicability of our model to a more diverse population. We should also further explore the potential impact of the type and interval of antibiotic and probiotic use and intestinal comorbidities on the accuracy of our model. Moreover, our investigation of GC microbiota was limited by using 16S rRNA data, which is not as good as metagenomic data for resolution at the species level and functional prediction. Additionally, fungi and viruses are significant contributors to the pathogenesis of GC (Yarahmadi and Afkhami, 2024), yet their presence cannot be adequately assessed through 16S rRNA sequencing alone. Future studies should employ metagenomics sequencing technology, which allows for precise identification of bacterial species and concurrently captures data on fungi and viruses. Metagenomics also facilitates a thorough analysis of interactions among bacteria, fungi, and viruses, providing a more comprehensive understanding of the role of microecology in GC pathogenesis.
In summary, intratumoral and intestinal-specific co-differential Lactobacillus and Streptococcus were identified and could be used as markers for non-invasive early detection of GC with good accuracy across different populations. In cases of HP-positive GC, Lactobacillus, Streptococcus, Peptostreptococcus and Ochrobactrum, along with HP, may contribute to the development of GC. In HP-negative GC, Arthrobacter, Geobacillus, Lactococcus, and Fusobacterium independently contribute to the development of GC. The GC-depleted pathway involves promoting ferroptosis, and further research is needed on the interactions and potential mechanisms between intratumoral and fecal microbiota and their specific metabolites in gastric carcinogenesis.
Data availability statement
The original contributions presented in the study are included in the article/Supplementary Material. Further inquiries can be directed to the corresponding authors.
Author contributions
YWW: Formal Analysis, Investigation, Methodology, Software, Writing – original draft, Writing – review & editing. YW: Methodology, Writing – original draft. WH: Methodology, Software, Writing – original draft. MH: Formal Analysis, Investigation, Writing – original draft. XL: Formal Analysis, Software, Writing – original draft. JD: Writing – review & editing. YD: Writing – review & editing. TS: Funding acquisition, Writing – review & editing. JX: Conceptualization, Funding acquisition, Resources, Supervision, Writing – review & editing.
Funding
The author(s) declare financial support was received for the research, authorship, and/or publication of this article. This work was supported by National Nature Science Foundation of China (82373113, JX), Shenyang Public Health R&D Special Project (22-321-31-04, TS), LiaoNing Revitalization Talents Program (XLYC1907160, JX), Beijing Medical Award Foundation (YXJL-2020-0941-0752, TS, CORP-239-N27, CH), Wu Jieping Medical Foundation (320.6750.2020-12-21, 320.6750.2020-6-30, TS) and the Fundamental Research Funds for the Central Universities (202229, TS; 202230, JX).
Conflict of interest
Author XL is employed by Liaoning Kanghui Biotechnology Co., Ltd.
The remaining authors declare that the research was conducted in the absence of any commercial or financial relationships that could be construed as a potential conflict of interest.
Publisher’s note
All claims expressed in this article are solely those of the authors and do not necessarily represent those of their affiliated organizations, or those of the publisher, the editors and the reviewers. Any product that may be evaluated in this article, or claim that may be made by its manufacturer, is not guaranteed or endorsed by the publisher.
Supplementary material
The Supplementary Material for this article can be found online at: https://www.frontiersin.org/articles/10.3389/fcimb.2024.1397466/full#supplementary-material
Abbreviations
Anosim, Analysis of similarities; ANOVA, Analysis of variance; AUC, Area under the curve; BMI, Body mass index; GC, Gastric cancer; HP, Helicobacter pylori; KEGG, Kyoto Encyclopedia of Genes and Genomes; LDA, Linear discriminant analysis; LEfSe, Linear discriminant analysis effect size; LODO, Leave-one-dataset-out; OTUs, Operational taxonomic units; PCoA, Principal coordinate analysis; PICRUSt, Phylogenetic Investigation of Communities by Reconstruction of Unobserved States; QIIME, Quantitative Insights Into Microbial Ecology; RDP, Ribosomal Database Project; RF, Random forest; ROC, Receiver operating characteristic; SRA, Sequence Read Archive; System Xc-/GSH/GPX4, System Xc-/glutathione/glutathione peroxidase 4; 16S rRNA, 16S ribosomal RNA.
References
Becattini, S., Taur, Y., Pamer, E. G. (2016). Antibiotic-induced changes in the intestinal microbiota and disease. Trends Mol. Med. 22, 458–478. doi: 10.1016/j.molmed.2016.04.003
Castaño-Rodríguez, N., Goh, K.-L., Fock, K. M., Mitchell, H. M., Kaakoush, N. O. (2017). Dysbiosis of the microbiome in gastric carcinogenesis. Sci. Rep. 7, 15957. doi: 10.1038/s41598-017-16289-2
Chang, F., He, S., Dang, C. (2022). Assisted selection of biomarkers by linear discriminant analysis effect size (LEfSe) in microbiome data. J. Vis. Exp. 183. doi: 10.3791/61715
Chattopadhyay, I., Gundamaraju, R., Jha, N. K., Gupta, P. K., Dey, A., Mandal, C. C., et al. (2022). Interplay between dysbiosis of gut microbiome, lipid metabolism, and tumorigenesis: can gut dysbiosis stand as a prognostic marker in cancer? Dis. Markers 2022, 2941248. doi: 10.1155/2022/2941248
Chen, C., Du, Y., Liu, Y., Shi, Y., Niu, Y., Jin, G., et al. (2022). Characteristics of gastric cancer gut microbiome according to tumor stage and age segmentation. Appl. Microbiol. Biotechnol. 106, 6671–6687. doi: 10.1007/s00253-022-12156-x
Chen, X.-H., Wang, A., Chu, A.-N., Gong, Y.-H., Yuan, Y. (2019). Mucosa-associated microbiota in gastric cancer tissues compared with non-cancer tissues. Front. Microbiol. 10. doi: 10.3389/fmicb.2019.01261
Cheung, K.-S., Leung, W. K. (2018). Risk of gastric cancer development after eradication of Helicobacter pylori. World J. Gastrointest Oncol. 10, 115–123. doi: 10.4251/wjgo.v10.i5.115
Coker, O. O., Dai, Z., Nie, Y., Zhao, G., Cao, L., Nakatsu, G., et al. (2018). Mucosal microbiome dysbiosis in gastric carcinogenesis. Gut 67, 1024–1032. doi: 10.1136/gutjnl-2017-314281
Eun, C. S., Kim, B. K., Han, D. S., Kim, S. Y., Kim, K. M., Choi, B. Y., et al. (2014). Differences in gastric mucosal microbiota profiling in patients with chronic gastritis, intestinal metaplasia, and gastric cancer using pyrosequencing methods. Helicobacter 19, 407–416. doi: 10.1111/hel.12145
Ferreira, R. M., Pereira-Marques, J., Pinto-Ribeiro, I., Costa, J. L., Carneiro, F., MaChado, J. C., et al. (2018). Gastric microbial community profiling reveals a dysbiotic cancer-associated microbiota. Gut 67, 226–236. doi: 10.1136/gutjnl-2017-314205
Han, W., Wang, N., Han, M., Liu, X., Sun, T., Xu, J. (2023). Identification of microbial markers associated with lung cancer based on multi-cohort 16 s rRNA analyses: A systematic review and meta-analysis. Cancer Med. 12, 19301–19319. doi: 10.1002/cam4.6503
He, C., Peng, C., Shu, X., Wang, H., Zhu, Z., Ouyang, Y., et al. (2022a). Convergent dysbiosis of gastric mucosa and fluid microbiome during stomach carcinogenesis. Gastric Cancer 25, 837–849. doi: 10.1007/s10120-022-01302-z
He, F., Wang, F., Yang, J., Yang, S. (2022b). Explore and analyze the composition and characteristics of intestinal microbiota between gastric cancer patients and healthy people. Evid Based Complement Alternat Med. 2022, 5834293. doi: 10.1155/2022/5834293
Hsieh, Y.-Y., Tung, S.-Y., Pan, H.-Y., Yen, C.-W., Xu, H.-W., Lin, Y.-J., et al. (2018). Increased abundance of clostridium and fusobacterium in gastric microbiota of patients with gastric cancer in Taiwan. Sci. Rep. 8, 158. doi: 10.1038/s41598-017-18596-0
Huang, J., Lucero-Prisno, D. E., Zhang, L., Xu, W., Wong, S. H., Ng, S. C., et al. (2023). Updated epidemiology of gastrointestinal cancers in East Asia. Nat. Rev. Gastroenterol. Hepatol. 20, 271–287. doi: 10.1038/s41575-022-00726-3
Jian, H., Chen, Z., Du, H., Liao, T., Sun, Y., Ke, D., et al. (2023). Inhibition of ferroptosis by POLE2 in gastric cancer cells involves the activation of NRF2/GPX4 pathway. J. Cell Mol. Med. 28, e17983. doi: 10.1111/jcmm.17983
Jo, H. J., Kim, J., Kim, N., Park, J. H., Nam, R. H., Seok, Y.-J., et al. (2016). Analysis of gastric microbiota by pyrosequencing: minor role of bacteria other than helicobacter pylori in the gastric carcinogenesis. Helicobacter 21, 364–374. doi: 10.1111/hel.12293
Kanehisa, M., Furumichi, M., Sato, Y., Ishiguro-Watanabe, M., Tanabe, M. (2021). KEGG: integrating viruses and cellular organisms. Nucleic Acids Res. 49, D545–D551. doi: 10.1093/nar/gkaa970
Kim, J., Kim, N., Jo, H. J., Park, J. H., Nam, R. H., Seok, Y.-J., et al. (2015). An appropriate cutoff value for determining the colonization of helicobacter pylori by the pyrosequencing method: comparison with conventional methods. Helicobacter 20, 370–380. doi: 10.1111/hel.12214
Langille, M. G. I., Zaneveld, J., Caporaso, J. G., McDonald, D., Knights, D., Reyes, J. A., et al. (2013). Predictive functional profiling of microbial communities using 16S rRNA marker gene sequences. Nat. Biotechnol. 31, 814–821. doi: 10.1038/nbt.2676
Lee, J.-Y., Nam, M., Son, H. Y., Hyun, K., Jang, S. Y., Kim, J. W., et al. (2020). Polyunsaturated fatty acid biosynthesis pathway determines ferroptosis sensitivity in gastric cancer. Proc. Natl. Acad. Sci. U.S.A. 117, 32433–32442. doi: 10.1073/pnas.2006828117
Lei, G., Zhuang, L., Gan, B. (2022). Targeting ferroptosis as a vulnerability in cancer. Nat. Rev. Cancer 22, 381–396. doi: 10.1038/s41568-022-00459-0
Lertpiriyapong, K., Whary, M. T., Muthupalani, S., Lofgren, J. L., Gamazon, E. R., Feng, Y., et al. (2014). Gastric colonisation with a restricted commensal microbiota replicates the promotion of neoplastic lesions by diverse intestinal microbiota in the Helicobacter pylori INS-GAS mouse model of gastric carcinogenesis. Gut 63, 54–63. doi: 10.1136/gutjnl-2013-305178
Li, J., Perez Perez, G. I. (2018). Is there a role for the non-helicobacter pylori bacteria in the risk of developing gastric cancer? Int. J. Mol. Sci. 19, 1353. doi: 10.3390/ijms19051353
Li, N., Bai, C., Zhao, L., Ge, Y., Li, X. (2022). Characterization of the fecal microbiota in gastrointestinal cancer patients and healthy people. Clin. Transl. Oncol. 24, 1134–1147. doi: 10.1007/s12094-021-02754-y
Li, Q., Cao, L., Tian, Y., Zhang, P., Ding, C., Lu, W., et al. (2018). Butyrate suppresses the proliferation of colorectal cancer cells via targeting pyruvate kinase M2 and metabolic reprogramming. Mol. Cell Proteomics 17, 1531–1545. doi: 10.1074/mcp.RA118.000752
Li, Y., Hu, Y., Zhan, X., Song, Y., Xu, M., Wang, S., et al. (2023). Meta-analysis reveals Helicobacter pylori mutual exclusivity and reproducible gastric microbiome alterations during gastric carcinoma progression. Gut Microbes 15, 2197835. doi: 10.1080/19490976.2023.2197835
Ling, Z., Shao, L., Liu, X., Cheng, Y., Yan, C., Mei, Y., et al. (2019). Regulatory T cells and plasmacytoid dendritic cells within the tumor microenvironment in gastric cancer are correlated with gastric microbiota dysbiosis: A preliminary study. Front. Immunol. 10. doi: 10.3389/fimmu.2019.00533
Liu, D., Chen, S., Gou, Y., Yu, W., Zhou, H., Zhang, R., et al. (2021a). Gastrointestinal microbiota changes in patients with gastric precancerous lesions. Front. Cell Infect. Microbiol. 11. doi: 10.3389/fcimb.2021.749207
Liu, S., Dai, J., Lan, X., Fan, B., Dong, T., Zhang, Y., et al. (2021b). Intestinal bacteria are potential biomarkers and therapeutic targets for gastric cancer. Microb. Pathog. 151, 104747. doi: 10.1016/j.micpath.2021.104747
Liu, C., Ng, S.-K., Ding, Y., Lin, Y., Liu, W., Wong, S. H., et al. (2022a). Meta-analysis of mucosal microbiota reveals universal microbial signatures and dysbiosis in gastric carcinogenesis. Oncogene 41, 3599–3610. doi: 10.1038/s41388-022-02377-9
Liu, X., Shao, L., Liu, X., Ji, F., Mei, Y., Cheng, Y., et al. (2019). Alterations of gastric mucosal microbiota across different stomach microhabitats in a cohort of 276 patients with gastric cancer. EBioMedicine 40, 336–348. doi: 10.1016/j.ebiom.2018.12.034
Liu, D., Zhang, R., Chen, S., Sun, B., Zhang, K. (2022b). Analysis of gastric microbiome reveals three distinctive microbial communities associated with the occurrence of gastric cancer. BMC Microbiol. 22, 184. doi: 10.1186/s12866-022-02594-y
Martínez-Reyes, I., Chandel, N. S. (2021). Cancer metabolism: looking forward. Nat. Rev. Cancer 21, 669–680. doi: 10.1038/s41568-021-00378-6
Mejía-Guarnizo, L. V., Monroy-Camacho, P. S., Rincón-Rodríguez, D. E., Rincón-Riveros, A., Martinez-Vargas, D. A., Huertas-Caro, C. A., et al. (2023). Soluble HLA-G (sHLA-G) measurement might be useful as an early diagnostic biomarker and screening test for gastric cancer. Sci. Rep. 13, 13119. doi: 10.1038/s41598-023-40132-6
Namasivayam, V. (2023). Endoscopic screening and surveillance for gastric cancer: challenges and opportunities. Fac Rev. 12, 17. doi: 10.12703/r/12-17
Peng, X., Yao, S., Huang, J., Zhao, Y., Chen, H., Chen, L., et al. (2023). Alterations in bacterial community dynamics from noncancerous to Gastric cancer. Front. Microbiol. 14. doi: 10.3389/fmicb.2023.1138928
Qi, Y.-F., Sun, J.-N., Ren, L.-F., Cao, X.-L., Dong, J.-H., Tao, K., et al. (2019). Intestinal microbiota is altered in patients with gastric cancer from Shanxi Province, China. Dig Dis. Sci. 64, 1193–1203. doi: 10.1007/s10620-018-5411-y
Quaglio, A. E. V., Grillo, T. G., De Oliveira, E. C. S., Di Stasi, L. C., Sassaki, L. Y. (2022). Gut microbiota, inflammatory bowel disease and colorectal cancer. World J. Gastroenterol. 28, 4053–4060. doi: 10.3748/wjg.v28.i30.4053
Rognes, T., Flouri, T., Nichols, B., Quince, C., Mahé, F. (2016). VSEARCH: a versatile open source tool for metagenomics. PeerJ 4, e2584. doi: 10.7717/peerj.2584
Sun, Q.-H., Zhang, J., Shi, Y.-Y., Zhang, J., Fu, W.-W., Ding, S.-G. (2022). Microbiome changes in the gastric mucosa and gastric juice in different histological stages of Helicobacter pylori-negative gastric cancers. World J. Gastroenterol. 28, 365–380. doi: 10.3748/wjg.v28.i3.365
Vinasco, K., Mitchell, H. M., Kaakoush, N. O., Castaño-Rodríguez, N. (2019). Microbial carcinogenesis: Lactic acid bacteria in gastric cancer. Biochim. Biophys. Acta Rev. Cancer 1872, 188309. doi: 10.1016/j.bbcan.2019.07.004
Wang, Z., Gao, X., Zeng, R., Wu, Q., Sun, H., Wu, W., et al. (2020b). Changes of the gastric mucosal microbiome associated with histological stages of gastric carcinogenesis. Front. Microbiol. 11. doi: 10.3389/fmicb.2020.00997
Wang, Y., Han, W., Wang, N., Han, M., Ban, M., Dai, J., et al. (2023). The role of microbiota in the development and treatment of gastric cancer. Front. Oncol. 13. doi: 10.3389/fonc.2023.1224669
Wang, L., Xin, Y., Zhou, J., Tian, Z., Liu, C., Yu, X., et al. (2020a). Gastric mucosa-associated microbial signatures of early gastric cancer. Front. Microbiol. 11. doi: 10.3389/fmicb.2020.01548
Wang, N., Yang, J., Han, W., Han, M., Liu, X., Jiang, L., et al. (2022). Identifying distinctive tissue and fecal microbial signatures and the tumor-promoting effects of deoxycholic acid on breast cancer. Front. Cell Infect. Microbiol. 12. doi: 10.3389/fcimb.2022.1029905
Weng, M.-T., Chiu, Y.-T., Wei, P.-Y., Chiang, C.-W., Fang, H.-L., Wei, S.-C. (2019). Microbiota and gastrointestinal cancer. J. Formos Med. Assoc. 118 Suppl 1, S32–S41. doi: 10.1016/j.jfma.2019.01.002
Wirbel, J., Pyl, P. T., Kartal, E., Zych, K., Kashani, A., Milanese, A., et al. (2019). Meta-analysis of fecal metagenomes reveals global microbial signatures that are specific for colorectal cancer. Nat. Med. 25, 679–689. doi: 10.1038/s41591-019-0406-6
Wu, Y., Jiao, N., Zhu, R., Zhang, Y., Wu, D., Wang, A.-J., et al. (2021). Identification of microbial markers across populations in early detection of colorectal cancer. Nat. Commun. 12, 3063. doi: 10.1038/s41467-021-23265-y
Wu, J., Zhang, C., Xu, S., Xiang, C., Wang, R., Yang, D., et al. (2020). Fecal microbiome alteration may be a potential marker for gastric cancer. Dis. Markers 2020, 3461315. doi: 10.1155/2020/3461315
Yamamoto, Y., Fujisaki, J., Omae, M., Hirasawa, T., Igarashi, M. (2015). Helicobacter pylori-negative gastric cancer: characteristics and endoscopic findings. Dig Endosc 27, 551–561. doi: 10.1111/den.12471
Yang, L., Wang, Y., Zhang, Y., Li, W., Jiang, S., Qian, D., et al. (2022). Gut microbiota: a new avenue to reveal pathological mechanisms of constipation. Appl. Microbiol. Biotechnol. 106, 6899–6913. doi: 10.1007/s00253-022-12197-2
Yang, I., Woltemate, S., Piazuelo, M. B., Bravo, L. E., Yepez, M. C., Romero-Gallo, J., et al. (2016). Different gastric microbiota compositions in two human populations with high and low gastric cancer risk in Colombia. Sci. Rep. 6, 18594. doi: 10.1038/srep18594
Yang, W.-J., Zhao, H.-P., Yu, Y., Wang, J.-H., Guo, L., Liu, J.-Y., et al. (2023). Updates on global epidemiology, risk and prognostic factors of gastric cancer. World J. Gastroenterol. 29, 2452–2468. doi: 10.3748/wjg.v29.i16.2452
Yang, J., Zhou, X., Liu, X., Ling, Z., Ji, F. (2021). Role of the gastric microbiome in gastric cancer: from carcinogenesis to treatment. Front. Microbiol. 12. doi: 10.3389/fmicb.2021.641322
Yarahmadi, A., Afkhami, H. (2024). The role of microbiomes in gastrointestinal cancers: new insights. Front. Oncol. 13. doi: 10.3389/fonc.2023.1344328
Yu, G., Torres, J., Hu, N., Medrano-Guzman, R., Herrera-Goepfert, R., Humphrys, M. S., et al. (2017). Molecular characterization of the human stomach microbiota in gastric cancer patients. Front. Cell Infect. Microbiol. 7. doi: 10.3389/fcimb.2017.00302
Zhang, C., Hu, A., Li, J., Zhang, F., Zhong, P., Li, Y., et al. (2022a). Combined non-invasive prediction and new biomarkers of oral and fecal microbiota in patients with gastric and colorectal cancer. Front. Cell Infect. Microbiol. 12. doi: 10.3389/fcimb.2022.830684
Zhang, K., Ji, X., Song, Z., Wu, F., Qu, Y., Jin, X., et al. (2022b). Butyrate inhibits gastric cancer cells by inducing mitochondria-mediated apoptosis. Comb Chem. High Throughput Screen. 26, 630-638.doi: 10.2174/1386207325666220720114642
Zhang, Y., Shen, J., Shi, X., Du, Y., Niu, Y., Jin, G., et al. (2021). Gut microbiome analysis as a predictive marker for the gastric cancer patients. Appl. Microbiol. Biotechnol. 105, 803–814. doi: 10.1007/s00253-020-11043-7
Zhang, Y., Shi, J., Liu, X., Feng, L., Gong, Z., Koppula, P., et al. (2018). BAP1 links metabolic regulation of ferroptosis to tumour suppression. Nat. Cell Biol. 20, 1181–1192. doi: 10.1038/s41556-018-0178-0
Keywords: gastric cancer, intratumoral microbiota, fecal microbiota, microbial marker, non-invasive prediction
Citation: Wang Y, Wang Y, Han W, Han M, Liu X, Dai J, Dong Y, Sun T and Xu J (2024) Intratumoral and fecal microbiota reveals microbial markers associated with gastric carcinogenesis. Front. Cell. Infect. Microbiol. 14:1397466. doi: 10.3389/fcimb.2024.1397466
Received: 07 March 2024; Accepted: 28 August 2024;
Published: 17 September 2024.
Edited by:
Cécile Vignal, Université de Lille, FranceReviewed by:
Majid Eslami, Semnan University of Medical Sciences, IranHamed Afkhami, Qom University of Medical Sciences, Iran
Copyright © 2024 Wang, Wang, Han, Han, Liu, Dai, Dong, Sun and Xu. This is an open-access article distributed under the terms of the Creative Commons Attribution License (CC BY). The use, distribution or reproduction in other forums is permitted, provided the original author(s) and the copyright owner(s) are credited and that the original publication in this journal is cited, in accordance with accepted academic practice. No use, distribution or reproduction is permitted which does not comply with these terms.
*Correspondence: Junnan Xu, eGpuMDAyQDEyNi5jb20=; Tao Sun, amlhbm9uZ0AxMjYuY29t