 Jessada Sresakoolchai
 Chayut Ngamkhanong
 Sakdirat Kaewunruen
95% of researchers rate our articles as excellent or good
Learn more about the work of our research integrity team to safeguard the quality of each article we publish.
Find out more
ORIGINAL RESEARCH article
Front. Built Environ. , 27 January 2025
Sec. Transportation and Transit Systems
Volume 11 - 2025 | https://doi.org/10.3389/fbuil.2025.1546957
Train wheel wear significantly impacts wheel-rail interaction forces and is an unavoidable issue in the railway industry. This study focuses on regular wear, specifically changes in wheel profiles such as tread wear, flange height, and flange thickness. Effective wheel wear management is crucial for maintaining the reliability, safety, and efficiency of rail systems. However, regular measurement of wheel profiles is often limited by constraints such as dense traffic, budget, time, and remote assets, which reduces the effectiveness of traditional maintenance approaches. This study proposes a hybrid learning strategy combining supervised and reinforcement learning techniques to optimize train wheel wear management under these constraints and achieve predictive maintenance. The supervised learning model, developed from validated simulations, predicts wear progression, while reinforcement learning improves maintenance decision-making using basic operational data without regular measurements. Various machine-learning techniques are explored and fine-tuned to identify the best models for preventing faulty wheels without the need for frequent inspections. By integrating these two learning approaches, the framework enhances the accuracy of wear predictions and optimizes maintenance schedules, reducing the risk of over-maintenance or unexpected failures. This integrated model addresses challenges such as system complexity, limited data, and cost-effectiveness in the industry. In terms of supervised learning, the R2 for tread wear prediction improves from 0.94 to 0.95 compared to previous studies, and the model, when integrated with reinforcement learning, significantly reduces defects based on wear and irregular wheel dimensions. This research is the first to integrate supervised and reinforcement learning specifically for train wheel wear management under limited measurement data constraints, offering a breakthrough compared to traditional methods that rely on regular inspections. The study provides significant benefits for the railway industry, including reduced maintenance costs, improved maintenance efficiency, lower defect rates, reduced possession and inspection time, and enhanced passenger comfort and safety.
Train wheel wear is unavoidable in the railway industry due to the employment or the operation. Generally, there are two types of wear critically affecting railway operations, rail wear and wheel wear. This study will focus on wheel wear which the measurement process seems to be more complicated. Train wheel wear affects the overall efficiency of railway operations in terms of safety, system performance, maintenance cost, and passenger comfort (Gigante-Barrera et al., 2017). Commonly, wear is a phenomenon when material loses its mass. In case of the train wheel wear, wheels interact with tracks continuously. When wheels keep losing their mass, the shape of the wheels is changed and the wheels will no longer be in the desired condition for application (Braghin et al., 2009).
Wheel wear is affected by different factors such as the weight of rolling stocks, the speed of rolling stocks, track characteristics, or types of wheels and rail material (Wang and Gao, 2015). Train wheel wear is difficult to predict because the wear process is complicated (Shebani and Iwnicki, 2018). To manage wheel wear, railway wheels are inspected regularly to determine the appropriation of maintenance (Grassie, 2009). This process requires detailed measurements to compare the current condition of wheels and compare with the defined standard which takes time and may create disruptions to the regular operation of the railway system. In some cases, this complicated and time-consuming process may lead to insufficient inspection and maintenance which negatively affects the overall performance of the railway system (Magel et al., 2016; Montinaro et al., 2019).
In railway maintenance, two well-known approaches are corrective and preventative maintenance. The transition between both approaches can also be used in certain situations (such as for assets on curved tracks). To improve maintenance effectiveness, condition-based, risk-based, value-based, data-driven and/or predictive maintenance techniques have been developed. Corrective maintenance is performed when components fail or cannot function as designed. This approach minimizes upfront costs since maintenance is only done after failures occur, eliminating the need for routine inspections. However, it is prone to unexpected system unavailability, higher repair costs, and potential hazards due to unforeseen failures. Preventive maintenance involves regular inspections, measurements, and repairs, even when components have not failed, to reduce the likelihood of unexpected breakdowns. While this approach improves system availability and reduces failure risks, it incurs additional costs for routine checks and may not always be cost-efficient (Kaewunruen and Dindar, 2018). Lastly, Predictive maintenance, on the other hand, is data-driven and performed when a need is predicted based on the current condition of components. It requires advanced technologies such as sensors, data analysis, and machine learning (Zonta et al., 2020). By combining the benefits of corrective and preventive maintenance, predictive maintenance enables timely repairs, minimizes unnecessary maintenance, and improves system performance while reducing costs and possession time. However, its primary drawback is the need for sophisticated technologies and processes to ensure reliability and applicability.
Another issue about train wheel wear management is that it requires some tools such as strain gauges (Johansson and Nielsen, 2003), fiber Bragg grating sensors (Filograno et al., 2013), ultrasonic sensors (Brizuela et al., 2011), vibration sensors (Belotti et al., 2006), acoustic sensors (Thakkar et al., 2006), or image processing (Soleimani et al., 2021). These mentioned technologies require additional costs for sensors and installation. In addition, they also need time for inspection and measurement (Wei et al., 2011). A new approach that can reduce the complexity of the inspection and measurement processes will be beneficial for the railway industry due to the saving time and cost spent on inspection and measurement. In addition, this study aims to fill the research gaps in the use of basic operational data to manage railway wheel wear without the manual inspection and measurement of wheel profiles which will save maintenance time and cost. The study also focuses on different aspects of wear consisting of tread wear, flange height, and flange thickness that previous studies have never investigated. Variations in railway operation are also included in the machine learning models to mimic the real situation in the railway system as much as possible. More detail about the researcg gaps is presented in the next section.
This study aims to develop a novel approach by combining supervised learning and reinforcement learning which are two of the main categories of machine learning techniques to manage train wheel wear when the measurement data is limited. In other words, the developed approach is expected to be a tool to employ the basic operational data to monitor the condition of railway wheels and prepare maintenance plans for reprofiling. First, a validated model will be used to investigate the train wheel wear behavior. Then, the supervised learning technique will be used to develop a predictive machine-learning model to predict wheel wear which will be integrated with the reinforcement learning model to prepare maintenance plans for managing train wheel wear using operational data. This study is the world’s first integrating supervised and reinforcement learning for railway wear management providing the contributions for railway industry in terms of maintenance cost reduction, maintenance efficiency improvement, defect reduction, possession and inspection time reduction, passenger comfort improvement, and safety improvement. The result of the study can be used as a guideline for railway operators or academics to develop hybrid learning strategies to manage railway wear which can improve the overall efficiency of railway maintenance.
Railway wear is a fundamental issue in the railway system due to it is unavoidable. Traditionally, railway maintenance focused on preventive maintenance and corrective maintenance. At the same time, railway engineering tried to improve design and maintenance strategies to reduce wear and maintenance costs. Pascual and Marcos (2004) focused on high-speed rail projects and tried to improve preventive and corrective maintenance strategies. They improved the design of the wheel aiming to reduce flange wear by monitoring trains. They found that the design could significantly reduce wheel wear and maintenance costs. Additionally, they added that continuous monitoring could improve maintenance efficiency and reliability. Besides regular operation, railway wheel wear also occurs due to the turning or reprofiling process. Muhamedsalih et al. (2019) developed mathematical models to predict railway wheel wear according to the turning process. They suggested the economic turning process as of every 100,000 miles. It can be seen that to perform wheel wear management, measurement is a crucial process because it is used as a guideline to acknowledge railway operators to perform inspection, measurement, and maintenance at a specific time or distance interval. A traditional measurement method is to measure the dimension of wheels directly and compare the current dimension with the original dimension. When the wear exceeds the defined standard, maintenance will be conducted (Hu et al., 2021). More advanced wear measurement methods were developed such as laser (Zhu Y. et al., 2019; Fu et al., 2015; Asplund et al., 2014; Cao et al., 2018), ultrasound or ultrasonic (Brizuela et al., 2011; Zhou et al., 2019; Rovira et al., 2011; Alemi et al., 2017), acoustic emission (Thakkar et al., 2006; Huang et al., 2023), computer vision (Soleimani et al., 2021; Xing et al., 2022; Zhang et al., 2011), machine learning (Shebani and Iwnicki, 2018; Du Plessis, 2019; Najeh et al., 2021; Singh et al., 2023; Ye et al., 2022), or combined techniques between laser and computer vision (Emoto et al., 2024).
It can be seen that the railway wheel wear measurement has additional processes such as removing wheels from vehicles for the measurement or installing additional sensors or measurement devices to inspect wheel wear. Therefore, many scholars tried to develop predictive models to forecast wear without these additional processes. One of the popular techniques is the application of machine learning. Shebani and Iwnicki (2018) mentioned that the wheel wear prediction was complicated due to rolling contact fatigue. They proposed the application of an artificial neural network (ANN) for predicting wheel wear and used mean absolute percentage error (MAPE) to evaluate the performance of the model. They found that the developed model yielded MAPE of between 6.63% and 11.37% when the inputs were wheel and rail profiles, load, speed, and yaw angle. Liu et al. (2024) applied ANN and Long short-term memory (LSTM) models to predict railway wheel wear. First, they applied ANN to preprocess historical data and create time-series data. Then, they predict the average values of wear before predicting the deviation of the wear using developed models. They found that the developed models had a satisfying performance in wheel wear prediction. Chen et al. (2024) employed axle box acceleration (ABA) data as inputs to develop a regression model. They used the developed model to predict tread wear and evaluated the model’s performance by multiple indicators such as MAPE, and R2. They found that the MAPE was about 10% while the R2 was 0.9457. Wang et al. (2021a) applied SIMPACK to simulate the dynamic and wear behavior of high-speed trains. Then, they used ANN to predict the size of wear and the mean square error (MSE) was 0.009. The inputs were wheel position and carriage number. From the previous studies, it can be seen that machine learning provided a satisfying outcome in predicting wheel wear. This was also found in other previous studies (Najeh et al., 2021; Wang M. et al., 2022; Zhu A. et al., 2019; Wang H. et al., 2022; Deng et al., 2023; Wang et al., 2024).
When the wheel wear is measured or predicted, railway operators will be able to prepare maintenance plans or schedules. As mentioned, the three main maintenance approaches in the railway system are corrective maintenance, preventive maintenance, and predictive maintenance. In this study, predictive maintenance will be focused and prioritized. Therefore, a tool making predictive maintenance practical is significant. For corrective maintenance, the measurement and inspection might not be important because railway assets will be employed until something fails while preventive maintenance can be referred to as routine or regular maintenance. Therefore, measurement and inspection might not be important for preventive maintenance as well. However, predictive maintenance needs some tools for conditional monitoring and planning maintenance schedules. Thanks to the development of computational power and machine learning, predictive maintenance in the railway system has a more solid possibility. Mohammadi and He (2022) applied reinforcement learning which is one of three main categories of machine learning to prepare the maintenance plan for rail. They considered the Track Quality Index (TQI) as the main criterion to consider the need for maintenance. They found that the application of reinforcement learning could improve the overall TQI and extend the service life of rail. Then, Sresakoolchai and Kaewunruen (2023) further developed deep reinforcement learning integrated with digital twins to improve railway maintenance efficiency. They considered multiple sources of data and included different types of railway maintenance activities. They found that the application of deep reinforcement learning could improve railway maintenance efficiency by reducing the number of defects and reducing maintenance costs. The same finding was also found by Arcieri et al. (2024) who applied reinforcement learning to optimize railway maintenance. However, the mentioned studies focused on the railway track or rails rather than railway wheels. The only study focusing on railway wheel wear was the study by Zeng et al. (2021) who applied reinforcement learning to determine the wheel reprofiling policy or limit of reprofiling to extend the service life of railway wheels.
From the literature review, it can be seen that the application of machine learning for railway wheel wear management has been limited. In addition, the hybrid learning strategies integrating supervised and reinforcement learning techniques have not been explored. Therefore, this study tried to fill a research gap. Moreover, this study also provides novelties in using basic operational data to manage railway wheel wear without the need for manual inspection and measurement of wheel profiles. This will save a lot of cost and time for railway operators when they employ the developed approach in this study. The study also considers different aspects of wear including tread wear, flange height, and flange thickness which represent wheel wear comprehensively. To ensure that the developed approach can be applied in different situations, various and comprehensive data are used to develop hybrid learning strategies so the size of the dataset is bigger than 44,000. The variation of data includes the variation in weights of rolling stock, speed of rolling stock, and track characteristics (straight, curve, and spiral). The operational uncertainties are included in the reinforcement learning model. Examples of these operational uncertainties are distances of operation, weights of rolling stock, and wear of different aspects. This is to mimic the real situation in the railway system as much as possible. These novelties are expected that they will be able to fill some research gaps in railway wear management and improve the overall maintenance efficiency of the railway system.
Nowadays, multibody simulation (MBS) has become popular in dynamic systems and the railway system is no exception. Examples of popular commercial software are Vehicle Dynamic Modeling Package in a Railway Environment (VAMPIRE), New and Untried Car Analytical Region Simulation (NUCARS), Automatic Dynamic Analysis of Mechanical Systems (ADAMS), and Universal Mechanism (UM). In this study, UM is mainly used to model the railway wheel wear behavior because the wear model is particularly available and it is proven that the reliability is satisfying. In addition, UM provides accurate results and, at the same time, the calculation is efficient. One of the main benefits of UM is it supports parallel processing so the computation is conducted efficiently. In addition, the wear module in UM is developed further than other software. In this study, the C80 freight car is used as the case study for further modeling, validation, and machine learning model development as shown in Figure 1. From the figure, every component of the vehicle car is modeled and assembled together to create the MBS model of the freight car. Examples of the assembled components are wheels, suspension systems, bogies, car bodies, tracks, track structures, and track irregularities.
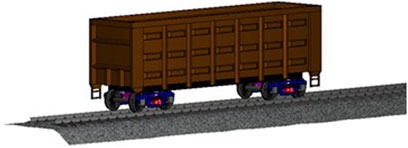
Figure 1. C80 freight car MBS model.
In UM, available wear models are the Archard model, the Archard model with wear coefficient map, and the Specht model. In this study, the Archard model is used due to its advantages. The simulation using the Archard model has excellent performance. At the same time, the volume and depth of wear can be obtained along the simulations (Wang M. et al., 2022). The wear according to the Archard model can be mathematically modeled as Equations 1–3 where
To validate the models generated by using UM, the calibrated data is compared. The data from Dos Santos et al. (2014) developed by NUCARS is calibrated using field data. The study according to Silva e Silva et al. (2023) compared lateral and vertical forces from the benchmark and the results from UM. The results can be shown in Figure 2. From the figure, it can be seen that the differences between the results from UM and the benchmarks are small. From the validation, lateral forces and vertical forces are used to compare. Two types of curves are used to validate the MBS models. From the figure, the trends of the lateral and vertical forces are the same although there are some small differences. However, the differences are less than 10%. UM is also validated for reliability by different previous studies (Qi et al., 2023; Kisilowski, 2021; Lu et al., 2020; Sakalo et al., 2019; Olshevskiy et al., 2015; Wang et al., 2021b; Xiao et al., 2017).
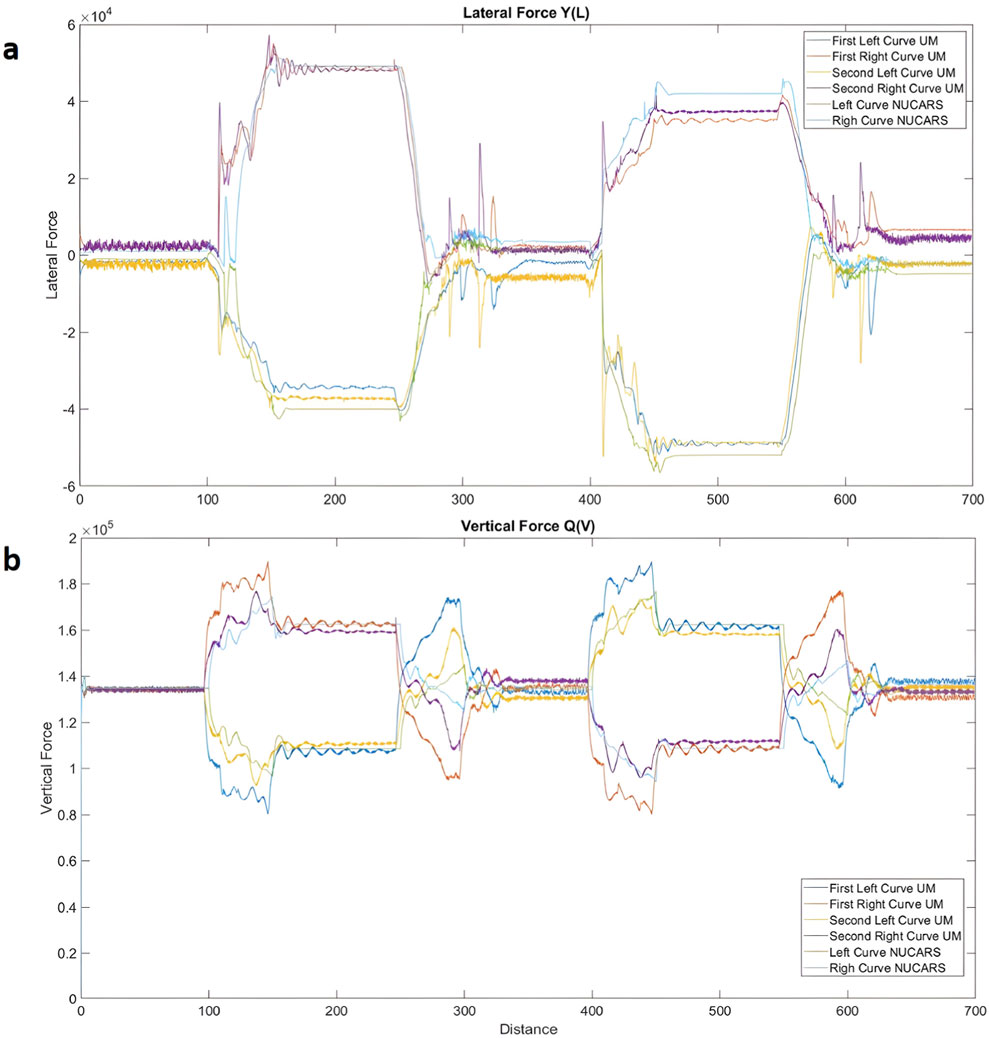
Figure 2. Comparison of lateral and vertical forces between the benchmark results from NUCARS and UM (Silva e Silva et al., 2023). (A) Lateral Force and (B) Vertical Force.
To predict and manage railway wheel wear using hybrid learning strategies, UM is employed to observe the dynamic and wear behaviors. Different scenarios are considered to make the strategies comprehensive and practical. For example, tangent tracks and tracks with different radius of curvature are explored. Different weights of rolling stocks and other uncertainties are also considered. First of all, rail vehicles in perfect condition or railway wheels without wear are modeled. Then, along the operation, the rolling stock is employed and the mass of the wheel loses causing wear. Figure 3 demonstrates the wheel profile in perfect condition and after 999,000 km of operation when the weight of the rolling stock is 14.5 tonnes. From the figure, the wheel with the perfect condition has the original dimensions as the original design. However, when the wheels are employed for a certain period of time and distance, the dimensions of the wheels are changed resulting in wear and critical changes in the wheels’ dimensions. In this study, the rolling stock has four sets of wheelsets. Therefore, the figure demonstrates one of the eight-wheel wear of the rolling stock.
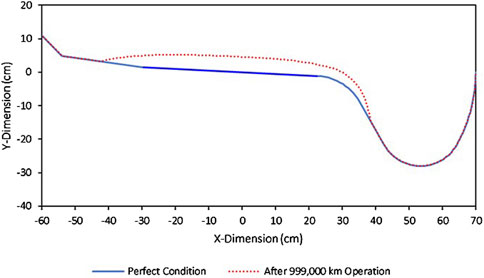
Figure 3. Wheel profile in perfect condition and after 999,000 km, with a rolling stock weight of 14.5 tonnes.
From the figure, it can be seen that the operation causes wear to the wheel in different aspects, namely, tread wear, flange height, and flange thickness. First, tread wear is the wear at the contact surface of the wheel contacting the rail which is the most critical wear for the wheel. Second, flange height is the measurement from the base of the wheel to the top of the flange. Last, flange thickness is the horizontal measurement of the wheel flange. When the rolling stock is used, these dimensions are changed according to the quantity of the operation. The summarized figure is presented in Figure 4. From the figure, wear and changes in wheels’ dimensions occur at the contact area between the wheel and rail caused by the loss of material. The wear causes changes in wheels’ dimensions in different aspects resulting in tread wear, changes in flange height, and flange thickness. The remarkable point is tread wear and flange height will be increased along the operation while the flange thickness will be decreased along the operation. Therefore, these dimensions will not be varied in the same way.
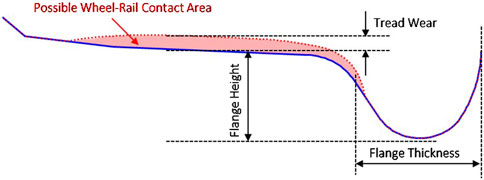
Figure 4. Train wheel wear in different aspects.
To train machine learning models developed by using supervised learning techniques, wear and wheel dimensions in different aspects are used as labeled for supervised machine learning models to predict. Simulations with different scenarios from UM are conducted to provide numerical data. Parameters are varied to create data variation and diversity. The list of varied parameters for wear simulation consists of the characteristics of tracks, the track’s radius of curvature, the weight of rolling stock, and mileage or the operation quantity. The data variation is shown in Table 1. It is worth noting that different wheelsets are also considered for wear. From the models, the railway wheel’s dimensions are measured regularly to monitor the change in dimensions under different operational quantities. In total, the number of samples for training the machine learning models is more than 44,000 samples which is sufficient in the machine learning field.
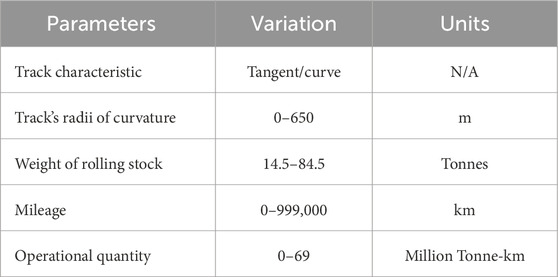
Table 1. Variations in data used for wear simulations.
As mentioned, this study proposes hybrid learning strategies integrating supervised and reinforcement learning to manage railway wheel wear. The first part of machine learning model development is to develop a predictive model to forecast wear and related dimensions of railway wheels. In this case, the developed machine learning model is used to forecast tread wear, flange height, and flange thickness. Therefore, there are three labels for the supervised learning model to predict. The inputs or features used to develop the machine learning model are basic operational data as mentioned due to the limited measurement data which is the aim of this study. The features used in this study are the characteristics of a track consisting of two categories, tangent and curved tracks, track radius of curvature, the weight of rolling stock, mileage of operation, and operation quantity which is the multiple between the weight of rolling stock and mileage. It can be seen that these features are basic operational data that railway operators acknowledge from operational schedules or acquire easily from measurements such as the weight of rolling stock. Therefore, the use of these features can fulfill the aim of using limited measurement data in this study.
To develop the machine learning model, from more than 44,000 samples, 70% of the samples are used to train the model while another 30% of the samples are used to test the performance of the model. Different supervised learning techniques are explored in this part to predict tread wear, flange height, and flange thickness. Therefore, the problem in this part is the regression problem when the labeled values are continuous. From the characteristics of labels, the appropriate performance indicators are Mean Absolute Error (MEA) and R2 because they are straightforward, easy to interpret, and suitable for identifying the performance of the developed machine learning model in this study. Explored algorithms are Convolutional Neural Network (CNN), Deep Neural Network (DNN), LSTM, Linear Regression, Support Vector Machine (SVM), and Random Forest (RF). To acquire the best version of each predictive model from different techniques, hyperparameter tuning is conducted. Hyperparameters of each machine learning model are different based on the used techniques. For example, tuned CNN’s hyperparameters can be the number of filters, the number of kernels, the number of pooling layers, etc., while tuned DNN’s hyperparameters can be the number of hidden layers, the number of hidden nodes, activation function, learning rate, etc. Two different methods can be used to perform hyperparameter tuning: grid search and random search. Grid search is the way that the alternatives of each hyperparameter are manually defined in the first place. On the other hand, random search is the way that the ranges of hyperparameters are defined but the exact alternatives are tried randomly by the machine. In this study, grid search is used because it is more predictable than random search.
From the machine learning model development and hyperparameter tuning, DNN provides the best performance in terms of MAE and R2 which can be shown in Table 2. The relationships between actual values and prediction are shown in Figure 5. From the figure, the relationships between actual values and predictions from the DNN model have a strong trend representing the satisfying performance of the DNN model. The range of R2 is between 0.84 and 0.96 presenting the good performance of the predictive model. The prediction of the flange height has the highest R2 while the prediction of the flange thickness has the lowest R2. However, the overall R2 is satisfying based on their high values. The optimal architecture of the DNN model is shown in Figure 6. From the figure, the architecture of the DNN model consists of two hidden layers. The number of the nodes in the input layer is five which equals the number of features. The numbers of nodes in the two hidden layers are ten and five respectively. Lastly, the number of nodes in the output layer is three because there are three predictions in this case, tread wear, flange height, and flange thickness. The activation functions used in each layer are ReLU (Rectified Linear Unit) except in the output layer where Linear is used. This combination is suitable when the prediction is linear or continuous. Dropout is used between the second hidden layer and the output layer. The value of dropout is set to 0.2. Dropout is the component of the DNN model used to prevent overfitting and improve the performance of the machine learning model. The function of the dropout is it will disable nodes in the adjacent layer randomly with the defined proportion. This process will repeat in every training cycle or epoch. Therefore, no particular nodes have higher significance than other nodes and the overall performance tends to be improved due to the prevention of overfitting when the model tends to remember the prediction.
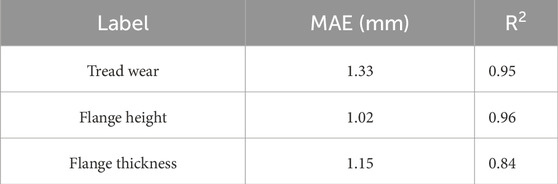
Table 2. Performance of the DNN model in predicting tread wear, flange height, and flange thickness.
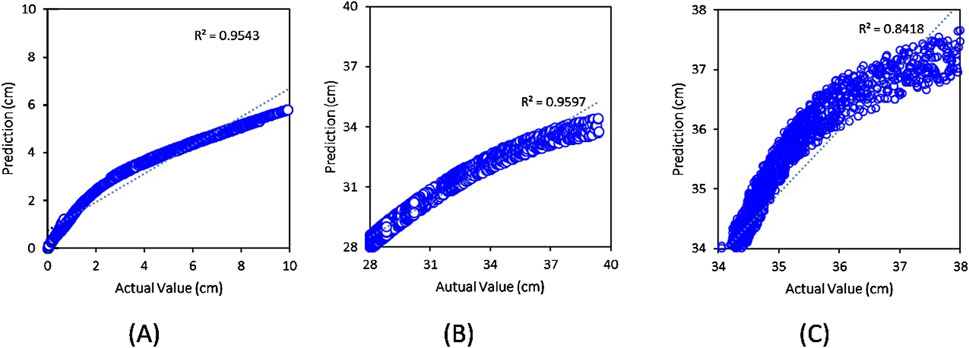
Figure 5. Relationships between actual values and predictions for (A) tread wear, (B) flange height, and (C) flange thickness.
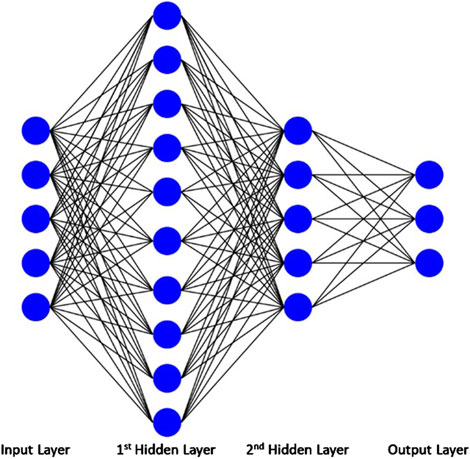
Figure 6. Optimal architecture of the Deep Neural Network (DNN) model.
From the model performance, it can be seen that the model provides a satisfying outcome. The R2 of tread wear, flange height, and flange thickness predictions are higher than 0.84. At the same time, the MAEs of every prediction is about 1 mm which is satisfying as well for predicting the railway wheel wear. Considering each prediction, flange thickness prediction has the highest variance compared to tread wear and flange height showing that the dynamic behavior is more complicated to predict. However, flange height has the highest R2 showing the strongest trend between the actual values and predictions. For tread wear, the trend seems to be stronger than flange height prediction but the R2 is slightly lower. This can be inferred that the reason is the scale range of tread wear is significantly lower than the flange height. Compared to the result from the previous study in Chen et al. (2024), that study predicted tread wear only while this study considers three-dimensional parameters of railway wheel wear. In addition, the result of this study is slightly better when compared to the tread wear prediction which was investigated in the previous study.
From the machine learning model development using supervised learning techniques, the developed predictive model provides a good outcome that can be integrated with the reinforcement learning model to create hybrid learning strategies. In the next stage, a reinforcement learning model will be developed to prepare the maintenance schedule to manage railway wheel wear. In this study, the railway wheel wear is maintained by wheel turning or reprofiling. The details of the reinforcement learning model development will be discussed in the following section.
This study applies the reinforcement learning technique for railway wheel wear management. Reinforcement learning is one of the three main categories of machine learning. The workflow of it is different from other types of machine learning. Due to its capability, reinforcement learning attracts more attention nowadays and its capability is explored in many fields, railway transportation is one of them. Reinforcement learning has higher variation compared to supervised and unsupervised learning because it is used to solve particular problems under different situations and scenarios. Therefore, there is no fixed form of the model. For example, it can be used to manage the traffic or for trading. The main difference is the rule for the machine to learn and react. There are some important terminologies in the field. First, the environment is the rule in the reinforcement learning model. Each reinforcement learning model will have different rules depending on the problem that the machine is used to solve. In this case, the machine called the agent, will interact with the environment to learn about the rules of the model. The environment will provide information to the agent, called states
In this study, Deep Q-learning (DQN) is used to develop the reinforcement learning model. The benefits of DQN are it is flexible and scalable. In addition, it can deal with complicated data with the use of DNN. It is worth noting that this DNN is different from the DNN model developed in this study because DNN in DQN is used for training the agent while the DNN model developed in this study is used to predict wear and changes of wheel dimensions which will be used as states for the reinforcement learning model. More details will be discussed further in the following section. DQN is the developed version of Q-learning. Therefore, some fundamentals are the same. For Q-learning, the agent will learn by choosing an action under the different states and stages and the agent will get the reward and punishment from the environment as mentioned. The maximum expected reward will be memorized in the Q-table showing the relationship between states and actions. Therefore, the agent will learn about the best action under different states. The Q-table will be more complicated when the number of states and actions is increasing. Values stored in the Q-table are called Q-values. Along the training process, the agent will explore the possible actions under different states and update the Q-table if the new actions provide higher rewards. Q-values are updated using the Bellman equation as shown in Equation 4 when
DQN is further developed to eliminate the limitation of Q-learning. Q-values will not be determined from the Q-tables but from the built-in DNN in the DQN model. In this context, DNN will receive states as features to predict Q-values. Along the training process, weights and biases of the DNN model will be updated instead of Q-tables. Therefore, DQN is more appropriate for complicated and nonlinear problems which is proper for the problem in this study.
Data used to train the reinforcement learning model consists of data for the states, actions, and rewards. States in this study are calculated based on the developed DNN model consisting of the characteristics of a track consisting of two categories, tangent and curved tracks, track radius of curvature, the weight of rolling stock, mileage of operation, operation quantity which is the multiple between the weight of rolling stock and mileage, tread wear from the previous stage, flange height from the previous stages, flange thickness from the previous stage, and the action from the previous stage. In the first stage, states related to wear and wheel dimensions will be set at the perfect condition to simulate that the wheel has not been used. Because this study focuses on railway wheel wear, therefore, the parameters related to tracks can be varied to simulate the real situation. Characteristics of track and radius of curvature are varied along the training process to mimic the real situation. Weights of rolling stocks are random between 14.5 and 84.5 tonnes related to the simulations shown in Table 1. The mileage of operation will be fixed as a specific interval to represent each stage of the environment. In this case, each stage is set to 1,000 km. In this study, the service life of wheels is set to 700,000 miles or 1,120,000 km (Maanshan Kingrail Technology Co. and Ltd, 2023). Therefore, the total number of stages is 1,120. Then, the operation quantity will be calculated based on the weights of rolling stocks and the mileage. Wear and related wheel dimensions from the previous stage are also used as states for the agent to decide on the next action. This also applied to the action from the previous stage that the agent chose. For tread wear, flange height, and flange thickness, they are calculated by using the developed DNN model. MAEs of each are also included as the uncertainty in the regular operation. For the states that can be categorized, they are defined as Discrete which is used for discrete values. On the other hand, the states that are the continuous values such as weights of rolling stock or wheel dimensions, they are defined as Box which are proper for the real number.
For the action space or the available actions, the agent has two options, to perform or not perform the maintenance, turning, or reprofiling for the wheels. The action space is defined as Discrete where the available options are not continuous values. After the maintenance is performed, wear and related wheel dimensions will be reset to the original values or the wheel will be in the perfect condition. The rewards will be defined using negative values or punishments in this study. There are two categories of punishments. The first one is the punishment based on wheel defects. In this case, wheel defects can take place based on three values, tread wear, flange height, and flange thickness. The thresholds of each dimension are defined according to GMRT2466 (Rail Safety and Standards Board Limited, 2023). The thresholds are shown in Figure 7. From the figure, the reinforcement learning model will try to maintain the different wear and wheels’ dimensions within the shown thresholds. If tread wear and flange height are higher than the thresholds, they will be considered defective. For flange thickness, the change will be in the opposite way because it will be decreased along the employment. Therefore, if the flange thickness is less than the threshold, it will be considered defective. These three parameters are considered for the punishments separately. If any threshold is exceeded, the agent will receive the punishment. Therefore, the punishment will be scaled according to the number of defects. The second kind of punishment is calculated based on the maintenance or wheel turning or wheel reprofiling. This is to prevent the agent or the machine from keep maintaining the wheel without the appropriate consideration. However, the punishment based on the maintenance performing will be relatively smaller than the punishments based on defects. This is to constrain the agent to avoid defects by performing the maintenance as necessary to save the maintenance cost. When the model training is done, the number of defects will be considered to evaluate the performance of the agent or reinforcement learning model. To compare the performance of the reinforcement learning model, two scenarios are compared, the first one is the result of the application of the reinforcement learning model and another scenario is the result of routine maintenance or preventive maintenance. For routine maintenance, the inspection and measurement of railway wheels are done every 50,000 km (Hou et al., 2022; Shi et al., 2018; Xie et al., 2024). The workflow of the reinforcement learning model is shown in Figure 8. The figure also demonstrates the workflow from the development of the supervised learning model consisting of data gathering and data processing. Then, the supervised learning model is combined with the reinforcement learning model to create the hybrid learning strategies approach.
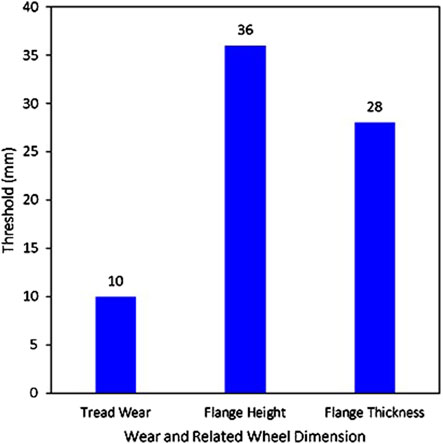
Figure 7. Defined thresholds for wear and corresponding wheel dimensions.
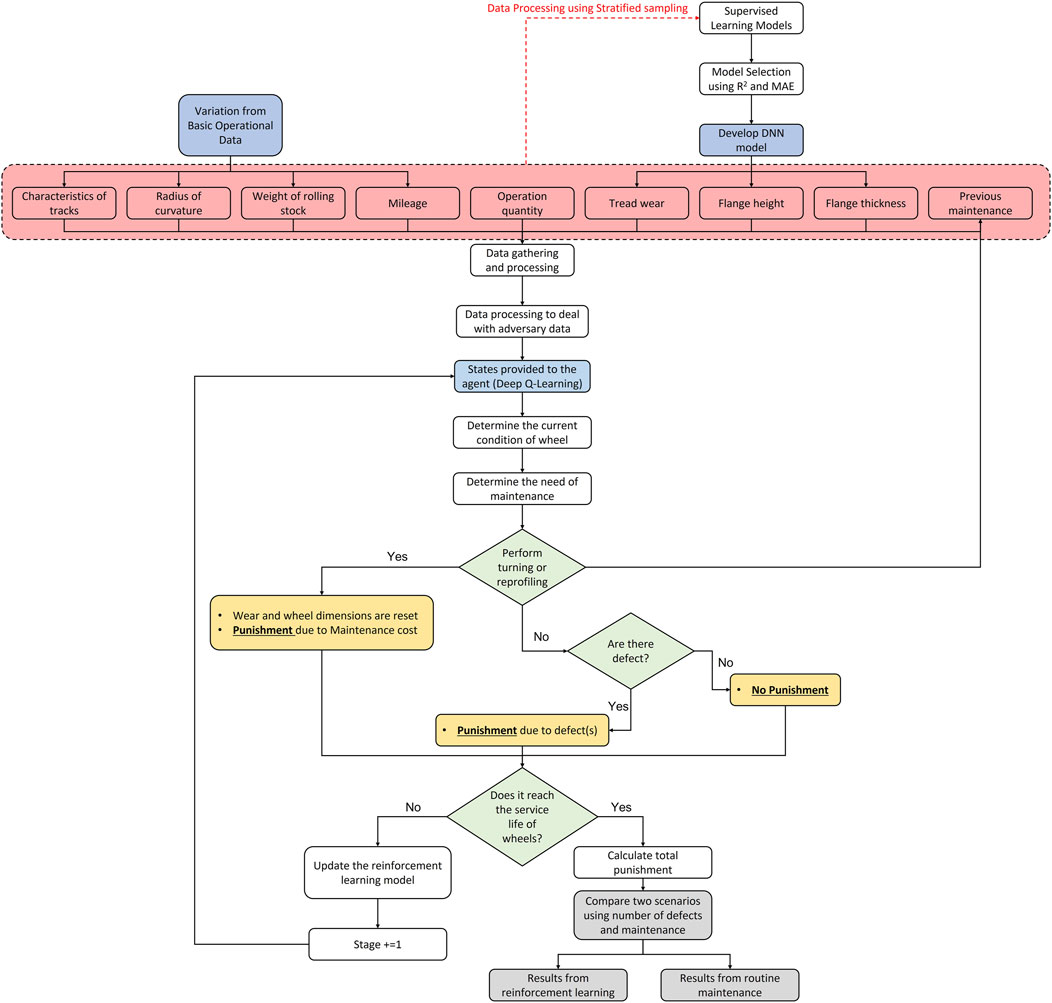
Figure 8. Workflow of the reinforcement learning model.
To integrate supervised learning and reinforcement learning, the supervised learning models developed in Section 3.3 will be evaluated by using MAE and R2 to select the supervised learning model with the best performance after hyperparameter tuning. Then, the supervised learning model will be embedded in the reinforcement learning model to predict the railway wheel wear and related dimensions for the agent to take action and receive defined rewards. The agent will learn from the states provided by the environment which partially resulted from the supervised learning model embedded in the reinforcement learning model making the hybrid learning strategies. In real-world situations, railway operators can feed the developed approach with operational data consisting of the weight and speed of rolling stocks and track characteristics as shown in Figure 8 regularly and obtain the result from the reinforcement learning model whether it is the time for wheel reprofiling. To test the performance of the developed approach, the result from the reinforcement learning will be compared with the result from routine maintenance when the assumption is the inspection and measurement will be done every 50,000 km as mentioned in the previous paragraph.
As mentioned, the prediction of wear is done by using the DNN model. The performance of the DNN model is shown in Table 2. MAE and R2 are used to evaluate the performance of the supervised learning model and model selection. From the evaluation, the DNN model provides the best performance when the MAEs of tread wear, flange height, and flange thickness are about 1 mm and the range of R2 is between 0.84 and 0.96 which is satisfying in terms of the model performance. Therefore, the DNN model will be integrated with the reinforcement learning model to prepare the maintenance schedule. For the reinforcement learning model, the model evaluation is not as straightforward as the supervised learning model. The model’s metric cannot be used to evaluate the performance of the model directly because there is no comparable metric in this case. Therefore, to evaluate the performance of the reinforcement learning model, the result from the model will be compared to the result from the routine maintenance when the inspection and measurement are done every 50,000 km of operation as mentioned. The indicators used to evaluate are the number of defects and maintenance. The reinforcement learning model is developed using DQN. The iteration or the number of training cycles is set to 100,000 to make sure that the model is trained until it converges to the optimal solution. To evaluate the performance of the reinforcement learning model, the results from the developed reinforcement learning model and the results from the routine maintenance are compared. As mentioned, routine inspection and measurement are done every 50,000 km. When the wear and related wheel dimensions exceed the threshold, wheel reprofiling will be performed. Then, the dimensions of the wheel will be reset. To compare the results, the number of defects and the number of performed maintenance are compared. The outcomes are shown in Figure 9. From the figure, the number of defects and performed maintenance are compared. The number of defects is categorized into two groups, individual defects and combined defects. Individual defects are considered when any defects occur. In other words, defects are taken into account when tread wear, flange height, or flange thickness exceed the thresholds although more than one of them occurs together at the same stage in the reinforcement learning. Different from individual defects, combined defects are considered based on the overall condition of the wheel. If at least one of the wear or related wheel dimensions exceeds the thresholds, the wheel is considered combinedly defective regardless of how many defects take place in the same stage in the reinforcement learning model. From the figure, the number of defects both individual and combined defects when the reprofiling is scheduled using reinforcement learning is zero or defect-free. However, the use of routine inspection, measurement, and maintenance has significantly higher numbers when the number of individual and combined defects are 1,745 and 715 respectively.

Figure 9. Comparison of results between the reinforcement learning model and routine maintenance strategies.
For the number of performed maintenance, the number from the reinforcement learning is 71 while the number of the routine maintenance is 22 or 69% higher. This is because the agent of the reinforcement learning model is trained to perform wheel profiling as necessary to avoid defects in terms of tread wear, flange height, and flange thickness. The agent can predict the appropriate period to perform wheel reprofiling based on the operational data while the routine maintenance does not have the potential to detect the essentiality of maintenance on time. That is why the number of performed maintenance from the routine maintenance is lower than the results from the reinforcement learning while the number of defects is significantly higher. In addition, the use of routine maintenance makes railway wheels to be employed although they are defectives that spoil the safety, passenger comfort, and overall efficiency of the railway operation. For more detail, Figure 10 demonstrates the number of individual defects and wheel reprofiling based on mileage from the reinforcement learning model and routine maintenance. The figure presents the results from the first 50,000 km of operation. It is worth repeating that the weight of the rolling stock of every stage or 1,000 km varied during the reinforcement learning model development. From the figure, there are no individual defects when the reprofiling schedule based on the reinforcement learning model is used as mentioned. However, the individual defects when routine maintenance is used start emerging after the rolling stock is operated for 21,000 km. Then, the number of individual defects becomes two after the 23,000 km operation and three after the 29,000 km operation. The order of emerging defects is flange thickness, tread wear, and flange height respectively. In other words, the rolling stock is operated with a defective wheel for 29,000 km before the wheel is reprofiled after the inspection and maintenance are done when the rolling stock is employed for 50,000 km in case of routine maintenance. For reinforcement learning, the wheel reprofiling is done four times during the first 50,000 km of operation at 12,000, 26,000, 41,000, and 46,000 km of operation.
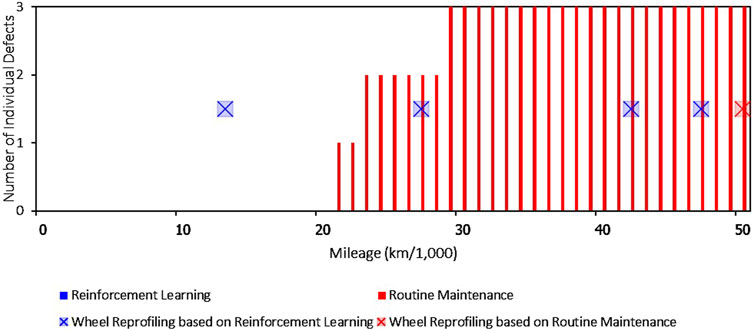
Figure 10. Relationship between the number of individual defects and wheel reprofiling events as a function of mileage.
To demonstrate a clearer view of the performance of reinforcement learning, Figure 11 presents examples of wear and related wheel dimensions consisting of tread wear, flange height, and flange thickness when reprofiling is done based on reinforcement learning and routine maintenance for the first 50,000 km of operation. It can be seen that the results from the reinforcement learning model can maintain the wear and related wheel dimensions in the defect-free zone. However, routine maintenance does not respond well enough to eliminate defects from railway wheels because the inspection and measurement cannot be done all the time especially when the wear and related wheel dimensions reach the defined thresholds. Therefore, the rolling stock is employed while the wheels are defective for more than 50% of the operation period before defects are inspected. The thresholds of tread wear, flange height, and flange thickness are 10, 36, and 28 mm respectively. From the figures, it can be seen that the reprofiling schedule prepared by the reinforcement learning model outperforms the reprofiling schedule prepared by routine maintenance based on the number of defects found during the operation.
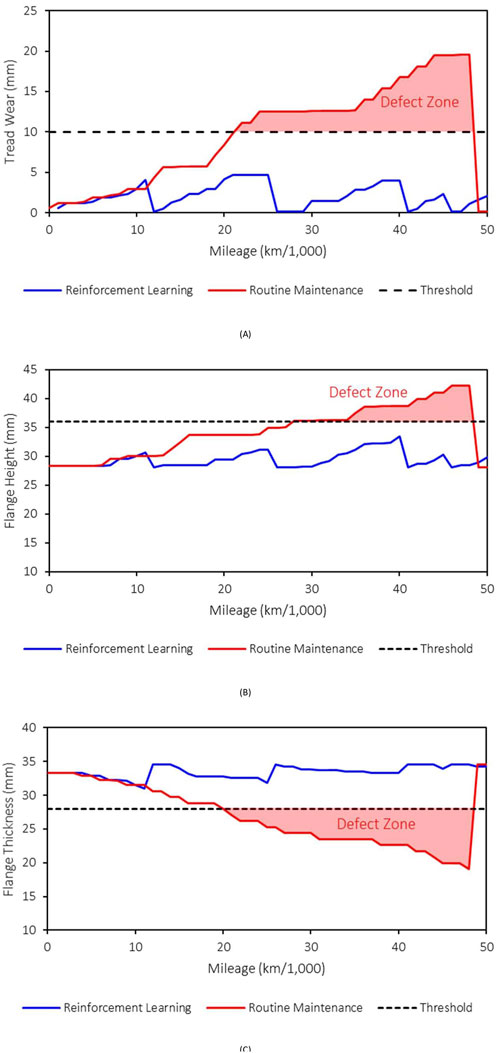
Figure 11. Examples of wear and corresponding wheel dimensions under two maintenance strategies: reinforcement learning-based reprofiling and routine maintenance. (A) Tread wear, (B) Flange height, and (C) Flange thickness.
It can be concluded that the developed hybrid learning strategies in this study can meet the aim of using limited measurement data of wheel profiles to manage railway wheel wear efficiently. The contributions of the study are railway operators can use the concept proposed in this study to manage wear when the number of wheel inspections and measurements can be reduced. In addition, the inputs of the developed approaches are basic operational data which already available or easy to obtain. Therefore, railway operators can reduce maintenance costs, improve maintenance efficiency, reduce the number of defects, reduce possession and inspection times, improve passenger comfort, and improve safety. The overall efficiency of the railway operation and railway system will be improved and the data-driven scheme is more practical when applying the developed approach. The contributions of the study to the existing research area are this study introduces a novel integration of supervised and reinforcement learning specifically tailored for railway wheel wear management. By leveraging the strengths of both approaches, it addresses the limitations of traditional predictive maintenance models that rely solely on either historical data or human experience. In other words, this study demonstrates the potential of hybrid learning strategies in which researchers can further develop and apply the concept to suit their problems. The study also proposes the approach requiring operational data only without complex data or installed sensors for data gathering. In real-world situations, railway operators can feed the developed approach with operational data as mentioned as shown in Figure 8, or other data that railway operators use to further train the reinforcement learning model regularly and obtain the result from the reinforcement learning model whether it is the time for wheel reprofiling or the wheels’ dimensions. Although the research in this field is new and railway operators have not employed this approach, the result of this study proves that the developed approach has the potential to be applied in real-world situations. Railway operators might not fully rely on the developed approach for maintenance but they can employ the developed approach as a guideline or decision-making support tool for the maintenance. When the model has been trained assuredly and the data is rich enough under particular circumstances, railway operators can rely on the developed approach more and use it as the decision-making tool to drive their organizations to data-driven organizations which is the ultimate goal of different global organizations in the present.
This study is the world’s first attempt to develop hybrid learning strategies integrating supervised and reinforcement techniques to manage railway wheel wear with limited measurement data. The supervised learning technique is used to predict wear and related wheel dimensions using basic operational data such as characteristics of tracks, radius of curvature, weights of rolling stock, travel distance, and operational quantity. The MBS using UM is used to explore the dynamic and wear behavior of railway wheels. The total number of samples used to train the machine learning model is higher than 44,000 samples which is big and comprehensive enough to mimic the real-world situations. From the predictive model development, DNN provides the best outcome in predicting wear and related wheel dimensions when R2 is higher than 0.84 in every prediction. In addition, the MAE is about 1 mm presenting the satisfying performance of the predictive model.
Then, the developed supervised learning model is integrated with the reinforcement learning model. In this study, the DQN technique is used to develop the reinforcement learning model. Different states based on the supervised learning model are fed into the model to inform the agent about the current conditions of railway wheels. Then, the agent has to choose the actions to reprofile or not perform any maintenance after receiving states from the environment. The rewards or punishments in this study are set based on the found defects and maintenance costs. In other words, if any wear or related wheel dimensions exceed the threshold, they are considered defective and the punishment is provided to the agent. At the same time, if the agent chooses to do the wheel reprofiling, a relatively small punishment is also provided to the agent to make sure that the agent will not keep maintaining the wheels to avoid defects. The highest rewards or lowest punishment occur when there is no defect and the agent does not perform the maintenance. However, it has the possibility that the defect will take place in the next stage. Therefore, the agent has to learn how to optimize the reprofiling at the minimum number while keeping wheels free from defects. This is a challenge that is complicated and almost impossible when the maintenance schedule is planned by humans. From the reinforcement learning model, the results show that the use of reinforcement learning to schedule the reprofiling can eliminate the defects from railway wheels by optimal reprofiling to be done at the appropriate time and as low as necessary. Therefore, railway operators will obtain advantages from applying the developed approach proposed in this study in terms of maintenance cost reduction, maintenance efficiency improvement, defect reduction, possession and inspection time reduction, passenger comfort improvement, and safety improvement. Overall, the efficiency of railway maintenance will be improved.
To apply the developed approach in a real-world situation, railway operators can use the framework proposed in this study to develop hybrid learning strategies and use their data to train the supervised learning and reinforcement learning model to tune the models based on their conditions. Railway operators can achieve the data-driven approach by using the developed framework to support decision-making rather than human past experience which can be biased. The limitations of this study are the investigation has been done using the freight train only. Passenger trains might have different conditions and behaviors. In addition, the speeds of rolling stock are limited to the speed of freight trains so additional variations should be further investigated. Some complexity can be added to the machine learning models to mimic different requirements of each railway operator such as limited resources or possession time. Other maintenance activities can be added to improve the degree of complexity. These complexities can be explored in future studies.
The raw data supporting the conclusions of this article will be made available by the authors, without undue reservation.
JS: Conceptualization, Data curation, Formal Analysis, Investigation, Methodology, Software, Writing–original draft. CN: Resources, Validation, Visualization, Writing–review and editing. SK: Project administration, Supervision, Writing–review and editing.
The author(s) declare that no financial support was received for the research, authorship, and/or publication of this article.
The authors declare that the research was conducted in the absence of any commercial or financial relationships that could be construed as a potential conflict of interest.
The author(s) declared that they were an editorial board member of Frontiers, at the time of submission. This had no impact on the peer review process and the final decision.
The author(s) declare that no Generative AI was used in the creation of this manuscript.
All claims expressed in this article are solely those of the authors and do not necessarily represent those of their affiliated organizations, or those of the publisher, the editors and the reviewers. Any product that may be evaluated in this article, or claim that may be made by its manufacturer, is not guaranteed or endorsed by the publisher.
Alemi, A., Corman, F., and Lodewijks, G. (2017). Condition monitoring approaches for the detection of railway wheel defects. Proc. Institution Mech. Eng. Part F J. Rail Rapid Transit 231 (8), 961–981. doi:10.1177/0954409716656218
Arcieri, G., Hoelzl, C., Schwery, O., Straub, D., Papakonstantinou, K. G., and Chatzi, E. (2024). POMDP inference and robust solution via deep reinforcement learning: an application to railway optimal maintenance. Mach. Learn. 113, 7967–7995. doi:10.1007/s10994-024-06559-2
Asplund, M., Gustafsson, P., Nordmark, T., Rantatalo, M., Palo, M., Famurewa, S. M., et al. (2014). Reliability and measurement accuracy of a condition monitoring system in an extreme climate: a case study of automatic laser scanning of wheel profiles. Proc. Institution Mech. Eng. Part F J. Rail Rapid Transit 228 (6), 695–704. doi:10.1177/0954409714528485
Belotti, V., Crenna, F., Michelini, R. C., and Rossi, G. B. (2006). Wheel-flat diagnostic tool via wavelet transform. Mech. Syst. Signal Process. 20 (8), 1953–1966. doi:10.1016/j.ymssp.2005.12.012
Braghin, F., Bruni, S., and Lewis, R. (2009). “Railway wheel wear,” in Wheel–rail interface handbook (Elsevier), 172–210.
Brizuela, J., Fritsch, C., and Ibáñez, A. (2011). Railway wheel-flat detection and measurement by ultrasound. Transp. Res. part C Emerg. Technol. 19 (6), 975–984. doi:10.1016/j.trc.2011.04.004
Cao, X., Shi, L., Cai, Z., Liu, Q., Zhou, Z., and Wang, W. (2018). Investigation on the microstructure and damage characteristics of wheel and rail materials subject to laser dispersed quenching. Appl. Surf. Sci. 450, 468–483. doi:10.1016/j.apsusc.2018.04.210
Chen, C., Zhu, F., Xu, Z., Xie, Q., Lo, S. M., Tsui, K. L., et al. (2024). Knowledge-informed wheel wear prediction method for high-speed train using multisource signal data. IEEE Trans. Instrum. Meas. 73, 1–12. doi:10.1109/tim.2024.3413151
Deng, Y., Liu, L., Li, M., Jiang, M., Peng, B., and Yang, Y. (2023). A data-driven wheel wear prediction model for rail train based on LM-OMP-NARXNN. J. Comput. Inf. Sci. Eng. 23 (2), 021012. doi:10.1115/1.4054488
Dos Santos, G. F., Barbosa, R. S., Shu, X., Urban, C., and Joy, R. (2014). Characterization and modelling of a new heavy axle load freight wagon for wheel rail wear prediction. J. Mech. Eng. Technol. 2 (3), 17–28. doi:10.18005/jmet0203001
Du Plessis, J. A. (2019). Implementation of machine learning techniques for railway wheel prognostics. S. Afr. J. Ind. Eng. 31 (1), 78–92. doi:10.7166/31-1-2128
Emoto, T., Emaru, T., Ravankar, A., Ravankar, A., and Kobayashi, Y. (2024). A method for detecting wear and damage on railcar wheel tread surface using a combination of laser measurement and machine vision. Mech. Eng. J. 11 (3), 23–00352. doi:10.1299/mej.23-00352
Filograno, M. L., Corredera, P., Rodriguez-Plaza, M., Andres-Alguacil, A., and Gonzalez-Herraez, M. (2013). Wheel flat detection in high-speed railway systems using fiber Bragg gratings. IEEE Sensors J. 13 (12), 4808–4816. doi:10.1109/jsen.2013.2274008
Fu, Z. K., Ding, H., Wang, W., Liu, Q., Guo, J., and Zhu, M. (2015). Investigation on microstructure and wear characteristic of laser cladding Fe-based alloy on wheel/rail materials. Wear 330, 592–599. doi:10.1016/j.wear.2015.02.053
Gigante-Barrera, Á., Dindar, S., Kaewunruen, S., and Ruikar, D. (2017). LOD BIM element specification for railway turnout systems risk mitigation using the information delivery manual. IOP Conf. Ser. Mater. Sci. Eng. 245 (4), 042022. doi:10.1088/1757-899x/245/4/042022
Grassie, S. L. (2009). “Maintenance of the wheel–rail interface,” in Wheel–rail interface handbook (Elsevier), 576–607.
Hou, M., Chen, B., and Cheng, D. (2022). Study on the evolution of wheel wear and its impact on vehicle dynamics of high-speed trains. Coatings 12, 1333. doi:10.3390/coatings12091333
Hu, Y., Watson, M., Maiorino, M., Zhou, L., Wang, W., Ding, H., et al. (2021). Experimental study on wear properties of wheel and rail materials with different hardness values. Wear 477, 203831. doi:10.1016/j.wear.2021.203831
Huang, W., Li, Y., Wu, X., and Shen, J. (2023). The wear detection of mill-grinding tool based on acoustic emission sensor. Int. J. Adv. Manuf. Technol. 124 (11), 4121–4130. doi:10.1007/s00170-022-09058-7
Johansson, A., and Nielsen, J. C. O. (2003). Out-of-round railway wheels—wheel-rail contact forces and track response derived from field tests and numerical simulations. Proc. Institution Mech. Eng. Part F J. Rail Rapid Transit 217 (2), 135–146. doi:10.1243/095440903765762878
Kaewunruen, S., and Dindar, S. (2018). The effect of climate change on service life and cost investigation of rail turnouts with various mitigation methods. Chicago, IL: Institute of Noise Control Engineering.
Kisilowski, J. and R. (2021). Mechanical wear contact between the wheel and rail on a turnout with variable stiffness. Energies 14, 7520. doi:10.3390/en14227520
Liu, S., He, Q., Fu, W., and Feng, Q. (2024). A two-step data-driven method for predicting the wear of train wheel treads using GA-BPNN and LSTM algorithms. Int. J. Rail Transp., 1–18. doi:10.1080/23248378.2024.2324092
Lu, Y., Yang, Y., Wang, J., and Zhu, B. (2020). Optimization and design of a railway wheel profile based on interval uncertainty to reduce circular wear. Math. Problems Eng. 2020 (1), 1–10. doi:10.1155/2020/9579510
Maanshan Kingrail Technology Co., Ltd (2023). How often are train wheels replaced? Available at: https://www.kingrailparts.com/Blog/111.html.
Magel, E., Mutton, P., Ekberg, A., and Kapoor, A. (2016). Rolling contact fatigue, wear and broken rail derailments. Wear 366, 249–257. doi:10.1016/j.wear.2016.06.009
Mohammadi, R., and He, Q. (2022). A deep reinforcement learning approach for rail renewal and maintenance planning. Reliab. Eng. and Syst. Saf. 225, 108615. doi:10.1016/j.ress.2022.108615
Montinaro, N., Epasto, G., Cerniglia, D., and Guglielmino, E. (2019). Laser ultrasonics inspection for defect evaluation on train wheel. NDT and E Int. 107, 102145. doi:10.1016/j.ndteint.2019.102145
Muhamedsalih, Y., Stow, J., and Bevan, A. (2019). Use of railway wheel wear and damage prediction tools to improve maintenance efficiency through the use of economic tyre turning. Proc. Institution Mech. Eng. Part F J. Rail Rapid Transit 233 (1), 103–117. doi:10.1177/0954409718781127
Najeh, T., Lundberg, J., and Kerrouche, A. (2021). Deep-learning and vibration-based system for wear size estimation of railway switches and crossings. Sensors 21 (15), 5217. doi:10.3390/s21155217
Olshevskiy, A., Kim, C. W., and Yang, H. I. (2015). Wear simulation for the centre plate arrangement of a freight car. Veh. Syst. Dyn. 53 (6), 856–876. doi:10.1080/00423114.2015.1023319
Pascual, F., and Marcos, J. A. (2004). Wheel wear management on high-speed passenger rail: a common playground for design and maintenance engineering in the Talgo engineering cycle. IEEE, 193–199. doi:10.1115/rtd2004-66033
Qi, Y., Wang, R., Cui, X., Sang, H., and Mao, W. (2023). Research of operation mode of high-speed trains on the effect of rail wear evolution law. Industrial Lubr. Tribol. 75 (10), 1262–1271. doi:10.1108/ilt-08-2023-0276
Rail Safety and Standards Board Limited (2023). Railway wheelsets. Available at: https://www.rssb.co.uk/standards-catalogue/CatalogueItem/gmrt2466-iss-5.
Rovira, A., Roda, A., Marshall, M., Brunskill, H., and Lewis, R. (2011). Experimental and numerical modelling of wheel–rail contact and wear. Wear 271 (5-6), 911–924. doi:10.1016/j.wear.2011.03.024
Sakalo, V., Sakalo, A., Rodikov, A., and Tomashevskiy, S. (2019). Computer modeling of processes of wear and accumulation of rolling contact fatigue damage in railway wheels using combined criterion. Wear 432-433, 102900. doi:10.1016/j.wear.2019.05.015
Shebani, A., and Iwnicki, S. (2018). Prediction of wheel and rail wear under different contact conditions using artificial neural networks. Wear 406-407, 173–184. doi:10.1016/j.wear.2018.01.007
Shi, H., Wang, J., Wu, P., Song, C., and Teng, W. (2018). Field measurements of the evolution of wheel wear and vehicle dynamics for high-speed trains. Veh. Syst. Dyn. 56 (8), 1187–1206. doi:10.1080/00423114.2017.1406963
Silva e Silva, J. V. R., Antoniolli, F., Endlich, C., Pires, A., Scandian, C., and dos Santos, G. (2023). Influence of wheel tread wear on Rolling Contact Fatigue and on the dynamics of railway vehicles. Wear 523, 204735. doi:10.1016/j.wear.2023.204735
Singh, S. K., Das, A. K., and Racherla, V. (2023). Prediction of rail-wheel contact parameters for a metro coach using machine learning. Expert Syst. Appl. 215, 119343. doi:10.1016/j.eswa.2022.119343
Soleimani, H., Moavenian, M., Masoudi Nejad, R., and Liu, Z. (2021). An applied method for railway wheel profile measurements due to wear using image processing techniques. SN Appl. Sci. 3 (2), 147. doi:10.1007/s42452-021-04180-9
Sresakoolchai, J., and Kaewunruen, S. (2023). Railway infrastructure maintenance efficiency improvement using deep reinforcement learning integrated with digital twin based on track geometry and component defects. Sci. Rep. 13 (1), 2439. doi:10.1038/s41598-023-29526-8
Thakkar, N. A., Steel, J. A., Reuben, R., Knabe, G., Dixon, D., and Shanks, R. (2006). Monitoring of rail-wheel interaction using acoustic emission (AE). Adv. Mater. Res. 13, 161–168. doi:10.4028/0-87849-420-0.161
Wang, H., Li, Y.-F., and Men, T. (2024). Wavelet integrated CNN with dynamic frequency aggregation for high-speed train wheel wear prediction. IEEE Trans. Intelligent Transp. Syst. 25, 8960–8971. doi:10.1109/tits.2024.3365808
Wang, H., Men, T., and Li, Y.-F. (2022b). Transformer for high-speed train wheel wear prediction with multiplex local–global temporal fusion. IEEE Trans. Instrum. Meas. 71, 1–12. doi:10.1109/tim.2022.3154827
Wang, M., Jia, S., Chen, E., Yang, S., Liu, P., and Qi, Z. (2022a). Research and application of neural network for tread wear prediction and optimization. Mech. Syst. Signal Process. 162, 108070. doi:10.1016/j.ymssp.2021.108070
Wang, P., and Gao, L. (2015). Numerical simulation of wheel wear evolution for heavy haul railway. J. Central South Univ. 22 (1), 196–207. doi:10.1007/s11771-015-2510-1
Wang, S., Qian, Y., Feng, Q., Guo, F., Rizos, D., and Luo, X. (2021b). Investigating high rail side wear in urban transit track through numerical simulation and field monitoring. Wear 470-471, 203643. doi:10.1016/j.wear.2021.203643
Wang, S., Yan, H., Liu, C., Fan, N., Liu, X., and Wang, C. (2021a). Analysis and prediction of high-speed train wheel wear based on SIMPACK and backpropagation neural networks. Expert Syst. 38 (7), e12417. doi:10.1111/exsy.12417
Wei, C., Xin, Q., Chung, W. H., Liu, S. Y., Tam, H. Y., and Ho, S. L. (2011). Real-time train wheel condition monitoring by fiber Bragg grating sensors. Int. J. Distributed Sens. Netw. 8 (1), 409048. doi:10.1155/2012/409048
Xiao, Q., Chang, C., Zheng, J., and Fang, J. (2017). Prediction of wheel/rail rolling contact wear under the situation of wheel/rail vibration. Engineering.
Xie, Y., Cai, W., Li, Y., Yang, J., Liang, S., and Chi, M. (2024). A case study of the economic reprofiling method for a high-speed train's wheel tread in the frequent contact area. Wear 556-557, 205244. doi:10.1016/j.wear.2024.205244
Xing, Z., Zhang, Z., Yao, X., Qin, Y., and Jia, L. (2022). Rail wheel tread defect detection using improved YOLOv3. Measurement 203, 111959. doi:10.1016/j.measurement.2022.111959
Ye, Y., Huang, P., and Zhang, Y. (2022). Deep learning-based fault diagnostic network of high-speed train secondary suspension systems for immunity to track irregularities and wheel wear. Railw. Eng. Sci. 30, 96–116. doi:10.1007/s40534-021-00252-z
Zeng, Y., Song, D., Zhang, W., Zhou, B., Xie, M., and Tang, X. (2021). An optimal life cycle reprofiling strategy of train wheels based on Markov decision process of wheel degradation. IEEE Trans. Intelligent Transp. Syst. 23 (8), 10354–10364. doi:10.1109/tits.2021.3093019
Zhang, Z.-F., Gao, Z., Liu, Y. Y., Jiang, F. C., Yang, Y. L., Ren, Y. F., et al. (2011). Computer vision based method and system for online measurement of geometric parameters of train wheel sets. Sensors 12 (1), 334–346. doi:10.3390/s120100334
Zhou, L., Brunskill, H. P., and Lewis, R. (2019). Real-time non-invasive measurement and monitoring of wheel–rail contact using ultrasonic reflectometry. Struct. Health Monit. 18 (5-6), 1953–1965. doi:10.1177/1475921719829882
Zhu, A., Yang, S., Li, Q., Yang, J., Fu, C., Zhang, J., et al. (2019b). Research on prediction of metro wheel wear based on integrated data-model-driven approach. IEEE access 7, 178153–178166. doi:10.1109/access.2019.2950391
Zhu, Y., Yang, Y., Mu, X., Wang, W., Yao, Z., and Yang, H. (2019a). Study on wear and RCF performance of repaired damage railway wheels: assessing laser cladding to repair local defects on wheels. Wear 430, 126–136. doi:10.1016/j.wear.2019.04.028
Keywords: hybrid learning strategies, supervised learning, reinforcement learning, train wheel wear, predictive maintenance, conditional monitoring
Citation: Sresakoolchai J, Ngamkhanong C and Kaewunruen S (2025) Hybrid learning strategies: integrating supervised and reinforcement techniques for railway wheel wear management with limited measurement data. Front. Built Environ. 11:1546957. doi: 10.3389/fbuil.2025.1546957
Received: 17 December 2024; Accepted: 13 January 2025;
Published: 27 January 2025.
Edited by:
Amin Khajehdezfuly, Shahid Chamran University of Ahvaz, IranReviewed by:
Serdar Dindar, Yıldırım Beyazıt University, TürkiyeCopyright © 2025 Sresakoolchai, Ngamkhanong and Kaewunruen. This is an open-access article distributed under the terms of the Creative Commons Attribution License (CC BY). The use, distribution or reproduction in other forums is permitted, provided the original author(s) and the copyright owner(s) are credited and that the original publication in this journal is cited, in accordance with accepted academic practice. No use, distribution or reproduction is permitted which does not comply with these terms.
*Correspondence: Jessada Sresakoolchai, amVzc2FkYS5zckBwc3UuYWMudGg=
Disclaimer: All claims expressed in this article are solely those of the authors and do not necessarily represent those of their affiliated organizations, or those of the publisher, the editors and the reviewers. Any product that may be evaluated in this article or claim that may be made by its manufacturer is not guaranteed or endorsed by the publisher.
Research integrity at Frontiers
Learn more about the work of our research integrity team to safeguard the quality of each article we publish.