 Long Yu1
 Yunrui Han
 Rui Pang
94% of researchers rate our articles as excellent or good
Learn more about the work of our research integrity team to safeguard the quality of each article we publish.
Find out more
ORIGINAL RESEARCH article
Front. Built Environ., 31 January 2025
Sec. Coastal and Offshore Engineering
Volume 11 - 2025 | https://doi.org/10.3389/fbuil.2025.1545900
This article is part of the Research TopicEnhancing Safety of Marine Engineering in Dynamic Ocean Environments and Multi-Hazard ScenariosView all articles
Determining the failure probabilities of submarine slopes over long distances is crucial for assessing slope stability, given the randomness of soil parameters. Based on the theory of stochastic fields and the method of limit equilibrium, this study introduces a quantitative method that incorporates spatial variability of soil parameters to evaluate submarine slope stability. Assuming a linear increase in undrained strength with depth, the slope stability is estimated under static loading derived from nonstationary random fields, and the effect of a weak layer on the slope stability is also analyzed. This study show that ignores the spatial variability of the soil parameters significantly overestimate the performance for the slope stability. In conclusion, the lower and upper ends of the probability index range are found to have great significance in practical engineering design. The combination of traditional deterministic slope analysis and probabilistic assessments will be beneficial to slope engineering practice and will improve the decision-making process.
With the increasing number of projects involving deep-sea oil and gas exploration and deep-water engineering, the instances of submarine landslides and marine geological hazards have also increased, thereby seriously endangering the safety of deep-water oil and gas drilling platforms, submarine pipelines, submarine cables, and other engineering facilities (Liu, 2010). Rui et al. (2024) have enhanced the understanding of marine engineering geological characteristics by analyzing the formation mechanism of seabed trenches. They have demonstrated that understanding the properties of seabed soils and potential geological hazards can help engineers design safer and more economical marine structures (Rui et al., 2024). The evaluation of the submarine slopes’ stability has become a crucial yet difficult problem in the field of international marine engineering geology recently. Traditional deterministic slope stability assessments (Junbu, 1957; Bishop, 1955; Morgenstern and Price, 1965; Spencer, 1967) often overlook the explicit quantification of uncertainties, instead relying heavily on conservative parameter estimates and designs to address ambiguous scenarios. This approach, however, poses significant challenges in meeting the intricate demands of resolving real-world problems, where the need for precision and adaptability to uncertain conditions grows increasingly paramount. Phoon and Kulhawy (1999) noted that there are three primary sources of geotechnical uncertainty, i.e., inherent variability, measurement error, and transformation uncertainty. Consequently, approaches that integrate reliability assessments and probabilistic techniques to account for the variability in soil properties have been introduced for the stability evaluation of slopes.
Initial probabilistic slope stability analysis appeared in the 1970s (Matsuo and Kuroda, 1974; Alonso, 1976; Tang et al., 1976; Vanmarcke, 1977a) and studies continued to increase. Various methods have been developed for evaluating the reliability of geotechnical structures, for example, first-order second moment (FOSM) method (Shinozuka, 1983), first-order reliability method (FORM) (Juang et al., 2006), Monte Carlo simulation method (MCSM) (Juang et al., 1991; Wang et al., 2010), response surface method (RSM) (Wong, 1985). For example, Rodríguez-Ochoa et al. (2015) proposed a probabilistic framework to calculate the probability of submarine slope collapse triggered by earthquakes using FORM, MCSM and Bayesian updating. Zhu et al. (2018) analyzed the failure probability of a typical slope section in the norther South China Sea by using RSM and Advanced First Order Second Moment method. Yang et al. (2007) used the FOSM, PEM and FORM via RSM combined with the finite element method to compute and compared the reliability index of submarine slopes, and the applicable conditions of different methods are provided. Nevertheless, the conventional reliability approaches utilized in these investigations merely regard soil parameters as stochastic variables, overlooking the spatial variability of the soil properties in slope formation. Because the various geologic, environmental, and physical–chemical processes, all soil properties in situ will vary vertically and horizontally, it stands as a crucial element in the field of reliability assessment (Phoon et al., 2016). Li et al. (2024) conducted a study on the reliability and sensitivity analysis of monopile-supported offshore wind turbines (OWTs) based on the probability density evolution method and pre-screening of control parameters. This approach can effectively reduce the number of samples required for probability density evolution calculations, providing reasonably accurate results for reliability analysis. Fenton and Vanmarcke (1990) developed the Local Averaging Subdivision (LAS) method which fully accounts for spatial variability of geotechnical random field parameters such as soil weight, elastic modulus, friction angle, cohesion etc., And it is widely used in random finite–element method (RFEM). For example, Griffiths and Fenton (2000), Griffiths and Fenton (2004), Griffiths et al. (2009) studied slope stabilities using RFEM, which considers the spatial variability, and results indicate that it could result in overly optimistic assessments of the probability of slope failure, disregarding the spatial distribution. Dyson and Tolooiyan (2019) proposed a comparative and predictive random field methodology for finite element analysis of slope stability through three case studies, significantly diminishing the computational demands associated with Monte Carlo simulations. Zhu et al. (2017) explore the impact of spatial variability on the undrained stability of normally consolidated random slopes by utilizing RFEM, and the results can help engineers obtain a preliminarily evaluation of the probability of failure for slopes composed of normally consolidated clay. Various reliability methods have been implemented in the realm of slope engineering, yet their use in the context of submarine slopes remains comparatively scarce. In fact, analysis that considers the spatial variability of marine sediments is rarely reported. Although numerous studies have reported the influence that spatial variability exerts on slope stability, they only consider the vertical correlation of soil parameters and the slope is short. It is observed that the horizontal correlation of soil parameters can be much more crucial to the analysis when the potential slip surface is relatively extensive (El-Ramly et al., 2002), and studies on this are relatively limited.
It is difficult to obtain high-quality undisturbed soil from the seabed, and hence, reports on the parameters of marine sediments that consider spatial variability are rare. Wang B. et al. (2024) have provided an in-depth understanding of the behavior of marine piles under different soil conditions through the analysis of marine soil parameters such as soil shear modulus and soil permeability coefficient. Consequently, there is a demand for more efficient reliability methodologies to assess the stability of submarine slopes. In addition, the failure mechanics of submarine slopes are extremely intricate, and many factors affect the stability of these slopes. Recent research into the causative factors of submarine landslides indicates that the presence of a weak layer within the soil is a significant contributor to such events. In this study, the impact of a weak layer on the probability of occurrence of a submarine slope landslide has been examined using a weak layer model.
In this research, the spatial heterogeneity of the submarine slope’s strength is characterized through the use of nonstationary random fields. First, the effectiveness of the method considered in this study is verified by using the classical case study of James Bay. Then, the stability of the submarine slope is assessed using the limit equilibrium method in conjunction with random fields, considering the undrained shear strength that increases linearly with depth. In addition, a local average method that samples the soil properties at a specified distance along the slip surface is applied to consider spatial variability. Finally, the influence of the variation in important parameters on the reliability of a submarine slope with different sample distances is quantitatively analyzed. The subject slope is situated in the northern region of the South China Sea, positioned on the continental slope with a depth of 300 m beneath the water surface.
Broadly speaking, both the probabilistic slope stability analysis approach and the deterministic analysis method share foundational concepts (e.g., failure modes and the limiting equilibrium). However, the probabilistic method has the advantage of being able to quantitatively interpret the sources of various uncertainties. As follows is the concept of probabilistic analysis into the design of slopes. The data on hand are examined to obtain a probability distribution that accurately represents each variable involved. Only those parameters, deemed to significantly influence the analysis due to their variability, necessitate being modeled as variables, such as the undrained shear strength, friction angle, and unit weight (Matsuo and Kuroda, 1974; Alonso, 1976). Then, the failure mode is evaluated, and the suitable slope model and analysis methods are selected. Finally, the probability distribution of the safety factor is estimated by using integrated input distributions with stability analysis. The reliability index and failure probability are obtained and are valuable supplements to the results obtained using conventional deterministic slope analysis.
In the last 30 years, various efforts have been undertaken to develop probabilistic approaches for analyzing slope stability (Nguyen and Chowdhury, 1984; Li and Lumb, 1987; Li, 1992; Low and Tang, 1997). These approaches differ in the level of assurances, constraints, capacity to address intricate problems, and mathematical complexity. However, the majority of these methods can be categorized into one of three categories: analytical methods, approximation techniques, or Monte Carlo simulations. Monte Carlo simulation has become the first choice in reliability analysis because of its unique advantages, and when it is combined with the random field theory, results that are closer to the practical situations are obtained.
Durap et al. (2023) have proposed an integrated Bayesian risk model that combines 3D hydrodynamic transport with Monte Carlo simulation to assess coastal landslide risk. This approach offers a more accurate method for evaluating coastal landslide risks, providing a safer and more reliable risk assessment tool for global coastal regions. Wang Z. et al. (2024) has developed a methodology for real-time assessment of seafloor slope stability under rapid sedimentation conditions. This method employs a calibrated finite element model to simulate the rapid sedimentation processes and offers an approach for computing the safety factor for the stability of the sedimented seafloor slopes. Tan et al. (2023) have proposed a probabilistic framework to evaluate the susceptibility of submarine landslides occurring on continental slopes that are rich in gas hydrates. This framework integrates multiple steps: initially, it constructs a comprehensive database, then expeditiously develops predictive models, and finally assesses landslide susceptibility to anticipate the potential hazards posed by submarine landslides. Monte Carlo simulations, by introducing reasonable error ranges and generating extensive simulated data, provide error analysis and probability distribution of the assessment results. This approach is particularly effective for conducting rational risk assessments in contexts with limited data availability. The basic theory on which the simulation is based is discussed below.
Monte Carlo simulation serves as a potent tool for tackling mathematically intricate problems, providing a comparatively precise approach for current reliability computations. Monte Carlo simulation employs a random number generator to assign a stochastic value to each input variable, adhering to its corresponding probability distribution. This chosen value is subsequently applied to resolve the performance function and to determine the safety factor. For a slope, the limit state equation function Equation 1 is first established according to its failure mechanism, stress, and rock mass structure:
where X1, X2, X3, … , Xn are random variables with independent distribution. N groups of random numbers satisfying their probability distributions are generated by the random number generator and are expressed as Xi = (xi1, xi2, xi3, … , xin). Zi is a random sample with a safety factor that can be obtained for each sampling. If there are M random samples whose value is less than 1 and if N is sufficiently large, the frequency of the slope aligns closely with the probability dictated by Bernoulli’s law. Therefore, the probability of slope failure can be estimated as Equation 2
However, the most effective applications of probability theory in slope stability analysis have expressed uncertainties through a reliability index, defined as Equation 3
where β is the reliability index, with the target reliability of slope engineering being approximately 2.321–2.748 (Zhu, 1993), and F is the computed safety factor, which is assumed to follow a normal distribution. The reliability index describes safety in terms of the number of standard deviations separating the best estimate of F from its defined failure value of 1.0. When the shape of the probability distribution of the safety factor is known, the reliability index can be related to the probability of failure. Figure 1 shows this relationship for a normally distributed safety factor.
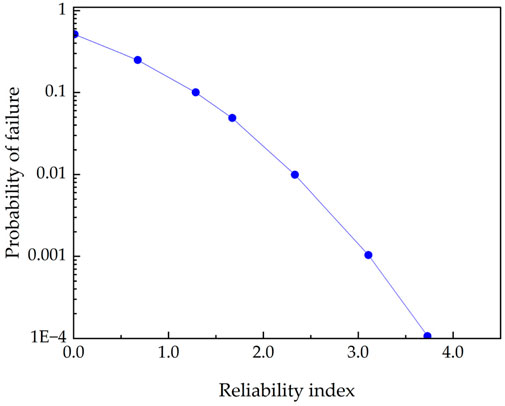
Figure 1. Nominal probability of failure for normally distributed F as function of reliability index.
In most cases, studies on the spatial variability of geotechnical data are grounded in random field theory, which similarly underpins the proposed research methodologies. The physical aspects of geotechnical parameters (including the elastic modulus, cohesion, angle of internal friction of rock or soil, and soft intercalation) and the elastic modulus of mass concrete materials have obvious spatial variability, which can be decomposed conveniently into a smoothly varying trend function [t(z)] and a fluctuating component [w(z)] as follows:
where x is the in situ soil property and z is the depth. The fluctuating component defined in Equation 4 represents the inherent soil variability. In a spatial domain in which the position parameter is regarded as the independent variable, the parameter at any position in the space satisfies a certain probability distribution. A set of these random variables is called the random field. The random field theory is a mathematical approach designed to represent intricate spatial and/or temporal variations and correlations of a characteristic. The practical application of this theory in engineering was initially developed by Vanmarcke (1977b); this research has become the primary benchmark for the majority of investigations considering the geotechnical properties’ spatial variability. In this study, the inherent soil variability is modeled as a random field, characterized succinctly through the coefficient of variation (COV) and the fluctuation scale.
Vanmarcke’s central thesis regarding random fields is that the local point-to-point variation within the field is challenging (or even impossible) to obtain in practice and may lack significant practical relevance. Indeed, local averages over a spatial or temporal domain are considered to have much greater practical value. Figure 2 shows a one-dimensional random field x with a mean E[x] and variance σ2. The local average of the random field on a discrete element [z-Z/2, z + Z/2] is defined as Equation 5
where Z is the length of the local average element, SZ(z) is a local average random field, and S(x) is a one-dimensional continuous parameter uniform random field. If SZ and SZ’ are two locally average random fields, the covariance is as follows (Equation 6):
where Γ2(Z) is a dimensionless variance function. For the majority of commonly used correlation functions, Vanmarcke and Grigoriu (1983) showed that Γ2(Z) can be approximated as Equation 7
where δ is the scale of fluctuation. The model suggests no reduction in variance, i.e., Γ2(Z) = 1, due to local averaging until the averaging interval Z is equal to δ. The local averages of the variable x over intervals Z and Z′ (see Figure 2) and X(Z) and X′(Z′) are spatially correlated. The correlation coefficient ρ(XZ, X′Z′) between X(Z) and X′(Z′) is given by (Equation 8)
where Z0 is the separation of the two intervals, Z1 represents the distance from the start of the first interval to the start of the second interval, Z2 represents the distance from the start of the first interval to the end of the second interval, and Z3 represents the distance from the end of the first interval to the end of the second interval.
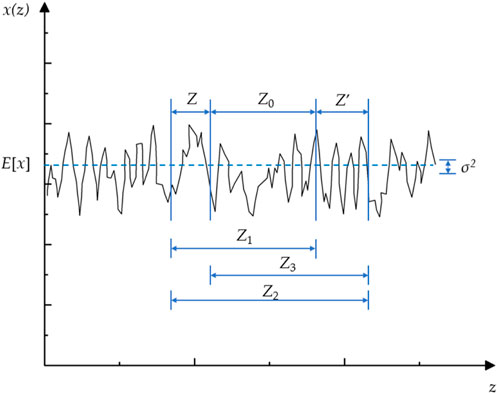
Figure 2. Realization of one-dimensional random field X(z) showing local averages over intervals Z and Z′.
The characteristics of soil at any two spatial locations may vary, yet they exhibit a correlation. The autocorrelation of the soil parameters generally decreases with an increase in the distance between the two points, and it is almost negligible when the distance is greater than a specific value; this particular value is defined as the scale of fluctuation. Li (1994) used the autocorrelation distance to characterize the degree of spatial autocorrelation of soil parameters. Conceptually, the scale of fluctuation shares the same physical significance as the autocorrelation distance, although they differ in their numerical values. For the typical exponential autocorrelation models, δ is equivalent to twice the autocorrelation distance. The scale of fluctuation is a crucial component of the autocorrelation function and plays a significant role in characterizing the spatial autocorrelation of soil parameters. Therefore, before carrying out conducting reliability analysis, it is essential to ascertain the scale of fluctuation of soil characteristics at the geotechnical site.
So far, numerous studies have estimated the scale of fluctuation of soil parameters utilizing field measurement data (Cafaro and Cherubini, 2002; Uzielli et al., 2005; Cao and Wang, 2014). At present, most of the in-situ tests are limited to the vertical scale of fluctuation (δv) of soil parameters, and it is difficult to measure the horizontal scale of fluctuation (δh) of soil parameters directly. In addition, for a particular geotechnical site, especially deep-sea sites, the onsite data are usually very limited. It usually requires considerable labor force and material resources to obtain a large amount of field-measured data. Uzielli et al. (2005) suggested that the scale of fluctuation is associated with the deposition process of the soil layer, yet it remains independent of the soil type. Therefore, different types of soil may have a similar scale of fluctuation.
In this study, the relevant literature is examined to collect the range of the scale of fluctuation for the undrained shear strength (Phoon and Kulhawy, 1999; Salgado and Kim, 2014; Jaksa, 1995). The vertical scale of fluctuation for the undrained shear strength of clay falls within the range of 1–8 m, while the horizontal scale of fluctuation lies within the range of 40–62 m. Given that stability is governed by the average shear strength along the failure surface, the horizontal spatial configuration may exert a more substantial influence on the analysis (El-Ramly et al., 2002). When vertical and horizontal spatial structures are deemed to have equal significance, the soil variability can be roughly modeled as an isotropic entity with an equivalent isotropic scale of fluctuation (Salgado and Kim, 2014).
The maximum values of δv and δh of su are 8 and 62 m, respectively. Therefore, δeq of su is equal to approximately 23 m (using Equation 9). For a long submarine slope with a long distance, the scale of fluctuation will be considered to be close to the horizontal scale of fluctuation. The impact of the value of δ on the reliability results is analyzed in detail below.
The James Bay hydroelectric project (Luo et al., 2012), located in the northern region of Quebec, Canada, necessitated the establishment of roughly 50 km of dykes over soft and sensitive clay. The design proposal, often referenced in scholarly works, is presented in Figure 3. This embankment features a height of 12 m, with 3:1 side slopes and a 56-m-wide berm at mid-height. Typically, the initial 4 m beneath the surface consists of a clay crust. Beneath it lies a 9.5-m-thick marine clay stratum, which is underlain by a layer of lacustrine clay. The thickness of the lacustrine clay fluctuates based on the depth to the till. With an average till depth of 21.5 m, the lacustrine clay is estimated to be approximately 9.5 m thick. The dispersion in the relevant data has been quantified by Uzielli et al. (2005). Table 1 provides a summary of the means and variances for all the variables involved.
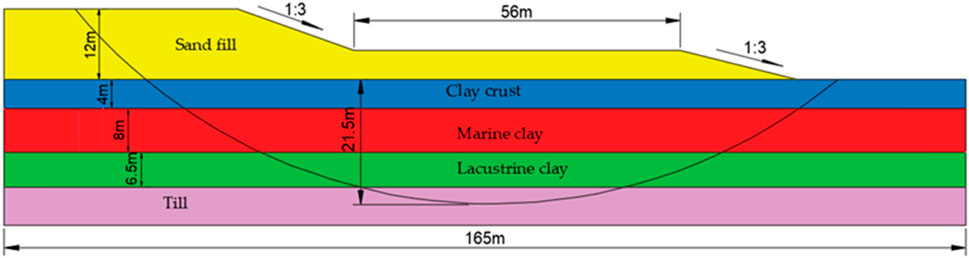
Figure 3. The stratigraphic composition and sectional view of the James Bay dykes (Jaksa, 1995).
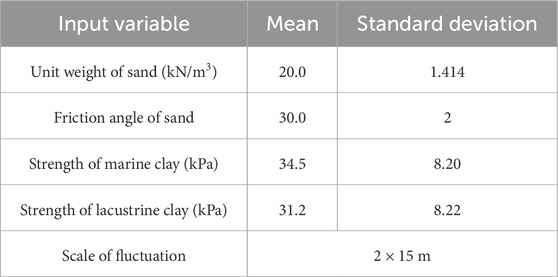
Table 1. Input variables and their statistical parameters.
The limit equilibrium Morgenstern–Price method is applied to the slope stability analysis. It is presumed that the slip circles are tangential to the till layer, with the daylight falling at a fixed point at the crest of the embankment (X1 = 4.9, Y1 = 36.0), and the centers are assumed to have a common X coordinate (X0 = 85.9) (El-Ramly et al., 2002). Under the assumption of exponential autocovariance functions, the spatial variabilities of soil parameters are modeled as one-dimensional random fields. The slip surface within every stratum of soil is divided into sections of length not exceeding δ = 30 m. The length of the slip surface within the lacustrine clay is approximately 80 m. Consequently, the 30-m sampling interval leads to three distinct strength zones along the slip surface within this particular soil type, as is evident in Figure 4. Figure 5 presents the reliability index relative to the spatial variability for a seed number of 38,000.

Figure 4. Variation in strength for specified sampling distance of 30 m.
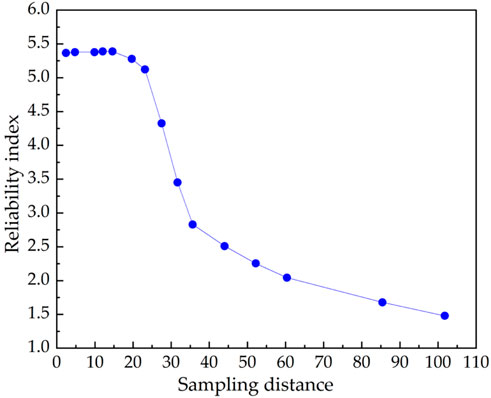
Figure 5. Variation in reliability index with sampling distance.
An index of reliability as low as 1.414 is observed when spatial variability is not taken into account. When the sampling distance is 30 m, the reliability index is 2.496, which is an increase of 76.5%. Therefore, the spatial variability obtained by considering the parameters has a significant effect on the reliability index of the dam, which changes the state of the dam from dangerous to safe. When the sampling distance is reduced, the reliability index gradually increases and finally stabilizes at around 5.38, which is 3.8 times the result obtained when spatial variability is not taken into account. Christian et al. (1994) illustrated in 1994 how the uncertainty of different parameters affects the reliability of embankments, and pointed out that reliability analysis is particularly useful in determining consistent risk safety factor design values for different types of failure. El-Ramly proposed a probabilistic slope stability analysis method based on Monte Carlo simulation, emphasizing the importance of considering uncertainty in slope design and performance assessment (El-Ramly et al., 2002). Table 2 indicates that the calculated results are in good agreement with the results found in the existing literature, thereby validating the efficacy of this research.

Table 2. Comparison of different analysis methods for sampling distance of 30 m.
Based on inferences from existing research results of slope stability and the characteristics of submarine slopes, the complicated submarine slope used in practice is simplified to the computational model. The length of the suggested slope is 2000 m, and the total height is 428 m. The model’s dimensions are such that the distance from the base of the slope to its right boundary is 500 m, and similarly, the distance from the top of the slope to its left boundary also measures 500 m. According to actual geological data, the largest angle of the submarine slope is 6.5°. The relationship between soil undrained strength and depth is described as a linearly increasing relationship. This phenomenon is common in many engineering geological conditions (Wang et al., 2020). The undrained strength exhibits a linear increase with depth, that is, su = 2 + 1.18z (see Figure 6.)

Figure 6. Variation trend diagram of undrained strength with depth.
The soil parameters at different positions exhibit autocorrelation, mutual correlation, and spatial variability. Phoon and Kulhawy (1999) suggested that the COV of inherent variability of the undrained shear strength (su) in clay is 0.1–0.4. Lumb (1966) proposed that COV su of marine clay is 0.184. In the present study, the impact of the strength parameter’s variability of the top layer (su0) and the rate (k) of increase with depth on the reliability of the submarine slope stability is analyzed quantitatively. To explore the influence of high-variability parameters on the reliability results, the COVs are varied from 0.1 to 0.5. Figure 7 shows the probability distributions obtained with the standard deviations truncated at ±3. Truncation is essential to prevent the occurrence of negative values and to ensure that soil layers do not overlap or eliminate. The outcomes of the convergence assessment from the Monte Carlo simulation iterations are illustrated in Figure 8; here, a run number of 100,000 is used to obtain more precise results.
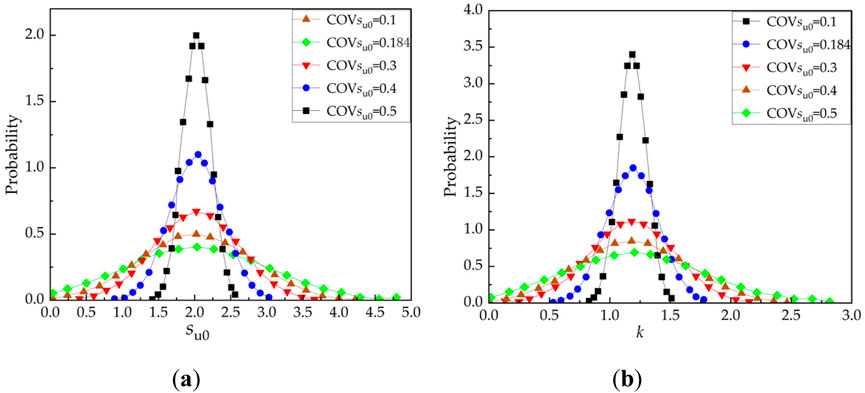
Figure 7. Probability distribution of critical random variables: (A) Probability distribution for su0; (B) Probability distribution for k.
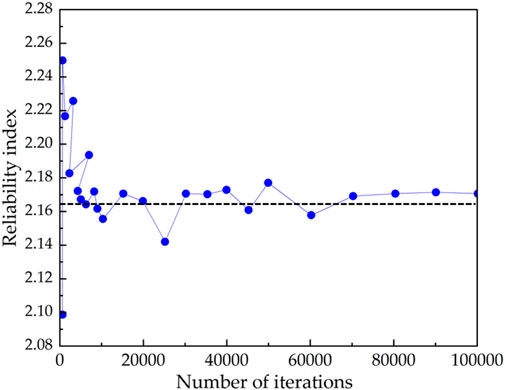
Figure 8. Estimating the ideal iteration count for Monte Carlo simulation.
Figure 9 shows the influence of the COV of the parameters on the reliability results in the random variable model (without spatial variability). With an increase in the COV of su0, the reliability index remains almost unchanged, as shown in Figure 9A. This suggests that the slope’s reliability index β of the slope is insensitive to the variability of su0. Figure 9B shows that the reliability index β is significantly affected by the variability of k. As the COV k ranges between 0.1 and 0.3, the reliability index is the most sensitive, showing a steep downward trend. When COV k is greater than 0.3, the attenuation of the reliability index is relatively slow. Consequently, when the variation in the slope parameters is large, the results of the reliability analysis tend to be stable, which is beneficial to slope engineering analysis and evaluation. Nevertheless, the mean strength of the top layer exerts a minor influence on the reliability outcomes.
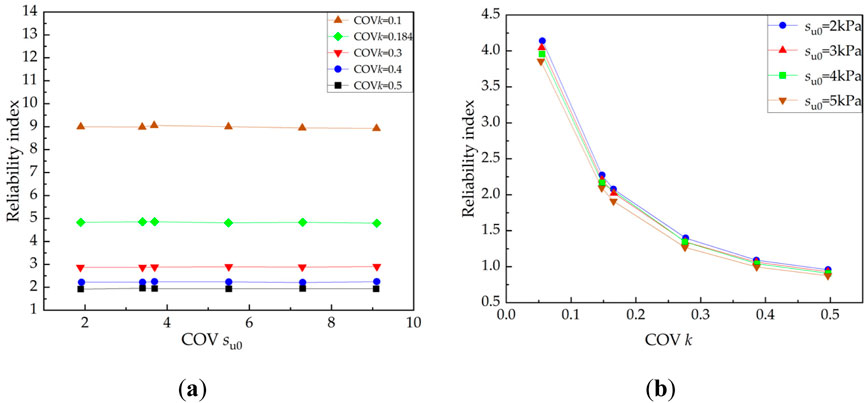
Figure 9. Influence of COVs on reliability index without spatial variability consideration: (A) Influence of COV su0 on reliability index; (B) Influence of COV k on reliability index.
The scale of fluctuation of each property within the field displays anisotropic characteristics; however, to keep the analysis conditions tractable, realistic, and close to the practical conditions of slope stability, this study assumes isotropy. Based on the discussion in Section 2.2, 13 sampling distances are selected to investigate the impact of spatial variability on the reliability results, as shown in Figure 10. With a decrease in the sampling distance, the reliability index increases slowly, then increases rapidly, and finally reaches a peak value when the sampling distance is approximately 40 m which is close to the lower bound of the horizontal scale of fluctuation. Similar to the scenario involving the random variable model, when COV k is less than 0.3, the reliability index is sensitive to the COV, and when COV k is greater than 0.3, the reliability index is insensitive to the COV. Meanwhile, it is found that the reliability index at its peak value is approximately nine times that when no spatial variability is considered (COV k = 0.184). Even if the sampling distance is only 1/4rd of the slope length, the reliability index is magnified by nearly 1.9 times. It is further explained that the consideration of the parameter spatial variability has great influence on the reliability index. This is critical to the safety design in slope engineering. However, the mean value of the strength of the top layer has little effect on the reliability index, and hence, this parameter can be disregarded for submarine slope reliability analysis.
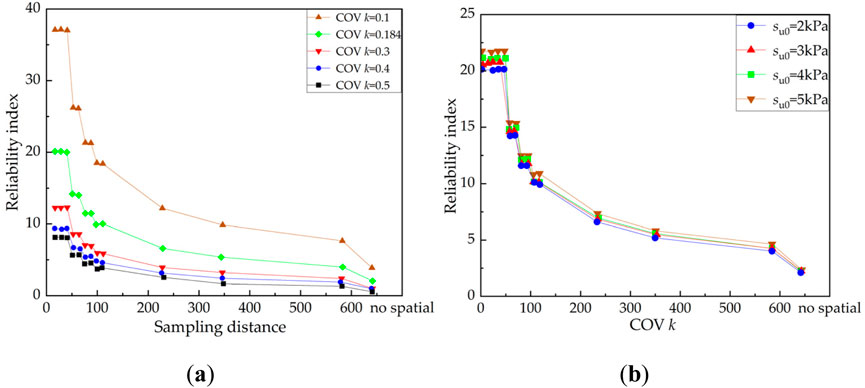
Figure 10. Influence of sampling distance on reliability index: (A) su0 = 2 kPa, COV k = 0.1–0.5; (B) COV k = 0.184, su0 = 2–5 kPa.
Most importantly, when accounting for the spatial variability of the parameters, the reliability index is closely related to the sampling distance, and the reliability index remains stable with a decrease in the sampling distance. This can be reasonably explained by the frequency distribution histogram of the safety factor (see Figure 11). When accounting for the spatial variability of the parameters, the average value of the safety factor is not sensitive to the size of the sampling distance, and as the sampling distance decreases, the maximum and minimum values of the safety factor become increasingly closer to the mean value. That is, the safety factor frequency histogram becomes narrower gradually, which is also the main reason why the reliability index rises as the sampling distance diminishes. Although the sampling distance’s value in the actual project is not too small, the maximum value of the reliability index of the project can be determined by a small sampling distance, thus providing an effective reference to the safety design of the submarine slope.
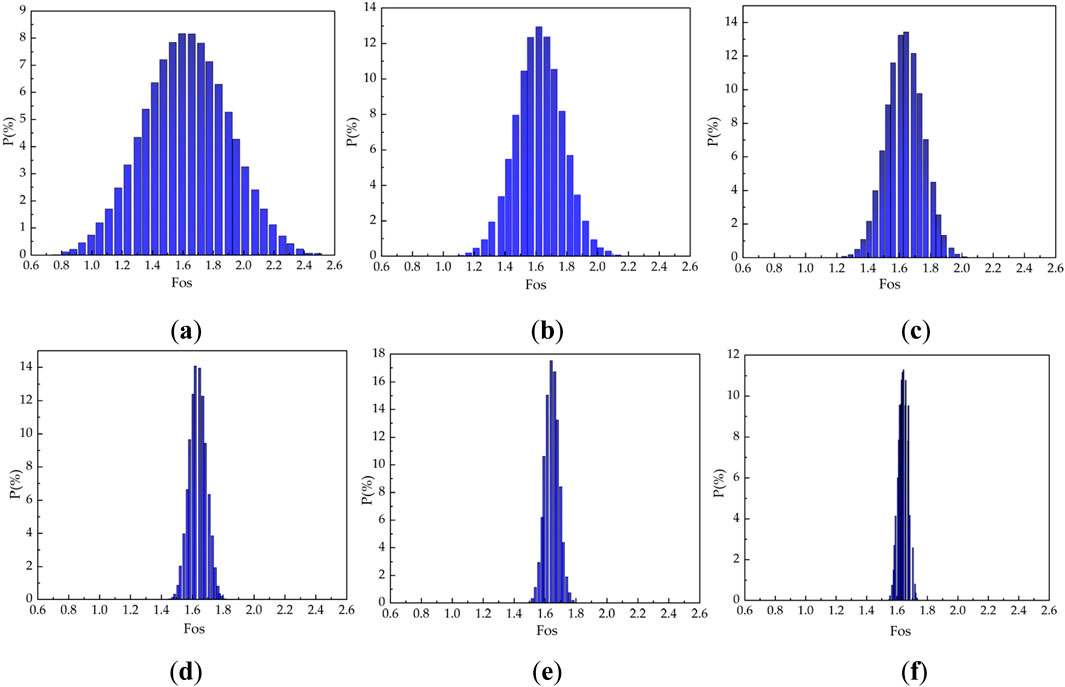
Figure 11. Influence of sampling distance on reliability index: (A) No spatial variability; (B) Sampling distance of 500 m; (C) Sampling distance of 300 m; (D) Sampling distance of 80 m; (E) Sampling distance of 60 m; (F) Sampling distance of 40 m.
In conclusion, the research results provide important reference for the safe design of submarine slope engineering. By identifying the parameters that have a significant impact on reliability and their range of variability, engineers can conduct slope stability analysis and design more targetedly, thereby enhancing the safety and cost-effectiveness of the project.
A weak layer is one of the key factors affecting the stability of submarine slopes. This paper explains the importance of the surface optimization method of sliding in the stability analysis of submarine slopes with a weak layer. In addition, this article discusses how the presence of a horizontal weak layer affects the reliability of submarine slopes. In this paper, a weak layer of 1 m is set up at a depth of 30 m, the undrained shear strength is set to 60%, 70%, and 80% of the values of the neighboring layers, and the COVs of the parameters are in the range of 0.1–0.5. The position of the sliding surface at 30 m from the top of the slope is shown in Figure 12. When the slip surface is not optimized, the slip surface is circular and passes through the weak layer; on the contrary, the slip surface glides along the weak layer. According to the results of the theoretical analysis illustrated in Figure 13, the result of the optimal slip surface (Fs = 1.057) is close to the theoretical solution (Fs = 1.002). Therefore, when there is a weak layer, the slip surface should be optimized.
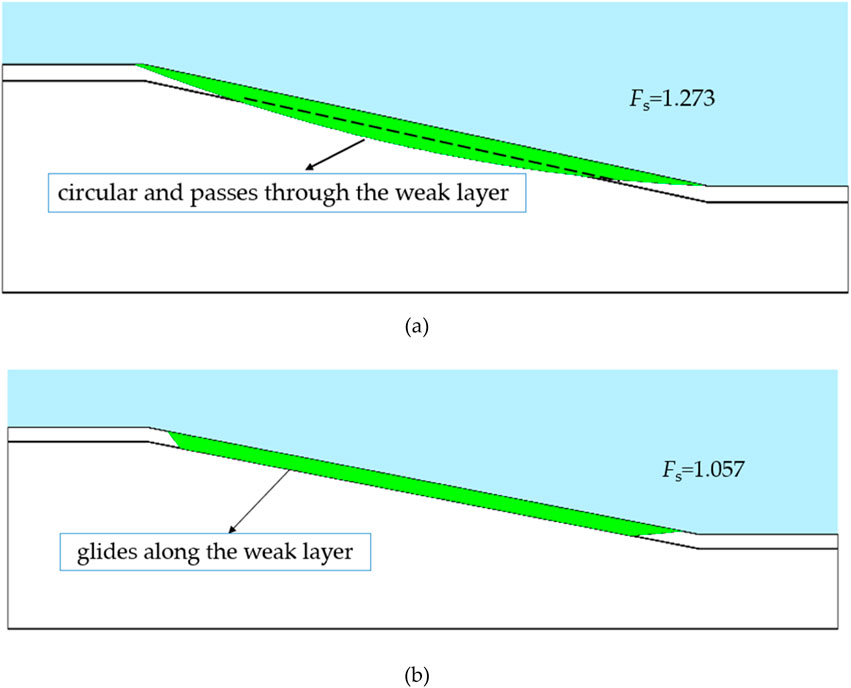
Figure 12. Comparison of position of slip surface and safety factor, suw = 60%sun: (A) Without optimization; (B) With optimization.
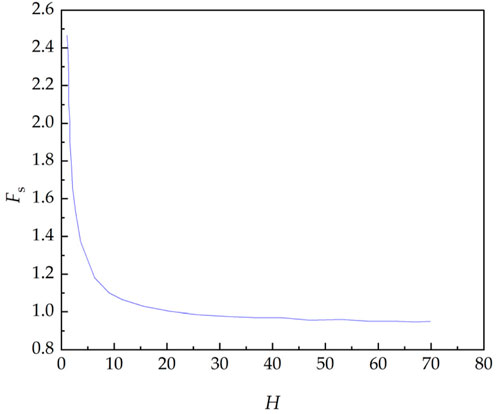
Figure 13. Theoretical analysis of slope with soft layer.
The strength of the weak layer is not fixed, and the value will impact the stability of the submarine slope. Figure 14 shows the influence of the sampling distance on the reliability index under different strengths of the weak layer taking into account the spatial variability of the parameters. When the strength of the weak layer is higher, the rise in the reliability index is not pronounced. The reliability index reaches a stable value of 9.71 (suw = 0.7sun) at a sampling distance of 30 m. This is a reduction of 53% compared with the stable value of the reliability index in the initial slope model. Therefore, the scale of fluctuation is approximately 30–50 m, which aligns with the findings of the prior study. Hence, the influence of COV suw on the reliability index is investigated by selecting five conditions: sampling distances of 30, 40, 50, and 60 m and no spatial variability.

Figure 14. Influence of sampling distance on reliability index.
Figure 15 demonstrates the correlation between the reliability index and COV suw. The target reliability index is shown as the dotted line, and the result of the random variable model (with no spatial variability) is nearly less than the target reliability index. The consideration of the spatial variability of the parameters will greatly improve the safety of the submarine slope, and the reliability index decreases with an increase in COV suw. Consistent with the findings from the aforementioned analysis, the reliability index is not sensitive to the COV when the soil has high variability.
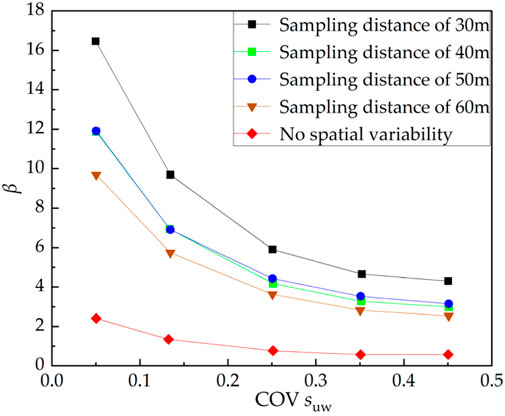
Figure 15. Influence of COV suw on reliability index.
The traditional deterministic analysis method of slope stability with the safety factor as the evaluation index has some limitations. Without the proper consideration of parameter uncertainty, the safety factor will produce an erroneous sense of safety rather than being a efficient indicator. Probabilistic analysis of slope stability is a rational approach for integrating quantitative uncertainties into the design phase. SLOPE/W is a practical software for slope stability analysis; the procedures and principles are straightforward and clear, necessitating only basic understanding of statistical concepts and the principles of probability. The approach exhibits flexibility in addressing real slope problems, encompassing scenarios with varying loading conditions, complex stratigraphic conditions, c-φ soils, as well as circular and noncircular slip surfaces. Utilizing Monte Carlo simulations coupled with limit equilibrium methodologies, this paper proposed a quantitative assessment method of slope instability risk considering the spatial variability of soil parameters. The main conclusions are as follows:
• Under the normal consolidation soil model which the strength exhibits a linear increase with depth, the variability of su0 and the average value of su0 have little effect on the reliability index. It is suggested that the influence of the strength of the top layer should be neglected when calculating the reliability of submarine slopes.
• The variability of k has a substantial impact on the reliability index; with an increase in COV k, the reliability index gradually reduces. When COV k varies from 0.1 to 0.3, the reliability index is sensitive and the curve of the reliability index with COV k is steep. When COV k is greater than 0.3, the reliability index is insensitive to COV k and the curve of the reliability index with COV k becomes gentle gradually. This provides a theoretical basis for the reliability analysis of slopes with high parameter variability.
• The spatial variability of the important parameters is taken into account according to the local average theory. When we ignore the true parameters or cannot obtain the fluctuation’s scale, the sensitivity analysis of the sampling distance is a convenient method. By setting different sampling distances, we find that with a decrease in the sampling distance, the reliability index always reaches a more stable value in both the initial model and weak layer model. Thus, a range of reliability index values is provided for slope engineering, offering guidance in practical applications.
Finally, it is believed that merging traditional deterministic slope analysis with probabilistic analysis will elevate the standards of slope engineering and enhance the precision of the decision-making process. However, it should be highlighted that simplified probabilistic analysis may lead to inaccuracies and misinterpretations. For example, in the simplified analysis that neglects the spatial variability of the soil properties and assumes perfect autocorrelation, the possibility of unsatisfactory performance can be greatly overestimated.
The original contributions presented in the study are included in the article/supplementary material, further inquiries can be directed to the corresponding author.
LY: Conceptualization, Funding acquisition, Methodology, Validation, Writing–review and editing. YB: Conceptualization, Software, Writing–original draft, Writing–review and editing. KM: Writing–review and editing. YH: Conceptualization, Funding acquisition, Project administration, Supervision, Writing–review and editing. YY: Investigation, Software, Writing–original draft. BX: Conceptualization, Supervision, Writing–review and editing. ZW: Methodology, Supervision, Writing–review and editing. RP: Conceptualization, Project administration, Validation, Writing–review and editing.
The author(s) declare that financial support was received for the research, authorship, and/or publication of this article. The authors acknowledge the financial support from the National Natural Science Foundation of China (Grant nos. 52171252, 52331010 and 52109115), Liaoning Province Doctoral Research Startup Fund Program (2022BS082), and the Fundamental Research Funds for the Central Universities (DUT23RC(3)018).
Author KM was employed by Offshore Oil Engineering Co., Ltd.
The remaining authors declare that the research was conducted in the absence of any commercial or financial relationships that could be construed as a potential conflict of interest.
The author(s) declare that no Generative AI was used in the creation of this manuscript.
All claims expressed in this article are solely those of the authors and do not necessarily represent those of their affiliated organizations, or those of the publisher, the editors and the reviewers. Any product that may be evaluated in this article, or claim that may be made by its manufacturer, is not guaranteed or endorsed by the publisher.
Alonso, E. E. (1976). Risk analysis of slopes and its application to slopes in Canadian sensitive clays. Géotechnique 26, 453–472. doi:10.1680/geot.1976.26.3.453
Bishop, A. W. (1955). The use of the slip circle in the stability analysis of slopes. Géotechnique 5, 7–17. doi:10.1680/geot.1955.5.1.7
Cafaro, F., and Cherubini, C. (2002). Large sample spacing in evaluation of vertical strength variability of clayey soil. J. Geotech. Geoenviron. Eng. 128, 558–568. doi:10.1061/(asce)1090-0241(2002)128:7(558)
Cao, Z., and Wang, Y. (2014). Bayesian model comparison and selection of spatial correlation functions for soil parameters. Struct. Saf. 49, 10–17. doi:10.1016/j.strusafe.2013.06.003
Christian, J. T., Ladd, C. C., and Baecher, G. B. (1994). Reliability applied to slope stability analysis. J. Geotechnical Eng. 120, 2180–2207. doi:10.1061/(asce)0733-9410(1994)120:12(2180)
Durap, A., Balas, C. E., Cokgor, S., and Balas, E. A. (2023). An integrated bayesian risk model for coastal flow slides using 3-D hydrodynamic transport and Monte Carlo simulation. J. Mar. Sci. Eng. 11, 943. doi:10.3390/jmse11050943
Dyson, A. P., and Tolooiyan, A. (2019). Prediction and classification for finite element slope stability analysis by random field comparison. Comput. Geotech. 109, 117–129. doi:10.1016/j.compgeo.2019.01.026
El-Ramly, H., Morgenstern, N. R., and Cruden, D. M. (2002). Probabilistic slope stability analysis for practice. Can. Geotech. J. 39, 665–683. doi:10.1139/t02-034
Fenton, G. A., and Vanmarcke, E. H. (1990). Simulation of random fields via local average subdivision. J. Eng. Mech. 116, 1733–1749. doi:10.1061/(asce)0733-9399(1990)116:8(1733)
Griffiths, D. V., and Fenton, G. A. (2000). “Influence of soil strength spatial variability on the stability of an undrained clay slope by finite elements,” in Slope stability, 184–193.
Griffiths, D. V., and Fenton, G. A. (2004). Probabilistic slope stability analysis by finite elements. J. Geotech. Geoenviron. Eng. 130, 507–518. doi:10.1061/(asce)1090-0241(2004)130:5(507)
Griffiths, D. V., Huang, J., and Fenton, G. A. (2009). Influence of spatial variability on slope reliability using 2-D random fields. J. Geotech. Geoenviron. Eng. 135, 1367–1378. doi:10.1061/(asce)gt.1943-5606.0000099
Jaksa, M. B. (1995). The influence of spatial variability on the geotechnical design properties of a stiff, overconsolidated clay.
Juang, C., Huang, X. H., and Elton, D. J. (1991). Fuzzy information processing by the Monte Carlo simulation technique. Civ. Eng. Syst. 8, 19–25. doi:10.1080/02630259108970602
Juang, C. H., Fang, S. Y., and Khor, E. H. (2006). First-order reliability method for probabilistic liquefaction triggering analysis using CPT. J. Geotech. Geoenviron. Eng. 132, 337–350. doi:10.1061/(asce)1090-0241(2006)132:3(337)
Junbu, N. (1957). Earth pressure and bearing capacity calculation by generalized procedure of slices. in 4Th ICSMFE.
Li, J., Cui, C., Xiao, Z., Wang, B., and Xu, C. (2024). Reliability and sensitivity analyses of monopile supported offshore wind turbines based on probability density evolution method with pre-screening of controlling parameters. Ocean. Eng. 310, 118746. doi:10.1016/j.oceaneng.2024.118746
Li, K. S. (1992). “A point estimate method for calculating the reliability index of slopes,” in Proceedings of 6th Australia–New Zealand conference on geomechanics, Christchurch, 448–451.
Li, K. S. (1994). Estimating autocovariance of in situ soil properties. J. Geotechnical Eng. 120, 1454–1457.
Li, K. S., and Lumb, P. (1987). Probabilistic design of slopes. Can. Geotech. J. 24, 520–535. doi:10.1139/t87-068
Liu, F. (2010). A safety evaluation for submarine slope instability of the Northern South China Sea due to gas hydrate dissociation. Inst. Oceanol. Chin. Acad. Sci.
Low, B. K., and Tang, W. H. (1997). Reliability analysis of reinforced embankments on soft ground. Can. Geotech. J. 34, 672–685. doi:10.1139/cgj-34-5-672
Luo, X., Cheng, T., Li, X., and Zhou, J. (2012). Slope safety factor search strategy for multiple sample points for reliability analysis. Eng. Geol. 129, 27–37. doi:10.1016/j.enggeo.2012.01.006
Matsuo, M., and Kuroda, K. (1974). Probabilistic approach to design of embankments. Soils Found. 14, 1–17. doi:10.3208/sandf1972.14.2_1
Morgenstern, N. U., and Price, V. E. (1965). The analysis of the stability of general slip surfaces. Géotechnique 15, 79–93. doi:10.1680/geot.1965.15.1.79
Nguyen, V. U., and Chowdhury, R. N. (1984). Probabilistic study of spoil pile stability in strip coal mines—two techniques compared. Int. J. Rock Mech. Min. Sci. and Geomechanics Abstr. 21, 303–312. doi:10.1016/0148-9062(84)90363-2
Phoon, K., and Kulhawy, F. H. (1999). Characterization of geotechnical variability. Can. Geotech. J. 36, 612–624. doi:10.1139/cgj-36-4-612
Phoon, K., Prakoso, W. A., Wang, Y., and Ching, J. (2016). “Uncertainty representation of geotechnical design parameters,” in Reliability of geotechnical structures in ISO2394 (Boca Raton, FL: CRC Press), 67–106.
Rodríguez-Ochoa, R., Nadim, F., Cepeda, J. M., Hicks, M. A., and Liu, Z. (2015). Hazard analysis of seismic submarine slope instability. Georisk Assess. Manag. Risk Eng. Syst. Geohazards 9, 128–147. doi:10.1080/17499518.2015.1051546
Rui, S., Jostad, H. P., Zhou, Z., Wang, L., Sævik, S., Wang, Y., et al. (2024). Assessment of seabed trench formation based on marine sediment properties and chain-bar penetration tests. Eng. Geol. 342, 107746. doi:10.1016/j.enggeo.2024.107746
Salgado, R., and Kim, D. (2014). Reliability analysis of load and resistance factor design of slopes. J. Geotech. Geoenviron. Eng. 140, 57–73. doi:10.1061/(asce)gt.1943-5606.0000978
Shinozuka, M. (1983). Basic analysis of structural safety. J. Struct. Eng. 109, 721–740. doi:10.1061/(asce)0733-9445(1983)109:3(721)
Spencer, E. (1967). A method of analysis of the stability of embankments assuming parallel inter-slice forces. Géotechnique 17, 11–26. doi:10.1680/geot.1967.17.1.11
Tan, L., Zhou, M., and Wang, F. (2023). A probabilistic assessment framework for submarine landslide susceptibility in continental slopes with rich gas hydrates. J. Mar. Sci. Eng. 11, 1366. doi:10.3390/jmse11071366
Tang, W. H., Yucemen, M. S., and Ang, A. (1976). Probability-based short term design of soil slopes. Can. Geotech. J. 13, 201–215. doi:10.1139/t76-024
Uzielli, M., Vannucchi, G., and Phoon, K. K. (2005). Random field characterisation of stress-nomalised cone penetration testing parameters. Géotechnique 55, 3–20. doi:10.1680/geot.2005.55.1.3
Vanmarcke, E. H. (1977a). Reliability of earth slopes. J. Geotechnical Eng. Div. 103, 1247–1265. doi:10.1061/ajgeb6.0000518
Vanmarcke, E. H. (1977b). Probabilistic modeling of soil profiles. J. Geotechnical Eng. Div. 103, 1227–1246. doi:10.1061/ajgeb6.0000517
Vanmarcke, E., and Grigoriu, M. (1983). Stochastic finite element analysis of simple beams. J. Eng. Mech. 109 (5), 1203–1214.
Wang, B., Cui, C., Xu, C., Meng, K., Li, J., and Xu, L. (2024). A novel analytical solution for horizontal vibration of partially embedded offshore piles considering the distribution effect of wave loads. Ocean. Eng. 307, 118179. doi:10.1016/j.oceaneng.2024.118179
Wang, L., Rui, S., Guo, Z., Gao, Y., Zhou, W., and Liu, Z. (2020). Seabed trenching near the mooring anchor: history cases and numerical studies. Ocean. Eng. 218, 108233. doi:10.1016/j.oceaneng.2020.108233
Wang, Y., Cao, Z., and Au, S. (2010). Efficient Monte Carlo simulation of parameter sensitivity in probabilistic slope stability analysis. Comput. Geotech. 37, 1015–1022. doi:10.1016/j.compgeo.2010.08.010
Wang, Z., Zheng, D., Gu, Z., Guo, X., and Nian, T. (2024). A methodology to evaluate the real-time stability of submarine slopes under rapid sedimentation. J. Mar. Sci. Eng. 12, 823. doi:10.3390/jmse12050823
Wong, F. S. (1985). Slope reliability and response surface method. J. Geotechnical Eng. 111, 32–53. doi:10.1061/(asce)0733-9410(1985)111:1(32)
Yang, S., Nadim, F., and Forsberg, C. F. (2007). “Probability study on submarine slope stability,” in Submarine mass movements and their consequences: 3 international symposium, 161–170.
Zhu, B., Pei, H., and Yang, Q. (2018). Probability analysis of submarine landslides based on the response surface method: a case study from the South China Sea. Appl. Ocean. Res. 78, 167–179. doi:10.1016/j.apor.2018.06.018
Zhu, D., Griffiths, D. V., Huang, J., and Fenton, G. A. (2017). Probabilistic stability analyses of undrained slopes with linearly increasing mean strength. Géotechnique 67, 733–746. doi:10.1680/jgeot.16.p.223
Keywords: submarine slopes, spatial variability, random field, scale of fluctuation, reliability index
Citation: Yu L, Bao Y, Ma K, Han Y, Yan Y, Xu B, Wang Z and Pang R (2025) Probabilistic slope stability analysis on marine clay seabed considering spatial variability of soil parameters. Front. Built Environ. 11:1545900. doi: 10.3389/fbuil.2025.1545900
Received: 16 December 2024; Accepted: 14 January 2025;
Published: 31 January 2025.
Edited by:
Shengjie Rui, Norwegian Geotechnical Institute (NGI), NorwayReviewed by:
Bin Zhu, China University of Mining and Technology, ChinaCopyright © 2025 Yu, Bao, Ma, Han, Yan, Xu, Wang and Pang. This is an open-access article distributed under the terms of the Creative Commons Attribution License (CC BY). The use, distribution or reproduction in other forums is permitted, provided the original author(s) and the copyright owner(s) are credited and that the original publication in this journal is cited, in accordance with accepted academic practice. No use, distribution or reproduction is permitted which does not comply with these terms.
*Correspondence: Yunrui Han, aHlyMjAyMUBkbHV0LmVkdS5jbg==
Disclaimer: All claims expressed in this article are solely those of the authors and do not necessarily represent those of their affiliated organizations, or those of the publisher, the editors and the reviewers. Any product that may be evaluated in this article or claim that may be made by its manufacturer is not guaranteed or endorsed by the publisher.
Research integrity at Frontiers
Learn more about the work of our research integrity team to safeguard the quality of each article we publish.