 Anne Mozer
 Björn Almström
 Pål Axel Olsson
 Holger Schüttrumpf1
- 1Institute of Hydraulic Engineering and Water Resources Management, RWTH Aachen University, Aachen, Germany
- 2Division of Water Resource Engineering, Lund University, Lund, Sweden
- 3Department of Biology, Lund University, Lund, Sweden
Through in situ experiments, this study investigated the erosion resistance of a prototype dike with different vegetation and soil sections built on the Falsterbo peninsula, Sweden. A gravity-driven wave impact simulator was used to simulate waves breaking on the dike. Two sandy soils and three vegetation types (standard grass, biodiverse seed mixture, and hay) were tested for this study. In general, the study showed consistency in the results between the replications and in comparison to former studies. Thus, initially developed for laboratory experiments, the methodology can be transferred to in situ experiments on existing dikes. The study showed comparable results for higher biodiverse vegetation cover and standard grass regarding the resistance to wave impact. The importance of not only root but also soil parameters could be confirmed. A higher resistance was found with higher root densities and lower fine fractions in the soil. Also, a higher forb diversity resulted in larger root densities. Future studies could build on the present findings by conducting a systematic investigation to gain deeper insights into the impact of vegetation and soil properties.
1 Introduction
Protection from flooding is necessary in many coastal or riverine areas. One of the most common types of flood defence structures in Northern Europe is earthen dikes (Seijffert, 1998). The primary function of dikes is to provide flood protection for the hinterland. A dike breach can lead to catastrophic consequences for societies, infrastructure, and humans. Additionally, dikes have been shifting from being seen as single-function structures (i.e., flood defence function) to multifunctional structures. Other functions commonly incorporated in dikes are housing in areas with limited land availability, recreation, infrastructure (e.g., roads, railways, and bicycle lanes), or nature functions (e.g., green corridors for connectivity, biodiversity promotion, and nature conservation). However, incorporating more functions into a dike increases the structure’s complexity, and a modern dike design must, therefore, ensure that additional functions do not affect the integrity of the dike, i.e., its primary function as a flood protection structure for the safety of people in the hinterland.
Available guidelines, such as The International Levee Handbook (CIRIA, 2013), include the aspects of hydraulic and geotechnical parameters, but ecological aspects are so far not directly incorporated in the design guidelines (Pontee et al., 2016; Scheres and Schüttrumpf, 2019). Nature-enhanced dike revetment has not been included in any guidelines or standards due to the uncertainty of how erosion resistance is affected by having grass as a cover layer on dikes (Scheres and Schüttrumpf, 2020). By enhancing the ecological value of the revetment, the dike will provide habitats for coastal fauna and flora, thereby promoting biodiversity. Additionally, monoculture grass revetments have been challenged over the past years due to their inability to cope with prolonged periods of drought and failure to provide biodiversity benefits (Korell et al., 2024). Nature-enhanced solutions include biodiversity and enhance flood resilience by maintaining the natural hydrological cycle and absorbing water during floods (Pontee et al., 2016; van der Meulen et al., 2023). Thus, improving the ecological value and increasing biodiversity of dikes can be advantageous.
The frequency and intensity of storm surges, floods and extreme events is expected to increase due to climate change (IPCC, 2019). As sea levels rise, the risk of coastal flooding increases, along with the likelihood of failure of coastal protection structures. Dikes are becoming more vulnerable to heightened wave action and rising water levels, leading to stronger erosive forces and greater challenges in resisting erosion (Nicholls and Cazenave, 2010). One cause of damage to dike and dike revetments is wave impacts from breaking waves (Führböter et al., 1977). Wave impacts on coastal structures, particularly sea dikes, are generated when waves break against these structures. As waves approach the shore, they transform due to decreasing water depth, potentially leading to plunging breakers that generate intense, short-duration impact forces (EAK, 2002). These impacts consist of a primary impact force, followed by secondary forces from splash-up events. The force distribution includes normal impact forces and shear stresses along the slope. Wave impacts are characterized by a high pressure on a small area for a short amount of time (Führböter, 1991; Führböter et al., 1977). The impact forces can lead to various failure mechanisms, including erosion and instability of the dike body. The magnitude and distribution of these forces depend on factors such as wave height, period, water depth, and the geometry of the impacted structure (EAK, 2002). Understanding these complex wave-structure interactions is essential for designing resilient coastal defenses, as wave impacts can cause substantial damage to sea dikes, potentially leading to breaches and flooding of protected areas. Thus, the resistance of dike covers to hydraulic forces – such as impact pressure – and the understanding of failure mechanisms is important (Cantré et al., 2017; Evangelista, 2015).
Parameters related to the erosion resistance of a vegetation revetment are root density, root length, vegetation coverage, the dike slope, and wave steepness of incoming waves (Scheres and Schüttrumpf, 2020). The subaerial part of the vegetation is only able to withstand the wave forces for a short period compared to the underground root system that can withstand hydraulic loads during a longer period (Pilarczyk, 1998). The strength comes from the root system and the soil bound between the roots.
To ensure the long-term safety and stability of dikes, the erosion resistance of vegetated dikes has to be understood. Even though higher biodiversity enhances the ecological value of coastal protection measures, only a few studies have investigated the erosion resistance of dikes with higher ecological values. In a prototype dike test in a wave basin by Michalzik et al. (2019), four different seed mixtures were tested for their erosion resistance, ranging from a standard grass mixture (4 species) to an herb-rich mixture (18 species). The prototype dike had a slope of 1:6 and was subjected to waves of 0.1–0.25 m with a period of 1–3 s for up to 7–10 h every second week. Preliminary results, after one vegetation period (March to September), when comparing the standard grass mixture with the herb-rich mixture, showed that erosion was initiated on the section with herb-rich vegetation mixture. This was explained by the difference in vegetation coverage rate for the different seed mixtures (standard grass mixture: coverage of 95% and herb-rich mixture: coverage of 55%). The erosion resistance to wave impact of nature-enhanced dike revetments has been investigated in a study by Scheres and Schüttrumpf (2020). They conducted wave impact simulations on test vegetation on an 8° sloped surface, ranging from species-poor grass-dominated reference vegetation to species-rich herb-dominated mixtures. The vegetation was six and 18 months old before performing the experiments. The results showed that erosion rates decreased with increased root density and root length density. However, bare spots became the primary factor for erosion initiation, highlighting the necessity of closed vegetation cover. It was found that dikes with a higher diversity of herbs had lower erosion resistance in early development stages compared to standard grass mixtures. It is important to note that the young vegetation and challenging climatic conditions likely affected its establishment. Therefore, Scheres and Schüttrumpf (2020) recommend conducting long-term studies and in situ tests on actual dikes to fully assess the benefits of nature-enhanced dike revetment.
With the growing interest in nature-based solutions and the increasing risk of damage from wave action, this study aimed to evaluate the erosion resistance of three types of vegetation: a conventional grass-seed mixture, a high herb mixture, and a local flora mixture. These vegetation types were tested on a prototype dike using an in situ gravity-driven wave impact simulator. The erosion resistance was assessed by measuring the maximum erosion depth and volume caused by the simulated wave impacts. Additionally, various related parameters were recorded for each test area, including root density, vegetation height and coverage, soil properties, and a comprehensive inventory of plant species composition.
2 Methods and materials
2.1 Prototype dike and vegetation sections
In October 2022 a prototype dike was constructed on the Falsterbo peninsula in the south of Sweden (lat: 55°24′46.8″N, lon: 12°52′2.4″E) to facilitate in situ testing of nature-enhanced vegetation erosion resistance. The Falsterbo peninsula is a low-lying coastal area with a population of approximately 20,000, with more than 4,600 houses in areas identified as flood-risk areas (Ahlström and Åberg, 2018). In response, the local municipality is planning to implement a coastal protection system comprising dikes, dunes, and seawalls to protect urban areas from coastal flooding. In Sweden, constructing such protective measures requires Swedish Land and Environmental Court approval. A condition of the permit for this coastal protection scheme mandated that the dike cover vegetation consists of native plant species to minimize the ecological impact on the adjacent Natura 2000 protected areas. Due to the limited understanding of the erosion resistance of nature-enhanced vegetation on dikes, a full-scale prototype dike was constructed to assess the technical properties of nature-enhanced vegetation as a protective cover on dikes. The prototype dike is approximately 50 m long, 2 m high above the ground, the slope is 18° (1:3), and the crest width is 3 m. It was constructed using a core of local material (clay till), a 30 cm thick clay layer, and covered with 35 cm of topsoil. Two different topsoils and four vegetation strategies were used in the construction, resulting in a total of eight different vegetation areas (see Table 1 and Figure 1). For areas denoted by 1 (Figure 1), the local topsoil underneath the prototype dike was reused, and for areas denoted by 2, a nutrient-poor soil was used. The testing of two different top-soils was motivated by an interest to compare the plant composition when using the local topsoil, which is preferred to utilize, with a nutrient poor soil that potentially should result in higher plant diversity (Roem and Berendse, 2000). Four different vegetation strategies were applied: (A) Native seeds from a hay cutting in a nearby pasture were spread on the dike slope to encourage germination. (B) Herb-rich seed mixture1 was sown. (C) Heather (Calluna vulgaris) was transplanted from a nearby heath. (D) Standardized grass seeds2 were planted to represent standard grass revetment on the dike. Unfortunately, the heather (C) did not establish well and was therefore excluded from the study. Maintenance of the vegetation cover on the dike included one cutting in September 2023, but no irrigation.

Table 1. Description of the different areas on the prototype dike.
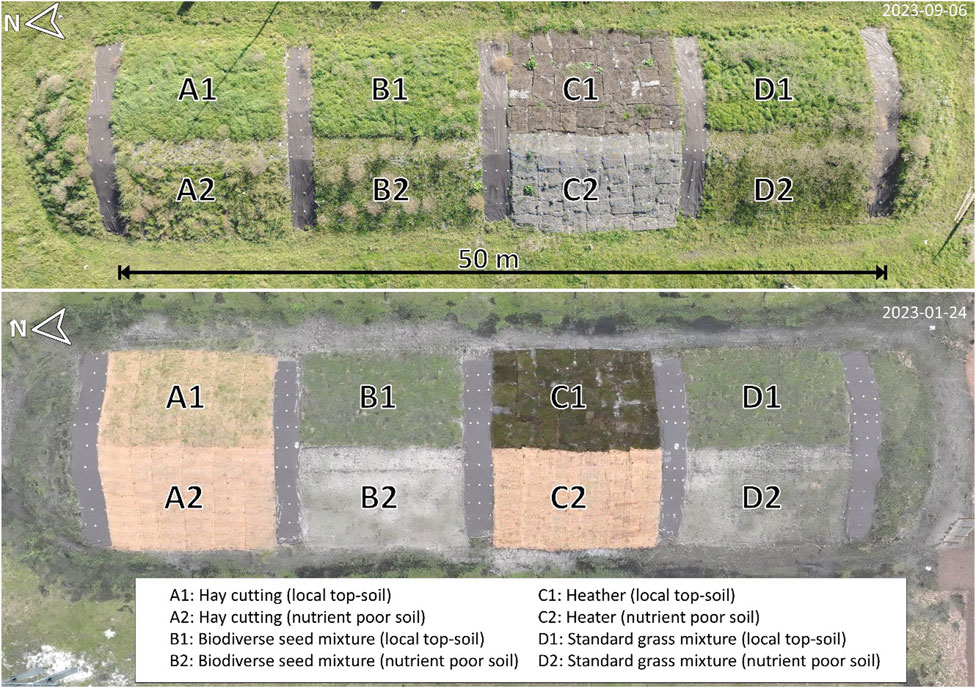
Figure 1. Aerial view of the prototype dike and six vegetation areas. The aerial image in the lower panel is taken 2023-01-24 (about 3 months after completion) and upper panel in 2023-09-06 (about 1 year after completion).
The dike body consisted of glacial till. A 30 cm thick clay layer was placed on top of the dike body. As described in Table 1, local top-soil is underneath the vegetation on the east side, nutrient-poor top soil underneath the vegetation on the west side of the dike (see Figure 2). The uppermost layer on the east side consists of the uppermost part of the vegetation that was stripped underneath the prototype dike (0–10 cm). This part was stripped first and put in one separate pile. Thereafter, the entire topsoil of 10–40 cm was stripped and placed as the second layer of the topsoil.
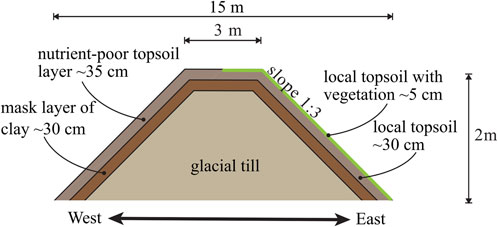
Figure 2. Cross-profile of the prototype dike.
Figure 3 shows the grain size distribution for each vegetation area for local (Figure 3A) and nutrient-poor soil (Figure 3B). All soil samples from local soil show a similar profile, while the soil samples for the three test areas for the nutrient-poor soil differ especially in the distribution of higher grain sizes. This becomes clear when comparing the D90 values, which indicate that 90% of the particles in the soil are smaller than this grain size. For local soil D90 ranges between 2.7 and 4.6 mm. D90 for test section A2 amounts to 8.4 mm; for B2, the value is 2.9 mm and 0.9 mm for D2, respectively. Larger D90 values indicate a higher coarse fraction, while smaller D90 values suggest a higher fine fraction. The fine soil fraction (cf) in the soils, defined as the percentage of particles below 0.063 mm, ranges from 3.5% to 4.5% local soil and 5.7% to 8.4% for nutrient-poor soil. The local soil can be classified as sandy soil, while the nutrient-poor soil contains a higher proportion of fine particles and thus, is classified as humus-rich sand.
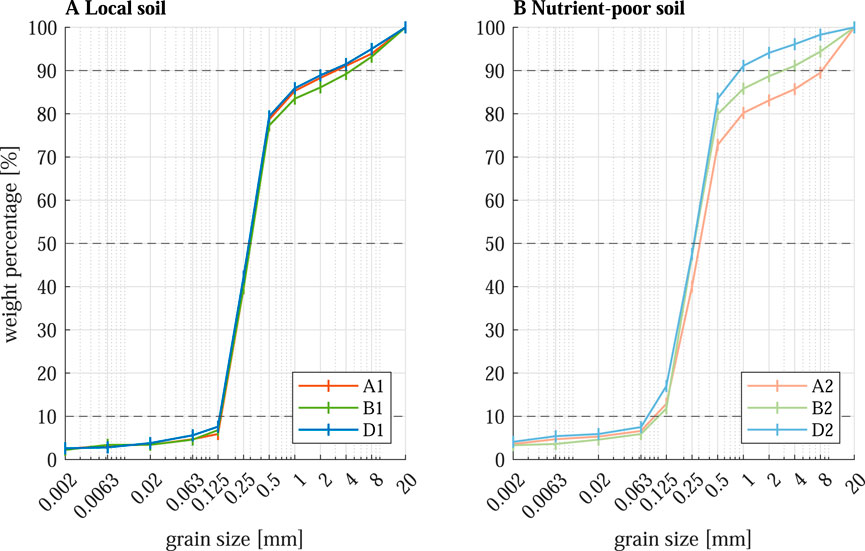
Figure 3. Grain size distribution for (A) local soil and (B) nutrient-poor soil for each test section.
2.2 Vegetation analysis
Vegetation in the six analysed areas was measured in terms of coverage and length at the time of the wave impact tests in March 2024. In addition, root analysis was performed in the first week of April 2024.
The vegetation coverage was quantified using MATLAB’s ColorThresholder tool, applied to photographs taken prior to the experiments. This method employed a color-based binary conversion process to distinguish vegetation from soil. Specifically, the RGB color ranges used for thresholding were: Red (110–250), Green (100–250), and Blue (50–250). This calibration effectively isolated the vegetation in the images. Figure 4 illustrates an example of this coverage estimation technique. The thresholding process converted vegetation to white pixels and soil to black pixels, allowing for a straightforward calculation of vegetation coverage as the percentage of white pixels in the total image area. To complement the coverage analysis, vegetation height was determined by measuring multiple individual stems and calculating their mean length. This dual approach of assessing both coverage and height provided a comprehensive characterization of the vegetation structure prior to testing.
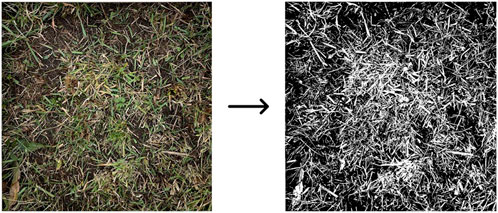
Figure 4. Example of the coverage estimation in Section A1 using MATLAB’s ColorThresholder.
The root density (RD) was sampled on 2024-04-05. RD is defined as the ratio of the dry root weight divided by the soil sample volume. Soil samples were collected at one point per plot in close proximity to one of the wave impact tests. At each point the above-ground vegetation was clipped at the surface and a cylinder with a diameter of 10 cm was used to extract samples for the depths 0–5 cm, 5–10 cm, 10–15 cm, and 15–30 cm from the surface. Soil was excavated around the cylinder and roots were cut using a steel wire to extract the soil sample in the cylinder. To separate the soil from the roots, the samples were soaked in water for 24 h. The dry root weight was obtained by drying the roots for 24 h at 105°C.
A species-based vegetation analysis was performed on 2023-08-16. Therefore, a 1 × 1 m frame was placed in the middle of each dike section. The percentage of each forb species was estimated in addition to the overall cover of the following parameters and functional groups: graminoids, forbs, bryophytes, bare soil, and litter. Graminoids are herbal plants with a grass-like morphology. Forbs are herbal species that are not graminoids and include flowering plants. Bryophytes are non-vascular plants, mainly mosses (Park and Allaby, 2017). The total cover can exceed 100% since layers may overlap. Species richness and diversity (Shannon-Weiner diversity index, H′) was calculated based on the forb species data.
2.3 Wave impact simulator and test program
The wave impacts were simulated using a wave impact simulator, constructed at the Institute of Hydraulic Engineering and Water Resources Management (IWW) at RWTH Aachen University according to the model used in Pachnio (2004), Stanczak (2008) and Scheres and Schüttrumpf (2020). It has been shown that the impact of a wave can be simulated with a falling water column (Pachnio, 2004) which is the principle of the simulator.
The simulator consists of a cylinder that is mounted to a stand. The cylinder can be filled with water and is closed at the bottom through a valve. A pneumatic system opens the valve rapidly, allowing the water to fall in one splash. The intensity of the impact can be adjusted by filling the cylinder to different water levels hw and adjusting the cylinder height above the ground hf. A schematic drawing is provided in Figure 5A. A picture of the simulator during testing on the prototype dike can be seen in Figure 5B.
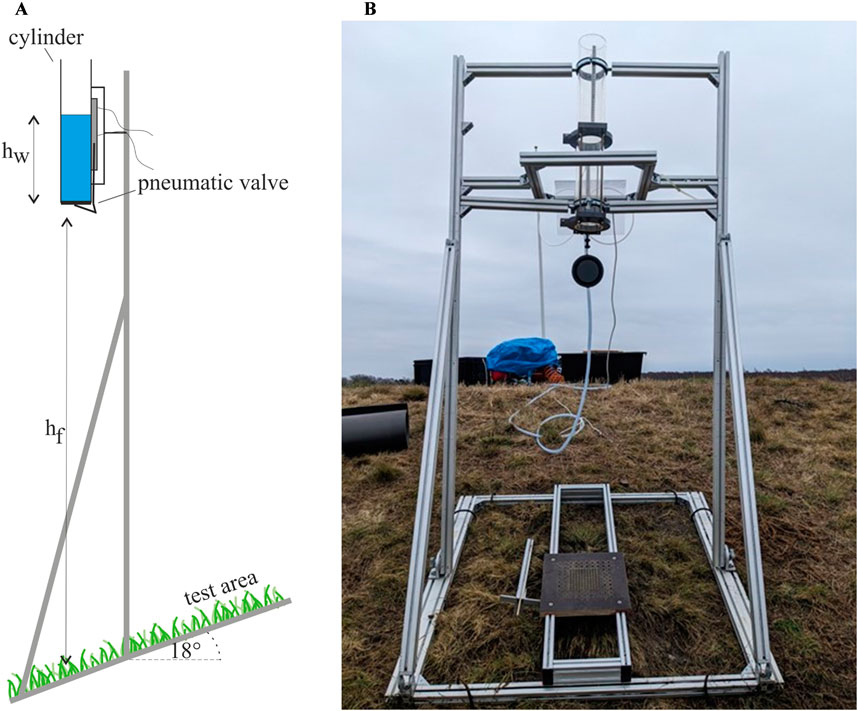
Figure 5. (A) Schematic sketch of the impact simulator and (B) wave impact simulator during tests on the dike.
The advantage of the simulator used in this study is that it can be easily moved and mounted. The wave impact generator used by van Steeg et al. (2014) is larger and thus, can create larger waves. However, it has to be moved and attached to a tractor (van Steeg et al., 2014). While the wave impact simulator used in the present study can adapt to different dike slope angles, its opening remains fixed in a vertical position. In contrast, the wave impact generator used by van Steeg et al. (2014) can adjust its opening to various angles, allowing it to align perpendicularly to the dike slope. The process of wave breaking is complex, involving various forces and stresses. However, the experiments conducted in this study concentrated exclusively on the gravitational aspect of wave breaking on a coastal structure, neglecting other processes such as wave run-up, run-down, and shear stresses. The wave impact simulator used in this study affects a smaller area compared to the real-life impact of a wave front, which would influence the entire length of the dike more extensively. Consequently, the analysis should emphasize the maximum erosion depth rather than the overall spatial extent of the erosion holes.
Five test series were conducted for each vegetation type. The specifications of the tests are given in Table 2. Each test consisted of ten splashes. The impact pressures pmax were calculated (Stanczak, 2008) for one individual splash. The individual pmax for each test was cumulated (pcum) for the total pressure exerted on the test area. From the particular pressure of one splash per test configuration, significant wave heights were calculated based on the assumption of pmax = pmax,50% (Führböter and Sparboom, 1988; Schiereck, 2003).
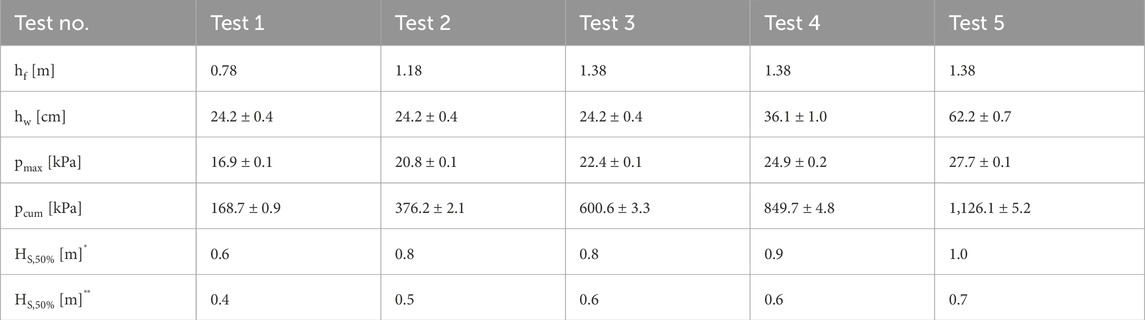
Table 2. Test specifications and maximum impact pressure for the five test series with corresponding significant wave heights calculated by Schiereck (2003) (*) and Führböter and Sparboom (1988) (**).
The erosion depth was measured using a pin profiler developed and used by Scheres and Schüttrumpf (2020). It consists of a perforated plate (see Figure 6A) with a 0.01-m grid in the center area and a 0.02-m grid in the outer area. The distance between the plate and the ground is measured with a pin in each hole (see Figure 6B). The pin profiler allows measurements to be taken without interference from vegetation roots or surface residues covering the erosion hole. An area of 18 × 18 cm could be measured with this method.
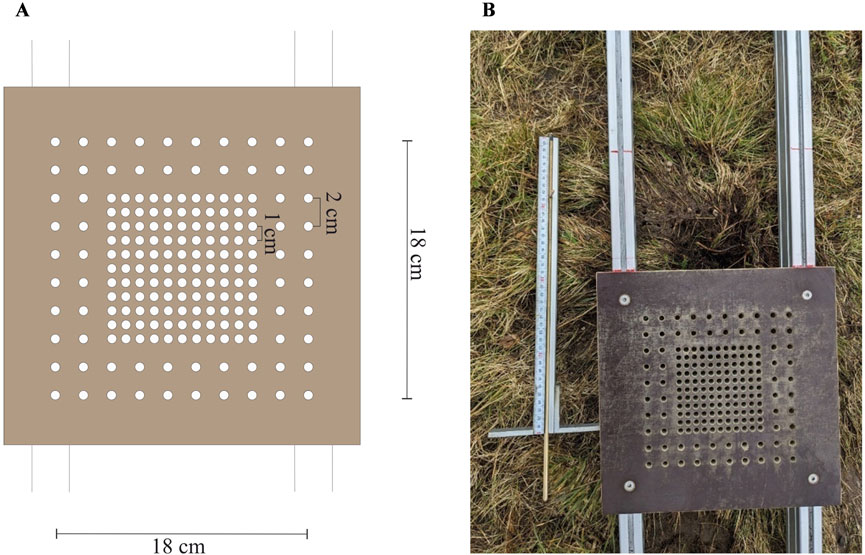
Figure 6. (A) Schematic sketch of the perforated plate and (B) picture of the pin and perforated plate used for measuring the erosion depth.
The pin profiler was set up before testing so that the center area of the perforated plate aligns with the extended opening of the cylinder. Before the first test, the initial surface profile at the test location was measured. The measuring position on the ground was kept the same for every following measurement.
3 Results and discussion
3.1 Vegetation and roots
3.1.1 Vegetation coverage and heights
Vegetation heights (hv) at the test sections are provided in Figure 7 (black circles). It shows that hv was usually longer at the spots with local soil. The same observation was obtained for the vegetation coverage (cv) except for test section B (see Figure 7).
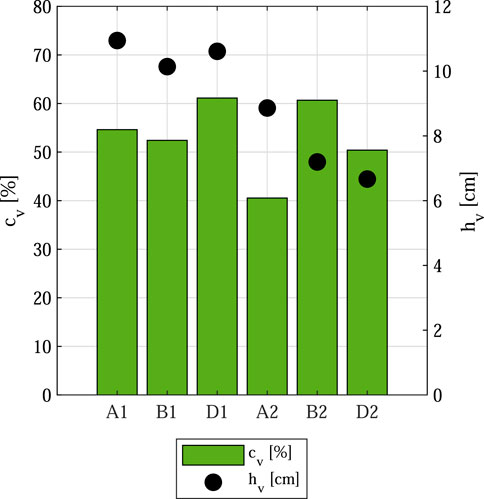
Figure 7. Vegetation coverage (cv) and vegetation height (hv) for the different test sections (1: local soil, 2: nutrient-poor soil).
The ground cover of grasses, forbs and bryophytes for each vegetation section were calculated (Table 3). In all three types of vegetation treatment, the side with the local topsoil had higher grass cover compared to nutrient-poor soil. The grass cover was similar between the different types of vegetation treatment, except that the grass cover on the nutrient-poor side was higher with the standard grass mix. The forb cover was higher with nutrient-poor soil, except for with the standard grass mix. The forb species richness and diversity were higher on the side with local topsoil and the sowing with herb-rich mixture gave the highest forb diversity.
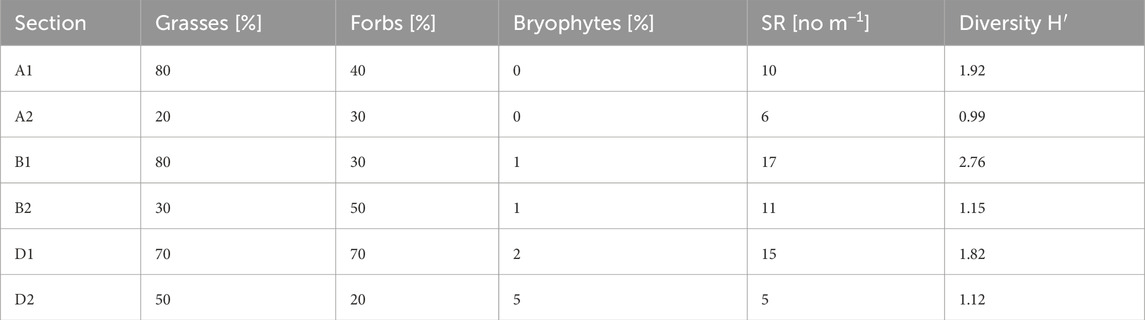
Table 3. Vegetation composition, forb species richness (SR) and diversity according to the species based analysis on 2023-08-16.
3.1.2 Root density
Figure 8 shows the root densities for the different vegetation areas. In general, the highest RD was found in the top layer (0–5 cm). Below 10 cm the RD was less than 5 kg/m3 for all points, and below 15 cm there was only a very small number of roots and an RD of less than 0.7 kg/m3 was found. For local soil, the RD was between 15.6 and 28.3 kg/m3 in the uppermost layer. The RD varied between 7.1 and 13.1 kg/m3 for nutrient-poor soil in the uppermost layer. Thereby, the lowest RDs within the soil types were found in vegetation section A, while A1 had about twice the number of roots of section A2. In a 5–10 cm soil depth, the RDs were less than 10 kg/m3 for all sections, ranging from 4.8 to 8.3 kg/m3 in local soil and from 1.0 to 2.6 kg/m3 in nutrient-poor soil. A2 and D2 had a similar number of roots in this soil depth. While A1 had lowest RD in the soil depths between 0 and 10 cm, higher RD of 3.8 kg/m3 and 0.7 kg/m3 were found in 10–15 cm and 15–30 cm depth for local soil, respectively. A2 had the lowest RDs over the entire soil depth.
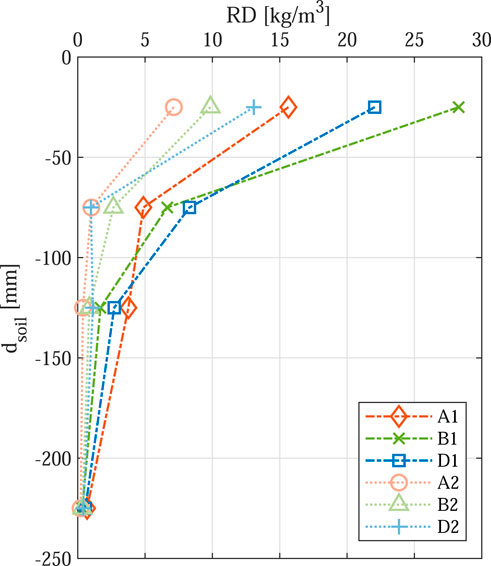
Figure 8. Root density distribution over the soil depth for each test section.
In general, the root analysis showed denser roots in the sections with local topsoil. Especially the root densities at the topsoil (0–5 cm) for B1 and D1 are high if compared to previous findings (Jackson et al., 1996; Scheres and Schüttrumpf, 2020; Vannoppen et al., 2016). Vannoppen et al. (2016) reported root densities of 4.5 kg/m3 for species-rich grass vegetation and 8.95 kg/m3 for oat-grass in the topsoil. Scheres and Schüttrumpf (2020) documented root densities of up to 9.87 kg/m3 for grass-dominated test vegetation and 6.98 kg/m3 for a biodiverse grass mixture in the topsoil. However, clay layers used in former experiments tend to be more compact and dense, which can pose a challenge to root development and thus result in lower root densities (van der Meer et al., 2010). Still, the root densities in test sections with nutrient-poor soil correspond to previous findings, which could be due to higher fine fraction in that soil. Usually, at sections with higher forb diversity (H′) higher root densities were found in the topsoil.
3.2 Erosion patterns
This study aimed to describe the evolution of erosion caused by wave impact. As previously mentioned, the wave impact simulator used in this study could focus only on a smaller area and, therefore, simplified the real-world process. Thus, the discussion of erosion patterns is centered on the maximum erosion depth, while the erosion’s overall extent is not considered in greater detail. It is important to note that larger wave fronts would influence a more extensive area along the length of the dike.
Figure 9 shows the erosion patterns after a cumulative impact pressure of 1,126 kPa for each vegetation and soil section. While the holes are visible for most sections, the erosion for section A1 is barely visible. This is due to vegetation and roots covering the hole. Test of B1 stands out in terms of a large erosion volume due to an unexpected burrow tunnel underneath the vegetation (Figure 10).
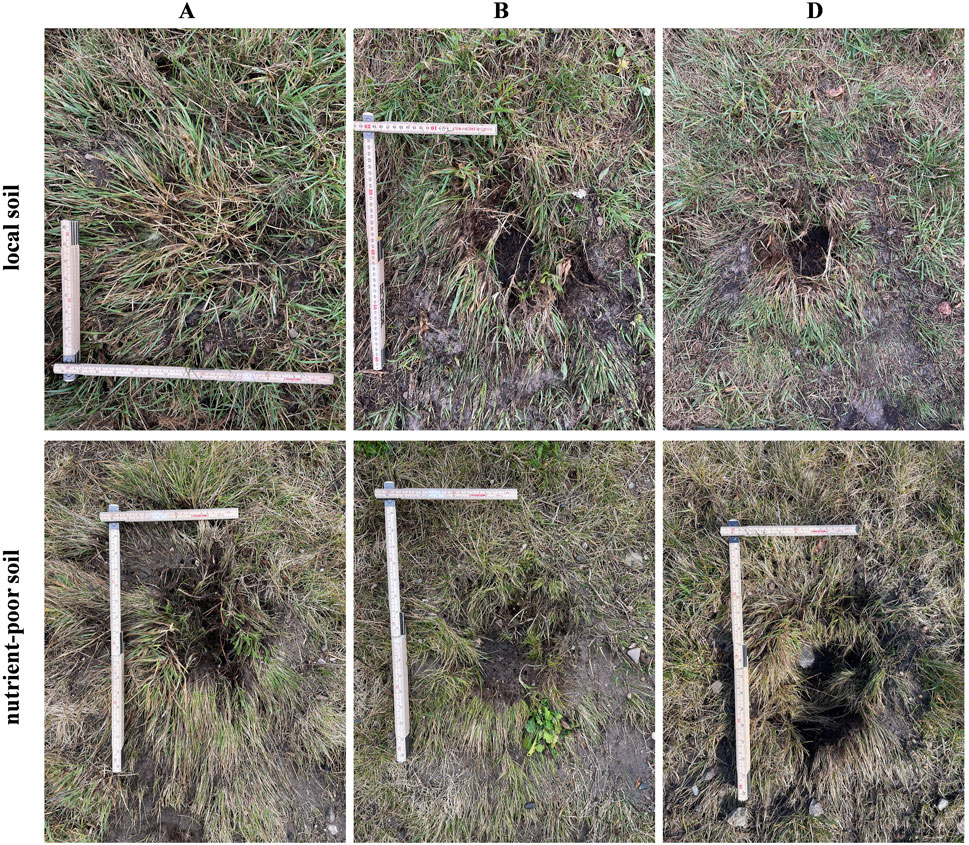
Figure 9. Erosion patterns after the fifth impact pressure for vegetation types A, B and D, as well as local soil and nutrient-poor soil.
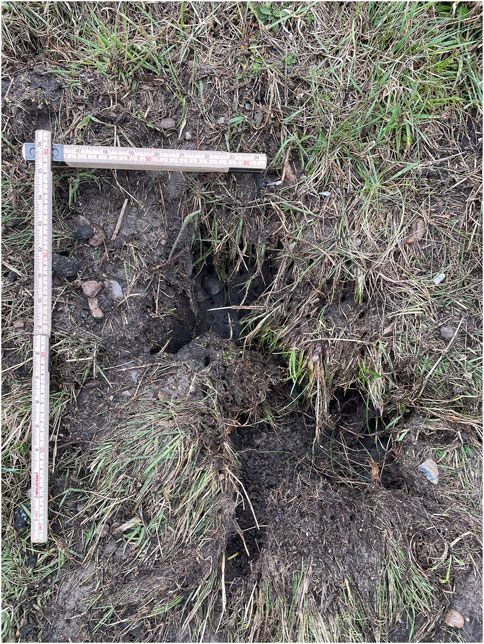
Figure 10. Test area B1 with burrow hole after testing.
The development in erosion depths after each of the five test cases is shown in Figure 11 for the different test sections. A steady increase in erosion depth after each wave impact was found (Figure 11). Furthermore, for some tests, there was a decrease in erosion depth on the upstream end. That means, that the soil was piled up and pushed by the water of the impact simulator. However, the diagram also shows that with the measuring position fixed from the beginning, the erosion patterns could not be detected entirely for every test section. The water column was deflected in some cases on its way to the ground. Thus, the maximum erosion depth was close to the edge for some test sections (e.g., B1). Spikes in the profile indicate the presence of roots (e.g., A2). In general, D1 and D2 exhibit relatively similar profiles, while the other test sections show distinct erosion patterns for the two soil types.
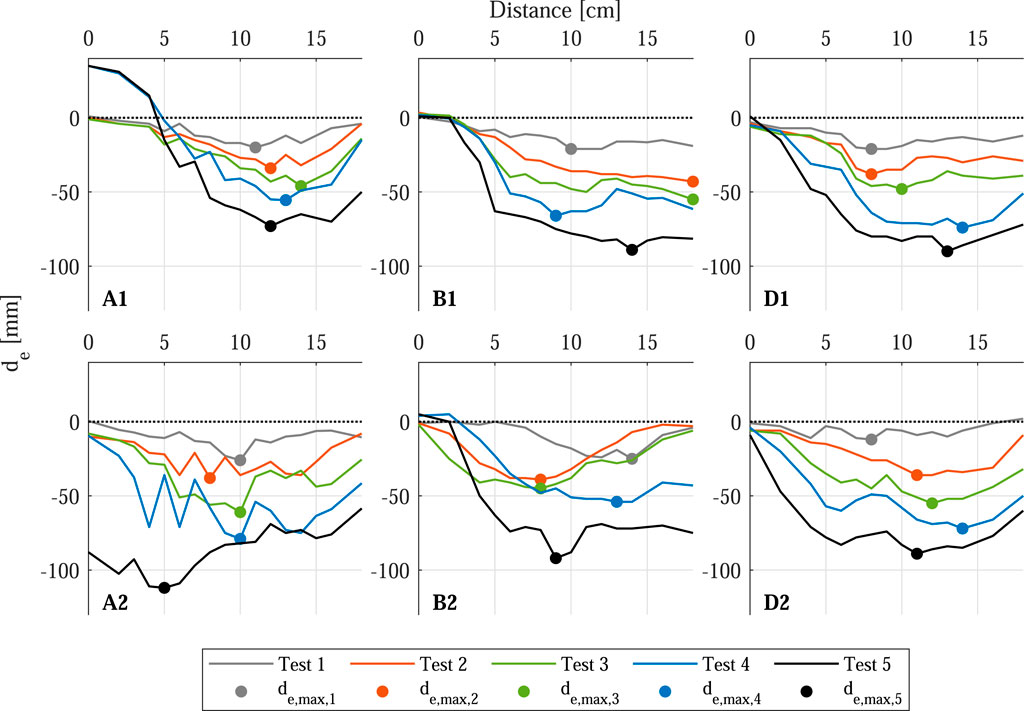
Figure 11. Development of the erosion depth over the test cases for the different test sections as a profile of the area below the simulator. The x-axis represents the distance from the crest, beginning from the uppermost point of the perforated plate (closest to the crest) and increasing downward along the slope.
Figure 12 shows the maximum erosion depth as a function of the cumulative impact pressure for the different test sections. In general, both repetitions (cross and circles) show similar results, except for B1 where a burrow tunnel interfered the tests (marked with cross). However, for test case B1 the first impact still showed similar erosion depths. Only after the hole was reached the erosion depth increases significantly. A slightly lower maximum erosion depth could be observed for local soil. The greatest difference between local and nutrient-poor soil can be seen for vegetation type A.
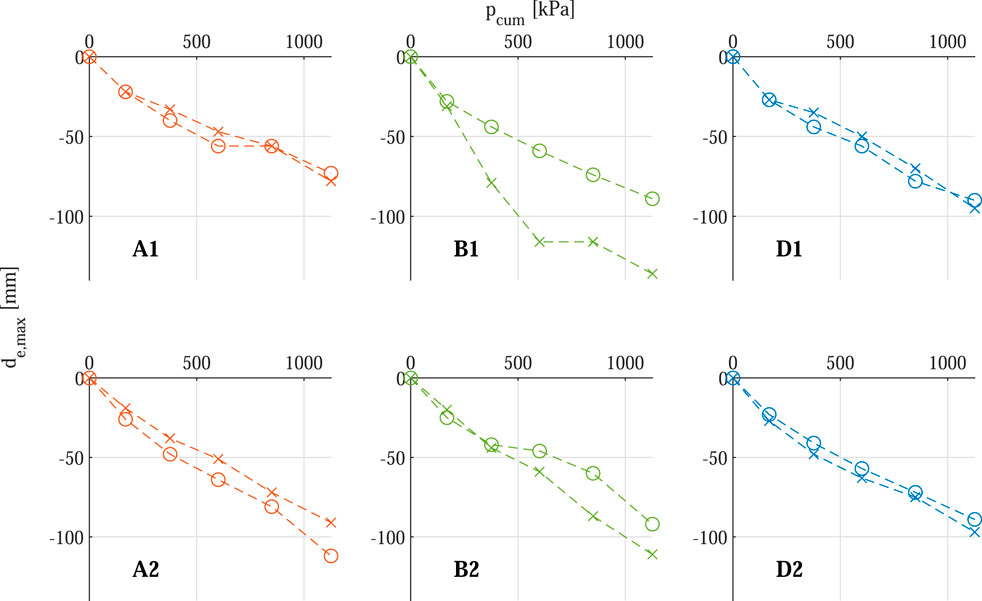
Figure 12. Maximum erosion depth (de,max)as a function of the cumulative impact pressure (pcum) for the different vegetation (A–D) and soil types (1: local soil, 2: nutrient-poor soil; circles and crosses refer to the two repetitions).
Figure 13 shows the comparison of the maximum erosion depth for the cumulative impact pressure (left) and the maximum erosion depth per impact pressure (right) as a mean of the two repetitions. Excluded from the figure was the second repetition in section B1, as there was an animal burrow near the test area, influencing the extent of the erosion depth. While A1 has the lowest root density in the first 10 cm of the soil within the sections for local soil, the erosion depth is the lowest. A1 also shows the lowest erosion depths per impact pressure. Still, test sections with nutrient-poor soil showed lower root densities compared to sections with local soil and also showed higher erosion depth over the impact pressures. Furthermore, the erosion depth after the first test case showed a moderate correlation with the root density in the top layer of the soil. However, the significant difference in root density between the soil types was not reflected in the erosion depth. While it is evident that nutrient-poor soil exhibited greater erosion depths with lower root density, the difference in erosion depth is not as pronounced. This suggests that while the influence of roots cannot be disregarded, the soil and vegetation type likely played a more decisive role. The latter is supported by the fact that the highest grass coverage of 80% was found in test areas A1 and B1, which showed the lowest erosion depth.
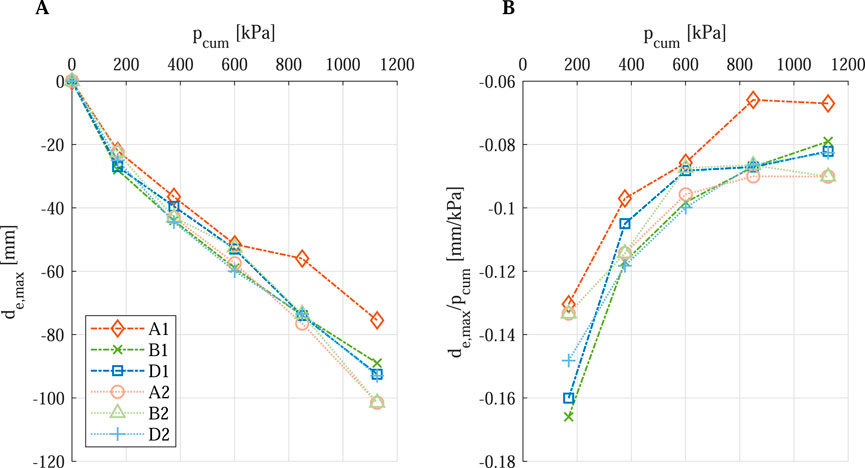
Figure 13. Comparison of the maximum erosion depth (A) and erosion depth per impact pressure (B) as mean of the repetitions (excluded B1-2).
Scheres and Schüttrumpf (2020) observed erosion depths of up to 0.15 m (tests were stopped after reaching an erosion depth of 0.15 m). Present study’s section B can be compared to test vegetations (TV) 5 and 6 (both species-rich herb-dominated mixtures), and D can be compared to TV 1 (grass-dominated mixture).
Figure 14A shows the comparison of section B of the present data and TV5 and TV6 by Scheres and Schüttrumpf (2020). One trial of TV5 and TV6 was eroded more quickly, while the other repetition was more resistant than the present data. The differences between the repetitions in their investigations could be due to the fact that, particularly for TV6, the vegetation density was around 45%, resulting in bare spots within the test area. Consequently, a bare spot may have been affected during one repetition, while in another, a vegetated spot was hit, potentially leading to differences in the repetitions. In the present study, the vegetation cover was relatively uniform, which is why the observed differences were minimal. However, this highlights the importance of vegetation coverage when addressing the question of erodibility. The comparison between section D of the present data and TV1 by Scheres and Schüttrumpf (2020) is presented in Figure 14B. The test of TV1 aligns with the tests of the present study, which shows the robustness of the method and its applicability under laboratory conditions as well as for in situ tests.
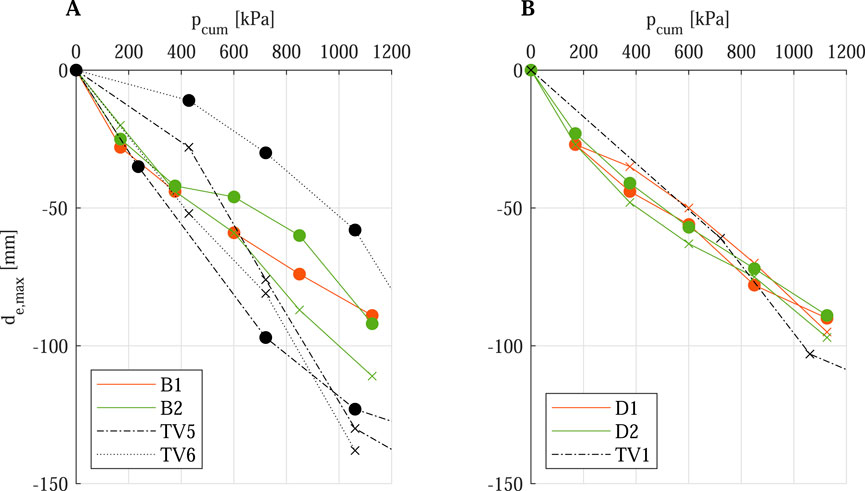
Figure 14. Comparison between present data (solid line) and data from Scheres and Schüttrumpf (2020) (dashed line) on maximum erosion depth (de,max) as a function of the cumulative impact pressure (pcum). (A): herb-rich mixture, (B): standard grass mixture (Circles and crosses refer to the different repetitions of the tests, the colors indicate the test vegetation used. Only the test vegetation from Scheres and Schüttrumpf (2020)’s study with a growing time of 18 months is considered).
Figure 15A shows the erosion volume after each test case for the different test sections. It can be observed that–similar to the erosion depth–a higher soil volume was eroded at the end of the tests on nutrient-poor soil. Figure 15B indicates that the erosion volume per impact pressure (L/kPa) during the initial splash is greater for local soil compared to nutrient-poor soil. Contrastingly, in tests 2 and 3, the L/kPa decreases for local soil, while it increases for nutrient-poor soil. Both soil types exhibit an increase in erosion volume in tests 4 and 5. Notably, the initial observation deviates from expectations based on root density. Despite higher root density in the upper layer of local soil, erosion volume was generally greater across most tests. However, nutrient-poor soil demonstrated a higher erosion volume in the final case than local soil. If vegetation height is considered, A1 had the highest height in soil section 1, which potentially helped to attenuate the first impact pressure. However, this connection was not true for nutrient-poor soil, indicating the interaction of roots, vegetation height, coverage and soil for erosion due to impact pressure. It should also be mentioned that the results of the erosion volumes can not directly be transferred to actual wave impacts as the extent of erosion due to actual wave fronts would impact a greater area along the dike length. However, it shows the differences between the soil types and emphasizes the interaction between soil and vegetation parameter.
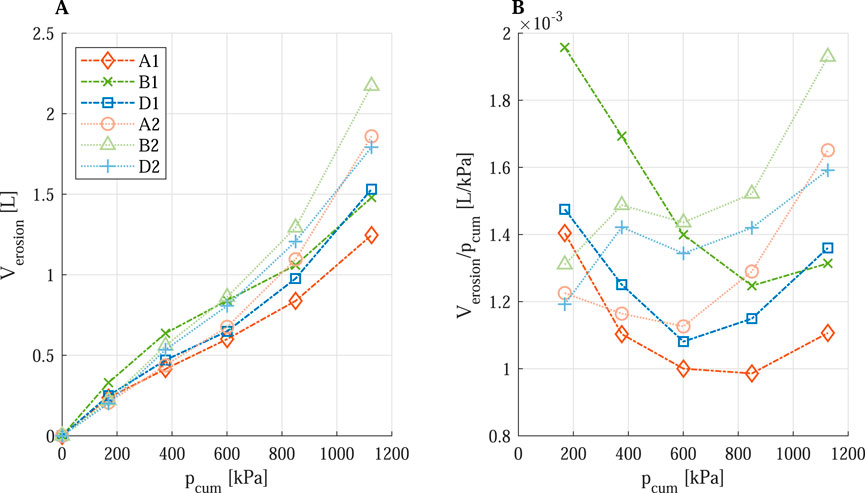
Figure 15. Erosion volume (A) and erosion volume per cumulated impact pressure (B) for vegetation types A, B and D, as well as soil types (1: local soil, 2: nutrient-poor soil).
In general, the root density seems not to be the only influencing factor when it comes to erosion depth. Thus, the correlation between soil types could be reasonable.
Furthermore, within one soil type section, no significant differences between the vegetation areas regarding the erosion resistance were observed, allowing the conclusion that biodiverse vegetation cover (vegetation type B) is equally resistant as grass cover (vegetation type D). Similar results were obtained by de Kroon et al. (2024) for the hydraulic load of overtopping. In detail, they found that erosion resistance levels for higher biodiverse vegetation were close to those of traditional grass cover.
Figure 16 shows the relationship between two dimensionless numbers. On the y-axis, maximum erosion depth, vegetation coverage, and vegetation height, on the x-axis, root density, soil parameters, and impact pressure are plotted. The fitted power function indicates that with higher RD, D50 value and pcum and lower cf, the erosion depth de decreases. This suggests that soil with greater grain sizes is eroded slower than soil with a higher proportion fine fraction. This aligns with the differences noted between the previous study by Scheres and Schüttrumpf (2020) and the present one, as the soil used in the former study had a higher fine particle content. In contrast, experiments on wave run-up and overtopping revealed that the dike body eroded more quickly with larger grain sizes, likely due to the cohesion between finer particles (Evangelista, 2015). This indicates the different forces acting during run-up and impact pressures. Since wave breaking occurs along with wave run-up and run-down, the erosion around the impact pressure point may vary. Furthermore, in this study, the soils were very similar; a more systematic investigation could give further insights. In addition, higher root density results in smaller erosion depths, as indicated in Figure 16.
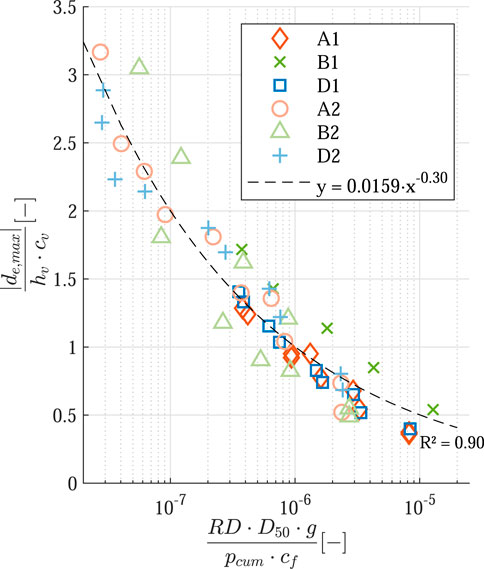
Figure 16. Relationship between soil, vegetation and erosion parameter as function of dimensionless number and fitted equation (B1 with animal burrow was excluded).
During the testing period, there was little to no rainfall, with an average of 0.04 mm/h. However, storm surges are usually accompanied by rainfall and infiltration, which increases the water content in the soil. In this study, we did not measure water content, but it is important to note that it still affects the soil’s erodibility. Higher soil water content typically reduces soil cohesion (Pezowicz and Choma-Moryl, 2015; Ravindran and Gratchev, 2022), making particles more susceptible to detachment and transportation by flowing water. Consequently, the likelihood of erosion due to wave impacts could be increased.
4 Conclusion
This study investigated the erosion resistance of a prototype dike with different vegetation and soil sections constructed on the Falsterbo peninsula, Sweden. Therefore, a wave impact simulator was constructed to replicate the gravity driven wave impact in a simplified model. Different impact pressures were tested in this study. The results showed:
• Erosion depth, when tested with a wave impact simulator, correlates with the fine fraction of the soil and correlates negatively with the root density.
• A higher forb diversity resulted in larger root densities and, thus, lower erosion. The tests revealed that areas with greater biodiversity and various types of vegetation exhibited a similar erosion behavior to those with standard grass mixtures. This suggests no trade-off between erosion stability and high biodiversity on dikes. Therefore, equipping dikes with more diverse plant life not only improves ecological value and offers the advantages of nature-based solutions but also demonstrates erosion stability comparable to that of standard grass mixtures. Still, a systematic investigation would be needed to receive in-depth information on the impact of vegetation and soil properties.
• In general, the study showed consistency in the results between the replications as well as in comparison to former studies. Thus, the methodology, originally developed for laboratory experiments, can be transferred to in situ experiments on existing dikes.
Furthermore, due to low destructiveness, the method tested can be applied on dikes in operation, and damages can easily be restored. However, the wave impacts’ transferability to real wave impacts is restricted due to the lack of air inclusion, run-up and run-off as well as the angle in which it splashes on the dike.
The wave impact simulator utilized in this study had notable limitations in fully replicating real-world wave dynamics. While successfully representing the gravitational component of a plunging breaker, the experimental setup could not accurately reproduce critical aspects such as wave velocity, perpendicular surface impact, wave run-up and run-down processes, and the associated shear stresses that contribute to sediment transport. The simplified approach focused exclusively on impact pressure, thereby neglecting the complex energy dissipation mechanisms typical of plunging breakers, particularly aeration processes, or the dampening effect of wave run-down. Consequently, the pressure measurements might be overestimated, though the study still provided valuable insights into the interaction between vegetated dike surfaces and gravitational impact pressures. Furthermore, a comparison to other methods, such as the larger wave impact generator, would be needed to determine the erosion resistance of dike covers and the goodness of the method. In addition, other parameters, such as the water content in the soil, play an important role in the erosion resistance of soils and could be included in further investigation.
Data availability statement
The raw data supporting the conclusions of this article will be made available by the authors, without undue reservation.
Author contributions
AM: Conceptualization, Data curation, Formal Analysis, Investigation, Methodology, Visualization, Writing–original draft. BA: Conceptualization, Data curation, Investigation, Visualization, Writing–review and editing. PO: Investigation, Writing–review and editing. HS: Conceptualization, Writing–review and editing.
Funding
The author(s) declare that financial support was received for the research, authorship, and/or publication of this article. The financial support from the Swedish innovation agency, Vinnova, (grant number: 2021–02474), the EU-Life project “LIFECAPEable” (LIFE22-CCA-SE-LIFECAPEable/101113673), and the German Research Foundation (DFG) (funding code: SCHU 1054/24-1) is acknowledged.
Acknowledgments
The authors would like to thank the technical staff of IWW (Kristian Brodersen, Arne Harz and Peter Kläser) for constructing the wave impact simulator and Ecogain AB for the inventory of the plants. Furthermore, the authors would like to thank the municipality of Vellinge, especially Erik Andersson, for providing water and electricity for the experiments.
Conflict of interest
The authors declare that the research was conducted in the absence of any commercial or financial relationships that could be construed as a potential conflict of interest.
Generative AI statement
The authors declare that no Generative AI was used in the creation of this manuscript.
Publisher’s note
All claims expressed in this article are solely those of the authors and do not necessarily represent those of their affiliated organizations, or those of the publisher, the editors and the reviewers. Any product that may be evaluated in this article, or claim that may be made by its manufacturer, is not guaranteed or endorsed by the publisher.
Footnotes
1Provider: Pratensis, Grimslöv, Sweden, seed mixture 104: “Torräng kalkfattig”. Species composition: Achillea millefolium, Campanula rotundifolia, Dianthus deltoides, Galium verum, Hieracium aurantiacum, Hieracium pilosella, Hieracium umbellatum, Hypericum maculatum, Hypochoeris radicata, Jasione montana, Knautia arvensis, Leucanthemum vulgare, Linaria vulgaris, Lotus corniculatus, Viscaria vulgaris, Pimpinella saxifraga, Potentilla argentea, Rumex acetosella, Saxifraga granulata, Solidago virgaurea, Viola tricolor, Agrostis capillaris, Anthoxanthum odoratum, Bromus hordeaceus, Deschampsia flexuosa, Festuca ovina, Festuca rubra, Luzula campestris.
2Provider: Skånefrö, Östra Tommarp, Sweden, seed mixture “Österlen Villa”. Species composition: 10% Lolium perenne, 25% Poa pratensis, 35% Festuca rubra ssp. trichophylla, 30% Festuca rubra ssp. rubra.
References
Ahlström, F., and Åberg, P. (2018). Bilaga C4 Geografisk och ekonomisk analys kring Falsterbohalvön.
Cantré, S., Olschewski, J., and Saathoff, F. (2017). Full-Scale Flume Experiments to Analyze the Surface Erosion Resistance of Dike Embankments Made of Dredged Materials. J. Waterw. Port Coast. Ocean Eng. 143 (3). doi:10.1061/(ASCE)WW.1943-5460.0000375
CIRIA (2013). The international levee handbook. London, United Kingdom: Construction Industry Research and Information Association 731.
de Kroon, H., van Rooijen, N. M., and Pohlmann, L. (2024). Future dikes 2024: sterke soortenrjike dijkbekleding. Available at: https://edepot.wur.nl/661704.
EAK (2002). Empfehlungen für Küstenschutzwerke: 3. korrigierte Ausgabe 2020. Die Küste. doi:10.18171/1.088100
Evangelista, S. (2015). Experiments and numerical simulations of dike erosion due to a wave impact. Water 7 (10), 5831–5848. doi:10.3390/w7105831
Führböter, A. (1991). Wellenbelastung von Deich-und Deckwerksböschungen. Jahrb. Der Hafenbautech. Ges. 46, 225–282.
Führböter, A., Dette, H. H., and Grüne, J. (1977). “Response of sea dykes due to wave impacts,” in Coastal engineering 1976 (American Society of Civil Engineers), 2604–2622. doi:10.1061/9780872620834.150
Führböter, A., and Sparboom, U. (1988). Shock pressure interactions on prototype sea dykes caused by breaking waves. Available at: https://resolver.tudelft.nl/uuid:dbe72e7d-7024-4e30-90a8-cca4b69ac714.
IPCC (2019). IPCC Special Report on the Ocean and Cryosphere in a Changing Climate. Available at: https://www.ipcc.ch/srocc/
Jackson, R. B., Canadell, J., Ehleringer, J. R., Mooney, H. A., Sala, O. E., and Schulze, E. D. (1996). A global analysis of root distributions for terrestrial biomes. Oecologia 108 (3), 389–411. doi:10.1007/BF00333714
Korell, L., Andrzejak, M., Berger, S., Durka, W., Haider, S., Hensen, I., et al. (2024). Land use modulates resistance of grasslands against future climate and inter-annual climate variability in a large field experiment. Glob. Change Biol. 30 (7). doi:10.1111/gcb.17418
Nicholls, R. J., and Cazenave, A. (2010). Sea-level rise and its impact on coastal zones. Science 328 (5985), 1517–1520. doi:10.1226/science.1185782
Michalzik, J., Liebisch, S., and Schlurmann, T. (2019). Development of an Outdoor Wave Basin to Conduct Long-Term Model Tests with Real Vegetation for Green Coastal Infrastructures. JMSE 7 (1). doi:10.3390/jmse7010018
Pachnio, T. (2004). Druckschlagausbreitung in Fugen, Rissen und Spalten bei Deckwerken. Braunschweig, Germany: Leichtweiß-Institut für Wasserbau der TU Braunschweig.
Park, C., and Allaby, M. (2017). A dictionary of environment and conservation volume 1. Oxford University Press. doi:10.1093/acref/9780191826320.001.0001
Pezowicz, P., and Choma-Moryl, K. (2015). Moisture content impact on mechanical properties of selected cohesive soils from the wielkopolskie voivodeship southern part. Studia Geotechnica Mech. 37 (4), 37–46. doi:10.1515/sgem-2015-0043
Pontee, N., Narayan, S., Beck, M. W., and Hosking, A. H. (2016). Nature-based solutions: lessons from around the world. Proceedings of the Institution of Civil Engineers - Maritime Engineering 169 (1), 29–36. doi:10.1680/jmaen.15.00027
Ravindran, S., and Gratchev, I. (2022). Effect of water content on apparent cohesion of soils from landslide sites. Geotechnics 2 (2), 385–394. doi:10.3390/geotechnics2020017
Roem, W., and Berendse, F. (2000). Soil acidity and nutrient supply ratio as possible factors determining changes in plant species diversity in grassland and heathland communities. Biol. Conserv. 92 (2), 151–161. doi:10.1016/S0006-3207(99)00049-X
Scheres, B., and Schüttrumpf, H. (2019). Enhancing the Ecological Value of Sea Dikes. Water 11 (8), 1617. doi:10.3390/w11081617
Scheres, B., and Schüttrumpf, H. (2020). Investigating the erosion resistance of different vegetated surfaces for ecological enhancement of sea dikes. J. Mar. Sci. Eng. 8 (7), 519. doi:10.3390/jmse8070519
Schiereck, G. J. (2003). Introduction to bed, bank and shore protection. London: CRC Press. doi:10.1201/9781315274935
Seijffert, J. W. W. (1998). “Grass covers and reinforcement measures,” in Dikes and Revetments. Editors K. Pilarczyk (Routledge), 289–299. doi:10.1201/9781315141329
Stanczak, G. (2008). Breaching of sea dikes initiated from the seaside by breaking wave impacts. Braunschweig, Germany: Universitätsbibliothek.
van der Meer, J., Schrijver, R., Hardeman, B., van Hoven, A., Verheij, H., and Steendam, G. J. (2010). “Guidance on erosion resistance of inner slopes of dikes from three years of testing with the Wave Overtopping Simulator,” in Coasts, marine structures and breakwaters: adapting to change. Editor W. Allsop (Thomas Telford Ltd), 460–473. doi:10.1680/cmsb.41318.0044
van der Meulen, F., IJff, S., and van Zetten, R. (2023). Nature-based solutions for coastal adaptation management, concepts and scope, an overview. Nord. J. Bot. (1). doi:10.1111/njb.03290
Vannoppen, W., Poesen, J., Peeters, P., de Baets, S., and Vandevoorde, B. (2016). Root properties of vegetation communities and their impact on the erosion resistance of river dikes. Earth Surf. Process. Landforms 41 (14), 2038–2046. doi:10.1002/esp.3970
van Steeg, P., Klein Breteler, M., and Labrujere, A. (2014). “Design of wave impact generator to test stability of grass slopes under wave attack,” in 5th International Conference on The Application of Physical Modelling to Port and Coastal Protection - Coastlab14, Varna, Bulgaria, 29 Sep 2014 – 02 Oct 2014, 1–11.
Keywords: sea dike, vegetation, wave impact, erosion resistance, coastal protection
Citation: Mozer A, Almström B, Olsson PA and Schüttrumpf H (2025) Estimating erosion resistance of vegetated sea dike embankments through in situ experiments. Front. Built Environ. 11:1528863. doi: 10.3389/fbuil.2025.1528863
Received: 15 November 2024; Accepted: 20 January 2025;
Published: 27 February 2025.
Edited by:
Gioele Ruffini, Sapienza University of Rome, ItalyReviewed by:
Riccardo Briganti, University of Nottingham, United KingdomWeiqiang Feng, Southern University of Science and Technology, China
Copyright © 2025 Mozer, Almström, Olsson and Schüttrumpf. This is an open-access article distributed under the terms of the Creative Commons Attribution License (CC BY). The use, distribution or reproduction in other forums is permitted, provided the original author(s) and the copyright owner(s) are credited and that the original publication in this journal is cited, in accordance with accepted academic practice. No use, distribution or reproduction is permitted which does not comply with these terms.
*Correspondence: Anne Mozer, bW96ZXJAaXd3LnJ3dGgtYWFjaGVuLmRl