 Kendall M. Capshaw
 Jamie E. Padgett
94% of researchers rate our articles as excellent or good
Learn more about the work of our research integrity team to safeguard the quality of each article we publish.
Find out more
ORIGINAL RESEARCH article
Front. Built Environ., 07 March 2025
Sec. Coastal and Offshore Engineering
Volume 11 - 2025 | https://doi.org/10.3389/fbuil.2025.1418492
Pollutant emissions due to hurricane-induced petrochemical infrastructure disruptions pose a significant threat to the public health of fenceline communities and the surrounding environment. The objective of this study is to develop a framework for cascading consequence modeling of petrochemical processing infrastructure subjected to hurricane hazards. Overall the proposed framework leverages Bayesian networks for predictive modeling and potential updating of facility shutdown and excess emissions quantification due to hurricane-induced facility failures. The NHERI DesignSafe Cyberinfrastructure is leveraged to reuse prior hindcast storm datasets, develop and share a petrochemical infrastructure performance database, conduct statistical analyses for model development, and perform case study regional risk analyses. As input to the framework, predictive models for likelihood and expected duration of petrochemical facility idle and restart times and expected resulting excess emissions quantities are proposed. Such models are presently lacking in the literature yet vital for risk and resilience modeling of the cascading consequences of petrochemical complex shutdowns ranging from resilience analyses of regional petrochemical processing infrastructure to potential health effects on fenceline communities tied to shutdown and restart activities. A database of empirical petrochemical facility characteristics, downtime, and hurricane hazards data is developed, and statistical analyses are conducted to investigate the relationship between facility and storm features and shutdown duration. The proposed method for expected shutdown modeling with the highest predictive accuracy is determined to be one comprised of a logistic regression binary classification component related to facility shutdown potential and a gamma distribution generalized linear model component related to idle time duration determination. To illustrate the utility of the proposed framework, a case study is performed investigating the potential mitigative impact of the proposed Galveston Bay Park Plan on Houston Ship Channel regional petrochemical processing resilience and cascading air pollutant emissions risk. Such analyses expose community and regional impacts of facility failures and can support resilience improvement decisions.
Ambient air pollution poses a significant and chronic threat to public health and the environment around the world (Manisalidis et al., 2020). Globally, ambient air pollution remains the highest environmental and fourth leading overall risk factor for premature death (Health Effects Institute, 2020). Hazardous (e.g., volatile organic compounds) and criteria (e.g., ozone, particulate matter, carbon monoxide, and sulfur dioxide) air pollutants have been associated with a wide variety of adverse health effects, including infant mortality, cancer, and respiratory and cardiovascular disease (Manisalidis et al., 2020; Goldman et al., 2022). Exposure to these air pollutants and their associated consequential health risks disproportionately impacts disadvantaged and socially vulnerable populations, particularly fenceline communities which are situated directly adjacent to highly polluting industrial facilities (Collins et al., 2016; Banzhaf et al., 2019).
Oil and gas infrastructure, such as refineries and petrochemical facilities, are major emission sources which tend to release multiple air pollutants into the atmosphere even under normal operating conditions (McCoy et al., 2010). However, during natural disasters such as tropical storms and hurricanes, significant short-term spikes in the emission levels of various hazardous and criteria air pollutants due to either emergency facility shutdowns and restarts or industrial accidents are commonly observed (Bhandari et al., 2022). For example, Gulf Coast refineries and petrochemical facilities reported the release of over 4 million pounds of air pollutants due to emergency shutdown procedures alone during Hurricane Laura in 2020 (Fraser, 2020). Reportable excess emissions during Hurricane Harvey in 2017 totaled over 14 million pounds, of which carbon monoxide (CO) accounted for almost 3 million pounds of pollutants and sulfur dioxide (SO2) accounted for over 4 million pounds of pollutants (Xa et al., 2017). These excess emissions events in turn result in severe and costly damage to public health (Zirogiannis et al., 2018). Due to the highly centralized nature of the U.S. oil and gas processing infrastructure, which is largely concentrated within the hurricane prone Gulf Coast region, refinery and petrochemical facility disruption due to hurricane hazards occurs regularly. Furthermore, climate change research suggests that hurricane hazards induced and exacerbated by sea level rise and global warming are likely to increase throughout the century (Lin et al., 2012; Dong et al., 2022; Dismukes and Narra, 2018; Rusco, 2014), particularly in the U.S. Gulf Coast region (Marsooli et al., 2019).
In addition to the adverse health effects of refining and petrochemical processing facility failures due to hurricane hazards, prolonged facility disruptions can also result in substantial and sustained economic and supply chain impacts. For example, Hurricane Harvey halted over 60% of the total U.S. ethylene production, with many petrochemical facilities unable to resume processing activities for weeks and even months following the storm’s dissipation (Cassiday, 2018). Ethylene is one of the most important chemicals in the global production of resins, plastics, and other essential chemical compounds which are vital building blocks for both domestic and international manufacturing sectors (AFPM Communications, 2017). The U.S. is the largest ethylene producing country in the world (Bielicki et al., 2014; Alshammari et al., 2016) and Texas alone accounts for approximately 70% of domestic ethylene production capacity, with Louisiana housing another 20% of total domestic capacity (DiChristopher, 2017). As a result, disruptions to Gulf Coast petrochemical processing activities can have far-reaching market impacts. For example, prolonged petrochemical facility shutdowns across Texas following Winter Storm Uri in February of 2021 resulted in a global plastics shortage which impacted domestic and international manufacturing activities and disrupted the global supply chain for months (Matthews et al., 2021). This issue is only likely to increase as more U.S. ethylene production capacity, particularly in the Gulf Coast region, becomes available with major planned facility expansions and start-ups projected to come online in the coming years (Eiermann, 2022; Bernhardt, 2022).
In the oil and gas supply chain infrastructure space, previous work has modeled distributed systems network resilience, such as via the adoption of a graph theory approach to quantify the resilience of a case study natural gas distribution network to disruptions resulting from both facility failures (Pourhejazy et al., 2017) and pipeline failures (Cimellaro et al., 2013) and specifically to make recommendations for future facility optimal siting (Nadeau, 2007). Previous studies have also proposed methods to model economic, environmental, and social risks of coastal production and refining centers and their respective fenceline communities subjected to hurricane-induced hazards (Bernier et al., 2017; Ebad Sichani et al., 2020; Dahitaleghani, 2016; Burleson et al., 2015). Past work has also proposed empirically-derived predictive models for estimating the expected idle time duration of refining complexes following hurricane events (Capshaw and Padgett, 2023). However, previous studies developing predictive models for hurricane hazard-induced downtime of oil and gas processing facilities have only been applicable to petroleum refining complexes, not ethylene producing petrochemical facilities, which have unique processes and constituent components. Furthermore such models currently do not capture the duration of the highly uncertain facility restart period, which is important for overall consequence modeling (Capshaw and Padgett, 2023).
In the emissions research space, previous studies have proposed various soft sensor techniques for daily emissions monitoring under normal operating conditions of refineries, petrochemical facilities (Roberty and Rubin, 2021; Bernier and Padgett, 2017), and coal mines (Shao and Zhang, 2023). Linear regression models have been proposed to estimate daily CO2 emissions volumes of refineries based on operable capacity under normal operating conditions (Madugula et al., 2021). Additionally, post-event analyses have been performed previously to estimate impacts on air quality due to historical natural and anthropogenic disasters (Bhandari et al., 2022). Past studies have also modeled potential atmospheric pollution formation due to hazardous material spills (Bi et al., 2021). However, there is a scarcity of studies proposing models to predict the cascading emissions consequences of petrochemical complex infrastructure failures due to hurricane hazards.
To address these gaps, the objective of this study is to pose a method for developing a predictive model for the volume of excess emissions from petrochemical complexes due to hurricane hazard-induced facility failures. A Bayesian network formulation is proposed as the overarching framework, but along the way, key missing input models for central nodes of the network are derived. Specifically, this study will propose models for the prediction of likelihood and expected duration of petrochemical facility shutdowns and expected duration of subsequent restart activities periods. In the subsequent sections of this paper, first a database of empirical petrochemical facility excess emission quantities, idle time and restart activity period durations, and hurricane-induced hazard data is developed. Then, models for the prediction of petrochemical facility idle time duration and restart activity period duration due to hurricane-induced hazards are proposed. Next, a data-driven Bayesian network-based excess CO emissions prediction model is proposed for petrochemical facilities exposed to hurricane events. In Section 3, quantification of regional ethylene production infrastructure resilience and consequential excess CO emissions estimates is illustrated using the proposed models. Here, the utility of the framework is illustrated within a practical case study that evaluates the impacts of a regional risk mitigation strategy in the Houston Ship Channel region, shown in Figure 1. Finally, the paper concludes with a discussion of the results and future research opportunities for both the improvement and implementation of the proposed models.
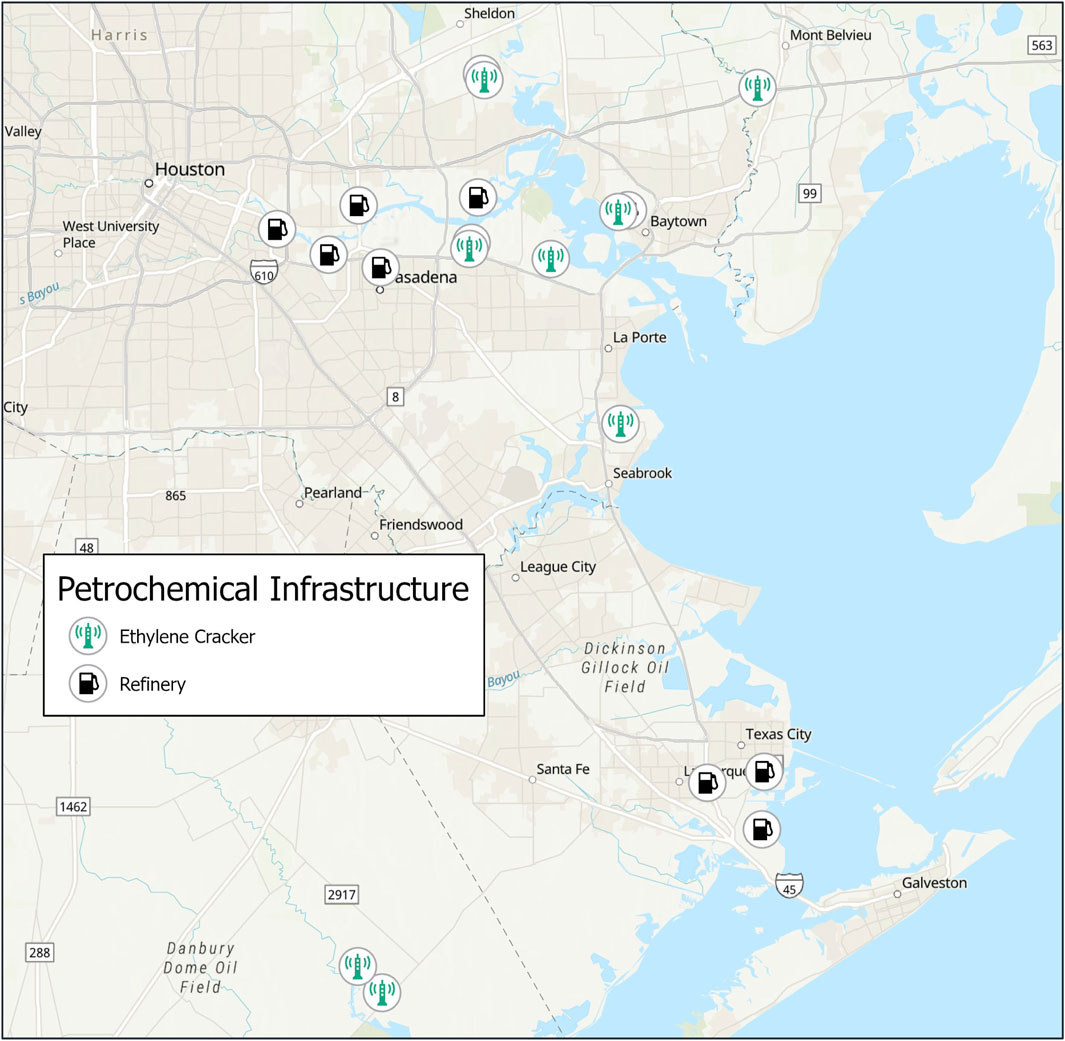
Figure 1. Houston Ship Channel oil and gas processing infrastructure
This study proposes the use of data-driven Bayesian networks to predict the excess CO emissions volumes of ethylene-producing petrochemical complexes when exposed to hurricane events. Carbon monoxide is an odorless, colorless gas which is released as a result of the incomplete combustion of fossil fuels, and elevated outdoor levels of CO can cause various health complications, particularly for individuals suffering from respiratory or cardiovascular disease (United States Environmental Protection Agency EPA, 2023). Following hurricane hazard-induced disruptions, CO is one of the highest reported criteria air pollutant quantities released in the form of excess emissions by petrochemical facilities (Xa et al., 2017). Bayesian networks present an optimal modeling approach for this problem due to their ability to model multistate variables and capture component dependencies in complex systems, and the opportunity they present for probability updating based on new observations.
A Bayesian network is a directed acyclic graph comprised of a set of nodes, which represent the model variables, and a set of directed edges, which represent the conditional probabilities between the variables (Bensi et al., 2013). These directed edges represent a causal relationship between the parent variables, which are the nodes with outgoing edges, and the child variables, which are the nodes with incoming edges. It is possible for any given node in the network to have multiple parent variables as well as multiple child variables. Every node within the network contains a finite set of mutually exclusive states. The conditional probabilities of each child variable given its parent variables is required to fully define the network. For child variables possessing a single parent variable, only one conditional probability expression is needed, while child variables with more than one parent variables each require the definition of a conditional probability table (CPT) to be fully characterized. For root variables, or nodes with no parent variables, marginal probabilities are required to be fully characterized.
If a Bayesian network is defined over a set of n nodes U = {X1, X2, … , Xn}, in which Xi is a variable with a finite set of states, the probability of occurrence of Xi, or P(Xi), is computed using the joint probability table P(U) = P (X1, X2, … Xn). The Bayesian network defined over U represents the joint distribution given by the product of the conditional probabilities (Bensi et al., 2013):
where pa (Xi) is the parent set of node Xi. To minimize the subjectivity of the proposed Bayesian network model, parameter learning over an assembled empirical dataset is performed to compute each node’s conditional probability distribution for the ultimate determination of the causal relationships between all parent-child variable pairs in the proposed network.
Given the lack of existing models together with facility-level complexities of petrochemical facilities and varied root causes of failures, this paper emphasizes the assemblage of a first of its kind empirical database of hurricane hazard-induced petrochemical facility shutdowns and their idle time and restart durations. Furthermore, this database includes accompanying excess CO emissions quantities reported due to each observed shutdown event. In addition to enabling statistical empirical model development, this database also provides prospective opportunities for alternative resilience and consequence modeling approach validation. The empirical data collection conducted herein is limited to the 25 petrochemical facilities located within the U.S. Gulf Coast region (Bernhardt, 2022). Due to data availability and reliability constraints, this database limits its consideration to hurricane events that have impacted the U.S. Gulf Coast region over the past 20 years and is comprised of 81 observations. Collected, derived, and organized features include petrochemical facility characteristics, hurricane hazard intensity measures, facility open/closure status, idle time and restart period durations, and excess CO emissions volumes where applicable. Table 1 presents the complete set of collected database features and their accompanying high-level descriptions, while the following subsections present detailed variable descriptions and an explanation of collection and derivation methodologies adopted.
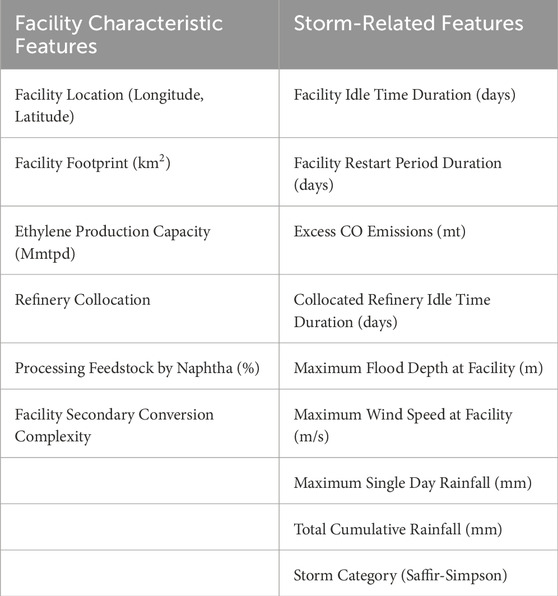
Table 1. Gulf Coast petrochemical complex downtime consequences database of facility and storm characteristics variable descriptions.
The first data collection task in the development of this proposed database is the assemblage of Gulf Coast hurricane hazard-induced petrochemical facility failures, idle time durations, and restart period durations. This database derives estimates for facility idle times and restart period durations from reports of petrochemical facility shutdown and restart activities by various chemicals news sources such as Independent Commodity Intelligence Services and S&P Global Commodity Insights (Independent Commodity Intelligence Services, 2024; Global Commodity Insights, 2024) and Texas Commission on Environmental Quality (TCEQ) air emission event reports (Texas Commission on Environmental Quality TCEQ, 2023) for the 25 facilities under study over the past 20 years. The onset of idle time is presumed to begin at the start of the earliest reported closure date determined using either news reports, company press releases, or the closure date identified in the TCEQ air emission event report for a given hurricane event, where applicable. Petrochemical complex restart transitions denote the end of a given facility’s period of post-hurricane event idle time and the start of that facility’s restart activity period. Idle time duration is computed as the total number of days a given facility is completely offline prior to facility restart activity commencement. The end of a given facility’s restart activity period is marked by either news reports, company press releases, or TCEQ air emission event reports noting normal operating levels have been reached post-event. Restart activity period duration is similarly calculated as the total number of days a given facility is restarting prior to resuming normal operations. Due to the scarcity of data related to observed product output levels during a facility’s restart activity period as the facility ramps back up to normal operating levels, both the idle time and restart activity period are assumed to be intervals of negligible product output by the petrochemical complex. The authors acknowledge that further research into this highly uncertain period is warranted and should be included in any future investigation in this space. Moreover, this database does not include occurrences of facilities operating at a reduced rate following restart and resumption of normal operating product output levels following the end of the restart period is assumed.
Of the 25 petrochemical complexes included in this study, nine facilities are collocated with petroleum refineries, as determined using a global refinery infrastructure dataset published on the Natural Hazards Engineering Research Infrastructure (NHERI) DesignSafe Cyberinfrastructure (Rathje et al., 2017; Capshaw and Padgett, 2022). It is highly likely that these collocated facilities share some degree of overlap in various utility, workforce, and logistical domains. For example, following Hurricane Katrina in 2005, both the Shell Norco chemical plant and collocated refinery sustained significant damage, but the company announced its decision to prioritize restarting the refinery at the expense of the chemical plant’s potential restart expeditiousness (Shell Media Line, 2005). As such, consideration of the extent of damage sustained by a given petrochemical facility’s collocated refinery during a hurricane event is expected to be meaningful in the determination petrochemical facility idle times and restart period durations. Collocated refinery idle time, which is indicative of the degree of damage sustained by a facility due to hurricane-induced hazards following a storm event, is therefore additionally included in the dataset defined herein for the petrochemical facilities under study where applicable. This database derives estimates for the total refinery idle time duration from refinery shutdown and restart reports by news sources such as Reuters and Rigzone (RIGZONE, 2024; Staff, 2024) and post-storm event Department of Energy Emergency Situation Reports (Office of Cybersecurity and Energy Security & ER CESER, 2022) for the collocated refineries of their respective petrochemical complexes under study. Idle time initiation is presumed to occur at the start of the first reported shutdown date determined using either company press releases or public media reports, or the initial date noted in the corresponding Emergency Situation Report for a given hurricane event, where applicable. Facility restart announcements mark the end of a given refinery’s duration of post-hurricane idle time, and downtime duration is similarly computed as the total number of days the facility is completely offline prior to restart activity commencement.
The next data collection task in the assemblage of this database is the computation of total excess CO emissions quantities reported due to each observed facility shutdown event. Under Title 30 Texas Administrative Code (TAC) Rule 101.201, Texas petrochemical facilities are required to report all scheduled maintenance, startup, and shutdown activity-related emission events via the State of Texas Environmental Electronic Report System (STEERS) to the TCEQ (Texas Commission on Environmental Quality TCEQ, 2023; Texas Secretary of State, 2014). These reports include information on sources, types, descriptions, and quantities of air contaminants released as excess emissions during a reportable event (Texas Commission on Environmental Quality TCEQ, 2023). To calculate the total excess CO emissions quantities for each petrochemical facility over the total duration of facility idle time and restart activity period for each hurricane event, all listed CO quantities are summed over each applicable air emission event report during the total combined downtime duration for a given failure observation.
Facility footprints and facility locations, in terms of Longitudes and Latitudes, for the Gulf Coast petrochemical complexes under study are determined using Geographic Information System (GIS) processing tools over aerial imagery of the region in addition to U.S. ethylene cracker inventory polypoint shapefiles from the EIA (U.S. Energy Information Administration EIA, 2023).
Hurricane-induced demand metrics considered for each petrochemical facility and historical storm event include reported Saffir-Simpson Hurricane Wind Scale category (National Weather Service, 2023), maximum total facility area flood depths, maximum 10-min averaged wind velocities, maximum single-day rainfall totals, and cumulative rainfall totals over the duration of the hurricane event. For each hurricane event considered, facility flood depths and wind velocities for Louisiana petrochemical complexes are derived using validated SWAN + ADCIRC-generated hurricane hindcast model outputs gathered from the Coastal Emergency Risks Assessment (CERA) database (CERA, 2022). Facility flood depths and wind velocities for Texas petrochemical complexes are derived using model outputs published on DesignSafe (Rathje et al., 2017) by Dr. Clint Dawson of the Computational Hydraulics Group at UT Austin (Dawson, 2023; Dawson CN. The Computational Hydraulics Group Institute for Computational Engineering and Sciences, 2022). GIS shapefiles of maximum flood depths and maximum wind velocities from both sources are derived following post-processing techniques for regional surge visualization (González-Dueñas and Padgett, 2022a) using SWAN + ADCIRC outputs on DesignSafe (Rathje et al., 2017; González-Dueñas and Padgett, 2022b). These generated shapefiles are then geoprocessed over the petrochemical facility areas of the impacted complexes to determine maximum facility flood depth and maximum wind velocity experienced at each location and hurricane event combination under study.
Daily and cumulative rainfall totals experienced at each petrochemical complex under study are computed using data from the National Oceanic and Atmospheric Administration (NOAA) Climate Prediction Center (CPC) Unified Precipitation Project gauge-based analysis of daily precipitation database (Chen and Xie, 2008; Xie et al., 2007; Chen et al., 2008). Dates bounding duration windows for each hurricane event under study are identified using the National Hurricane Center’s Tropical Cyclone Reports (National Hurricane Center, 2022). The maximum daily rainfall total is calculated using the NOAA CPC Unified Precipitation Project daily precipitation database (Chen and Xie, 2008) investigated over each hurricane event duration window at each affected petrochemical facility, and the cumulative rainfall value is calculated by totaling daily rainfalls over the entire hurricane event duration window for each affected facility during each hurricane under study.
In addition to the abovementioned set of hurricane hazard-related predictors, several site-specific petrochemical complex characteristics of each facility under study are included in the proposed database. For each facility under study, the total ethylene production capacity is determined using the corresponding record in the Oil & Gas Watch Database (Oil and Gas Watch, 2023). Additionally, the percentage of listed facility processing capacity typically based on a naphtha feedstock mixture for each petrochemical complex under study is included in the assembled database, and is identified using the 2015 International Survey of Ethylene from Steam Crackers (Koottungal, 2015). Most ethylene producing facilities in the U.S. are capable of handling natural gas-based feedstock streams, such as ethane and propane, however some facilities are also able to process a more diversified portfolio of feedstocks which include a typical petroleum refining byproduct mixture known as naphtha (Alshammari et al., 2016). This additional feedstock handling capability of a given petrochemical facility would likely increase its post-hurricane hazard-induced disruption resiliency and some approximate measure of it therefore warrants inclusion in the proposed database.
Previously developed idle time prediction models for regional Gulf Coast refinery hurricane hazard-induced disruptions (Capshaw and Padgett, 2023) included a refinery’s Nelson Complex Index, a tool typically used to compare the sophistication and secondary conversion capabilities of various refineries and computed suing processing unit capacities and industry-assigned complexity coefficients (Kaiser, 2017), as a predictor variable. However, as no analogous index for ethylene-producing petrochemical complexes exists in the literature, this paper proposes a novel process count-based method for characterizing petrochemical facility complexity. For each unique feedstock stream conversion process a given petrochemical facility is capable of, it receives one point. The complexity total is computed as a simple summation of all process points for a given petrochemical facility. Unique feedstock stream conversion processes for a given petrochemical facility are determined based on back propagation of the most likely chemical process (Chiyoda Corporation, 2023) for each output produced by the facility, as noted on publicly available facility fact sheets generated by facility stakeholders (LyondellBasell, 2023). Unlike refinery NCI computations however, as neither individual processing unit capacities for a given petrochemical complex are publicly available nor exhaustive summation of all possible chemical processes practicable, neither scaling of each counted unique conversion process nor normalization of the simple process summation is feasible. Still, the proposed index here allows a first-time exploration between petrochemical facility complexity and potential for and duration of shutdown or restart following a hurricane event.
The first objective of this study is the development of a model for predicting the likelihood and expected duration of hurricane hazard-induced petrochemical facility shutdowns. Such models are lacking in the literature and yet are essential for risk and resilience modeling not only of petrochemical processing infrastructure, but also the downstream manufacturing markets that depend on these products. Disaster resilience of both an individual petrochemical facility and the regional petrochemical processing infrastructure is herein described by the total recovery time required for the restoration of system functionality to the normal operating levels of the pre-disaster system (Cimellaro et al., 2010). Following a disaster event, the resilience of a given individual petrochemical complex is expressed as the total duration of a shutdown, or the summation of both the period of time during which a petrochemical facility is idled and the period of time during which the facility is performing restart activities prior to the resumption of normal, pre-disaster event operations. This subsection describes the proposed predictive model for the likelihood of shutdown and expected idle time duration of petrochemical facilities under hurricane hazards.
In the interest of model transparency and parsimony, the modeling approach adopted herein is a two-component hurdle model consisting of a binary classification component that predicts whether a facility will experience a shutdown, and a generalized linear model component that predicts the duration of the idle time if a shutdown is predicted to occur. This approach is adopted due to the preponderance of null observations in the assembled historical dataset and the assumption that a regional Gulf Coast petrochemical facility hurricane hazard-induced idle time database might behave similarly when fitted to a complementary idle time prediction model previously developed for regional Gulf Coast refinery hurricane hazard-induced disruptions (Capshaw and Padgett, 2023). Each tested model utilizes the same set of eight predictor variables for model fitting, shown in Table 2, with a k-fold cross-validation scheme of k = 4 employed during the model development process.
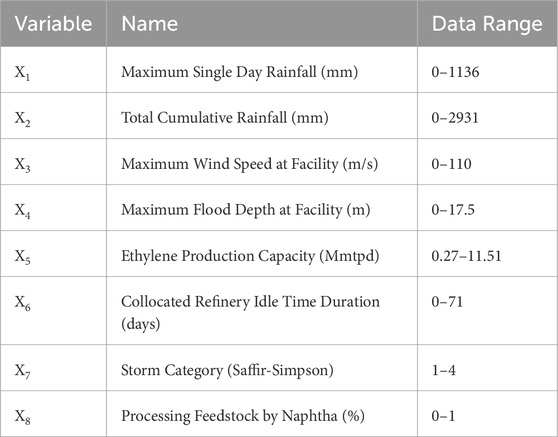
Table 2. Final idle time model predictor variables.
The binary classification component of each model tested is a logistic regression model, in which the probability of the occurrence of petrochemical facility shutdown zi is modeled by Equation 2:
where Xi is the vector of predictors for the ith observation and ξ is a vector of predictor coefficients estimated using the maximum likelihood method. For the non-zero idle time duration prediction component of the investigated hurdle model approach, zero-truncated Poisson, negative binomial, and gamma distributions are each adopted and compared. Given zi = 1, the Poisson regression model for idle time duration yi determination is defined by Equation 3:
where the scalar α and the vector β are again both inferred using the maximum likelihood method. Similarly, the negative binomial regression model for idle time duration determination given zi = 1 is defined by Equation 4:
with the additional reciprocal dispersion parameter φ estimated using the maximum likelihood method. Finally, the gamma regression model for idle time duration determination given zi = 1 is defined by Equation 5:
The R2 value, Akaike information criterion (AIC), root-mean-square deviation (RMSD), and mean absolute deviation (MAD) were used to measure the performance of each investigated model (Hodson, 2022; Khair et al., 2017). These benchmarks were computed for each of the k = 4 cross-validation folds and averaged to demonstrate overall model performance. The results of the goodness-of-fit testing showed that the hurdle model approach with the logistic regression binary classification component and the gamma distribution generalized linear model idle time duration determination component had the best performance. This model had the lowest AIC, RMSD, and MAD, and the highest R2 value, as shown in Table 3. While there is manifestly capacity for improvement in model accuracy, this model is the first of its kind and reflects a complex phenomenon associated with physical damage, human decision-making, resource availability, among other factors. Despite data scarcity constraints and the lack of physics-based component-level fragility models for petrochemical systems in the literature, the model developed in this study provides a good basis for continued investigation into the resilience of this under-studied yet vital piece of domestic petrochemical processing infrastructure. To facilitate transferability and reuse of this developed model, the full set of model parameters are made available in Supplementary Appendix A1.
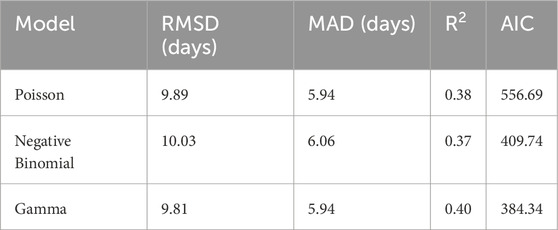
Table 3. Testing data goodness-of-fit results comparison for developed and tested idle time prediction models.
The next objective of this study is the development of a sufficient predictive model for petrochemical facility restart activity period duration following a shutdown due to hurricane hazards. Such models are lacking in the literature for both petroleum refineries as well as petrochemical complexes and yet are crucial for providing a complete characterization of facility risk and resilience following a hurricane event. There currently exists no further characterization of a facility’s restart period in the literature beyond a uniform distribution approach over an estimated range based on estimated minimums and maximums from historical instances of downtime. As previously defined, the resilience of a given individual petrochemical complex following a disaster event is expressed as the summation of both the period of time during which a petrochemical facility is idled and the period of time during which the facility is performing restart activities prior to the resumption of normal, pre-disaster event operations. This subsection describes the proposed predictive model for the expected restart activity period duration of petrochemical facilities under hurricane hazards, given a shutdown has occurred.
With prioritization of model transparency and parsimony guiding modelling approach selection decisions, multiple regression models fitted to subsets of the assembled facility and storm characteristic variables are explored. Various parameter subsets are systematically assembled and their variable coefficients are inferred using maximum likelihood estimation with a k-fold cross-validation scheme of k = 4 employed during the model development process. The optimum petrochemical facility restart activity period duration prediction model with the greatest predictive accuracy, having R2 = 0.49, and minimized number of variables is a multiple linear regression model with a final set of predictor variables shown in Table 4. Although this developed model similarly demonstrates potential for improvement in accuracy, it also stands as a pioneering effort in capturing the intricate dynamics of physical damage, human actions, and resource limitations in post-disruption petrochemical facility recovery despite data limitations. Due to the scarcity of petrochemical output data and uncertainty associated with processing outputs as a restarting facility ramps back up to normal operating levels, the restart activity period is herein assumed to be a period of negligible product output. The authors acknowledge this source of uncertainty warrants further investigation and incorporation in future work. To facilitate transferability and reuse of this developed model, the full set of model parameters are made available in Supplementary Appendix A1.
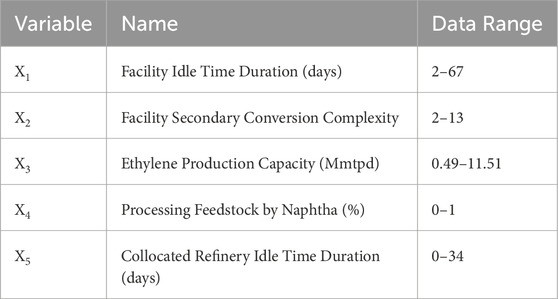
Table 4. Final restart time model predictor variables.
The final objective in the development of the proposed framework is the construction of the overarching Bayesian network leveraged for excess emissions predictive modeling. An overview of the proposed Bayesian network structure of the culminating framework developed herein is shown in Figure 2. This excess emissions prediction framework utilizes and extends the risk and resilience insights gleaned from the previously developed models for hurricane hazard-induced petrochemical complex expected idle time and restart activity period duration determination to present a more holistic assessment of risk by capturing losses beyond the economic cost of facility non-productive time, such as environmental and fenceline community health consequences.
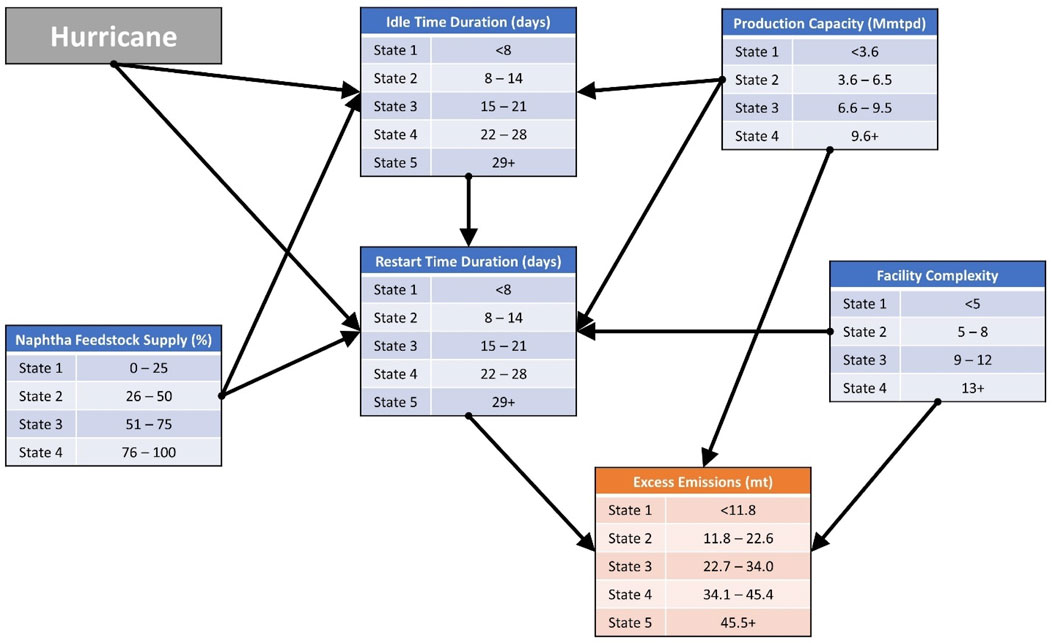
Figure 2. Bayesian network for excess emissions prediction framework overview.
The structure of the proposed Bayesian network (U) is inferred for the final set (n = 7) of included nodes based on the variable characteristics of the developed idle and restart time predictive models as well as preliminary exploration of the assembled dataset. For example, the results of the developed predictive models indicate that as facility complexity is not expected to factor into idle time duration determination, it is not likely to be an appropriate parent variable for idle time in the proposed Bayesian network model either. Additionally, no meaningful correlation is found between the duration of idle time and reported excess emissions quantities, however restart activity period duration is found to influence expected emissions quantities based on the behavior of the assembled database.
Each node (Xi) in the proposed Bayesian network model is represented as a multi-state discretization of the corresponding variable from the developed database. Due to data scarcity-related constraints, variables are not modeled as continuous in the proposed Bayesian network model-based excess emissions prediction framework. Parameter learning is further accomplished by Bayesian estimation, in which model priors for idle time and restart activity period durations are determined based on their proposed respective predictive models, and the model priors for excess emissions are determined based on the reported excess emissions due to normal operations. The window for the characterization of normal petrochemical facility processes is a 2-year span of uneventful (i.e., no hurricane activity having impacted the region) operations. This normal operations data is collected for a range of facility complexity and capacity types to generate a broadly representative cross section for sufficient model prior characterization. Conditional probability tables for each parent-child node set, P (Xi|pa (Xi)), are then learned by Bayesian estimation leveraging Jupyter Notebooks with associate Python packages through the DesignSafe Jupyter Hub (Rathje et al., 2017) and utilizing the proposed model priors and the collected dataset of historical excess emissions due to hurricane hazard-induced petrochemical facility disruption observations to fully characterize the joint distribution P(U) of the proposed Bayesian network as described by Equation 1.
Leveraging Bayesian networks in the development of this framework allows for unique modeling approach opportunities and greater flexibility in model implementation applications. The first potential application opportunity for this framework is in a fully Bayesian implementation. For a given petrochemical complex exposed to a given hurricane event, this approach provides a full estimation of expected idle time duration state probabilities, restart activity period duration state probabilities, and excess CO emissions state probabilities, as demonstrated in Figure 3. Another potential application for this framework is the implementation of a nested model approach. For example, for a given petrochemical complex exposed to a given hurricane event, this approach would include application of the idle time duration predictive model to estimate expected idle time as a continuous variable, and application of the restart activity period duration predictive model to estimate expected restart duration as a continuous variable. With these estimates for idle time and restart time, the Bayesian network model can then be implemented to estimate the expected excess CO emissions state probabilities, as shown in Figure 4. Finally, this framework can additionally be implemented in a real-time application using Bayesian updating to estimate expected excess CO emissions state probabilities as new observations, such as a known idle time duration following a hurricane hazard-induced facility disruption, become available, thereby reducing the uncertainty in the Bayesian network consequence model outputs, as demonstrated in Figure 5. Similar applications of Bayesian network approaches for near real-time predictive modeling have been adopted previously in the assessment of various civil infrastructure systems (Bensi et al., 2013; González-Dueñas and Padgett, 2021; Schultz and Smith, 2016; Khakzad and Van Gelder, 2018; Ebad Sichani and Padgett, 2021).
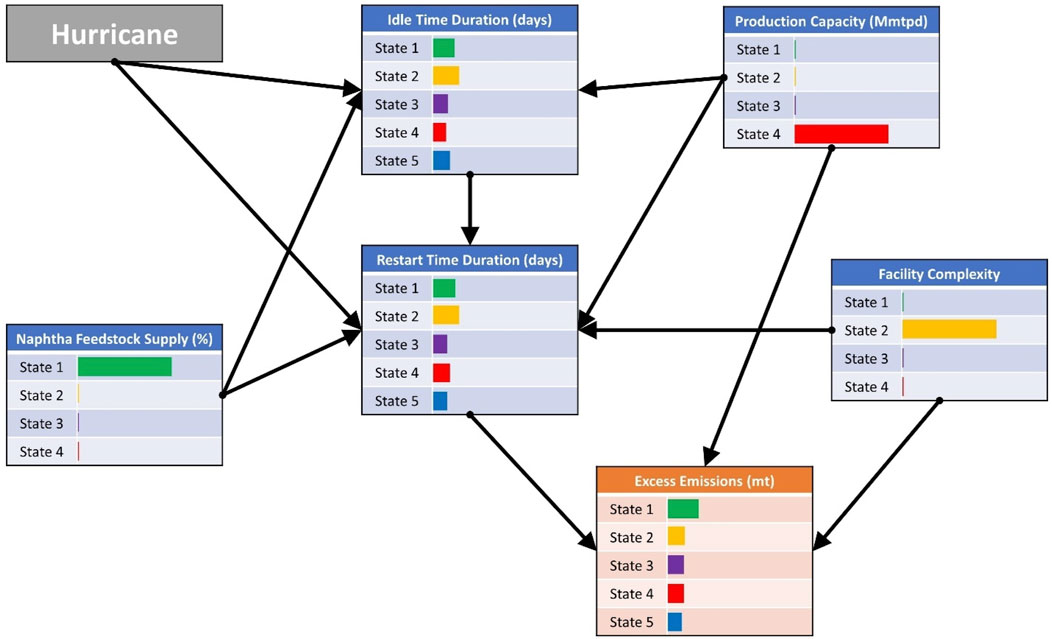
Figure 3. Example of fully Bayesian framework implementation.
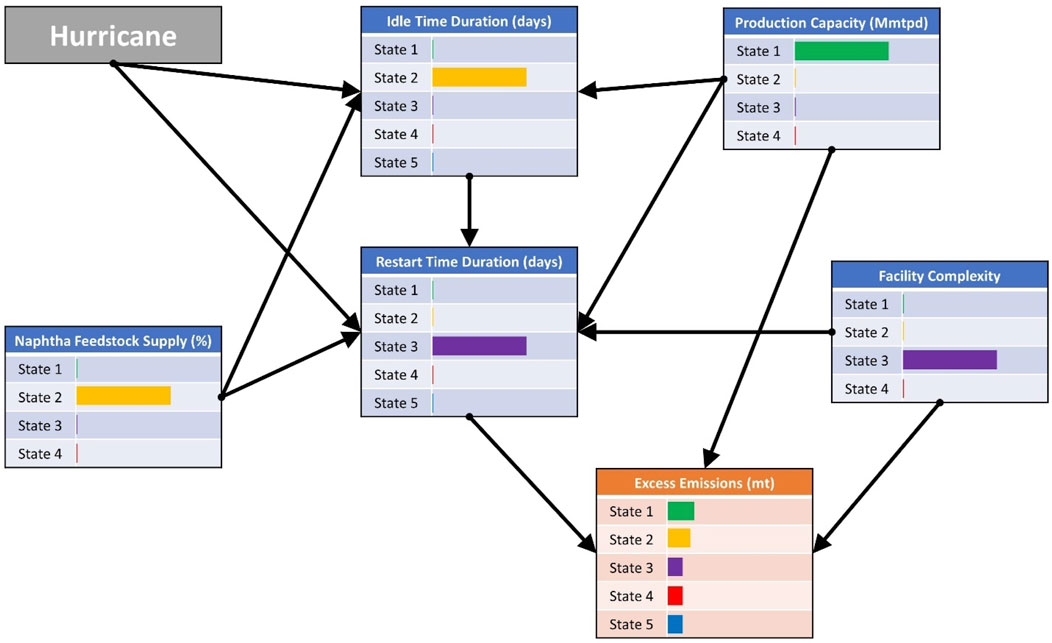
Figure 4. Example of nested model framework implementation.
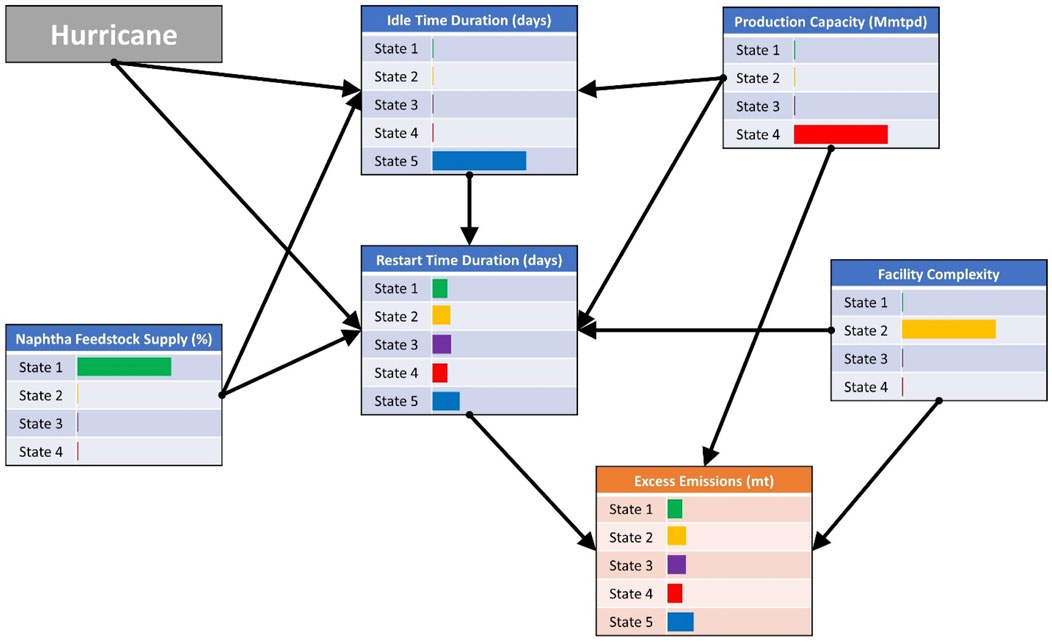
Figure 5. Example of real-time updating with known idle time duration framework implementation (from Figure 3 scenario).
A case study considering two hurricane events impacting the Houston Ship Channel (HSC) and the surrounding region with and without a coastal protection solution (inclusive of the proposed Galveston Bay Park Plan (GBPP) (Severe Storm Prediction Education & Evacuation from Disasters Center, 2015; US Army Corps of Engineers - Galveston District, 2021) mitigation strategy) in place is next conducted to gain insight regarding the regional risk and resilience implications of the mitigated petrochemical complex downtime predictions and their cascading consequences on expected excess CO emissions. Home to a number of major ethylene production complexes, the HSC represents a highly concentrated industrial corridor which serves as an integral part of the U.S. Gulf Coast petrochemical industry. The processing activities of the ethylene production infrastructure belonging to this Gulf Coast region are regularly disrupted due to hurricane events (Khakzad and Van Gelder, 2018).
The proposed GBPP is a multi-functional system of flood and surge protection infrastructure being designed in collaboration with the Coastal Spine and offers multiple lines of defense (Severe Storm Prediction Education & Evacuation from Disasters Center, 2015). The Coastal Spine is the large-scale coastal storm risk management and ecosystem restoration project designed by the U.S. Army Corps of Engineers to provide Texas coastal communities with diverse defense strategies against coastal hazards which recently secured full Congressional construction funding (US Army Corps of Engineers - Galveston District, 2021; Zuvanich, 2023). The proposed complementary mid-bay GBPP project is currently being prepared for environmental permitting by conducting a socio-economic and environmental impact analysis to ensure equitable distribution of protection benefits to all affected coastal communities (Severe Storm Prediction Education & Evacuation from Disasters Center, 2015).
The selected storm for use in this case study is FEMA Storm 36, a synthetic hurricane event belonging to the suite of storms designed for the performance of FEMA’s U.S. Gulf Coast region comprehensive flood insurance investigation (FEMA, 2013). This synthetic hurricane corresponds approximately to a 0.2% annual-chance storm event in the HSC, which approximates the local surge conditions experienced during a Category 4 hurricane. The physics-based numerical SWAN + ADCIRC model was used to develop this synthetic storm, and it was validated using several historical hurricane events (FEMA, 2013). There are six major ethylene producing facilities considered to be at risk of disruption due to the hurricane hazards induced by this case study hurricane which also lie within the envelope of coastline impacted by the hydraulic influence of the proposed Coastal Spine and GBPP mitigation strategies (Severe Storm Prediction Education & Evacuation from Disasters Center, 2015). The SWAN + ADCIRC runs for the baseline and mitigated scenarios were independently performed at different stages of the GBPP study, accounting for variations in the granularity of surge output data. However, as no petrochemical facilities or related sites of interest lie within any regions containing missing data points, the outcome and conclusions of this study are unaffected.
Case study values for maximum total facility area flood depth and maximum wind velocity for each affected facility are calculated from the FEMA Storm 36 SWAN + ADCIRC model outputs (Dawson, 2021) shared across the NHERI DesignSafe Cyberinfrastructure (Rathje et al., 2017). However, this synthetic storm development modeling approach did not include derivation of expected rainfall-related metrics. Due to this lack of correlated rainfall data for this storm of interest, the case study analysis is performed for both a light rainfall-type hurricane event (Storm A) and a heavy rainfall-type hurricane event (Storm B) to demonstrate the range of potential implications. Values for maximum single-day and total cumulative rainfall at each considered facility under the two different rainfall type events are estimated based on historical storms Hurricane Laura (2020) and Hurricane Harvey (2017), which were both Category 4 hurricane events each displaying distinct rainfall characteristics (National Hurricane Center, 2022).
The area impacted by these case study storms represents a total ethylene producing capacity of approximately 34 thousand metric tons per day (Mmtpd), which accounts for over 38% of the total ethylene producing capacity of the Gulf Coast region. For the purposes of regional resilience modeling, all ethylene-producing petrochemical complexes outside of the affected area are assumed to be experiencing normal operating levels for each modeled scenario. Case study risk and resilience metrics are computed and visualized using Python analysis packages in Jupyter Notebooks created through the NHERI DesignSafe Cyberinfrastructure (Rathje et al., 2017) Jupyter Hub. The geographic distribution of petrochemical complex total expected downtime durations, collocated refinery expected idle time durations, and surge extent and elevation across the region are shown for all modeled storm event and mitigation scenarios in Figure 6. The associated regional petrochemical resilience curves for each modeled storm event and mitigation scenario are shown in Figure 7, for which regional petrochemical resilience is defined as percentage of regional ethylene production capacity online over time. Finally, the geographic distribution of petrochemical complex expected excess CO emissions released due to storm-induced facility disruptions and surge extent and elevation across the region are shown for all modeled storm event and mitigation scenario combinations in Figure 8.
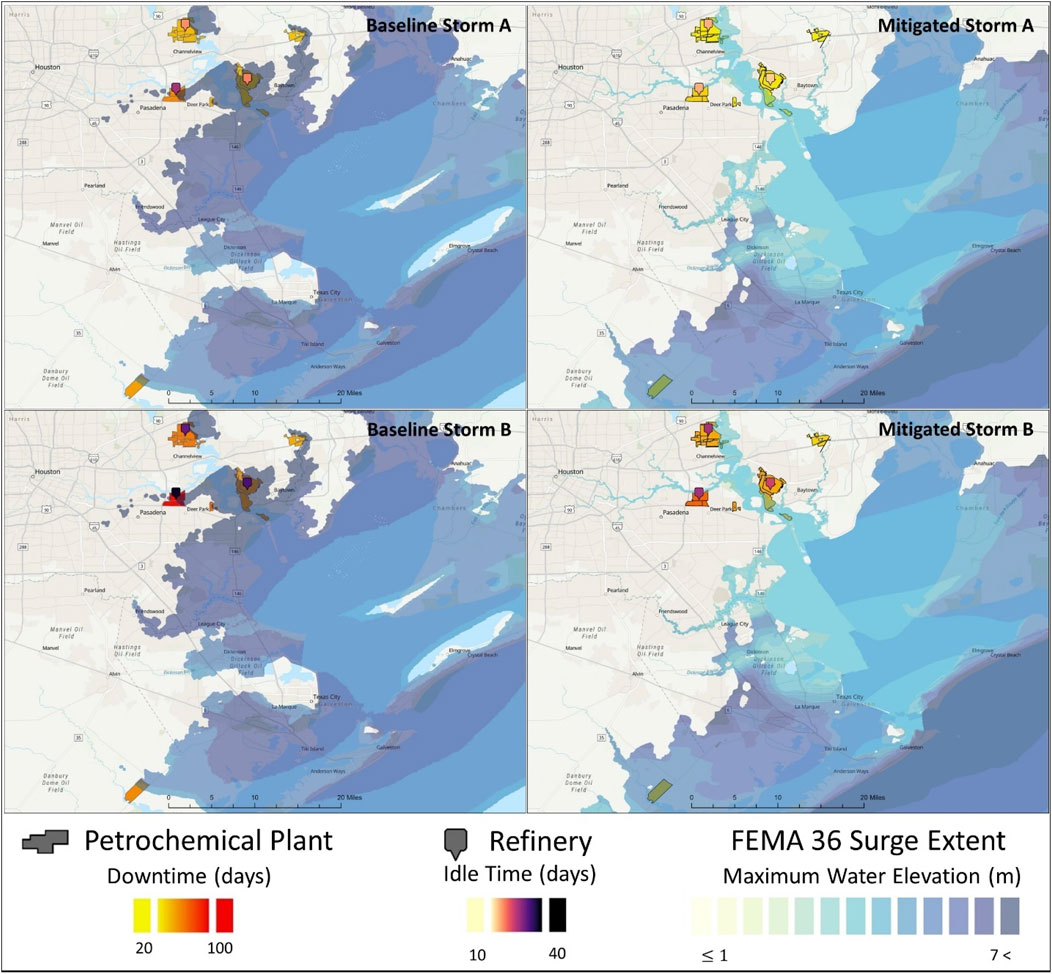
Figure 6. Petrochemical complex downtimes, collocated refinery idle times, and maximum surge levels across impacted region for each modeled storm event and mitigation scenario combination.
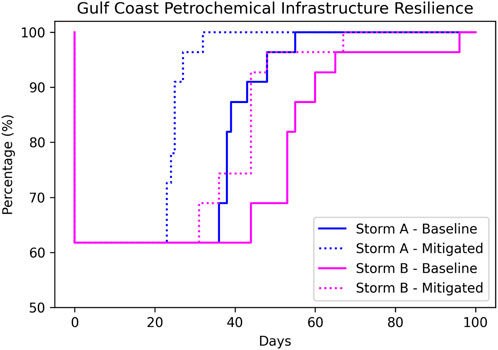
Figure 7. Resilience curves for percentage of Gulf Coast regional ethylene production capacity online over time for each modeled storm event and mitigation scenario combination.
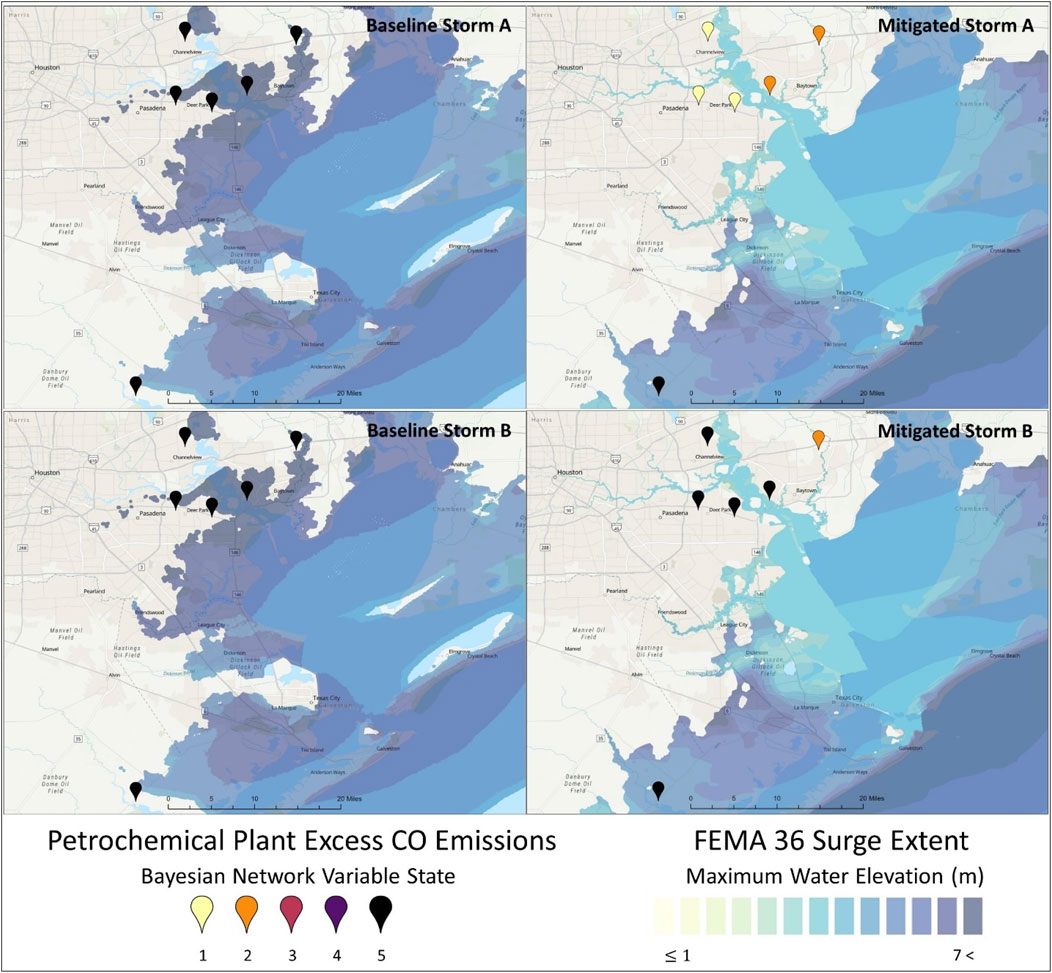
Figure 8. Petrochemical complex excess CO emissions and maximum surge levels across impacted region for each modeled storm event and mitigation scenario combination.
As shown in Figure 7, due to the severity of the synthetic FEMA Storm 36 under any considered rainfall scenario and the limited geographic area considered in this case study, all facilities are predicted to experience shutdown under each modeled storm and mitigation combination. Therefore, the robustness of the regional petrochemical infrastructure under all modeled scenarios is constant. However, the projected regional petrochemical infrastructure recovery is expected to vary significantly under different modeled storm and mitigation combinations. The surge-induced flood hazard mitigation introduced by the coastal protection solution contributes to a complex’s ability to initiate restart activities following shutdown more quickly and therefore results in improved regional petrochemical infrastructure resilience, as compared to the unmitigated scenarios.
To quantify the mitigative potential of the proposed coastal protection solution for HSC petrochemical infrastructure, regionally-averaged expected petrochemical complex total hurricane hazard-induced facility downtime risk reduction is computed and explored. Percentage of risk reduction is herein calculated as the difference in the regional average of total petrochemical facility downtime for the mitigated and unmitigated scenarios normalized by the unmitigated baseline scenario. Under the light rainfall-type hurricane event, Storm A, the risk reduction offered by the proposed Coastal Spine and GBPP mitigation projects is approximately 41%. Due to the relatively low threat of rainfall-induced flooding at the facilities of interest created by this event, the surge-induced flood hazard component is of greater importance and a primary driver of risk. As a result, the significant surge-induced flood mitigation potential of the proposed coastal protection solution leads to a dramatic reduction in petrochemical facility downtime risk. Under the heavy rainfall-type hurricane event, Storm B, however, the risk reduction offered by the proposed coastal protection solution drops to approximately 29%. This is due largely to the threat of rainfall-induced flooding at the facilities of interest under this event, which is not a hazard type the proposed mitigation projects are likely to combat as effectively as surge-induced flooding.
Similarly, the combined mitigative impact of the GBPP and Coastal Spine projects is expected to have a particularly pronounced effect on the expected excess CO emissions risk under the light rainfall-type storm event. Likely due to the significant expected idle time durations of collocated refineries for certain petrochemical facilities, the restart activity periods of the impacted petrochemical complexes are estimated to be extensive under both the unmitigated Storm A scenario as well as both the mitigated and unmitigated Storm B scenarios. As a result, the excess CO emissions quantities estimated for both the baseline light rainfall-type event Storm A as well as the baseline heavy rainfall-type event Storm B are considerable, and the surge mitigation introduced by the proposed coastal protection solution has limited impact on expected excess CO emissions reduction under the heavy rainfall-type storm event. However, the case study results suggest that the implementation of the proposed coastal protection solution is likely to reduce the expected excess CO emissions risk under the light rainfall-type event Storm A significantly, as shown in Figure 8.
The results from this case study generally demonstrate the capacity for the proposed framework to model both the individual petrochemical facility-level risk and resilience when subjected to hurricane hazards as well as the broader regional-scale petrochemical infrastructure hurricane risk and resilience, in addition to its capacity to capture cascading environmental and fenceline community health consequences by estimating excess criteria air pollutant emissions released as a result of hurricane hazard-induced petrochemical facility disruptions. Furthermore, this case study demonstrates the expected mitigative impacts of the proposed GBPP and Coastal Spine projects on regional risk to petrochemical infrastructure and the surrounding communities due to hurricane-induced hazards.
This study identifies and addresses limitations in current data, modeling tools, and methods for assessing the uncertain impacts of coastal hurricanes on petrochemical processing complexes and the widespread and cascading consequences of facility failures. Recognizing their crucial role in community resilience and risk assessment, the study tackles the need for models that predict both hurricane hazard-induced petrochemical infrastructure downtime as well as cascading consequences. It proposes practical methods for framework development and demonstrates an approach for using the proposed framework to gain new insights into regional petrochemical risk and resilience, including how disruptions affect surrounding communities. A flexibly implementable framework for the prediction of petrochemical complex excess emissions due to hurricane-induced facility failure is proposed leveraging Bayesian networks and generalized and multiple regression. Additionally, a method of predicting U.S. Gulf Coast petrochemical complex idle time due to hurricane-induced hazards is proposed using a hurdle model approach comprised of a logistic regression binary classification component and a gamma distribution generalized linear model idle time duration determination component with a vector of loss-influencing predictor variables. To provide a more comprehensive understanding of petrochemical complex hurricane risk and resilience, a method of predicting facility restart activity period duration following hurricane hazard-induced shutdown is additionally proposed using multiple linear regression with a vector of predictor variables.
The proposed framework is fitted using approximately 80 historical observations from hurricanes impacting petrochemical processing complexes along the U.S. Gulf Coast over a 20-year period. The proposed framework is applied to several case study events of hurricanes impacting the HSC to evaluate the resilience enhancement and risk reduction effects of various proposed mitigation strategies. This paper highlights the widespread and interconnected effects that hurricane-induced failures of crucial facilities can have on local communities and product markets. In future applications, this framework could be potentially integrated with models of other infrastructure systems, as well as social and economic systems, to better understand their interdependencies. As an example, this petrochemical infrastructure-specific framework might be used as one element of a larger regional hurricane risk and resilience framework, integrated with corresponding models for other critical infrastructure systems, such as power, pipelines, ports, roads, and railways, to examine how these systems interact and recover from hurricane-induced disruptions.
Further advantages of the Bayesian network modeling approach employed in the development of this framework include the opportunity for, and ease of, future model updating as new data becomes available. As new hurricane hazard-induced petrochemical facility disruption observations are gathered, the existing conditional probability tables between the current parent and child nodes in the Bayesian network become the model priors, and Bayesian inference can be implemented to easily retrain the model with the new dataset. This exercise will result in updated conditional probability tables throughout the network to reflect the uncertainty reduction enabled by a larger training dataset for the framework.
In future work, the methodology for the development of this framework might be applied to other types of emissions or infrastructure. For example, following hurricane hazard-induced facility disruptions, oil and gas processing complexes regularly report excess emissions of other types of criteria air pollutants, including sulfur dioxide (SO2) and particulate matter, which can also pose serious acute community health and environmental threats (Xa et al., 2017; Sexton et al., 2007). The developed database might be expanded to include other types of emissions, and model retraining might be undertaken to adapt the framework for prediction of these additional emissions of interest. Furthermore, this methodology might be applied to other types of oil and gas processing infrastructure. Future research in this space might be conducted to develop a corresponding cascading consequence modeling framework for other types of natural gas processing infrastructure as well as crude refining facilities.
While the proposed framework and its application in risk and resilience assessment fill important gaps in current knowledge, some limitations offer opportunities for future development. For example, the incorporation of additional data for model training and validation as it becomes available will be crucial to model performance improvement. This might allow the framework to be confidently applied beyond the regionally specific case of the U.S. Gulf Coast. Additionally, enriching the idle time and restart period duration prediction models by combining elements such as expert opinion, organizational failure models (Robert Taylor, 2020), and individual petrochemical processing facility component failure models (Esouilem et al., 2020) could offer a valuable complement to the purely empirical approach presented herein. This might improve not only model accuracy but also pave the way for modeling recovery from disaster events beyond hurricanes, such as seismic or extreme temperature events.
Further investigation through sensitivity analyses could also provide deeper insights into the influence of different predictor variables within the framework and the relative importance of downtime uncertainty compared to other factors in comprehensive risk-based resilience assessments. Finally, consideration of partial facility shutdowns should be included in future work. Hurricane hazards may occasionally result in facilities operating at a reduced capacity rather than full shutdown of production, which can still significantly impact output and consequently regional risk and recovery. Accounting for these more nuanced scenarios will improve the accuracy and usefulness of the framework.
The original contributions presented in the study are included in the article/Supplementary Material, further inquiries can be directed to the corresponding author.
KC: Conceptualization, Data curation, Formal Analysis, Investigation, Methodology, Resources, Validation, Visualization, Writing–original draft, Writing–review and editing. JP: Conceptualization, Funding acquisition, Supervision, Writing–review and editing.
The author(s) declare that financial support was received for the research, authorship, and/or publication of this article. The authors gratefully acknowledge the financial support of this research by the Center of Excellence for Resilience of Industrial & Energy Infrastructure (CERISE) at Rice University; the Severe Storm Prediction, Education, and Evacuation from Disasters (SSPEED) Center Galveston Bay Park Plan (GBPP) project; and the National Science Foundation (NSF) Boosting Research Ideas for Transformative and Equitable Advances in Engineering (BRITE) program under award CMMI-2227467.
The authors also gratefully acknowledge the resources of the National Hazards Engineering Research Infrastructure (NHERI) DesignSafe Cyberinfrastructure CMMI-2022469.
The authors declare that the research was conducted in the absence of any commercial or financial relationships that could be construed as a potential conflict of interest.
All claims expressed in this article are solely those of the authors and do not necessarily represent those of their affiliated organizations, or those of the publisher, the editors and the reviewers. Any product that may be evaluated in this article, or claim that may be made by its manufacturer, is not guaranteed or endorsed by the publisher.
The Supplementary Material for this article can be found online at: https://www.frontiersin.org/articles/10.3389/fbuil.2025.1418492/full#supplementary-material
AFPM Communications (2017). Ethylene: the “world’s most important chemical.”. AFPM. Available at: https://www.afpm.org/newsroom/blog/ethylene-worlds-most-important-chemical (Accessed September 6, 2017).
Alshammari, A., Kalevaru, V. N., Bagabas, A., and Martin, A. (2016). Production of ethylene and its commercial importance in the global market, 82, 115. doi:10.4018/978-1-4666-9975-5.ch004
Banzhaf, S., Ma, L., and Timmins, C. (2019). Environmental justice: the economics of race, place, and pollution. J. Econ. Perspect. 33 (1), 185–208. doi:10.1257/jep.33.1.185
Bensi, M., Der, K. A., and Straub, D. (2013). Efficient Bayesian network modeling of systems. Reliab Eng. Syst. Saf. 112, 200–213. doi:10.1016/j.ress.2012.11.017
Bernhardt, C. (2022). Plastics industry boom brings flood of new ethylene “cracker” plants, despite frequent environmental violations. Oil Gas Watch. Available at: https://news.oilandgaswatch.org/post/plastics-boom-brings-flood-of-new-ethylene-cracker-chemical-plants-despite-frequent-environmental-violations (Accessed on February 6, 2024).
Bernier, C., Elliott, J. R., Padgett, J. E., Kellerman, F., and Bedient, P. B. (2017). Evolution of social vulnerability and risks of chemical spills during storm surge along the Houston Ship Channel. Nat. Hazards Rev. 18 (4). doi:10.1061/(asce)nh.1527-6996.0000252
Bernier, C., and Padgett, J. E. (2017). Effects of combined surge, wave, and wind loads on the buckling of aboveground storage tanks. Am. Conf. Wind Eng. ACWE.
Bhandari, S., Casillas, G., Aly, N. A., Zhu, R., Newman, G., Wright, F. A., et al. (2022). Spatial and temporal analysis of impacts of hurricane florence on criteria air pollutants and air toxics in eastern North Carolina. Int. J. Environ. Res. Public Health 19 (3), 1757. doi:10.3390/ijerph19031757
Bi, S., Kiaghadi, A., Schulze, B. C., Bernier, C., Bedient, P. B., Padgett, J. E., et al. (2021). Simulation of potential formation of atmospheric pollution from aboveground storage tank leakage after severe storms. Atmos. Environ. 248, 118225. doi:10.1016/j.atmosenv.2021.118225
Bielicki, J. M., Middleton, R. S., Levine, J. S., and Stauffer, P. (2014). An alternative pathway for stimulating regional deployment of carbon dioxide capture and storage. Energy Procedia 63 (January 2015), 7215–7224. doi:10.1016/j.egypro.2014.11.757
Burleson, D. W., Rifai, H. S., Proft, J., Dawson, C. N., and Bedient, P. B. (2015). Vulnerability of an industrial corridor in Texas to storm surge. Nat. Hazards 77, 1183–1203. doi:10.1007/s11069-015-1652-7
Capshaw, K., and Padgett, J. (2022). Global refinery infrastructure and petroleum trade data. doi:10.17603/DS2-GTYB-A835
Capshaw, K. M., and Padgett, J. E. (2023). Development and application of a predictive model for estimating refinery shutdown duration and resilience impacts due to hurricane hazards. ASCE-ASME J. Risk Uncertain. Eng. Syst. Part B Mech. Eng. 9. doi:10.1115/1.4062681
Cassiday, L. (2018). Lessons learned from hurricane Harvey. ACOS. Available at: https://www.aocs.org/stay-informed/inform-magazine/featured-articles/lessons-learned-from-hurricane-harvey-march-2018?SSO=True#:∼:text=Morethan50%25oftotal,butthreeportswerereopened. (Accessed March 2018).
CERA (2022). Coastal emergency risks assessment (CERA). Storm surge - wave - compound flood guidance. Available at: https://cera.coastalrisk.live/ (Accessed on February 6, 2024)
Chen, M., Shi, W., Xie, P., Silva, V. B. S., Kousky, V. E., Wayne Higgins, R., et al. (2008). Assessing objective techniques for gauge-based analyses of global daily precipitation. J. Geophys Res. Atmos. 113 (4), 1–13. doi:10.1029/2007JD009132
Chen, M., and Xie, P. (2008). “CPC unified gauge-based analysis of global daily precipiation,” in Western pacific geophysics meeting. Available at: https://climatedataguide.ucar.edu/climate-data/cpc-unified-gauge-based-analysis-global-daily-precipitation (Accessed on February 6, 2024).
Chiyoda Corporation (2023). Petrochemical/chemical. Available at: https://www.chiyodacorp.com/en/ (Accessed on February 6, 2024).
Cimellaro, G. P., Reinhorn, A. M., and Bruneau, M. (2010). Framework for analytical quantification of disaster resilience. Eng. Struct. 32 (11), 3639–3649. doi:10.1016/j.engstruct.2010.08.008
Cimellaro, G. P., Villa, O., and Kim, H. U. (2013). Resilience-based design of natural gas pipelines. World Environ. 4 (3), 345–354.
Collins, M. B., Munoz, I., and Jaja, J. (2016). Linking “toxic outliers” to environmental justice communities. Environ. Res. Lett. 11 (1), 015004. doi:10.1088/1748-9326/11/1/015004
Dahitaleghani, N. (2016). Analysis of disruptions in the Gulf of Mexico oil and gas industry supply chain and related economic impacts. Louisiana State University. doi:10.31390/gradschool_dissertations.3967
Dawson, C. N. (2023). Simulation data of storm surge and waves for historical hurricanes in the Gulf of Mexico. doi:10.17603/Ds2-Nqxf-3g65
Dawson CN. The Computational Hydraulics Group Institute for Computational Engineering and Sciences (2022). Computational hydraulics Group. University of Texas at Austin. Available at: https://chg.oden.utexas.edu/ (Accessed on February 6, 2024).
DiChristopher, T. (2017). Harvey threatens to choke off supply of critical chemicals, plastics to US manufacturers. CNBC. Available at: https://www.cnbc.com/2017/08/29/harvey-threatens-to-choke-off-chemical-supplies-to-us-manufacturers.html (Accessed August 29, 2017).
Dismukes, D. E., and Narra, S. (2018). Sea-level rise and coastal inundation: a case study of the Gulf Coast Energy infrastructure. Nat. Resour. 09 (04), 150–174. doi:10.4236/nr.2018.94010
Dong, J., Asif, Z., Shi, Y., Zhu, Y., and Chen, Z. (2022). Climate change impacts on coastal and offshore petroleum infrastructure and the associated oil spill risk: a review. J. Mar. Sci. Eng. 10 (7), 849. doi:10.3390/jmse10070849
Ebad Sichani, M., Anarde, K., Capshaw, K., Padgett, J. E., Meidl, R. A., Hassanzadeh, P., et al. (2020). Hurricane risk assessment of petroleum infrastructure in a changing climate. Front. Built Environ. 6 (July), 1–19. doi:10.3389/fbuil.2020.00104
Ebad Sichani, M., and Padgett, J. E. (2021). Performance assessment of oil supply chain infrastructure subjected to hurricanes. J. Infrastruct. Syst. 27 (4), 1–17. doi:10.1061/(asce)is.1943-555x.0000637
Eiermann, J. (2022). Ethane to outpace growth in all other U.S. Petroleum product consumption through 2023. Available at: https://www.eia.gov/todayinenergy/detail.php?id=51938 (Accessed on February 6, 2024).
Esouilem, M., Bouzid, A. H., and Nadeau, S. (2020). Frequency failure causes analysis of pressure vessel and piping equipment: case study of the alberta petrochemical industry. ASCE-ASME J. Risk Uncertain. Eng. Syst. Part B Mech. Eng. 6 (4), 1–7. doi:10.1115/1.4047009
Fraser, C. (2020). Refineries, chemical plants release over 4 millions pounds of pollution as a result of Hurricane Laura. Environ. Am. Available at: https://environmentamerica.org/texas/articles/refineries-chemical-plants-release-over-4-millions-pounds-of-pollution-as-a-result-of-hurricane-laura/(Accessed August 26, 2020).
Global Commodity Insights (2024). Petrochemicals. Available at: https://www.spglobal.com/commodityinsights/en (Accessed on February 6, 2024).
Goldman, G. T., Desikan, A., Morse, R., Kalman, C., MacKinney, T., Cohan, D. S., et al. (2022). Assessment of air pollution impacts and monitoring data limitations of a spring 2019 chemical facility fire. Environ. Justice 15 (6), 362–372. doi:10.1089/env.2021.0030
González-Dueñas, C., and Padgett, J. E. (2021). Performance-based coastal engineering framework. Front. Built Environ. 7 (June), 1–24. doi:10.3389/fbuil.2021.690715
González-Dueñas, C., and Padgett, J. E. (2022a). Visualizing surge for regional risks. DesignSafe-CI. doi:10.17603/ds2-3zdj-493
González-Dueñas, C., and Padgett, J. E. (2022b). Leveraging DesignSafe for disaster debris modeling: workflow for coupled human-built-natural systems. NHERI DesignSafe-CI Media. Publ. Available at: https://www.youtube.com/watch?v=aQAsfrZppdA&t=1736s (Accessed on February 6, 2024).
Hodson, T. O. (2022). Root-mean-square error (RMSE) or mean absolute error (MAE): when to use them or not. Geosci. Model Dev. 15 (14), 5481–5487. doi:10.5194/gmd-15-5481-2022
Independent Commodity Intelligence Services (2024). Available at: https://www.icis.com/explore/ (Accessed on February 6, 2024).
Kaiser, M. J. (2017). A review of refinery complexity applications. Pet. Sci. 14 (1), 167–194. doi:10.1007/s12182-016-0137-y
Khair, U., Fahmi, H., Hakim, S. Al, and Rahim, R. (2017). Forecasting error calculation with mean absolute deviation and mean absolute percentage error. J. Phys. Conf. Ser. 930 (1), 012002–012006. doi:10.1088/1742-6596/930/1/012002
Khakzad, N., and Van Gelder, P. (2018). Vulnerability of industrial plants to flood-induced natechs: a Bayesian network approach. Reliab Eng. Syst. Saf. 169, 403–411. doi:10.1016/j.ress.2017.09.016
Koottungal, L. (2015). International Survey of ethylene from Steam crackers 2015. Oil Gas. J. 113 (7).
Lin, N., Emanuel, K., Oppenheimer, M., and Vanmarcke, E. (2012). Physically based assessment of hurricane surge threat under climate change. Nat. Clim. Chang. 2 (6), 462–467. doi:10.1038/nclimate1389
LyondellBasell (2023). Corpus christi complex. LyondellBasell. Available at: https://www.lyondellbasell.com/en/corpus-christi-complex/ (Accessed on February 6, 2024).
Madugula, A. C. S., Sachde, D., Hovorka, S. D., Meckel, T. A., and Benson, T. J. (2021). Estimation of CO2 emissions from petroleum refineries based on the total operable capacity for carbon capture applications. Chem. Eng. J. Adv. 8, 100162. doi:10.1016/j.ceja.2021.100162
Manisalidis, I., Stavropoulou, E., Stavropoulos, A., and Bezirtzoglou, E. (2020). Environmental and health impacts of air pollution: a review. Front. Public Heal 8 (February), 14–13. doi:10.3389/fpubh.2020.00014
Marsooli, R., Lin, N., Emanuel, K., and Feng, K. (2019). Climate change exacerbates hurricane flood hazards along US Atlantic and Gulf Coasts in spatially varying patterns. Nat. Commun. 10 (1), 3785–3789. doi:10.1038/s41467-019-11755-z
Matthews, C. M., Hufford, A., and Eaton, C. (2021). Texas freeze triggers global plastics shortage. Wall Str. J. Available at: https://www.wsj.com/articles/one-week-texas-freeze-seen-triggering-monthslong-plastics-shortage-11615973401 (Accessed March 17, 2021).
McCoy, B. J., Fischbeck, P. S., and Gerard, D. (2010). How big is big? How often is often? Characterizing Texas petroleum refining upset air emissions. Atmos. Environ. 44 (34), 4230–4239. doi:10.1016/j.atmosenv.2010.07.008
Nadeau, J. (2007). Improving the resiliency of the natural gas supply and distribution network. Monterey, CA: Naval Postgraduate School.
National Hurricane Center (2022). Tropical Cyclone reports. National Oceanic and Atmospheric Administration. Available at: https://www.nhc.noaa.gov/data/#tcr (Accessed on February 6, 2024).
National Weather Service (2023). Saffir-simpson hurricane wind scale. National Oceanic and Atmospheric Administration. Available at: https://www.weather.gov/hgx/tropical_scale#:∼:text=TheSaffir-SimpsonHurricaneWind,aredefinedasmajorhurricanes (Accessed on February 6, 2024).
Office of Cybersecurity, Energy Security and ER CESER (2022). Emergency situation reports. Department of Energy DOE. Available at: https://www.oe.netl.doe.gov/emergency_sit_rpt.aspx (Accessed on February 6, 2024).
Oil and Gas Watch (2023). Oil and gas Watch oil and gas Watch database. Available at: https://oilandgaswatch.org/ (Accessed on February 6, 2024).
Pourhejazy, P., Kwon, O. K., Chang, Y. T., and Park, H. (2017). Evaluating resiliency of supply chain network: a data envelopment analysis approach. Sustain 9 (2), 255–319. doi:10.3390/su9020255
Rathje, E. M., Dawson, C., Padgett, J. E., Pinelli, J. P., Stanzione, D., Adair, A., et al. (2017). DesignSafe: new cyberinfrastructure for natural hazards engineering. Nat. Hazards Rev. 18 (3), 6017001. doi:10.1061/(ASCE)NH.1527-6996.0000246
RIGZONE (2024). Oil and gas news. Rigzone. Available at: https://www.rigzone.com/news/ (Accessed on February 6, 2024).
Robert Taylor, J. (2020). Organizational failure analysis for industrial safety. ASCE-ASME J. Risk Uncertain. Eng. Syst. Part B Mech. Eng. 6 (1), 1–17. doi:10.1115/1.4044945
Roberty, E., and Rubin, J. (2021). Predictive analytics applications for oil and gas processing facilities. Massachusetts Institute of Technology. Available at: https://hdl.handle.net/1721.1/140083.
Rusco, F. (2014). Climate change: energy infrastructure risks and adaptation efforts. GAO-14-74. https://www.gao.gov/products/gao-14-74.
Schultz, M. T., and Smith, E. R. (2016). Assessing the resilience of coastal systems: a probabilistic approach. J. Coast Res. 32 (5), 1032–1050. doi:10.2112/JCOASTRES-D-15-00170.1
Severe Storm Prediction Education and Evacuation from Disasters Center (2015). Galveston bay Park: a vision for Houston and Galveston bay.
Sexton, K., Linder, S. H., Marko, D., Bethel, H., and Lupo, P. J. (2007). Comparative assessment of air pollution-related health risks in Houston. Environ. Health Perspect. 115 (10), 1388–1393. doi:10.1289/ehp.10043
Shao, L., and Zhang, K. (2023). A gas emission prediction model based on feature selection and improved machine learning. Processes 11 (3), 883. doi:10.3390/pr11030883
Shell Media Line (2005). Shell storm updates - hurricane Katrina. Available at: http://www.shell.us/media/us-storm-center/shell-us-storm-updates/archives.html (Accessed on February 6, 2024).
Staff, R. (2024). Factbox headlines. Reuters. Available at: https://www.reuters.com/news/archive/factbox (Accessed on February 6, 2024).
Texas Commission on Environmental Quality (TCEQ) (2023). Air emission event report database. Available at: https://www2.tceq.texas.gov/oce/eer/index.cfm?fuseaction=main.searchForm&newsearch=yes (Accessed on February 6, 2024).
Texas Secretary of State (2014). Emissions event reporting and recordkeeping requirements. Tex. Comm. Environ. Qual. (TCEQ). Available at: https://texreg.sos.state.tx.us/public/readtac%24ext.TacPage?sl=R&app=9&p_dir=&p_rloc=&p_tloc=&p_ploc=&pg=1&ti=30&ch=101&rl=201 (Accessed on February 6, 2024).
United States Environmental Protection Agency (EPA) (2023). Basic information about carbon monoxide (CO) outdoor air pollution. Natl. Ambient. Air Qual. Stand. (NAAQS). Available at: https://www.epa.gov/co-pollution/basic-information-about-carbon-monoxide-co-outdoor-air-pollution#Effects (Accessed on February 6, 2024).
US Army Corps of Engineers - Galveston District (2021). Coastal Texas protection and restoration feasibility study - final report, 1–192.
U.S. Energy Information Administration (EIA) (2023). Ethylene crackers. U.S. Energy Information Administration. Available at: https://atlas.eia.gov/datasets/ethylene-crackers/about (Accessed on February 6, 2024).
Xa, T. E., Mm, C. O., Si, I. S., On, O. N., Viron, Me, and Al, ALQU (2017). Ambient air monitoring following natural disasters and industrial accidents, 2017–2021.
Xie, P., Yatagai, A., Chen, M., Hayasaka, T., Fukushima, Y., Li, C., et al. (2007). A gauge-based analysis of daily precipitation over East Asia. J. Hydrometeorol. 8 (3), 607–626. doi:10.1175/JHM583.1
Zirogiannis, N., Hollingsworth, A. J., and Konisky, D. M. (2018). Understanding excess emissions from industrial facilities: evidence from Texas. Environ. Sci. Technol. 52 (5), 2482–2490. doi:10.1021/acs.est.7b04887
Zuvanich, A. (2023). Ike Dike work closer to starting after $550 million appropriation from Texas Legislature. Available at: https://www.houstonpublicmedia.org/articles/news/energy-environment/2023/06/22/455014/ike-dike-texas-legislature-550-million-appropriation/(Accessed June 22, 2023).
Keywords: bayesian (belief) networks, petrochemical processing, hurricane, resilience, risk
Citation: Capshaw KM and Padgett JE (2025) A data-informed cascading consequence modeling framework for hurricane-induced petrochemical facility disruptions. Front. Built Environ. 11:1418492. doi: 10.3389/fbuil.2025.1418492
Received: 16 April 2024; Accepted: 14 February 2025;
Published: 07 March 2025.
Edited by:
Jaan H. Pu, University of Bradford, United KingdomReviewed by:
Tracy Lynn Kijewski-Correa, University of Notre Dame, United StatesCopyright © 2025 Capshaw and Padgett. This is an open-access article distributed under the terms of the Creative Commons Attribution License (CC BY). The use, distribution or reproduction in other forums is permitted, provided the original author(s) and the copyright owner(s) are credited and that the original publication in this journal is cited, in accordance with accepted academic practice. No use, distribution or reproduction is permitted which does not comply with these terms.
*Correspondence: Jamie E. Padgett, amFtaWUucGFkZ2V0dEByaWNlLmVkdQ==
Disclaimer: All claims expressed in this article are solely those of the authors and do not necessarily represent those of their affiliated organizations, or those of the publisher, the editors and the reviewers. Any product that may be evaluated in this article or claim that may be made by its manufacturer is not guaranteed or endorsed by the publisher.
Research integrity at Frontiers
Learn more about the work of our research integrity team to safeguard the quality of each article we publish.