- Shanxi Vocational University of Engineering Science and Technology, Civil Engineering and Architecture, Taiyuan, China
With the growing emphasis on sustainable development in the construction industry, fiber-reinforced recycled aggregate concrete (BFRC) has attracted considerable attention due to its superior mechanical properties and environmental benefits. However, accurately predicting the compressive strength of BFRC remains a challenge because of the complex interaction between recycled aggregates and fiber reinforcement. This study introduces an innovative predictive framework that combines the XGBoost machine learning algorithm with advanced optimization algorithms, including the Seagull Optimization Algorithm (SOA), Tunicate Swarm Algorithm (TSA), and Mayfly Algorithm (MA). The unique integration of these algorithms not only improves predictive accuracy but also optimizes model performance by enhancing parameter tuning capabilities. Experimental results demonstrated that the TSA-XGBoost model achieved an exceptional R2 of 0.9847 and a minimum mean square error (MSE) of 0.255958, outperforming other models in predicting BFRC’s compressive strength. This novel predictive approach offers an efficient and accurate tool for assessing BFRC’s mechanical performance in practical applications, thus supporting its broader adoption in sustainable construction.
1 Introduction
The increasing focus on sustainability in construction has led to greater interest in fiber-reinforced recycled aggregate concrete (BFRC) for its mechanical strength and environmental benefits (Amudha et al., 2021; Wang et al., 2023; Zhang et al., 2020; Wang et al., 2024; Bhattacharyya et al., 2020). Recycled aggregates help reduce construction waste and reliance on natural resources, though cracks can negatively impact concrete’s durability and performance (Ghoneim et al., 2020; Zhang et al., 2024; Chen et al., 2014; Eady et al., 2023). The addition of fibers slows crack propagation, improving construction quality. Fiber-reinforced concrete, distinct from traditional concrete, incorporates fibers that enhance its mechanical properties (Zaid et al., 2022; Shahjalal et al., 2023). Studies by Yang et al. (2021) and Nikolenko et al. (2021) have shown that increasing fiber volume or aspect ratio can significantly boost compressive strength and elastic modulus, while uniformly distributed fibers prevent crack formation. Research on basalt fiber-reinforced concrete highlights its high tensile strength and durability (Zhou et al., 2020; Zheng et al., 2022; Khan et al., 2022), with basalt fibers enhancing compressive and flexural strengths (Elshazli et al., 2022; Li et al., 2022; Fang et al., 2018). Despite these benefits, excess fibers may alter concrete’s pore structure, reducing strength (Wu et al., 2023; Heeralal et al., 2009). Steel fibers, randomly distributed, mitigate crack growth, improving both tensile and compressive properties (Weli et al., 2020; Raza et al., 2021; Wang et al., 2021). Predicting BFRC’s compressive strength is essential for ensuring structural safety, but traditional models struggle due to the complex properties of recycled aggregates, underscoring the need for accurate predictive models.
Kang et al. (2021) explored machine learning algorithms to predict the compressive and flexural strengths of steel fiber-reinforced concrete (SFRC), showing that tree-based and boosting models, particularly XGBoost, outperformed traditional models like K-nearest neighbors and linear regression. XGBoost’s ability to handle nonlinear relationships and high-dimensional data has made it the leading method for predicting BFRC performance (El Mahdi Safhi et al., 2023). demonstrated XGBoost’s effectiveness in predicting SCC workability, while Sun et al. (2024) and Tao et al. (2024) applied optimized XGBoost models for predicting splitting tensile strength and ultimate compressive strength, respectively, achieving R2 values above 0.9. To improve predictive accuracy, recent advancements have integrated optimization algorithms, such as SOA (Sankar et al., 2022), TSA (Qiu et al., 2022), and MA (Asselman et al., 2023), which significantly enhance XGBoost’s performance by dynamically adjusting model parameters, increasing both accuracy and robustness.
In this study, three types of steel fibers (copper-coated, hooked, and wavy) were incorporated into BFRC at different volume fractions, and the effects of these fibers on the compressive strength of basalt fiber-reinforced concrete were comprehensively analyzed through mechanical tests. By integrating the XGBoost algorithm, a predictive model for BFRC compressive strength was established, providing a theoretical basis for its strength prediction. Furthermore, by incorporating optimization algorithms such as SOA, TSA, and MA, the model’s predictive accuracy was further improved, offering an effective method and support for predicting the mechanical properties of basalt fiber steel fiber-reinforced recycled aggregate concrete in practical engineering applications.
In summary, prior research has primarily focused on traditional predictive models for concrete properties or fiber-reinforced concrete, with significant advancements in machine learning applications for these materials. However, current models still face limitations, especially in terms of accuracy when dealing with complex materials such as fiber-reinforced recycled aggregate concrete. This study builds on the limitations observed in previous studies by integrating optimization algorithms with machine learning, which aims to enhance prediction accuracy and model robustness. The research presented here provides an innovative approach by combining advanced optimization techniques with established machine learning frameworks, creating a more comprehensive and accurate model for predicting the compressive strength of fiber-reinforced recycled aggregate concrete. This approach addresses the complex interactions between different material compositions and their mechanical performance, establishing a novel framework for future studies.
2 Model principles
2.1 XGBoost
XGBoost builds on the Gradient Boosting Decision Tree (GBDT) algorithm, employing decision trees, particularly Classification and Regression Trees (CART), for classification and regression (Sagi and Rokach, 2021; Mohan et al., 2024). In GBDT, sequential base CART estimators are assigned weights adjusted during training, creating a robust ensemble model. For regression, a sample’s predicted value results from the weighted sum of each leaf node’s predictions in the decision trees, as shown in Equation 1.
In the formula:
The XGBoost model uses an iterative approach, combining weak learners and controlling complexity to discover complex nonlinear statistical relationships between the target variable and the observed features. Through this iterative process, the model continuously optimizes performance during training (Che and He, 2022). The objective function of the XGBoost model, combining the predicted results, as shown in Equations 2, 3.
In the formula: M represents the total number of samples in the dataset; yi denotes the true value;
The XGBoost model enhances the additive training process by iteratively advancing. In each iteration, it trains a new model and adds it to the previous ensemble, gradually reducing the loss function. As shown in Equations 4–6.
In the formula: Q represents the number of iterations;
2.2 Optimization algorithms
2.2.1 Seagull Optimization Algorithm (SOA)
The Seagull Optimization Algorithm (SOA), introduced by Dhiman G and Kumar V, is a swarm intelligence algorithm for multi-objective optimization (Naga Sai Kalyan et al., 2022; Liu et al., 2023). Inspired by seagull migration and attack behaviors, SOA enhances global exploration and local search. It updates seagull positions in two phases: migration for wide-ranging search and attack for local optimization, incorporating spiral movements linked to the objective function. Key parameters such as population size, iteration limits (Tmax), variable bounds (ul and ub), and spiral factors (fc, u, v) are initialized, followed by the calculation of fitness values to guide the search process.
The initial position of the seagulls is given by the following Equation 7:
In the equation, ul represents the upper limit of the variable, and ub represents the lower limit.
After calculating the fitness values, the seagull population is sorted in ascending order using the sort (fitness, index) function. This process identifies the best value for each seagull and the global best (Pbest). Based on the sorting index, the positions are updated from their initial locations to new coordinates (x), and the iterative optimization process begins (Anand et al., 2024).
During migration, seagulls move toward the optimal position while avoiding collisions, ensuring they approach the global optimum. To prevent overlapping, an additional variable (A) is introduced to compute the seagulls’ new positions. As shown in Equation 8.
In the equation, f represents the current iteration number, and the parameter linearly decreases from 2 to 0.
The optimal position direction coefficient ensures
The coefficient
In the equation,
When the seagulls attack their prey, they perform spiral movements in the air. The three components x, y, and z of the spiral motion are expressed as follows Equation 11:
In the equation, θ is a random number within the range [0, 2π], expressed in radians.
Finally, the formula for the seagull’s attack behavior is given as shown in Equation 12
2.2.2 Tunicate Swarm Algorithm (TSA)
The Tunicate Swarm Algorithm (TSA) is a swarm intelligence algorithm inspired by tunicate foraging behavior in the ocean. This behavior includes jet propulsion, utilizing individual gravity, seawater flow, and interaction forces to avoid collisions while moving toward an optimal target. Swarm behavior also updates the global best position based on perceived environmental cues. Tunicates use their nervous system to sense water flow and light sources from others, collectively guiding the swarm toward food. During jet propulsion, collision avoidance is managed by calculating new positions for each individual. As shown in Equation 13.
In the formula, G represents the gravity of the tunicate individual, and M denotes the interaction force between tunicate individuals. The value of M is calculated as shown in Equation 14.
In the equation,
In the formula, “rand” is a uniformly distributed random number in the range [0, 1],
The formula for each tunicate individual moving towards the optimal individual is shown in Equation 16.
2.2.3 Mayfly Algorithm (MA)
The Mayfly Algorithm (MA) consists of three main stages: male mayfly movement, female mayfly movement, and mayfly mating and mutation. Male mayflies gather together and adjust their positions based on their own experience and the experience of their neighbors. Assuming that
In the equation,
In the equation,
Where: dd is the damping factor for the dance of the mayfly to its historically best position and to the globally best position. The Cartesian distance is calculated as shown in Equation 20:
Where:
Unlike male mayflies, female mayflies do not gather together but instead fly towards male mayflies for mating and reproduction. Suppose
Where:
Where:
Where:
The mating process of mayflies is the same as the attraction process: the fittest female mates with the fittest male, the second fittest female mates with the second fittest male, and so on, producing two offspring. As shown in Equation 24:
Where:
Where:
2.3 Cross-validation
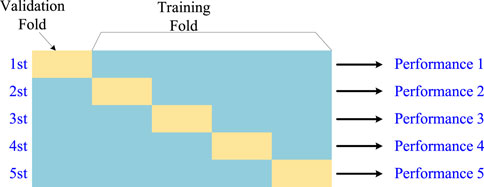
Cross-validation is a common method to assess model performance on unseen data by partitioning the dataset into several exclusive subsets, then iteratively training and testing on these. In this study, we use k-fold cross-validation (k = 5), dividing the dataset into five equal subsets. Each subset serves as a validation set once, while the remaining k-1 subsets form the training set. This cycle repeats k times, and the average performance metrics across all iterations provide a stable and reliable assessment of model performance. As shown in Figure 1.
For the i-th fold, the model uses the i-th subset as the validation set, and the remaining k-1 subsets are combined to form the training set, yielding the performance metric Mi for that fold. The overall model performance M is the average of the performance metrics from all k folds, denoted as
3 Experimental design and results analysis
3.1 Experimental materials
The experiment utilized C30 concrete mixed with P.O 42.5 cement. Crushed pebbles (5–20 mm) were used as coarse aggregate, and natural river sand (0.075–4.750 mm) served as fine aggregate, with a fineness modulus of 2.8. A polycarboxylate superplasticizer, at 1.0% of the cement weight, improved workability. Key parameters of the steel and basalt fibers are shown in Table 1, where d is the fiber diameter, l is the fiber length, and l/d is the ratio affecting concrete performance. Fiber density (ρ) was crucial for determining volume percentage, while fcu referred to tensile strength.
3.2 Experimental design
The experimental design of this study carefully considered various factors affecting the compressive strength of basalt fiber-reinforced recycled aggregate concrete (BFRC), including fiber type, volume fraction, curing age, and testing conditions. A C30 concrete mix was used, with P.O 42.5 cement, crushed pebbles (5–20 mm) as coarse aggregate, and river sand (0.075–4.75 mm) as fine aggregate. Each specimen was molded into a standard 100 mm cubic mold and cured in a controlled environment at a constant temperature of 20°C ± 2°C and relative humidity of 95% for 3, 7, 14, and 28 days. Compressive strength testing followed the “Standard for Test Methods of Mechanical Properties of Ordinary Concrete” (GB/T 50,081–2019), with each specimen tested on a hydraulic press at a loading rate of 0.5 MPa/s. Additionally, in line with the “Test Methods for Steel Fiber Reinforced Concrete” standards, variables such as curing age, fiber content, and fiber type were integrated into the design. To ensure stability and repeatability of results, a total of 40 experimental groups were set, each containing three specimens, amounting to 120 specimens in total. The concrete mix ratios are provided in Table 2, where c represents material quantities and Bs denotes the sand rate. During each test, stress-strain behavior was also monitored alongside compressive strength to provide deeper insights into the material’s ductility and toughness under load (Saud et al., 2020).
This study primarily analyzes the impact of different types and volume fractions of steel fibers on the compressive strength of basalt fiber-reinforced concrete (BFRC) at curing ages of 3, 7, 14, and 28 days. According to previous research, the optimal content of basalt fibers in BFRC is 2.6 kg/m³ (Shahjalal et al., 2023; Sharma et al., 2022; Yang et al., 2021; Nikolenko et al., 2021), which was set as a fixed value in this study. The reference group is BFRC, labeled as BF. In the specific experiments, the volume fractions of hooked-end steel fibers were set at 0.8%, 1.0%, and 1.2%, corresponding to the specimen labels SF0.8, SF1.0, and SF1.2. The volume fractions of wavy steel fibers were similarly set at 0.8%, 1.0%, and 1.2%, with the corresponding labels WF0.8, WF1.0, and WF1.2. The volume fractions of copper-coated steel fibers were consistent with the previous ones, labeled as RPC0.8, RPC1.0, and RPC1.2.
3.3 Compressive strength results analysis
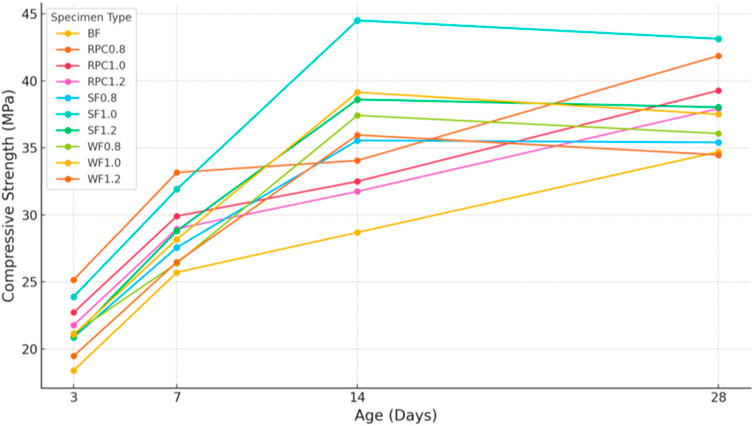
The compressive strength of cubic specimens was measured according to the “Standard for Test Methods of Mechanical Properties of Ordinary Concrete” (GB/T 50,081–2019). The relationship between different types of steel fiber volume fractions, curing age (ta), and compressive strength (fcu) is shown in Figure 2.
This study primarily investigates the effects of different types and volume fractions of steel fibers on the compressive strength of basalt fiber-reinforced concrete (BFRC) at curing ages of 3, 7, 14, and 28 days. Based on prior research, the optimal content of basalt fibers in BFRC is determined to be 2.6 kg/m³, which was thus set as a constant parameter in this study. The control group, representing BFRC without steel fibers, is labeled as BF. For the experiments, hooked-end steel fibers were added at volume fractions of 0.8%, 1.0%, and 1.2%, labeled as SF0.8, SF1.0, and SF1.2, respectively. Likewise, the volume fractions of wavy steel fibers were set at 0.8%, 1.0%, and 1.2%, with the labels WF0.8, WF1.0, and WF1.2, while copper-coated steel fibers followed the same volume fractions and were labeled as RPC0.8, RPC1.0, and RPC1.2.
As shown in Figure 2, although steel fibers are primarily intended to reinforce tensile strength, their inclusion also enhances the compressive strength of BFRC within a specific range. This effect occurs because an optimal amount of steel fibers improves the bond between the concrete matrix and fibers, effectively inhibiting crack propagation. Dispersed steel fibers within the concrete can help reduce stress concentration at crack tips and defect points, thereby enhancing compressive strength. However, when the fiber volume becomes excessive, the increased surface area of steel fibers leads to insufficient cement mortar to fully encapsulate both aggregates and fibers, resulting in compromised overall integrity and a decline in compressive strength, demonstrating an initial increase followed by a decrease (Zhao et al., 2022; Weli et al., 2020; Wang et al., 2021; Wang et al., 2022; Zhang and Liu, 2023).
The copper-coated steel fibers form a dense oxide layer, providing a good bond with the concrete and reducing susceptibility to corrosion during curing, which achieves the highest compressive strength at 28 days. In contrast, the hooked-end and wavy steel fibers, lacking corrosion resistance treatment, exhibited rust on the fiber surfaces as the curing period progressed. This rust led to volume expansion from Fe(OH)₂ and Fe(OH)₃ formation, which, in turn, weakened compressive strength, causing the 14-day compressive strength to exceed that of the 28-day mark.
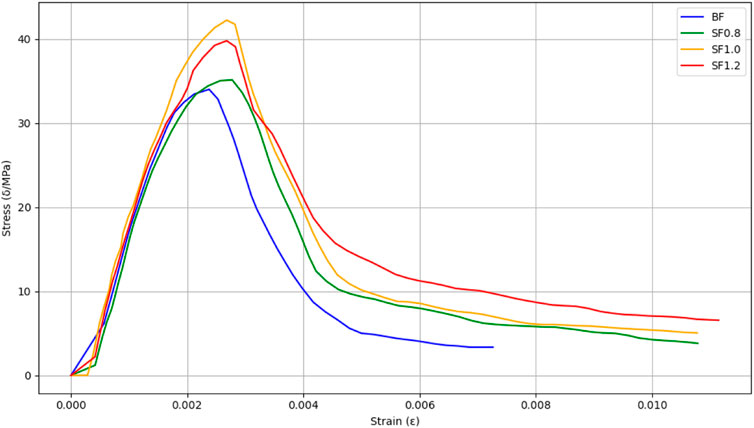
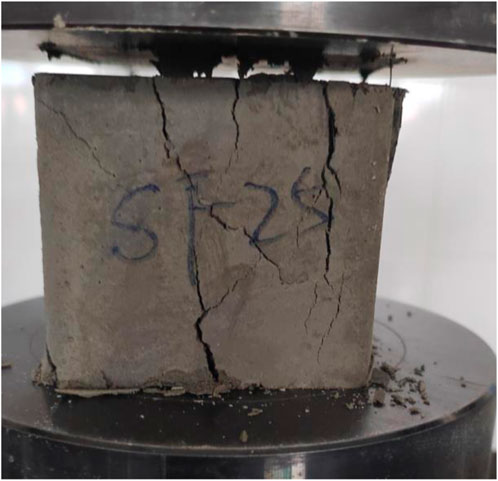
As shown in Figure 3, the concrete specimen was subjected to compression, radial cracking appeared around the specimen, while the middle portion, due to the weaker hoop effect, experienced localized lateral spalling of the concrete and the formation of fine cracks, as shown in Figure 4. Upon reaching the ultimate load, the specimen failed with a muffled sound, and through-cracks appeared. However, no fiber breakage was observed. At the location of the longitudinal cracks, the overlapping of steel fibers was clearly visible. Unlike typical BFRC, the specimen did not shatter, and its integrity was well-maintained during the failure process, exhibiting characteristics of plastic failure.
3.4 T2 spectrum analysis
Nuclear magnetic resonance (NMR) uses the CPMG pulse sequence test on fully saturated water samples to obtain decay signals from spin echoes, which are then transformed into T2 spectra using Fourier transform. The distribution of the T2 spectrum reflects the pore size. In this experiment, the MesoMR-60 NMR instrument was used to analyze the concrete structure. Figure 5 shows the T2 spectrum obtained from the nuclear magnetic resonance test.
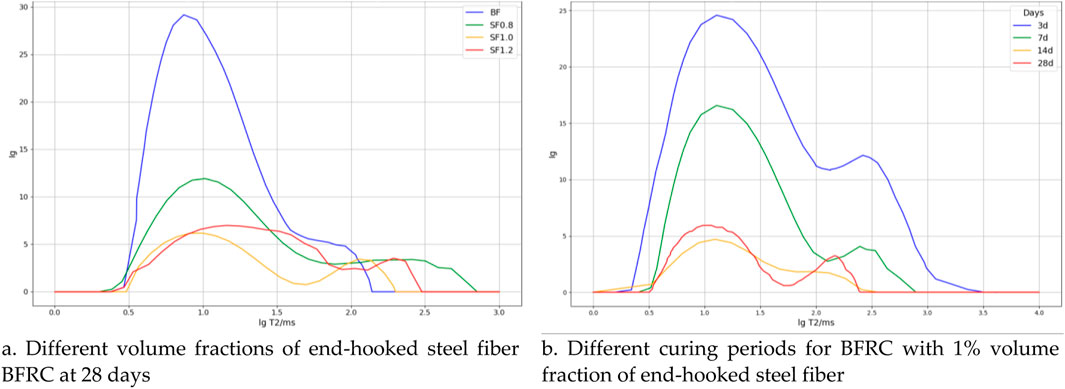
Figure 5. (A) Different volume fractions of end-hooked steel fiber BFRC at 28 days. (B) Different curing periods for BFRC with 1% volume fraction of end-hooked steel fiber. Nuclear magnetic resonance T2 spectrum.
Figure 5A shows the T2 relaxation time spectra of BFRC with different volume fractions of end-hooked steel fibers at the 28-day curing period, where Is represents signal intensity. It can be seen that the internal pore distribution of the concrete exhibits a positive correlation. As the volume fraction of steel fibers increases, the spectrum area first decreases and then increases. The SF1.0 group has the smallest spectrum area, confirming that a 1.0% volume fraction is the optimal dosage for end-hooked steel fibers. The introduction of steel fibers results in a significant narrowing of the main peak and a slight reduction in the area of the secondary peak. However, when the volume fraction of steel fibers exceeds 1.0%, the internal pores in the concrete increase, and the spectrum area expands. This may be due to excessive fiber content, leading to a larger specific surface area, which prevents full encapsulation of the fibers by the cement paste.
Figure 5B studies the changes in the internal micro-pore structure of BFRC with a 1.0% volume fraction of end-hooked steel fibers as the curing period progresses. At 3 days of curing, the spectrum presents a “three-peak” structure, while at 7, 14, and 28 days, it transitions to a “two-peak” structure, indicating that the internal pore structure and quantity evolve over time, which in turn affects the compressive strength. Since the spectrum area is proportional to the volume of fluid in the concrete, it also reflects changes in pore volume. The number of peaks corresponds to the distribution characteristics of the pore structure. At the 3-day curing period, the main peak reaches the highest value, and the spectrum area is the largest, indicating that the hydration reaction of the cement is not yet complete, leaving many unfilled pores, which leads to lower compressive strength. As the curing time extends, harmful pores (“three-peak” structure) gradually disappear, and the area of harmless pores (“two-peak” structure) decreases with time. This is due to the progressive filling of pores by cement hydration products, increasing the density and improving the compressive strength. However, during the 14- to 28-day curing period, steel fibers undergo corrosion, and the resulting iron compounds expand in volume, weakening the bond between the steel fibers and the cementitious matrix. This not only fails to prevent the expansion of micro-cracks but also interferes with the formation and filling of cement hydration products, leading to a decrease in density and an increase in pore size.
3.5 Analysis of porosity and saturation
The concept of fluid saturation was introduced to analyze the internal pore structure changes of BFRC. Bound fluid exists within the micro-pores of the concrete, and the greater the bound fluid saturation, the more micro-pores in the concrete, indicating higher compactness.
Figure 6A shows the trend of saturation (S) and porosity (θpd) of BFRC with different volume fractions of end-hooked steel fibers at the 28-day curing period. As the volume fraction of steel fibers increases, the saturation of the bound fluid in the concrete initially rises and then falls. It can be observed that the SF1.0 group exhibits the highest bound fluid saturation, with an 18.53% increase compared to the control group. Porosity is an important indicator that reflects the ratio of pore volume to the volume of the concrete matrix. The smaller the porosity, the fewer internal pores, and the more compact the structure. The SF1.0 group’s porosity is 0.242% lower than the control group.
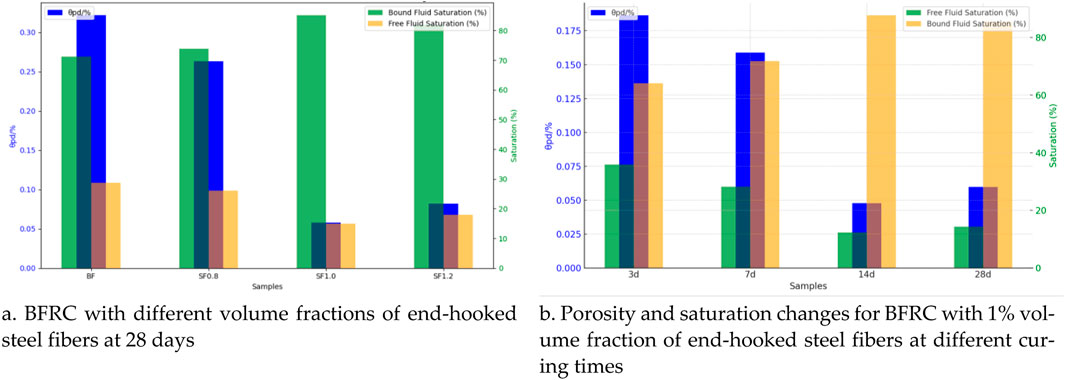
Figure 6. (A) BFRC with different volume fractions of end-hooked steel fibers at 28 days. (B) Porosity and saturation changes for BFRC with 1% volume fraction of end-hooked steel fibers at different curing times. Nuclear magnetic resonance T2 spectrum.
Figure 6B shows the changes in porosity and saturation over time for BFRC with a 1% volume fraction of end-hooked steel fibers. Similar to Figure 6A, bound fluid saturation increases first and then decreases as curing time progresses. At the 14-day curing period, due to the hydration reaction of cement filling the pores, porosity decreased by 0.121% compared to the 3-day period, while bound fluid saturation increased by 35.88%. By the 28-day curing period, rust spots had appeared on the surface of the steel fibers, leading to changes in the pore structure. Porosity slightly increased by 0.012%, and bound fluid saturation decreased by 1.61%.
3.6 Analysis of porosity and saturation
The pore distribution within the concrete can be determined through the transverse relaxation time (T2). The internal pores are classified into three types: gel pores (T2 < 1 m), capillary pores (1 m < T2 < 100 m), and non-capillary pores (T2 > 100 m). The presence of gel and capillary pores has no significant impact on the compressive strength of the concrete and is therefore referred to as harmless pores. In contrast, non-capillary pores have larger pore sizes, and the greater the number of non-capillary pores, the more they negatively impact the compressive strength of the concrete, thus being referred to as harmful pores. Figure 7 shows the pore size distribution.
From Figure 7, it can be observed that after 28 days of hydration, the proportion of harmless pores in BFRC reaches 64.6%. With the increase in steel fiber content, the proportion of harmless pores initially increases and then decreases. When the volume content of hooked-end steel fibers is 1.0%, the proportion of harmless pores reaches a maximum of 81.9%, indicating that the internal structure of the concrete is most compact at this point. However, when the steel fiber content increases to 1.2%, the proportion of harmful pores rises from 18.1% to 21.4%. This phenomenon is primarily due to the excessive amount of steel fibers, which increases the specific surface area, preventing the cement paste from fully enveloping the fibers. This is consistent with the trend observed in the bound fluid saturation, further confirming that the rusting of steel fibers impacts the internal pore structure of the concrete. As the number of harmful pores increases, the compressive strength of the concrete decreases.
4 Optimization algorithms applied to the performance prediction of fiber-reinforced recycled aggregate concrete
4.1 Data preparation
The dataset used in this study consists of 120 experimental data points, primarily aimed at predicting the compressive strength of fiber-reinforced recycled aggregate concrete (BFRC). Each data point includes multiple input feature variables, such as the type of steel fiber, fiber volume content, curing age, water-cement ratio, and sand ratio. The dataset also includes the corresponding output target variable, which is the compressive strength of the concrete.
To ensure the reliability and generalization capability of the model, we divided the 120 data points into a training set and a test set at an 8:2 ratio, yielding 96 points for training and 24 for testing. For model optimization and to avoid overfitting, we applied five-fold cross-validation to the training data. In this process, the training data was divided into five subsets, with each subset used once as a validation set while the other four subsets trained the model. This procedure fine-tuned model parameters and ensured a robust evaluation of model performance. Figure 8 shows the data distribution (Figure 8A) and a correlation heatmap (Figure 8B) illustrating the relationships among variables.
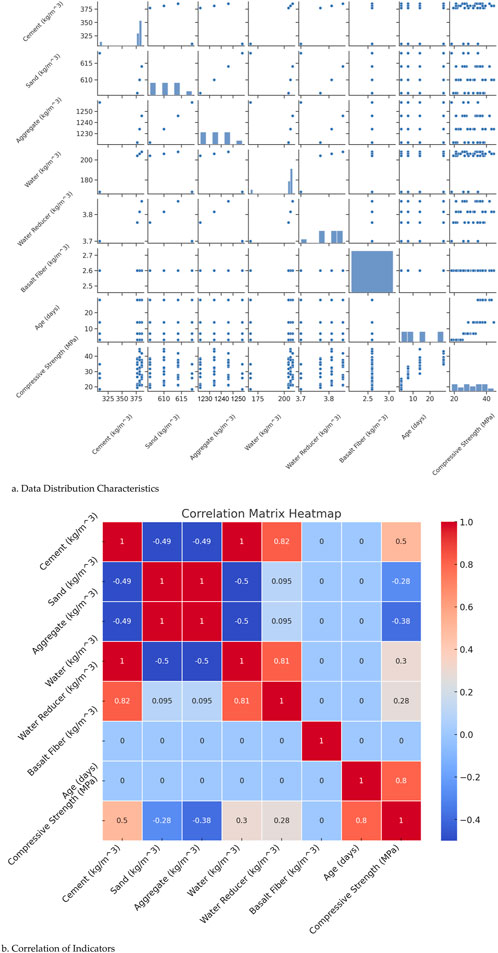
Figure 8. (A) Data Distribution Characteristics. (B) Correlation of Indicators. Dataset distribution and correlation heatmap.
The correlation analysis in Figure 8B highlights the relationships between key variables. Cement content has a strong positive correlation (0.5) with compressive strength, signifying that as cement content increases, compressive strength also improves. Water content exhibits a moderate positive correlation (0.3) with compressive strength, indicating that although water contributes to strength, its impact is less significant than that of cement. Similarly, the water-reducing agent shows a correlation of 0.28 with compressive strength, suggesting that it enhances mechanical properties by lowering the water-cement ratio. Conversely, sand and aggregate contents have negative correlations of −0.28 and −0.38, respectively, with compressive strength, suggesting that higher sand and aggregate proportions may reduce concrete strength. The highest correlation, 0.8, is observed between curing age and compressive strength, consistent with the known effect of increased strength over time.
4.2 Evaluation metrics
In the process of model evaluation, MSE (Mean Squared Error), MAE (Mean Absolute Error), MAPE (Mean Absolute Percentage Error), and R2 (Coefficient of Determination) are commonly used performance metrics (Song et al., 2021; Chen et al., 2023). MSE amplifies larger errors and is therefore sensitive to extreme values, helping to capture the model’s response to outliers. MAE, on the other hand, calculates the absolute value of the error and is not affected by the direction of the error, making it more suitable for reflecting the overall prediction accuracy of the model, especially when focusing on the overall error magnitude. Additionally, MAPE expresses the error as a percentage, making it easier to compare data across different scales, and it is suitable for datasets with varying units or magnitudes. R2 provides a relative measure, assessing the model’s explanatory power based on the linear relationship between predicted and actual values. For regression tasks, an R2 value close to one indicates strong explanatory power, while an R2 value near 0 suggests poor model performance, indicating that the model fails to capture the relationship between the data.
To ensure comprehensive model evaluation, multiple metrics are typically combined to analyze model performance holistically. For example, while both MSE and MAE can measure error, MSE emphasizes the impact of large errors, whereas MAE focuses on the average level of error. MAPE provides information about the relative size of the error, making it more comparable across different datasets. R2, on the other hand, offers an intuitive evaluation of the model’s goodness-of-fit, allowing for a quick assessment of overall performance. The calculation formulas for each metric are as shown in Equations 26–29:
4.3 Model training and parameter optimization
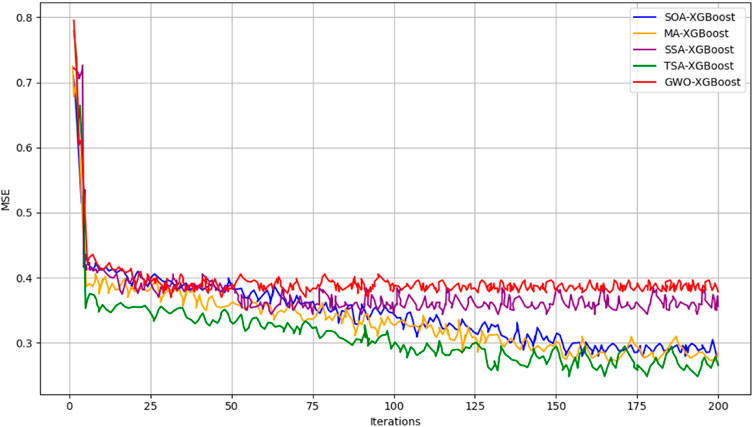
To ensure the generalization ability of the model across different datasets, this study utilized five-fold cross-validation for model training and parameter optimization. Cross-validation allows the model’s performance to be validated on various data splits, effectively reducing overfitting and enhancing the model’s robustness. Figure 9 shows the cross-validation loss functions for each optimized model.
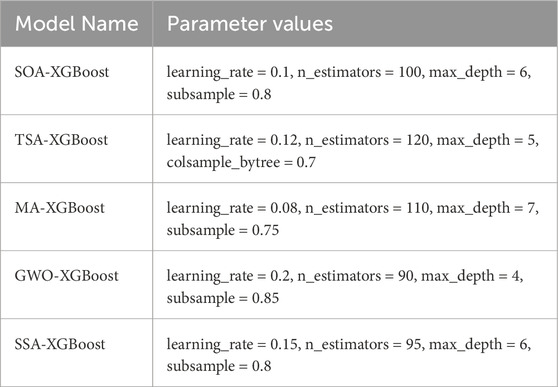
The above figure demonstrates the mean squared error (MSE) variations for five different optimization algorithms applied to the XGBoost model (SOA-XGBoost, TSA-XGBoost, MA-XGBoost, GWO-XGBoost, and SSA-XGBoost) over 200 iterations. As shown in the figure, the MSE values of the three optimized models, SOA-XGBoost, TSA-XGBoost, and MA-XGBoost, are significantly lower than those of the traditional GWO-XGBoost and SSA-XGBoost, indicating faster convergence and reduced errors. This further verifies the advantage of the new optimization algorithms in enhancing the prediction accuracy of the model. The MSE values of the traditional optimization algorithms, GWO-XGBoost and SSA-XGBoost, are initially higher and tend to stabilize over time, but their final error values remain higher than those of the newer optimization algorithms. The optimal parameter combinations for the models, based on the minimum error, are provided in Table 3.
4.4 Prediction performance comparison
4.4.1 Single model prediction performance analysis
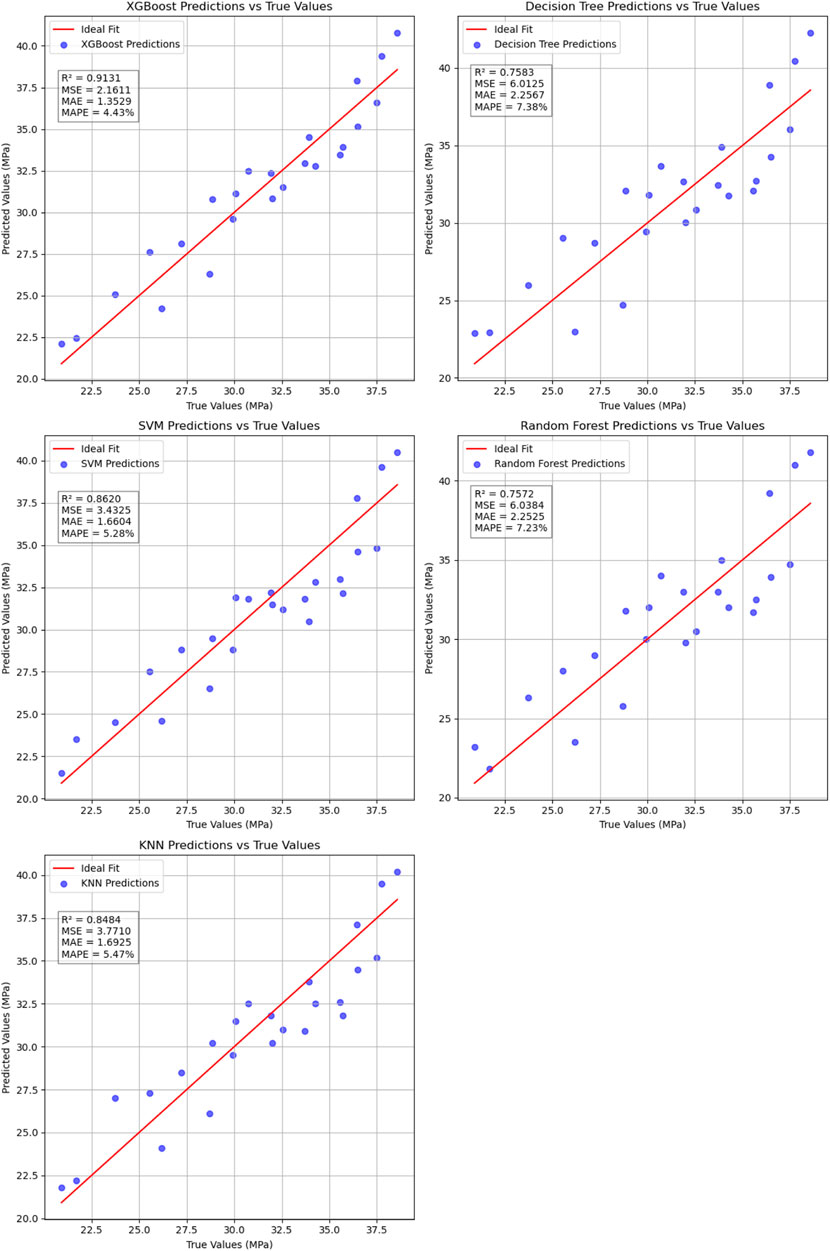
This section compares the predictive performance of the XGBoost model against Random Forest, Support Vector Machine (SVM), and Decision Tree for forecasting the compressive strength of BFRC. Key performance indicators such as MSE, MAE, MAPE, and R2 are used to assess each model’s strengths and limitations, as shown in Figure 10.
Based on the data and experimental results shown above, the XGBoost model outperforms other models in all performance metrics. Specifically, the XGBoost model achieved the best results in R2, MSE, MAE, and MAPE, with an R2 value of 0.913109, indicating a good fit. Additionally, XGBoost’s MSE is 2.161113, MAE is 1.352917, and MAPE is 4.426169, demonstrating its clear advantage in prediction accuracy. In comparison, other models, such as Decision Tree (DT) and Random Forest (RF), although providing relatively high prediction accuracy, still fall behind XGBoost in key metrics. Particularly, the Decision Tree model has an MSE of 6.012483 and an MAE of 2.256667, indicating a relatively higher prediction error. The Support Vector Machine (SVM) shows some advantage in handling nonlinear relationships, with an MAE of 1.660417, slightly higher than XGBoost. However, in terms of MSE and MAPE, it still lags behind XGBoost, revealing its limitations in overall predictive capability.
The XGBoost model, leveraging the benefits of ensemble learning and gradient boosting, effectively captures nonlinear relationships in complex data, outperforming other models across all performance metrics. This is especially evident in predicting the performance of Fiber Reinforced Recycled Aggregate Concrete, a complex task. Therefore, the XGBoost model can be considered the best choice for this type of prediction task, as it exhibits greater robustness and generalization ability.
4.4.2 Optimized Model Prediction Performance Analysis
In this section, a detailed analysis was conducted on the prediction performance of Fiber Reinforced Recycled Aggregate Concrete by combining different optimization algorithms with the XGBoost model. By comparing the prediction results of SOA-XGBoost, TSA-XGBoost, MA-XGBoost, and traditional optimization models like GWO-XGBoost and SSA-XGBoost, Figure 11 clearly demonstrates the differences in model fitting accuracy and prediction error.
The data in Figure 11 highlights notable differences in the predictive performance of various optimization models for Fiber Reinforced Recycled Aggregate Concrete. The three models enhanced by optimization algorithms—SOA-XGBoost, TSA-XGBoost, and MA-XGBoost—demonstrated excellent performance across all evaluation metrics, with R2 values of 0.9847, 0.9897, and 0.9889, respectively. These values indicate high fitting accuracy, showing that the models effectively captured the relationship between input features and target outputs. Additionally, these models exhibited low MSE and MAE values, with TSA-XGBoost achieving the best results, reaching an MSE of 0.255958 and an MAE of 0.364167.
In comparison, the traditional optimization models GWO-XGBoost and SSA-XGBoost underperformed. Although GWO-XGBoost maintained moderate fitting accuracy with an R2 of 0.9338, it had relatively high error values, with an MSE of 1.646958 and an MAE of 1.258333. SSA-XGBoost showed similar performance, with an R2 of 0.9101 and an MSE of 2.234958, reflecting inadequate prediction accuracy, especially for data points with larger errors. The MAPE values for GWO-XGBoost and SSA-XGBoost were 4.100240% and 4.809841%, respectively, further emphasizing their limitations in overall predictive performance.
Integrating SOA, TSA, and MA optimization algorithms with the XGBoost model significantly enhances prediction accuracy, especially in reducing error metrics like MSE and MAE, compared to traditional GWO and SSA models. This improvement suggests that these newer optimization algorithms offer substantial advantages for handling complex nonlinear problems, effectively capturing intricate feature relationships in high-dimensional data, and yielding more accurate and robust predictions.
5 Discussion
This study conducted an experimental and analytical evaluation of how different steel fiber types and dosages affect the compressive strength of basalt fiber-reinforced recycled aggregate concrete (BFRC). By employing the XGBoost model enhanced with SOA, TSA, and MA optimization algorithms, we achieved improved prediction accuracy, highlighting the potential of these methods for accurately forecasting BFRC performance. The results indicated that an appropriate amount of steel fiber enhances concrete’s ductility, toughness, and compressive strength. However, excessive steel fiber led to increased porosity, reducing mechanical strength, and highlighting the need for balanced fiber dosages.
The applicability of these predictive methods to broader engineering contexts is promising but requires consideration of practical constraints. For instance, although the SOA, TSA, and MA optimizations effectively boost model accuracy, their computational complexity and associated costs may limit real-world implementation in large-scale projects. Addressing these constraints involves optimizing algorithmic efficiency while retaining predictive accuracy. Additionally, expanding the model to account for varying material types and environmental factors would strengthen its adaptability across diverse engineering applications. Future work should thus focus on refining machine learning models for operational feasibility and on extending the scope of variables, potentially including other fiber types and optimizing combinations, to reinforce BFRC’s performance further. These efforts can support the wider adoption of fiber-reinforced recycled aggregate concrete in practical construction applications, ultimately advancing sustainable engineering practices.
6 Conclusion
(1) In this study, we experimentally validated the impact of different types and dosages of steel fibers on the compressive strength of BFRC. The results indicated that an appropriate dosage of steel fibers effectively improved compressive strength, with strength initially increasing and then decreasing as fiber content increased. Copper-coated steel fibers exhibited the best reinforcement effect, with compressive strength peaking at 28 days. In contrast, hooked and wavy steel fibers showed a decline in compressive strength over time due to environmental influences.
(2) As the steel fiber dosage increased, the ductility and toughness of the concrete gradually improved, while porosity initially decreased and then increased. Bound fluid saturation also showed an increase followed by a decrease. A moderate amount of steel fibers reduced harmful pores and improved the compactness of the concrete, while excessive fibers increased porosity due to a larger specific surface area, negatively impacting overall performance. With longer curing times, the internal pore structure of the concrete was optimized, and hydration reactions made the concrete more compact. However, the issue of steel fiber corrosion became evident over time, reducing the bond strength between fibers and the matrix and lowering compressive strength.
(3) The XGBoost model combined with different optimization algorithms, such as Seagull Optimization Algorithm (SOA), Tunicate Swarm Algorithm (TSA), and Mayfly Algorithm (MA), demonstrated high accuracy in predicting BFRC compressive strength, particularly the TSA-XGBoost model, which achieved an R2 of 0.9897, with MSE and MAE of 0.255958 and 0.364167, respectively, outperforming other models. These optimization algorithms significantly improved the predictive performance of XGBoost by efficiently tuning model parameters.
This study not only provides theoretical insights into predicting the compressive strength of BFRC but also demonstrates the broad application potential of machine learning algorithms in civil engineering. The XGBoost model, enhanced by optimization algorithms, delivers more accurate and stable prediction results, offering valuable references for predicting concrete performance in practical engineering.
Data availability statement
The original contributions presented in the study are included in the article/supplementary material, further inquiries can be directed to the corresponding author.
Author contributions
SD: Conceptualization, Data curation, Formal Analysis, Funding acquisition, Investigation, Methodology, Project administration, Resources, Software, Supervision, Validation, Visualization, Writing–original draft, Writing–review and editing.
Funding
The author(s) declare that no financial support was received for the research, authorship, and/or publication of this article.
Conflict of interest
The authors declare that the research was conducted in the absence of any commercial or financial relationships that could be construed as a potential conflict of interest.
Generative AI statement
The author(s) declare that no Generative AI was used in the creation of this manuscript.
Publisher’s note
All claims expressed in this article are solely those of the authors and do not necessarily represent those of their affiliated organizations, or those of the publisher, the editors and the reviewers. Any product that may be evaluated in this article, or claim that may be made by its manufacturer, is not guaranteed or endorsed by the publisher.
References
Amudha, M., Ramachandran, M., Sivaji, C., and Kamalanathan, S. (2021). A study on climate change with mayfly algorithm optimization. Recent Trends Manag. Commer. 2 (3), 23–28.
Anand, P., Sharma, B., Rizwan, M., and Saini, M. K. (2024). Size optimization of grid-tied hybrid energy system by employing forecasted meteorological data. MAPAN 39 (3), 739–750. doi:10.1007/s12647-024-00758-x
Asselman, A., Khaldi, M., and Aammou, S. (2023). Enhancing the prediction of student performance based on the machine learning XGBoost algorithm. Interact. Learn. Environ. 31 (6), 3360–3379. doi:10.1080/10494820.2021.1928235
Bhattacharyya, T., Chatterjee, B., Singh, P. K., Biswas, S., Geem, Z. W., and Sarkar, R. (2020). Mayfly in harmony: a new hybrid meta-heuristic feature selection algorithm. IEEE Access 8, 195929–195945. doi:10.1109/access.2020.3031718
Che, Y., and He, D. (2022). An enhanced seagull optimization algorithm for solving engineering optimization problems. Appl. Intell. 52 (11), 13043–13081. doi:10.1007/s10489-021-03155-y
Chen, G. M., He, Y. H., Yang, H., Chen, J. F., and Guo, Y. C. (2014). Compressive behavior of steel fiber reinforced recycled aggregate concrete after exposure to elevated temperatures. Constr. Build. Mater. 71, 1–15. doi:10.1016/j.conbuildmat.2014.08.012
Chen, J., Liu, Z., Yin, Z., Li, Y., Wang, X., Yin, L., et al. (2023). Predict the effect of meteorological factors on haze using BP neural network. Urban Clim. 51, 101630. doi:10.1016/j.uclim.2023.101630
Eady, M., Setia, G., Park, B., Mohan, R. K., and Bhandari, B. (2023). Biopolymer encapsulated silver nitrate nanoparticle substrates with surface-enhanced Raman spectroscopy (SERS) for Salmonella detection from chicken rinse. Int. J. Food Microbiol. 391, 110158. doi:10.1016/j.ijfoodmicro.2023.110158
El Mahdi Safhi, A., Dabiri, H., Soliman, A., and Nehdi, M. (2023). Prediction of self-consolidating concrete properties using XGBoost machine learning algorithm: Part 1–workability. Constr. Build. Mater. 408, 133560. doi:10.1016/j.conbuildmat.2023.133560
Elshazli, M. T., Ramirez, K., Ibrahim, A., Alkayed, H., and Kassem, M. (2022). Mechanical, durability and corrosion properties of basalt fiber concrete. Fibers 10 (2), 10. doi:10.3390/fib10020010
Fang, S. E., Hong, H. S., and Zhang, P. H. (2018). Mechanical property tests and strength formulas of basalt fiber reinforced recycled aggregate concrete. Materials 11 (10), 1851. doi:10.3390/ma11101851
Ghoneim, M., Yehia, A., Yehia, S., and Ibrahim, H. (2020). Shear strength of fiber reinforced recycled aggregate concrete. Materials 13 (18), 4183. doi:10.3390/ma13184183
Heeralal, M., Kumar, R. P., and Rao, Y. V. (2009). Flexural fatigue characteristics of steel fiber reinforced recycled aggregate concrete (SFRRAC). Ser. Archit. Civ. Eng. 7 (1), 19–33. doi:10.2298/fuace0901019h
Kang, M. C., Yoo, D. Y., Gupta, R., and Shin, J. W. (2021). Machine learning-based prediction for compressive and flexural strengths of steel fiber-reinforced concrete. Constr. Build. Mater. 266, 121117. doi:10.1016/j.conbuildmat.2020.121117
Khan, M., Cao, M., Xie, C., and Shi, C. (2022). Hybrid fiber concrete with different basalt fiber length and content. Struct. Concr. 23 (1), 346–364. doi:10.1002/suco.202000472
Li, Y., Zhang, J., He, Y., Zhang, C., Qin, J., Niu, Z., et al. (2022). A review on durability of basalt fiber reinforced concrete. Compos. Sci. Technol. 225, 109519. doi:10.1016/j.compscitech.2022.109519
Liu, G., Guo, Z., Liu, W., Zhang, X., Wu, Y., and Wang, C. (2023). MSHHOTSA: a variant of tunicate swarm algorithm combining multi-strategy mechanism and hybrid Harris optimization. PLOS ONE 18 (8), e0290117. doi:10.1371/journal.pone.0290117
Mohan, Y., Yadav, R. K., Manjul, M., and Dhiman, G. (2024). Seagull optimization algorithm for node localization in wireless sensor networks. Multimedia Tools Appl. 83, 70793–70814. doi:10.1007/s11042-024-18331-8
Naga Sai Kalyan, C. H., Goud, B. S., Reddy, C. R., Venkatraman, R., Bajaj, M., Sharma, N. K., et al. (2022). Seagull optimization algorithm–based fractional-order fuzzy controller for LFC of multi-area diverse source system with realistic constraints. Front. Energy Res. 10, 921426. doi:10.3389/fenrg.2022.921426
Nikolenko, S. D., Sazonova, S. A., Asminin, V. F., Vorontsov, P., and Tsvetkova, O. V. (2021). Flexural strength of fiber reinforced concrete structures. Online 1889 (2), 022075. doi:10.1088/1742-6596/1889/2/022075
Qiu, Y., Zhou, J., Khandelwal, M., Xu, G., and Yang, P. (2022). Performance evaluation of hybrid WOA-XGBoost, GWO-XGBoost and BO-XGBoost models to predict blast-induced ground vibration. Eng. Comput. 38 (Suppl. 5), 4145–4162. doi:10.1007/s00366-021-01393-9
Raza, S. S., Qureshi, L. A., Ali, B., Iftikhar, Y., and Khan, M. M. (2021). Effect of different fibers (steel fibers, glass fibers, and carbon fibers) on mechanical properties of reactive powder concrete. Struct. Concr. 22 (1), 334–346. doi:10.1002/suco.201900439
Sagi, O., and Rokach, L. (2021). Approximating XGBoost with an interpretable decision tree. Inf. Sci. 572, 522–542. doi:10.1016/j.ins.2021.05.055
Sankar, S., Somula, R., Parvathala, B., Puli, R. K., and Pulipati, S. (2022). SOA-EACR: seagull optimization algorithm based energy aware cluster routing protocol for wireless sensor networks in the livestock industry. Sustain. Comput. Inf. Syst. 33, 100645. doi:10.1016/j.suscom.2021.100645
Saud, S., Jamil, B., Upadhyay, Y., and Raheman, H. (2020). Performance improvement of empirical models for estimation of global solar radiation in India: a k-fold cross-validation approach. Sustain. Energy Technol. Assessments 40, 100768. doi:10.1016/j.seta.2020.100768
Shahjalal, M., Islam, K., Batool, F., Mahmud, T., Zia, A., Khan, S. U., et al. (2023). Fiber-reinforced recycled aggregate concrete with crumb rubber: a state-of-the-art review. Constr. Build. Mater. 404, 133233. doi:10.1016/j.conbuildmat.2023.133233
Sharma, A., Sharma, A., Jately, V., Goswami, A., Sharma, A. K., and Azzopardi, B. (2022). A novel TSA-PSO based hybrid algorithm for GMPP tracking under partial shading conditions. Energies 15 (9), 3164. doi:10.3390/en15093164
Song, S., Xiong, X., Wu, X., and Liu, Q. (2021). Modeling the SOFC by BP neural network algorithm. Int. J. Hydrogen Energy 46 (38), 20065–20077. doi:10.1016/j.ijhydene.2021.03.132
Sun, Z., Li, Y., Yang, Y., Zhang, Q., and Qin, L. (2024). Splitting tensile strength of basalt fiber reinforced coral aggregate concrete: optimized XGBoost models and experimental validation. Constr. Build. Mater. 416, 135133. doi:10.1016/j.conbuildmat.2024.135133
Tao, H., Ali, Z. H., Mukhtar, F., Ahmad, S., Marhoon, H. A., Goliatt, L., et al. (2024). Coupled extreme gradient boosting algorithm with artificial intelligence models for predicting compressive strength of fiber reinforced polymer-confined concrete. Eng. Appl. Artif. Intell. 134, 108674. doi:10.1016/j.engappai.2024.108674
Wang, S., Xia, P., Gong, F., Zeng, Q., Chen, K., and Zhao, Y. (2024). Multi objective optimization of recycled aggregate concrete based on explainable machine learning. J. Clean. Prod., 445: 141045, doi:10.1016/j.jclepro.2024.141045
Wang, S., Xia, P., Wang, Z., Meng, T., and Gong, F. (2023). Intelligent mix design of recycled brick aggregate concrete based on swarm intelligence. J. Build. Eng. 71: 106508, doi:10.1016/j.jobe.2023.106508
Wang, X., Fan, F., Lai, J., Peng, Z., and Cao, Z. (2021). Steel fiber reinforced concrete: a review of its material properties and usage in tunnel lining. Structures 34, 1080–1098. doi:10.1016/j.istruc.2021.07.086
Wang, X., Pan, J. S., Yang, Q., Luo, X., Li, J., and Shi, H. (2022). Modified mayfly algorithm for UAV path planning. Drones 6 (5), 134. doi:10.3390/drones6050134
Weli, S. S., Abbood, I. S., Hasan, K. F., and Alwan, H. M. (2020). Effect of steel fibers on the concrete strength grade: a review. Proc. IOP Conf. Ser. Mater. Sci. Eng. 888 (1), 012043. doi:10.1088/1757-899x/888/1/012043
Wu, H., Qin, X., Huang, X., Chen, Y., and Xu, H. (2023). Engineering, mechanical and dynamic properties of basalt fiber reinforced concrete. Materials 16 (2), 623. doi:10.3390/ma16020623
Yang, J., Chen, B., and Nuti, C. (2021). Influence of steel fiber on compressive properties of ultra-high performance fiber-reinforced concrete. Constr. Build. Mater. 302, 124104. doi:10.1016/j.conbuildmat.2021.124104
Zaid, O., Mukhtar, F. M., Rebeca, M., Hassan, H., and Mohamed, A. M. (2022). Characteristics of high-performance steel fiber reinforced recycled aggregate concrete utilizing mineral filler. Case Stud. Constr. Mater. 16, e00939. doi:10.1016/j.cscm.2022.e00939
Zhang, P., Wang, K., Wang, J., Guo, J., Hu, S., and Ling, Y. (2020). Mechanical properties and prediction of fracture parameters of geopolymer/alkali-activated mortar modified with PVA fiber and nano-SiO2. Ceram. Int. 46(12): 20027–20037. doi:10.1016/j.ceramint.2020.05.074
Zhang, X., and Liu, C. A. (2023). Model averaging prediction by K-fold cross-validation. J. Econ. 235 (1), 280–301. doi:10.1016/j.jeconom.2022.04.007
Zhang, X., Zhang, P., Yuan, W., and Hu, S. (2024). Durability prediction of geopolymer mortar reinforced with nanoparticles and PVA fiber using particle swarm optimized BP neural network. Nanotechnol. Rev. 13(1): 20230214, doi:10.1515/ntrev-2023-0214
Zhao, M., Yang, X., and Yin, X. (2022). An improved mayfly algorithm and its application. AIP Adv. 12 (10), 105101. doi:10.1063/5.0108278
Zheng, Y., Zhang, Y., Zhuo, J., Li, J., and Zhang, X. (2022). A review of the mechanical properties and durability of basalt fiber-reinforced concrete. Constr. Build. Mater. 359, 129360. doi:10.1016/j.conbuildmat.2022.129360
Keywords: fiber-reinforced recycled aggregate concrete (BFRC), steel fibers, compressive strength, XGBoost, optimization algorithms
Citation: Duan S (2024) Compressive strength prediction of fiber-reinforced recycled aggregate concrete based on optimization algorithms. Front. Built Environ. 10:1509714. doi: 10.3389/fbuil.2024.1509714
Received: 15 October 2024; Accepted: 19 November 2024;
Published: 11 December 2024.
Edited by:
Giada Gasparini, University of Bologna, ItalyCopyright © 2024 Duan. This is an open-access article distributed under the terms of the Creative Commons Attribution License (CC BY). The use, distribution or reproduction in other forums is permitted, provided the original author(s) and the copyright owner(s) are credited and that the original publication in this journal is cited, in accordance with accepted academic practice. No use, distribution or reproduction is permitted which does not comply with these terms.
*Correspondence: Suping Duan, ZHVhbnN1cGluZzUzMUAxNjMuY29t
 Suping Duan