 Nisal Deelaka Halaba Arachchige Senarathna
 Théo Dezert
 Fjóla Guðrún Sigtryggsdóttir
- 1Department of Civil and Environmental Engineering, Norwegian University of Science and Technology (NTNU), Trondheim, Norway
- 2FI-NDT, Gustave-Eiffel University, Bouguenais, France
The growing requirement imposed by dam safety regulations and guidelines necessitates the improvement and rehabilitation of rockfill embankment dams. These hydraulic structures are of great importance, and they can be subjected to overtopping flows which can significantly compromise the structural integrity. One of the defense mechanisms utilized is the placement of riprap on the downstream shoulder of the dam. This article explores eight experimental tests comprising of four different dam model configurations and investigates the possibility of Particle Image Velocimetry (PIV) techniques to explore the characteristics of the protective riprap layer, such as breach initiation, failure mechanism, and velocity pattern. The models varied from full to half dam profiles, constituted of placed or dumped riprap, with or without downstream toe support, and with or without downstream shell material. Leveraging the PIV technique, the study provides insight into the area of breach initiation within riprap protection on the downstream shoulder of rockfill embankment dams and thus breach initiation of protected rockfill dams. The study brings to light that for models with placed riprap, the initiation occurs simultaneously at the top and the bottom of the protective layer confirming the assertions made in prior studies regarding a failure mechanism marked by a sliding process. The study further confirms that for structures with toe support, the breach initiation occurs at the top of the protective layer. This analysis also revealed that in the case of dumped riprap, the precise position of the breach initiation was indeterminate. Furthermore, the analysis revealed that there is a significant drop in the velocity readings at the downstream section of the riprap layer when supported by a toe, underscoring the significance of having toe support. Another revelation from this analysis was the contrasting velocity readings with substantially higher readings for placed riprap as compared to dumped riprap reaffirming the fact that placed riprap can endure higher discharges as compared to dumped riprap. Furthermore, this investigation also detected that a graph of the velocity pattern depicting the placed riprap exhibited a higher singular peak while such a graph depicting the dumped riprap exhibited a bimodal characteristic.
1 Introduction
Embankment dams are structures constructed using locally available earth material. They can be broadly categorized into two classes i.e. earth or rockfill, based on the primary construction material. Rockfill embankment dams are structures where more than 50% of the total volume consists of dumped or compacted pervious natural stones (Chanson, 2004). Approximately 81% of total dams registered under the World Register of Dams fall under the category of embankment dams out of which rockfill dams account for 14% (ICOLD, 2023). Norway alone has 4,570 dams registered in 2022 out of which 961 are embankment dams according to the Norwegian Water Resources and Energy Directorate (NVE). Thereof 310 are earthfill dams and 651 rockfill dams. In Norway, dams are classified into four classes describing their hazard potential. Altogether 215 embankment dams are categorized as class 4 and 3 dams i.e. very high and high consequences respectively and 201 are categorized as class 2 with medium consequences.
According to a NVE report, climate change would result in extreme short-term duration rainfall events. Such events have the potential to cause urban flooding, landslides, flash flooding in small catchments, and extensive erosion. These events can result in significant impacts across social, economic, and environmental sectors (Carr et al., 2023). This can have a significant effect on dam design requirements and consequence classifications. While the overall failure rate of dams is less than 0.6% for dams built after 1951 and 0.38% for dams built after the year 2000 (ICOLD, 2019) due to advancements in research and technology, one must not forget that these structures require continuous maintenance and supervision, as well as a review of load conditions pertinent to dam safety, including assessments of potential floods. Furthermore, when looking into the ratio of the number of failed dams of a specific type to the total number of failed dams, the value for embankment dams is 70% higher than for gravity dams (ICOLD (International Commission on Large Dams), 1995).
Many studies have revealed that the most prominent mode of failure for embankment dams is through overtopping (ICOLD, 2019; ICOLD (International Commission on Large Dams), 1995; Costa, 1985; Foster et al., 2000; Xu and Zhang, 2009; Wu, 2011). Thus, it is crucial that hydraulic structures such as rockfill dams have a defense mechanism in place in the event such a loading condition occurs. Ripraps (rock armor) are one of the implemented erosion-limiting methods for hydraulic structures such as but not limited to riverbanks, spillways, culvert outlets, levees, and embankment dams in case of overtopping and leakage conditions (Abt et al., 2013; Thornton et al., 2014; Hiller et al., 2018; Najafzadeh and Oliveto, 2020). Based on the construction methodology ripraps can be predominantly broken down into two categories: placed and dumped ripraps (Hiller et al., 2018; Ravindra et al., 2020; Dezert et al., 2022a). The main differentiation in the construction philosophy is that dumped riprap consists of rocks placed randomly while placed riprap consists of rocks placed in a defined interlocking manner (Figure 1). When looking into aspects such as lead time and budgetary constraints, dumped riprap could be regarded as the most viable option. Nonetheless, the placed riprap is densely packed in comparison to the dumped riprap, giving it better structural integrity and hence able to withstand higher overtopping discharges (Hiller et al., 2018; Ravindra et al., 2020).
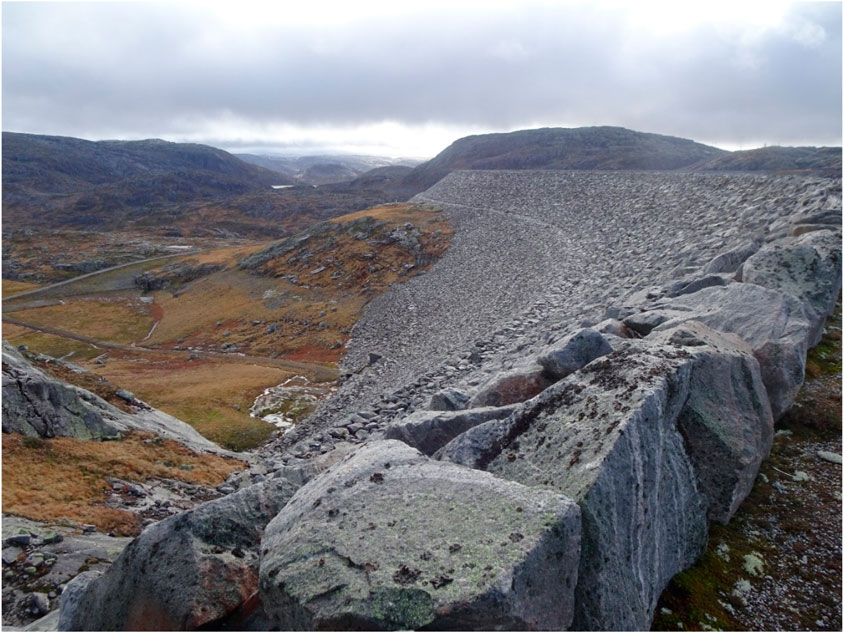
Figure 1. Placed riprap on the downstream slope of Storvass dam, Norway. (Image courtesy of the Norwegian University of Science and Technology.)
Over the last decade, extensive studies have been carried out in the hydraulic laboratory at the Norwegian University of Science and Technology (NTNU) on the failure mechanism of rockfill embankment dams with both dumped and placed riprap under overtopping conditions. Dezert et al. (2022a) provide an overview of these studies that involved building dam models within a flume (Figure 2). Most of these experimental model runs were recorded using multiple cameras (Sony Cybershot RX0/RX0 II) placed on rigs at predefined locations. This study considers results from eight of these model tests and focuses on the novel approach of implementing particle image velocimetry (PIV) to explore the characteristics of the protective layer of rockfill embankment dam physical models during a breach progression.
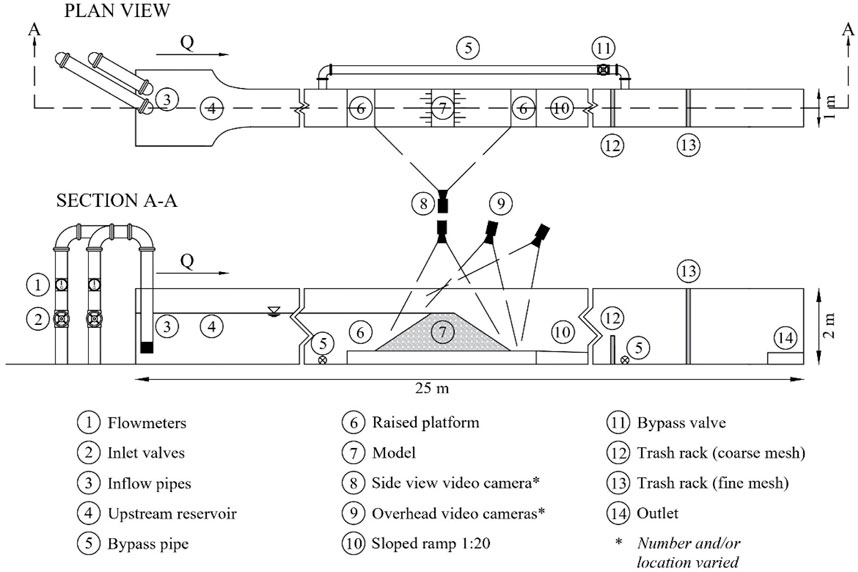
Figure 2. (Top) Sectional view of the hydraulic set-up in the flume; (bottom) planar view of the hydraulic set-up in the flume. [Modified from Senarathna (Senarathna, 2021)].
PIV provides instantaneous two-dimensional velocity fields of the riprap stones. Its ability to provide immediate results is a step forward when compared to conventional methods such as laser-Doppler velocimetry (LDV) and hot-wire anemometry (HWA) (Grant, 1997). The development of high-resolution digital cameras has led to the progression of digital particle image velocimetry (DPIV), eliminating the need for physical photo processing and enabling simpler multi-frame and ensemble measurements. Furthermore, PIV can capture two-dimensional or three-dimensional flow fields providing a thorough representation of the flow structure in a non-intrusive manner thereby not disturbing the flow being measured (Saga et al., 2000). PIV studies have multiple spillover benefits in the area of fluid mechanics. On top of the velocimetry data, derived parameters can be extracted such as but not limited to vorticity, shear rate, and strain rate. Multiple studies have focused on the application of PIV in aquatic environments such as breaking waves (Skyner et al., 1990), breakwaters (Shankar et al., 1994), environmental flows (Weitbrecht et al., 2011), and wall shear stress measurements (Bin Asad et al., 2019).
This study looks into the innovative approach of implementing PIV to investigate the characteristics of the protective layer of rockfill embankment dams under overtopping only or throughflow and overtopping conditions. An important point to note is that this study consists of many dam model setups and is based on experiments that have been carried out since 2017 by different individuals working on a research project led by the third author. The cameras were placed to observe the development of the phreatic surface and breach progression and not specifically for PIV analysis. Therefore, there are inherent limitations within the recordings. The emphasis of this study is to locate the initiation of the breach not just from observation as in previous studies but also from PIV analysis and identify any patterns rather than the absolute velocity magnitude. The values computed in this study will be referred to as Average Velocity Pattern (AVP) from this point forward to distinguish them from absolute velocity magnitude. The absolute velocity magnitude would be the total speed of a single rock measured relative to a fixed reference frame. The AVP is the average magnitude of all the stones in the area of interest (for example the toe section). Furthermore, the emphasis is on the pattern as if it is increasing or stagnant rather than on the absolute value. For the purpose of this study, breach initiation is defined as the instigation of movement in the protective layer leading to the irreversible deformation and ultimate failure of the riprap layer.
The experimental setup and the application of PIV to explore the breach progression of riprap protected dam models are first described in the following (Set-Up and Methodology). Then, the velocimetry data pattern generated through the implementation of PIV is presented (Results) before discussing and comparing them to former studies carried out in this discipline (Discussion).
2 Set-up and methodology
2.1 Experimental set-up
Eight separate experimental models were investigated in this study representing three different geometrical setups: placed riprap layer on a ramp (RP), half a dam with placed (HP) or dumped (HD) riprap on a rockfill shoulder, and full dam rockfill dam models protected with placed riprap (FP). One of the half dam models (HPT) had a support at the downstream toe of the riprap layer. These models have been well introduced in Dezert et al. (2022a). All these physical model tests were carried out in the hydraulic laboratory at NTNU. The models were built in a flume that was 25 m in length, 1 m in width, and 2 m in height. Within the flume, an elevated platform of 0.35 m was created using aluminum boxes so as to minimize the effects of backwater. A geotextile was layered on this platform so as to replicate friction at the toe. Similarly, geotextile was layered on the ramp for the model RP. Froude similarity was used to design this 1:10 scale conceptual model with a dam height of 1 m. In accordance with the existing protective layers on Norwegian dams, the riprap stones were placed at an angle of
The placed riprap layer on a ramp model (RP) consists of having a simple filter layer and riprap layer placed on a ramp representing the downstream half of the dam. A geotextile was placed on top of the ramp and a 0.1 m thick layer of filter was placed upon it. The filter layer consisted of stones with a density of ρs,Filter = 3,050 kgm-3. The thickness of the filter layer was in accordance with the NVE guidelines (NVE, 2012). The riprap consisted of rhyolites, an igneous rock with a density of ρs,Riprap = 2,710 kgm-3, and an average mass of 0.24 kg (Hiller et al., 2018). The median riprap stone diameter was d50 = 0.057 m. The value was calculated as d50 = (abc)1/3, where a,b, and c represent the longest, intermediate, and shortest axis of the stone respectively (Dezert et al., 2022a; Ravindra et al., 2021).
In order to gain a comprehensive assessment of rockfill dam stability during throughflow and overtopping events the half dam models were developed adding a rockfill shoulder and placing the filter and riprap layers on the downstream rockfill slope (Ravindra and Sigtryggsdóttir, 2021). This would provide a better insight into the interactions between different components of the dam and pinpoint critical elements and locations where dam failure could originate. Initially, these half dams were built without any riprap protection but instead incorporated varying toe configurations which have been investigated by Kiplesund et al. (2021). Further studies amalgamating filter and riprap layers are presented in the NVE report (Ravindra and Sigtryggsdóttir, 2021). These studies included both unsupported placed and dumped riprap which has been further analyzed in this study. To simplify the model design the central core and filter layer were represented by an impervious aluminum element. The core element has a height of 0.8 m, thus having 0.2 m of shell material above it (dam height 1 m). This was in agreement with the requirements of Norwegian regulations for dams with central moraine cores. The shell material consists of graded rockfill material with a density of ρs,Shell = 2,720 kgm−3 while the filter layer consists of stones with a density of ρs,Filter = 2,900 kgm−3. The same riprap stones as the previous study were used for this setup.
The shoulder of the dam was constructed in layers of 0.1 m thickness. After the material had been laid, a tamper was used to uniformly compact the layer. The tamper weighing 4.54 kg was dropped ten times in an overlapping pattern from a height of approximately 0.1 m onto the layer surface (Ravindra and Sigtryggsdóttir, 2021). The half dam with toe support (HPT) model setup is similar to the setup of the half dams without a toe. The only difference is the inclusion of a fixed-toe support. Load cells were also incorporated with the fixed-toe support in order to measure the loads at the toe. The same shell material was used while the density of the riprap stones used was ρs,Riprap = 2,600 kgm−3, and the filter material density was ρs,Filter = 3,050 kgm−3 (Dezert et al., 2022a; Dezert and Sigtryggsdóttir, 2024).
As a continuation of the previous tests, full dam profiles were investigated next. For these models, the impermeable element was represented by a 1 mm thick rubber membrane. The black styrene butadiene rubber sheet was taped and sealed on the bottom and the wall side using Wurth duct tape while transparent Stokvis joining tape was used on the glass pane side. Furthermore, the upstream shoulder was also constructed. The same shell material was used with a density of ρs,Shell = 2,720 kgm−3. The shell material alone had a mass of 4,500 kg (Kiplesund et al., 2023).
For each setup, the inflow during the breach was not set. The models were subjected to sequential overtopping with incremental increases in discharge which was held constant for a fixed time interval until complete failure was reached for a critical inflow discharge. This information has been summarized in Table 1. The models were placed sufficiently upstream from the pump outlet to ensure calm flow conditions in the upstream section of the dam models.
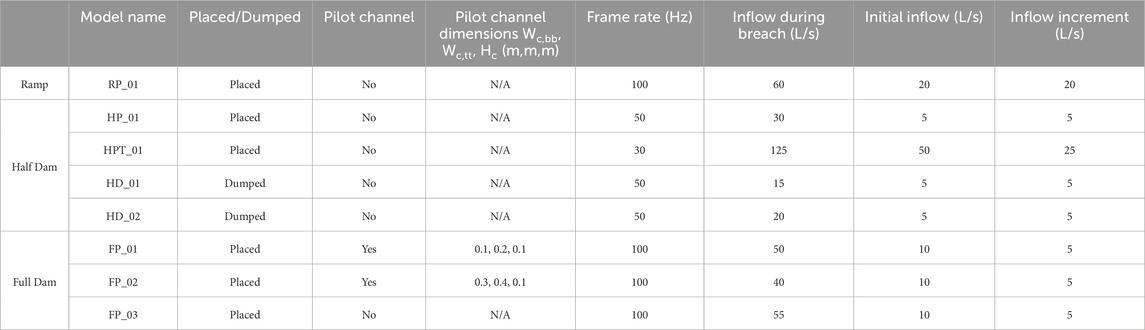
Table 1. Summary of tests carried out (H - Half Dam; F - Full Dam; P - Placed Riprap; D - Dumped Riprap; R - Ramp; T - Toe Support).
Table 1 provides a summary of the test models investigated in this paper. Two full dam models (FP) had a pilot channel with bottom and top width Wc,bb and Wc,tt respectively and height Hc (Dezert et al., 2024). A pilot channel was constructed on the crest of the dam on the glass pane side to induce the breach on that side where it can be both observed and documented. However, the pilot channel did not influence the breach initiation in the protected dams.
A visual representation of the models summarized in Table 1 has been presented in Figure 3. The rubber sheet provided sufficient sealing and met predefined criteria such as acceptable impact of the watertight membrane, realistic phreatic surface, ease of construction, uniformity across tests, etc. (Kiplesund et al., 2023). Furthermore, the shell material which has been used for these models has been tested with varying toe configurations to study the throughflow in rockfill dams, there have been both physical and numerical studies (Kiplesund et al., 2021; Smith et al., 2021). These studies provided satisfactory results with regard to pore pressure distribution and realistic phreatic line. Even though the gradation was conducted with the minimum permissible particle size set at 0.5 mm, the gradation curve was determined based on data derived from real rockfill dams and checked against criteria in the NVE guidelines (NVE, 2012; Kiplesund et al., 2021). Moreover, Darcian or linear flow is rarely encountered in real-world applications with flow through rockfill (Leps, 1973). Linear Darcy flow theory is only applicable to flow through small grains around 0.5 mm in size (Wilkins, 1955). Due to characteristics such as porosity, particle shape, particle size, roughness, and tortuosity of rockfill material, flow within rockfill structures usually deviates from the linear flow regime, resulting in high velocities (Siddiqua et al., 2011).
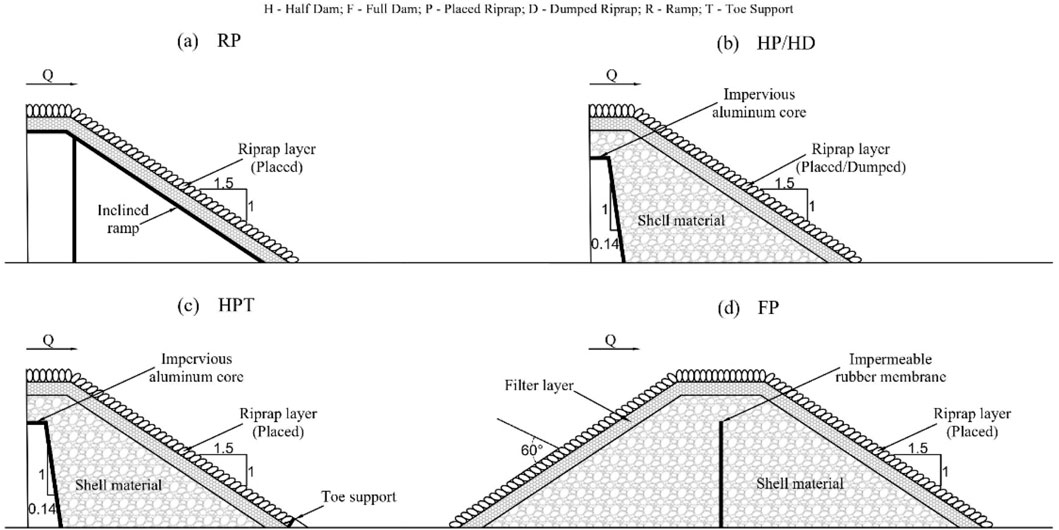
Figure 3. Sectional view of all dam models. (A) Placed riprap layer on a ramp (RP); (B) Half dam with placed (HP) or dumped (HD) riprap; (C) Half dam with placed riprap and toe support (HPT); (D) Full dam with placed riprap (FP).
2.2 Methodology for the PIV analysis
Figure 4 provides a summary of the PIV workflow, detailing various steps involved in the process, from data acquisition to post-processing and analysis. The boxes in the blue dotted region in Figure 4 are steps that were carried out within PIVlab (Thielicke and Stamhuis, 2014). The workflow has been assigned numerical identifiers to each step. These step numbers will be referenced in the subsequent methodology section, where each step will be described in detail.
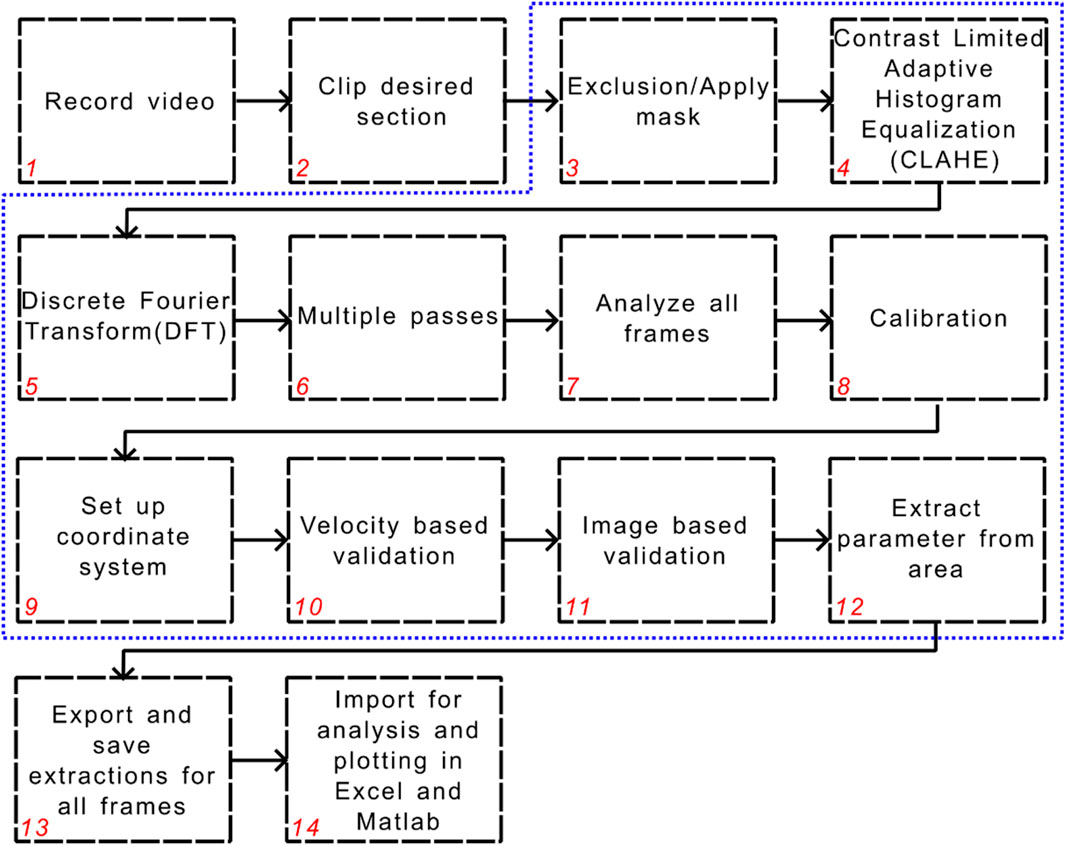
Figure 4. PIV analysis workflow.
The cameras have been set up so that they record the entire breaching process (Step 1). Typically, this entails documenting the process from the initial filling of the flume reservoir upstream of the model dam all the way through to the complete breach of the model embankment dam. As this entire process takes quite an extended amount of time the files are considerable in size (>20 GB). Hence, for this study, the files were trimmed (Step 2) and only the time intervals of interest were selected (the main breach). Within this interval, all frames available were taken into account and analyzed in PIVlab. PIVlab is a MATLAB toolbox presented in a GUI form, designed for calculating velocities within image data.
After the time interval of interest was selected, a mask was applied in PIVlab to exclude some of the areas (Step 3). These excluded areas mostly include the elevated platform, the columns, the aluminum core when present, and most of the backdrop area behind the dam model. As these objects did not move from one frame to another, it was not necessary to include them in the PIV analysis. Figure 5 presents the mask being applied to model FP_01.
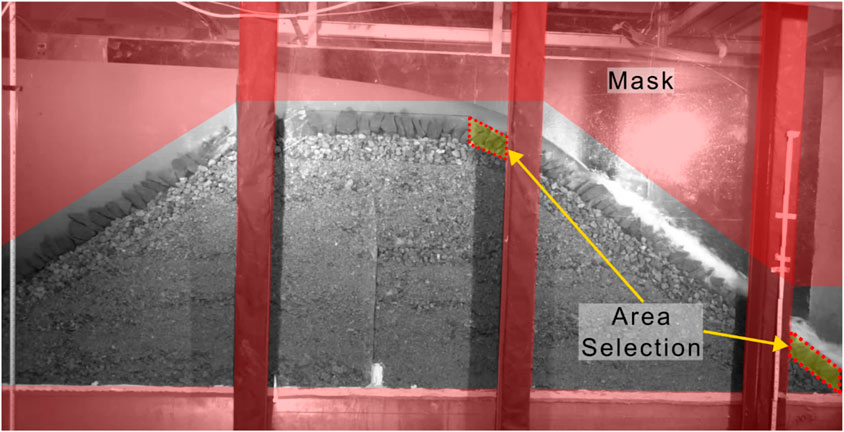
Figure 5. Mask applied to a full dam model (FP_01) with placed riprap - Step 3. Area selection with the red dotted polygon for breach initiation analysis for a full dam model - Step 12.
The images were then pre-processed using the Contrast Limited Adaptive Histogram Equalization (CLAHE) technique (Step 4). This technique improves the contrast of the images while overcoming the limitations of Adaptive Histogram Equalization (AHE) where it adds noise as a result of over-amplification at analogous regions of the image. The CLAHE technique does not take the histogram of the entire image and instead takes the histograms of smaller tiles which is crucial as there is no assurance that the complete image will be uniformly exposed (Westerweel, 1993). Using this technique substantially increases the likelihood of identifying valid vectors between the images (Shavit et al., 2007).
Next, a PIV algorithm was chosen under the PIV settings. The most important part of the PIV analysis is the cross-correlation. The cross-correlation is used to generate the most probable spatial displacement of the particles within the interrogation areas of successive singly exposed images (Adrian and Westerweel, 2010; Thielicke, 2014). The discrete cross-correlation function used for this purpose is Equation 1 (Huang et al., 1997):
Where PIP1 and PIP2 (Particle Image Pattern) correspond to the image masks in the first and second images of the single exposed image pair. This correlation matrix shows where the particles are most likely to have been displaced from PIP1 to PIP2 based on the location of the intensity peak in matrix C (m,n) (Huang et al., 1997).
This equation can be solved using two general methods, either in the frequency domain or in the spatial domain (Gonzalez and Wintz, 1987; Willert and Gharib, 1991). Evaluation in the frequency domain is done by a Fast Fourier Transform (FFT) algorithm while the approach on the spatial domain is done using the Direct Cross Correlation (DCC) technique (Adrian, 1991). PIVlab uses Discrete Fourier Transform (DFT) which is calculated using the FFT algorithm (Step 5).
DCC supports the use of interrogation areas of different sizes (Stamhuis, 2006). According to (Huang et al., 1997) DCC is able to generate more precise calculations as compared to the standard DFT method where both the random and systematic errors are reduced significantly. However, the main drawback with regard to the DCC technique is that it has a very high computational cost. This aspect is most significant when the interrogation area considered is large (Soria, 1996). This disadvantage can be solved using the DFT technique which uses interrogation areas of equal size (Raffel et al., 2007). This technique can however result in the increase of background noise which is a result of the loss of information because of identical interrogation areas. This inevitably decreases the accuracy of the results as it becomes difficult to identify the intensity peaks. To overcome this drawback and also maintain a minimum computational cost, multiple passes can be run on the same data set (Westerweel et al., 1997). To further improve this, an algorithm was proposed (Scarano and Riethmuller, 1999) that enhances the dynamic range and spatial resolution of the vector map. This is done by implementing successive interrogation passes where the interrogation grid is refined with every step (Step 6). The initial step uses a larger interrogation area and is thus able to read higher displacements, in the subsequent steps this area is reduced (in this setup the area was reduced by 50%, and three passes were implemented). The interrogation area started from 64px, the second pass was set at 32px, and the final pass at 16px. A smaller stop window would have given a better resolution however, caution was exercised not to use too small of an interrogation area as this would notably increase noise, hence generating inaccurate correlations. Furthermore, a smaller stop window would significantly increase the computational time. Subsequently, an individual analysis was performed for each frame (Step 7).
It is best to follow the above step with calibration before any data validation is done (Step 8). Up until this step, the units that have been used in PIVlab are pixels per frame. When calibrating it is possible to select an image separately or simply use a frame from the video recorded. Calibration can be applied using the known distance between two points and the time step between each frame. The coordinate system is established by defining the positive and negative directions for both x and y (Step 9). In this configuration, the flow direction is from left to right, hence, the positive x direction was chosen as right (streamwise direction), and the positive y direction was downwards (gravity direction).
Next, the data needs to be validated in order to filter any possible erroneous vectors. This was initially done through velocity-based validation (Step 10). Here, either the velocity limits could be set or all vectors of all the frames could be displayed in a scatter plot and discard the anomalies. In this study, the interest is with regard to the vectors representing the riprap. PIVlab performs a correlation-based analysis that identifies the average displacement of patterns of pixels within an interrogation window between successive frames. If one needs the precise center of each stone tracked individually, one may need to use an object-tracking algorithm. As the water flows from left to right in the flume, the riprap can move in the same direction and vertically up and down. However, it is very unlikely that the riprap moves in the opposite direction to the flow. However, there were vectors pointing in the opposite direction as there was turbulent flow around the riprap stones. Furthermore, as the water splashes on some of the stones it bounces instantaneously in the opposite direction and the software sometimes detects this and generates vectors. Using the scatter plot, all the vectors in the opposite direction to the flow were filtered out. This was followed by filtering based on image-based validation (Step 11). During this process there are two options, firstly filter low contrast and secondly filter bright objects. Then adjusting these threshold values one can suppress areas that have low contrast and vectors in bright areas. This is of significance because certain regions exhibited shadows, mainly due to the presence of columns supporting the glass panes. In contrast, other areas were exceptionally bright, owing to the reflection of floodlights off the glass panes. Additionally, there were areas characterized by the presence of white water, a consequence of turbulence created by water splashing onto the riprap stones. It is also possible to interpolate any of the missing vectors within each frame. However, it was decided not to use the interpolated values and rely solely on the calculated values as the reliability of interpolated values is somewhat degraded when compared to calculated values.
Subsequently, specific regions were delineated from which AVP values were obtained (Step 12). Four different areas were drawn: 1) downstream riprap only, 2) downstream riprap and filter, 3) crest riprap only, and 4) crest riprap and filter. Taking into consideration all the velocity vectors, PIVlab calculated the AVP for the selected area for each frame. These AVP values of each frame were saved in a text file (Step 13) which was later exported to MS Excel and MATLAB for analysis (Step 14). The velocimetry data pattern calculated using the PIV software is an average for the selected area. This area is static and does not follow the protective layer (i.e., the riprap stones) dynamically and only gives the reading of the movement that occurs within this selected area.
In order to establish where the breach initiates, a section of the riprap layer was selected from the top and bottom of the downstream slope section. The chosen segment measured approximately 20–32 cm in length. It was not possible to consistently select an area of the same length for every model. This was because in some cases the toe sections of the models were beyond the field of view of the cameras used (Table 2) or in other cases the columns holding the glass panes obstructed the visualization of the area of interest. Figure 5 presents a visual representation of the selected sections for model FP_01.
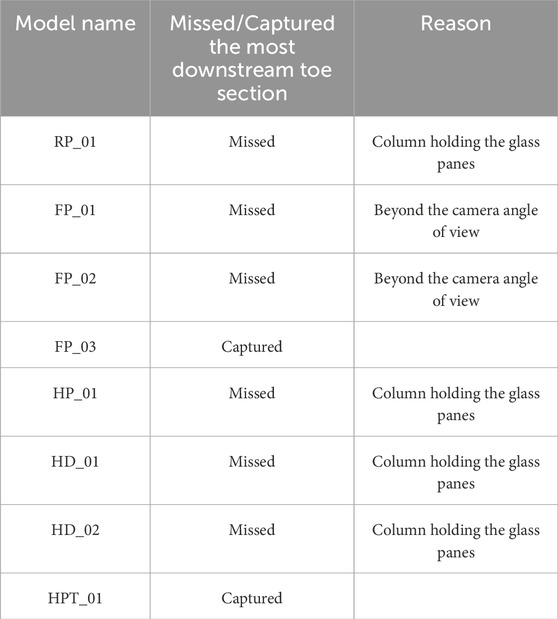
Table 2. Limitations related to camera placement and obstructed views caused by columns in different models.
As illustrated in Figure 6, there were some limitations of this set-up as the camera failed to capture the most downstream toe section. These limitations have been summarized in Table 2.
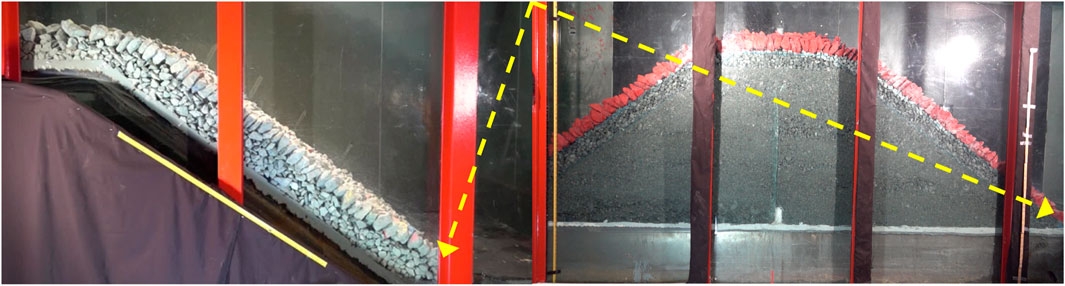
Figure 6. Visual representation of some of the concerns mentioned in Table 2 (right) FP_01 and (left) RP_01.
3 Results
3.1 Breach initiation
The Table 3 provides a summary of the observations made on the breach initiation analysis and the initial purpose behind the model tests.
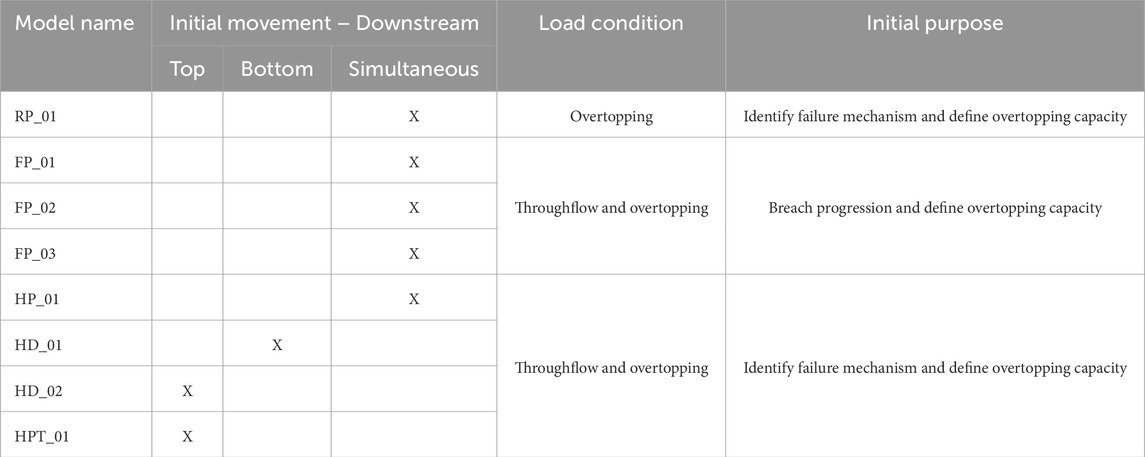
Table 3. Summary - Breach Initiation identified with PIV and initial test purpose.
When looking into the results presented in Table 3 it can be seen that for all unsupported models with placed riprap, the breach initiation took place simultaneously in the top and bottom sections (Figure 7) whereas, for the unsupported models with dumped riprap, the initiation was observed in both the top and bottom sections, but not simultaneously (Figure 7). The breach initiation at the downstream toe indicates the point where the hydrodynamic forces surpass the static frictional force at the dam’s toe, between the riprap stones and the geotextile. In the case of unsupported models with placed riprap, the riprap layer experienced a sliding failure as noted in previous studies (Ravindra et al., 2020; Dornack, 2001; Siebel, 2007). It is important to recognize that the origin point on the horizontal axis does not correspond to the true zero point, which signifies the actual start of data collection (Figures 7, 8, 10, 11). This is the reason why it's referred to as “duration” instead of “time”.
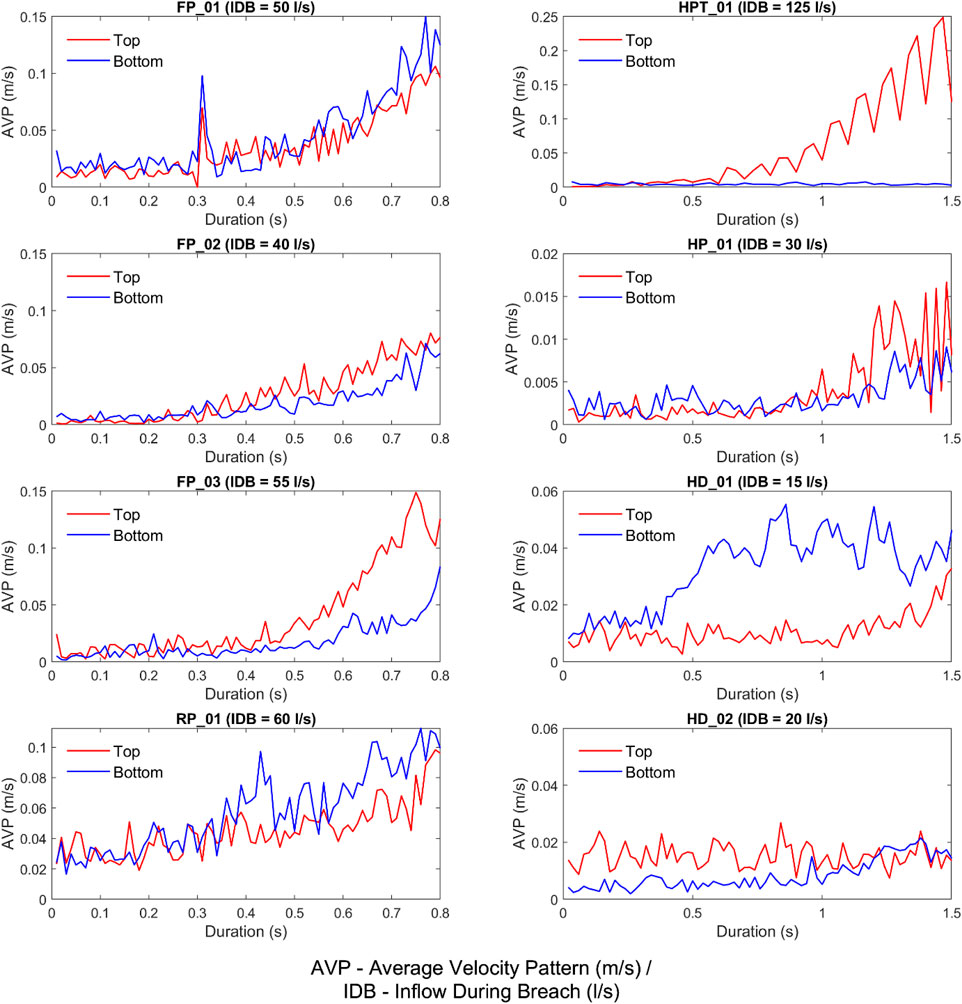
Figure 7. Breach Initiation identification from the Average Velocity Pattern (AVP) for all the tests listed in Table 1.
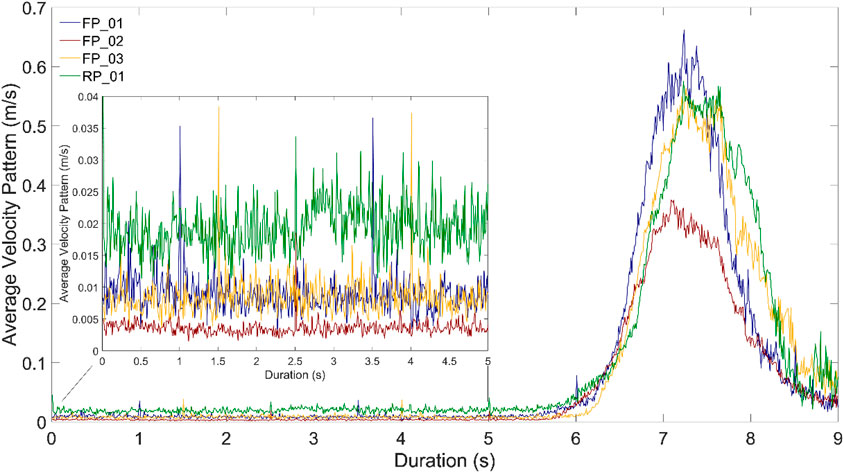
Figure 8. Comparison of placed riprap layers on full dams (FP) versus on a ramp (RP). Variation in AVP prior to the main breach.
3.2 Friction between protective layer and shell material
Ongoing movements of the riprap and filter material are noted in the case of RP_01 (on the ramp) in comparison to the full dam FP_03 which includes the shell material. In the absence of this frictional resistance against the shell, the riprap and filter material on the ramp undergoes significant rearrangement. This was further established by looking at the AVP values for the protective layer before the main breach occurred Figure 8.
The data has been truncated to enhance graphical clarity and facilitate comparison. For instance, in Figure 8, the data has been adjusted to facilitate comparison, while Figure 7 provides a close-up view of the initiation points across all studied models. These initiation points denote the juncture where the graph’s overall trend begins to ascend, occurring approximately around the 6-s mark in Figure 8.
When looking into the time period preceding the main breach the time-averaged AVP value for FP_03 is 0.008 m/s whereas the time-averaged AVP value for the RP_01 model on a ramp without any shell material is 0.020 m/s. Figure 8 illustrates the AVP before the main breach where one can clearly see the higher values for the model on the ramp as compared to the full dams with the shell material. This may be due to the fact that there is less frictional resistance for the RP_1 model where the shell material is absent. Another reason could be the contrast in throughflow within the dam structure. Previous studies have shown that the dynamic throughflow within the dam structure can have a significant effect on the structural stability of a dam (Dezert et al., 2022a; Morán and Toledo, 2011). The flow within the shell material will increase the internal pore pressure. This in conjunction with the hydraulic drag and lift forces exacerbates the stability of the protective layer.
3.3 Toe support
When examining Figure 9, which illustrates the data in Table 4, it becomes evident that there exists a linear relationship between the normalized peak AVP and the normalized inflow during the breach. Higher peak values are associated with higher inflows during the breach. However, one notable exception is readily illustrated in Figure 9. Model HPT_01 has the lowest peak values even though it has the highest breach inflow. The main reason behind this is that this peak AVP is an average for the selected section as highlighted in Section 2.2 (in this case the entire protective layer) and the material in the bottom section adjacent to the toe support remained stationary. V refers to the peak AVP value, while Vmax refers to the maximum peak AVP value for all the models presented. Correspondingly, Q refers to the inflow during the breach, while Qmax refers to the maximum inflow during the breach for all models presented.
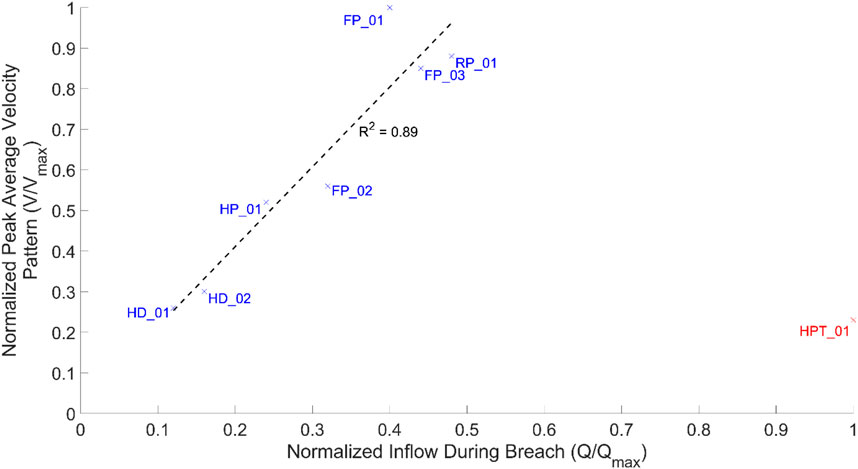
Figure 9. Normalized Peak AVP at the downstream section vs. normalized inflow during breach for the riprap layer.
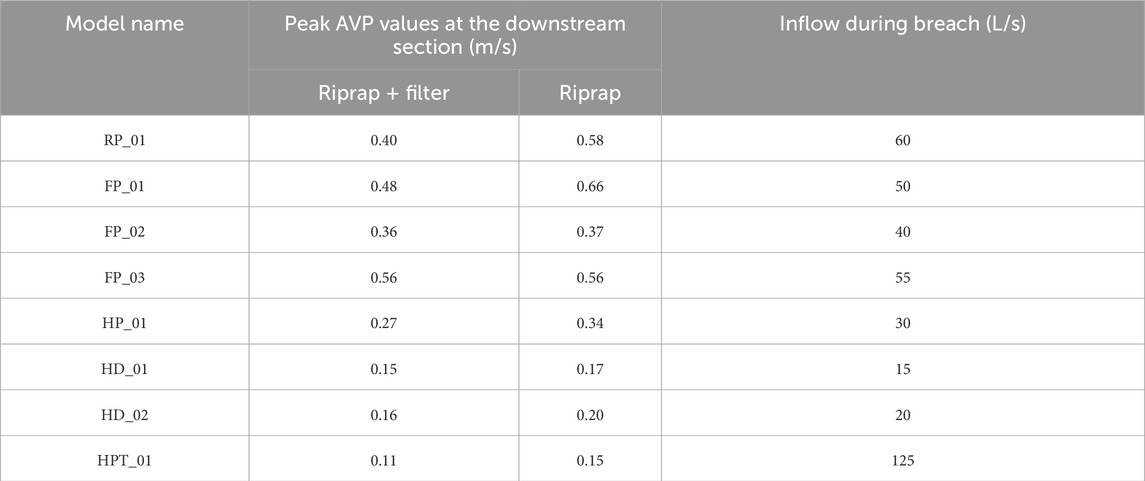
Table 4. Peak AVP values observed for riprap + filter and riprap (only) in the downstream face.
Another aspect that was investigated was the impact of the toe support. This retaining element clearly had a significant influence on the movement in the most downstream sections of the riprap layer. Figure 10 offers a comparative visualization of the most downstream section of the riprap layer for two models with placed riprap, one with the toe support (HPT_01) and the other without (HP_01).
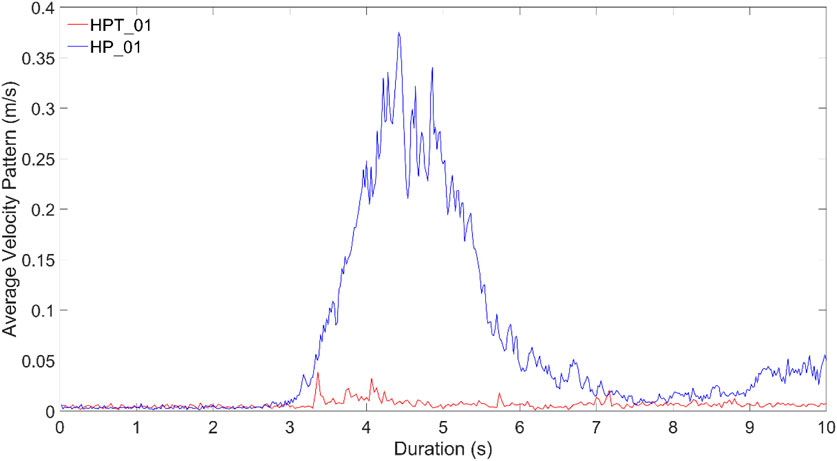
Figure 10. Contrasting AVP readings for the lower section of the riprap layer in models incorporating toe support (HPT_01) and for models devoid of such support (HP_01).
3.4 Placed vs. dumped
The physical modeling revealed that the placed riprap models exhibit significantly greater resistance as compared to dumped riprap models. Hence, able to withstand higher overtopping discharges. This is further illustrated in Table 4 and Figure 9. Moreover, the placed riprap models experienced a sliding failure while the dumped riprap models underwent progressive erosion. Additionally, for the slope and friction angle of the material examined in this study, no major movement was observed solely due to throughflow. This variation in construction philosophies, namely placed and dumped riprap also leads to a distinct variation in the behavior of the protective layer when it fails under overtopping conditions. Figure 11 visually presents the results obtained from the analysis of the entire protective layer.
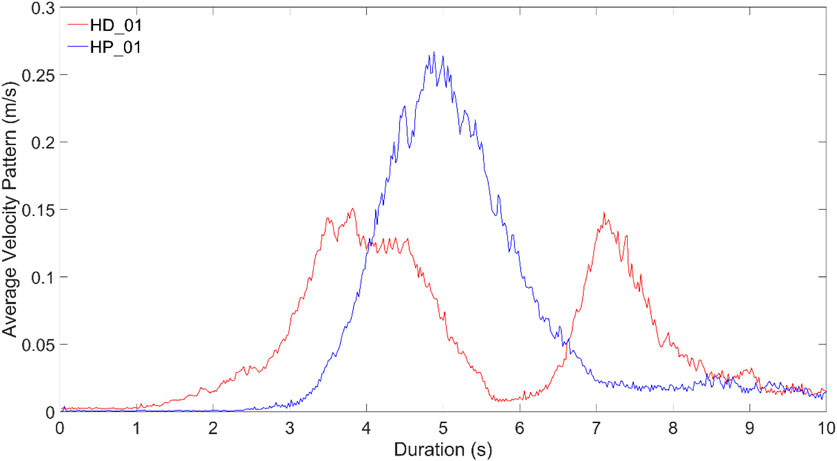
Figure 11. Variation in AVP for dumped riprap (HD_01) and placed riprap (HP_01).
As mentioned in the set-up and methodology section it should be noted that AVP values were obtained through a two-point calibration using the measured distance between two columns on the side of the flume. Although this study focuses on the AVP rather than the absolute velocity values, previous studies have shown that such calibration generates satisfactory results where the deviation between peak velocities from PIV analysis and smart stones ranged between 0.01 and 0.06 m/s (Ravindra et al., 2020).
4 Discussion
4.1 Breach initiation
The interlocking stones in placed riprap create a bearing structure and this structural layer seems to slide as a single entity in the absence of a rigid toe support. However, the unsupported models with dumped riprap lack such interlocking characteristics. Hence, these structures underwent progressive erosion where the riprap layer was removed in stages (Dezert et al., 2022a) where the precise location of breach initiation was inconclusive, as occurrences have been observed both at the top and bottom for the slope and friction angle examined in this study. Conversely, the results of the present study indicate that the supported model with placed riprap exhibited a different point of breach initiation i.e. at the top of the riprap layer. As the toe support provides stabilizing resistance the riprap layer is able to withstand higher hydrodynamic forces. While experiencing these forces, they are subjected to compaction, creating a gap at the transition between the crest and the downstream section which has been observed by Hiller et al. (2018). The results of this study exemplify this matter. Furthermore, past studies (Ravindra et al., 2021; Dezert and Sigtryggsdóttir, 2024; Dezert et al., 2022b) revealed that the deformation models with placed riprap and toe support underwent closely mimic the Euler buckling behavior of a long column which is pinned at one end and free at the other. The results of this study support this statement as the results reveal that the breach movement initiates at the top section (free end) of the protective layer while the movement of the bottom section is confined by the toe support. Figure 7 illustrates this graphically where there are insignificant velocity readings at the bottom section of the riprap layer as compared to the top which has significant velocity readings.
4.2 Friction between protective layer and shell material
Continuous displacements of the riprap and filter material are revealed when it comes to RP_01 as compared to FP_03. As mentioned in [(Ravindra et al., 2020)] the sustained effect of the hydraulic drag and uplift forces causes the stones to rearrange continuously and create a more compact structure. Although this effect can be identified in models such as FP_01 and FP_03 as well, it is not as significant as RP_01. Just as there are frictional forces between the filter layer and riprap interface (Ravindra et al., 2020), there are also similar frictional elements between the filter and the shell material. This friction between the filter and the shell material seems to minimize the movement of the filter as well as the adjacent riprap layer. As RP_01 is built on a ramp (with geotextile), there is no shell material to provide the required and more realistic frictional resistance. When looking at Figure 9, it can be seen that RP_01 follows a similar evolutionary pattern to that of the other models. The reasoning behind this could be because the geotextile could distribute the loads more evenly thus mitigating its influence on the movement relative to the friction angle alone. The interaction between the filter and geotextile very much mimics the resistance that would arise naturally between the filter and shell interface. Nonetheless, this resistance is marginally inferior as it is not possible to perfectly replicate the micromechanical interlocking of the rock particles as illustrated in Figure 8. This brings forth the importance of including the shell for more realistic modeling.
The primary stabilizing agent or resisting force on the filter and riprap material is the frictional force (Wörman, 1993). This further expounds on the fact that the greater displacement over a unit time for RP_01 is due to the lower frictional resistance in the absence of shell material. Furthermore, the destabilizing drag force is significantly larger than the seepage force when the dam has been overtopped and the riprap (surface stones) experience only 50% of the seepage forces in comparison to the internal stones (Martin and Aral, 1971).
4.3 Toe support
In the case of model HPT_01 the toe support restricts the movement of the protective layer significantly serving its purpose. Hence, even though the top section of the protective layer has been considerably displaced, the AVP for the entire section is quite low (Table 4) as the bottom section has undergone minor displacement.
This analysis also reveals the effectiveness of the supporting toe structure. When looking into the AVP values of the riprap layer at the top and bottom of the protective layer it can be seen that there is significant movement, particularly at the bottom section for structures with placed riprap without the supporting toe. In the case of placed riprap with a supporting toe, this movement at the bottom of the riprap layer is minor in comparison as can be observed in Figure 10.
4.4 Placed vs. dumped
The results revealed that models with placed riprap have a single velocity peak whereas models with dumped ripraps have double peaks in the velocity pattern as seen in Figure 11. These double peaks were a result of progressive surface erosion where the dumped riprap rolled down near the toe of the dam and piled up creating a restricting structure (like a small weir) backing up the water. When the flow is large enough, it breaks through this structure, creating a secondary peak as can be seen in Figure 12. In structures featuring placed riprap, the protective layer remains intact until the breach discharge reaches a significant level. This breach discharge value is typically higher than that for structures with dumped riprap (Dezert et al., 2022a). At that point, the entire structure, along with its protective layers, is removed in a single peak. This peak is typically higher than either of the double peaks seen in structures with dumped ripraps.
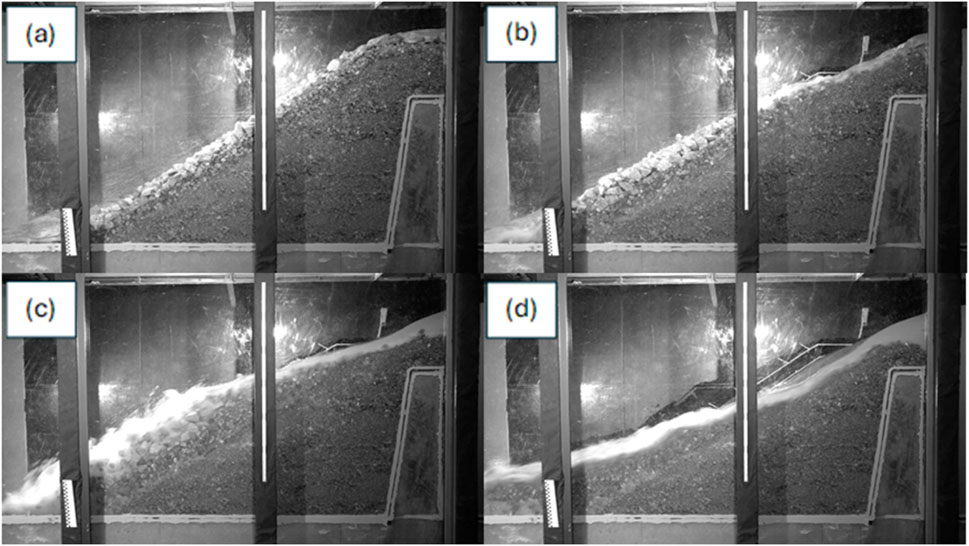
Figure 12. Breach progression at 2-s intervals (HD_01). (A) At time t, (B) At time t+2s, (C) At time t+4s, (D) At time t+6s.
5 Limitations and recommendations
In most cases, the camera was positioned in such a manner that it missed the most downstream toe section as the toe was beyond the camera’s angle of view, and in a few cases, the view was obstructed by the columns holding the glass panes. Table 2 is a summary of this issue faced during the study.
The current model setup provides a section view of one side of the dam model. Hence, any phenomenon taking place in the central section, or the other side of the model will not be captured by the cameras. There is one camera on the top, but this cannot be used for PIV analysis as there is a lot of white water due to the turbulence creating a blanket-like layer making the dam surface imperceptible. This is a major limitation of this model for PIV analysis.
In future research, to enhance the video quality and obtain more detailed information about the breach, it would be beneficial to position a camera specifically focused on the downstream half of the full dams. This approach ensures a closer examination of the most downstream section of the dam toe. It would have been more desirable to have a consistent frame rate. This would have improved the results of the models that were recorded at a smaller frame rate and also made comparisons more straightforward.
Despite conducting these tests, the recorded video appears to have failed to capture the downstream section and the primary breach, likely due to technical challenges such as cameras overheating. Performing additional tests, particularly full dam with dumped riprap and half dam with placed riprap would have been ideal for comparison purposes for the present study. However, building each dam requires a significant amount of time and is labor-intensive manual work, as does cleaning the breached dams following the tests.
Having a better calibration technique would be highly beneficial. PIVlab does not have any advanced calibration techniques at the moment. It links pixels to real-world distance. For the current study, the distance between the columns at the flume’s side walls was used to calibrate the distance. PIVlab is expected to implement techniques such as orthorectification and image undistortion in the future which will significantly improve the accuracy of results. Furthermore, a setup bespoke made for PIV would be a considerable improvement where one could focus on absolute velocity values with better calibration and fixed parameters such as acquisition frequencies, focal distance, etc.
As the selected area for the PIV analysis is static, a possible improvement would be to implement a code that would track the area of interest and thereby follow the protecting layer throughout the breach progression. This could then be used to track the entire protective layer or pre-selected stones at given locations. Another possibility is the implementation of smart stones with extended battery life and sufficient storage as suggested by Ravindra et al. (2020).
6 Conclusion
This study aims to elucidate some critical aspects with regard to riprap stability. By contextualizing findings from experimental studies, carried out since 2017, the study enhances our understanding of rockfill embankment dams with riprap protection on the downstream face. The investigation involves experimental overtopping tests conducted on 1:10 scale model structures. The models varied from full to half dams incorporating both placed and dumped riprap. One of the models was supported at the toe by a metallic support. All dam shoulders were constructed on steep slopes of 1:1.5 (S = 0.67). Multiple cameras were placed in order to observe the breach progression. The recording from the camera providing the sectional view of the dam models was used for the PIV analysis carried out in this study. While the model setups were not originally intended for PIV analysis, the present study demonstrates that useful information can still be extracted from such analysis. The PIV analysis of the recordings made it possible to explore important characteristics of the protective riprap layer and calculate velocity patterns to identify breach initiation, failure mechanism, peaks in the velocity pattern, and comparative duration.
This study sheds light on the area of rockfill embankment dam breach initiation. The results reveal that for models with placed riprap unsupported at the toe, the breach initiates simultaneously at the top and bottom. This reinstates the fact mentioned in Ravindra et al. (2021) regarding a failure mechanism characterized by a sliding process. Furthermore, when comparing the velocity pattern for the riprap models on a ramp compared to the full dam models, the analysis further revealed the importance of adding the shell material for more realistic modeling. The present study also confirms, for the case of supported riprap, that the breach initiates at the top of the protective layer while the toe support restrains the bottom section (HPT_01 in Figure 7). This supports the buckling deformation described in Dezert and Sigtryggsdóttir (2024) for placed riprap models with toe support. For models with dumped riprap, the exact location of breach initiation was indeterminate. The study also provides a visualization of the variation in calculated velocity patterns for models with placed riprap, with and without a toe support. This highlights the increase in stability provided by the supporting element.
Another aspect this analysis revealed was the contrast in the calculated velocity pattern for placed and dumped riprap models. This analysis not only reestablished the fact that placed riprap is able to withstand higher discharges as compared to dumped riprap as stated in Ravindra et al. (2020) but also revealed that there is a variation in the shape of the velocity pattern graph for the protective layer. Models with placed riprap experienced a single peak while the models with dumped riprap experienced a double peak as a result of surface erosion. Nonetheless, it should be noted that the single peak of the placed riprap was considerably higher in magnitude as compared to the double peaks of the dumped riprap. In other words, the breaching of the dams protected with placed riprap was faster and shorter in duration than for those protected with dumped riprap. Placed riprap certainly ensures better stability and provides better protection until the critical breach discharge is reached. Placed riprap is contingent upon the interlocking and structural integrity. However, when the critical threshold is reached, the structure fails abruptly leading to a sudden loss of protection. Hence, a dam with placed riprap may sustain larger overtopping values, but if it eventually fails, the consequences may be larger.
The findings of this study are dependent on parameters such as material employed as well as scaling. Validation of this data through complementary tests would be valuable. As numerous dams are planned to undergo upgrades in the near future, establishing criteria and guidelines for design and construction is of paramount importance. This study is a step in this direction offering valuable insights into the effectiveness of reinforcement techniques and construction philosophies.
Data availability statement
The datasets presented in this article are not readily available because the data is still being analyzed by PhD students responsible for the experiments. Results will be made available upon request as soon as the analysis is finished, and the analysis results published. Requests to access the datasets should be directed to Fjóla Guðrún Sigtryggsdóttir, ZmpvbGEuZy5zaWd0cnlnZ3Nkb3R0aXJAbnRudS5ubw==.
Author contributions
NH: Formal Analysis, Investigation, Visualization, Writing–original draft, Writing–review and editing. TD: Supervision, Writing–review and editing. FS: Conceptualization, Funding acquisition, Project administration, Supervision, Writing–review and editing.
Funding
The author(s) declare that financial support was received for the research, authorship, and/or publication of this article. This research was financially supported by the Norwegian Research Council (grant number 257588), Norwegian Research Centre for Hydropower Technology (HydroCen), Work Package WP 1.2.
Acknowledgments
The authors gratefully thank PhD students that worked in the project for setting up some of the experimental tests described in this article as well as the many master students involved in these experiments. The former PhD student Ganesh H.R. Ravindra carried out experiments on the RP, HD, and HP models, and the PhD student Geir Helge Kiplesund on the full dam models. (The second author was responsible for the HPT model and the first author was involved in some of the FP tests as a master’s student). The second author acknowledges the financial support offered by the Norwegian Water Resources and Energy Directorate, Hafslund E-CO Vannkraft, Hydro Energi, NEAS, SFE Produksjon, Sira-Kvina, Skagerak Kraft AS, Statkraft, Tafjord Kraftproduksjon, and Trønder Energi, all in Norway. The financial support from HydroCen, Norway, is acknowledged.
Conflict of interest
The authors declare that the research was conducted in the absence of any commercial or financial relationships that could be construed as a potential conflict of interest.
Generative AI statement
The author(s) declare that no Generative AI was used in the creation of this manuscript.
Publisher’s note
All claims expressed in this article are solely those of the authors and do not necessarily represent those of their affiliated organizations, or those of the publisher, the editors and the reviewers. Any product that may be evaluated in this article, or claim that may be made by its manufacturer, is not guaranteed or endorsed by the publisher.
References
Abt, S. R., Thornton, C. I., Scholl, B. A., and Bender, T. R. (2013). Evaluation of overtopping riprap design relationships. J. Am. Water Resour. Assoc. 49 (4), 923–937. doi:10.1111/jawr.12074
Adrian, R. J. (1991). Particle-imaging techniques for experimental fluid mechanics. Annu. Rev. Fluid Mech. 23 (1), 261–304. doi:10.1146/annurev.fluid.23.1.261
Adrian, R. J., and Westerweel, J. (2010). Particle image velocimetry. Illustrate. Cambridge University Press.
Bin Asad, S. M. S., Lundström, T. S., Andersson, A. G., Hellström, J. G. I., and Leonardsson, K. (2019). Wall shear stress measurement on curve objects with PIV in connection to benthic fauna in regulated rivers. WaterSwitzerl. 11 (4), 650. doi:10.3390/w11040650
S. Carr, C. Lawrence, and T. Skaugen (2023). Projected future changes in peak flows and implications for climate change allowances. Oslo: The Norwegian Water Resources and Energy Directorate. Available at: https://publikasjoner.nve.no/rapport/2023/rapport2023_26.pdf (Accessed February 5, 2024).
Chanson, H. (2004). The hydraulics of open channel flow: an introduction. Second Edi. Oxford: Elsevier Butterworth-Heinemann.
Costa, J. E. (1985). Floods from dam failures. USGS open-file Report. Washington, DC: USGS. Available at: https://pubs.usgs.gov/publication/ofr85560 (Accessed September 18, 2023).
Dezert, T., Kiplesund, G. H., and Sigtryggsdóttir, F. G. (2022a). Riprap protection exposed to overtopping phenomena: a review of laboratory experimental models. WaterSwitzerl. 14 (17), 2722. doi:10.3390/w14172722
Dezert, T., Kiplesund, G. H., and Sigtryggsdóttir, F. G. (2024). Parametric breach model evaluation from laboratory rockfill dam models under overtopping conditions. J. Hydraul. Eng. 150 (6). doi:10.1061/jhend8.hyeng-14011
Dezert, T., Ravindra, G. H. R., and Sigtryggsdóttir, F. G. (2022b). Placed riprap deformation related to axial load at toe support: physical modelling. WaterSwitzerl. 14 (10), 1581. doi:10.3390/w14101581
Dezert, T., and Sigtryggsdóttir, F. G. (2024). 3D displacement and axial load of placed riprap supported at the toe: use of structure from motion. J. Hydraul. Eng. 150 (1), 1–10. doi:10.1061/jhend8.hyeng-13599
Dornack, S. (2001). Überströmbare Dämme-Beitrag zur Bemessung von Deckwerken aus Bruchsteinen/Overtoppable dams-a contribution to the design of riprap. Dresden, Germany: Technische Universität Dresden.
Foster, M., Fell, R., and Spannagle, M. (2000). The statistics of embankment dam failures and accidents. Can. Geotech. J. 37 (5), 1000–1024. doi:10.1139/t00-030
Grant, I. (1997). Particle image velocimetry: a review. Proc. Inst. Mech. Eng. Part C J. Mech. Eng. Sci. 211 (1), 55–76. doi:10.1243/0954406971521665
Hiller, P. H., Aberle, J., and Lia, L. (2018). Displacements as failure origin of placed riprap on steep slopes. J. Hydraul. Res. 56 (2), 141–155. doi:10.1080/00221686.2017.1323806
Huang, H., Dabiri, D., and Gharib, M. (1997). On errors of digital particle image velocimetry. Meas. Sci. Technol. 8 (12), 1427–1440. doi:10.1088/0957-0233/8/12/007
ICOLD (2019). Incident database Bulletin 99 update, Statistical analysis of dam failures. Bulletin No. 188.
ICOLD (2023). General synthesis. Available at: https://www.icold-cigb.org/GB/world_register/general_synthesis.asp (Accessed September 18, 2023).
ICOLD (International Commission on Large Dams) (1995). Dam failures statistical analysis. Bulletin 99. Available at: https://www.icold-cigb.org/GB/publications/bulletins.asp (Accessed September 19, 2023).
Kiplesund, G. H., Ravindra, G. H. R., Rokstad, M. M., and Sigtryggsdóttir, F. G. (2021). Effects of toe configuration on throughflow properties of rockfill dams. J. Appl. Water Eng. Res. 9 (4), 277–292. doi:10.1080/23249676.2021.1884615
Kiplesund, G. H., Sigtryggsdottir, F. G., and Lia, L. (2023). Breach progression observation in rockfill dam models using photogrammetry. Remote Sens. 15 (6), 1715. doi:10.3390/rs15061715
Martin, C. S., and Aral, M. M. (1971). Seepage force on interfacial bed particles. J. Hydraul. Div. 97 (7), 1081–1100. doi:10.1061/jyceaj.0003016
Morán, R., and Toledo, M. Á. (2011). Research into protection of rockfill dams from overtopping using rockfill downstream toes. Can. J. Civ. Eng. 38 (12), 1314–1326. doi:10.1139/l11-091
Najafzadeh, M., and Oliveto, G. (2020). Riprap incipient motion for overtopping flows with machine learning models. J. Hydroinformatics 22 (4), 749–767. doi:10.2166/hydro.2020.129
NVE (2012). Veileder for fyllingsdammer. Norwegian water Resources and Energy directorate. Available at: https://publikasjoner.nve.no/veileder/2012/veileder2012_04.pdf (Accessed September 19, 2023).
Raffel, M., Willert, C. E., Wereley, S. T., and Kompenhans, J. (2007). Particle image velocimetry: a practical guide. Second. Berlin: Springer.
Ravindra, G. H. R., Gronz, O., Dost, B., and Sigtryggsdóttir, F. G. (2020). Description of failure mechanism in placed riprap on steep slope with unsupported toe using smartstone probes. Eng. Struct. 221 (November 2019), 111038. doi:10.1016/j.engstruct.2020.111038
Ravindra, G. H. R., and Sigtryggsdóttir, F. G. (2021). Rockfill dams – downstream riprap and dam toe. Oslo. Available at: https://publikasjoner.nve.no/eksternrapport/2021/eksternrapport2021_17.pdf (Accessed June 14, 2024).
Ravindra, G. H. R., Sigtryggsdottir, F. G., and Lia, L. (2021). Buckling analogy for 2D deformation of placed ripraps exposed to overtopping. J. Hydraul. Res. 59 (1), 109–119. doi:10.1080/00221686.2020.1744745
Saga, T., Hu, H., Kobayashi, T., Murata, S., Okamoto, K., and Nishio, S. (2000). A comparative study of the PIV and LDV measurements on a self-induced sloshing flow. J. Vis. 3 (2), 145–156. doi:10.1007/bf03182407
Scarano, F., and Riethmuller, M. L. (1999). Iterative multigrid approach in PIV image processing with discrete window offset. Exp. Fluids 26 (6), 513–523. doi:10.1007/s003480050318
Senarathna, NDHA (2021). Effect of downstream erosion protection on the breaching of rockfill dams. Trondheim, Norway: Norwegian University of Science and Technology. Available at: https://ntnuopen.ntnu.no/ntnu-xmlui/handle/11250/2827051 (Accessed December 12, 2023).
Shankar, N. J., Cheong, H. F., Nallayarasu, S., and Idicahndy, V. G. (1994). “Investigation of particle kinematics around a submerged horizontal plate by particle image velocimetry,” in Ninth congress of asian and pacific division of the international association for hydraulic research (Singapore), 58–66.
Shavit, U., Lowe, R. J., and Steinbuck, J. V. (2007). Intensity Capping: a simple method to improve cross-correlation PIV results. Exp. Fluids 42 (2), 225–240. doi:10.1007/s00348-006-0233-7
Siddiqua, S., Blatz, J. A., and Privat, N. C. (2011). Evaluating turbulent flow in large rockfill. J. Hydraul. Eng. 137 (11), 1462–1469. doi:10.1061/(asce)hy.1943-7900.0000442
Siebel, R. (2007). Experimental investigations on the stability of riprap layers on overtoppable earthdams. Environ. Fluid Mech. 7 (6), 455–467. doi:10.1007/s10652-007-9041-8
Skyner, D. J., Gray, C., and Greated, C. A. (1990). A comparison of time-stepping numerical predictions with whole-field flow measurement in breaking waves. Water Wave Kinemat. (Eds Torum Gudmestad) 178, 491–508. doi:10.1007/978-94-009-0531-3_31
Smith, N. S., Ravindra, G. H. R., and Sigtryggsdóttir, F. G. (2021). Numerical modeling of the effects of toe configuration on throughflow in rockfill dams. WaterSwitzerl. 13 (13), 1–19. doi:10.3390/w13131726
Soria, J. (1996). An investigation of the near wake of a circular cylinder using a video-based digital cross-correlation particle image velocimetry technique. Exp. Therm. Fluid Sci. 12 (2), 221–233. doi:10.1016/0894-1777(95)00086-0
Stamhuis, E. J. (2006). Basics and principles of particle image velocimetry (PIV) for mapping biogenic and biologically relevant flows. Aquat. Ecol. 40 (4), 463–479. doi:10.1007/s10452-005-6567-z
Thielicke, W. (2014). The flapping flight of birds: analysis and application. Germany: University of Groningen. Available at: https://research.rug.nl/files/14094714/Complete_dissertation.pdf (Accessed September 19, 2023).
Thielicke, W., and Stamhuis, E. J. (2014). PIVlab – towards user-friendly, affordable and accurate digital particle image velocimetry in MATLAB. J. Open Res. Softw. 2. doi:10.5334/jors.bl
Thornton, C. I., Abt, S. R., Scholl, B. N., and Bender, T. R. (2014). Enhanced stone sizing for overtopping flow. J. Hydraul. Eng. 140 (4), 3–6. doi:10.1061/(asce)hy.1943-7900.0000830
Weitbrecht, V., Seol, D. G., Negretti, E., Detert, M., Kühn, G., and Jirka, G. H. (2011). PIV measurements in environmental flows: recent experiences at the Institute for Hydromechanics in Karlsruhe. J. Hydro-Environment Res. 5 (4), 231–245. doi:10.1016/j.jher.2011.04.002
Westerweel, J. (1993). Digital particle image velocimetry: theory and application. Delft, Netherlands: Delft University of Technology. Available at: https://repository.tudelft.nl/islandora/object/uuid%3A85455914-6629-4421-8c77-27cc44e771ed (Accessed September 19, 2023).
Westerweel, J., Dabiri, D., and Gharib, M. (1997). The effect of a discrete window offset on the accuracy of cross-correlation analysis of digital PIV recordings. Exp. Fluids 23 (1), 20–28. doi:10.1007/s003480050082
Wilkins, J. K. (1955). Flow of water through rockfill and its application to design of dams. New Zeal Eng. 01, 382–387. doi:10.1016/B978-0-444-41828-9.50007-7
Willert, C. E., and Gharib, M. (1991). Digital particle image velocimetry. Exp. Fluids 10 (4), 181–193. doi:10.1007/bf00190388
Wörman, A. (1993). Seepage-Induced mass wasting in coarse soil slopes. J. Hydraul. Eng. (N. Y). 119 (10), 1155–1168. doi:10.1061/(asce)0733-9429(1993)119:10(1155)
Wu, W. (2011). Earthen embankment breaching. J. Hydraul. Eng. 137 (12), 1549–1564. doi:10.1061/(asce)hy.1943-7900.0000498
Keywords: dam safety, rockfill dam, dam breach, PIV, riprap
Citation: Halaba Arachchige Senarathna ND, Dezert T and Sigtryggsdóttir FG (2025) Particle image velocimetry analysis of the protective layer in embankment dams. Front. Built Environ. 10:1502168. doi: 10.3389/fbuil.2024.1502168
Received: 26 September 2024; Accepted: 12 December 2024;
Published: 08 January 2025.
Edited by:
Miguel Ángel Toledo Municio, Polytechnic University of Madrid, SpainReviewed by:
Rafael Moran, Polytechnic University of Madrid, SpainWilliam Fiedler, HDR, Inc., United States
Copyright © 2025 Halaba Arachchige Senarathna, Dezert and Sigtryggsdóttir. This is an open-access article distributed under the terms of the Creative Commons Attribution License (CC BY). The use, distribution or reproduction in other forums is permitted, provided the original author(s) and the copyright owner(s) are credited and that the original publication in this journal is cited, in accordance with accepted academic practice. No use, distribution or reproduction is permitted which does not comply with these terms.
*Correspondence: Nisal Deelaka Halaba Arachchige Senarathna, bmlzYWwuZC5oLmEuc2VuYXJhdGhuYUBudG51Lm5v