- 1Shandong High-Speed Infrastructure Construction Corp Ltd., Jinan, China
- 2School of Civil Engineering, Shandong University, Jinan, China
A three-dimensional dynamic model of vehicle-road-unsaturated subgrade coupling is established. The semi-analytical and numerical solutions of three-dimensional dynamic response of highway subgrade under vehicle load are presented for the first time. Then, the accuracy of the theoretical model is verified by the field measurement data. Finally, the spatial distribution of dynamic stress and depth of working zone under different influencing factors are studied, and the calculation model of depth of working zone of highway subgrade is proposed. The results show that the dynamic stresses, σx, σy, σz, and τxz increase significantly with the increase of vehicle axle load and decrease significantly with the increase of road thickness under the same subgrade depth. In addition, with the increase of axle load and the decrease of road thickness, the peak values of dynamic stress σx, σy, σz, and τxz decrease more obviously along the depth of roadbed. In the process of vehicle movement, the traditional subgrade working area can be divided into a sensitive area and an influence area of dynamic load. The depth of these two areas is positively correlated with the axle load of the vehicle and negatively correlated with the thickness of the road surface. The advantage of the model in this paper is that the semi-analytical solution of the total stress component of the soil element in the course of traffic load is given.
1 Introduction
The subgrade, serving as the support for the highway pavement structure, endures long-term cyclic loads from moving vehicles during its service life. This leads to deterioration in the dynamic performance of the subgrade, which in turn affects the service life of the pavement structure (Chu et al., 2024). In the design process of highway subgrade structures, the working area depth of the subgrade is a crucial design parameter. Therefore, revealing the spatial distribution of dynamic stress and the working area depth of highway subgrades under vehicle loads is of significant importance for both the structural design of the highway subgrade and safe operation throughout its entire lifecycle.
In the existing research, studies on the dynamic response of highway subgrades under vehicle loads primarily focus on field testing and theoretical calculations. In terms of field testing, relevant research workers have conducted numerous on-site experiments to investigate the distribution patterns of vertical dynamic stress in the subgrade under vehicle loads. These studies have established the relationship among vertical dynamic stress, vehicle axle load, and driving speed (An et al., 2018; Lu et al., 2018b; Levin et al., 2022). Relying on Qinen Expressway, An et al. (2018) measured the dynamic response of a typical roadbed structure during the running of heavy-duty vehicles and analyzed the spatial response law of vertical dynamic stress inside the roadbed under different vehicle masses and running speeds. Zhang et al. (2018) measured the dynamic response of an asphalt concrete road–subgrade structure under heavy traffic load on site, obtained the distribution law of dynamic stress amplitude of the highway subgrade under different vehicle axle loads and running speeds, and proposed the calculation method of the attenuation coefficient of dynamic stress along the depth direction and the basis for subgrade working area division. However, currently, field testing primarily focuses on vertical dynamic stress, with limited research conducted on dynamic stress in other directions. It is difficult to study the working area depth of the subgrade by a field test because of the limited amount of data obtained from the field test. To address the above issue, Lin et al. (2019) developed an orthogonal soil pressure sensor and used it to study the dynamic response of the subgrade under moving vehicles. To investigate the variation patterns of total stress components of subgrade soil elements under vehicle loads, Cui et al. (2023b) conducted field tests using a self-developed three-dimensional dynamic stress sensor. However, compared to theoretical research, field testing is relatively expensive and limited in the range of conditions studied. This makes it challenging to conduct comprehensive research on the dynamic response of the subgrade under vehicle loads and accurately determine the working area depth of the subgrade (Cui et al., 2023a). Therefore, many research workers have conducted theoretical studies on the dynamic response of the subgrade under vehicle loads. Initially, relevant research workers assumed the highway subgrade and foundation to be homogeneous elastic media (Eason, 1965). However, as the subgrade itself is a multi-phase medium, it is clearly incorrect to treat it as a homogeneous elastic medium (Chen, 2014). To address this issue, Biot (1962) first proposed a porous elastic model for saturated soil as a two-phase medium. This model has since been used by many research workers to study the dynamic characteristics of subgrades and foundations (Lu and Jeng, 2007; Cai et al., 2009; Lu et al., 2014; Ai and Ye, 2021; Tang et al., 2021a; Tang et al., 2021b; Lei et al., 2023).
Later, Lu et al. (2018a) developed a theoretical model for the dynamic response of unsaturated subgrade under moving rectangular loads based on an extended Biot theory. This model was further applied to analyze the dynamic response of unsaturated subgrades under aircraft and train loads. However, these studies mainly focused on vertical dynamic stress and did not address the working area depth of the highway subgrade. The working area depth of the subgrade under traffic load is a critical factor in calculating subgrade settlement during the operational period and serves as an important guide for subgrade design and construction. However, current standards only provide recommended working area depths for a maximum axle load of 130 kN, without considering the impact of different pavement structures and vehicle axle loads on the depth of the subgrade working area. Moreover, the existing theoretical model only provides the solution of vertical normal stress and does not provide the solution of dynamic stress in other directions, and cannot analyze the spatial distribution characteristics of dynamic stress in other directions. Therefore, it is necessary to develop a calculation model for the working area depth in highway subgrades under various factors.
A dynamic theoretical model of vehicle load–pavement structure–unsaturated subgrade coupling was established in this paper. The semi-analytical and numerical solutions for the three-dimensional dynamic response of the highway subgrade under vehicle loads are obtained, and the accuracy of the theoretical model is validated using field measurement data. Finally, based on the established theoretical model, a working-area depth-calculation model considering factors such as vehicle axle load and subgrade stiffness is developed. This study is of significant importance for optimizing the highway subgrade structural design.
2 A theoretical model of vehicle–pavement–unsaturated subgrade coupling
2.1 Control equations of the theoretical model
(1) Control equations of the unsaturated subgrade
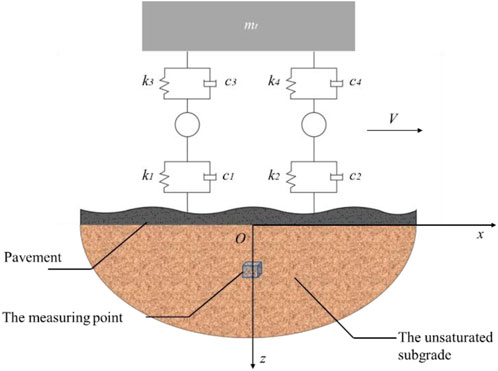
As shown in Figure 1, a three-dimensional dynamic response calculation model of vehicle–pavement–unsaturated subgrade coupling was established in this paper. The model treats the vehicle as a rigid body system composed of springs and mass blocks, the pavement as a Kirchhoff plate, and the subgrade as an unsaturated elastic half-space (Lefeuve-Mesgouez et al., 2002; Cai et al., 2015; Lyu et al., 2020).
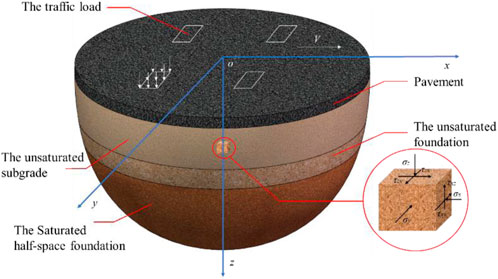
Figure 1. Schematic diagram of the three-dimensional dynamic theoretical model coupled vehicle–pavement–unsaturated subgrade.
According to the constitutive equation of unsaturated soil and the motion equation of unsaturated soil particles, pore water, and pore gas, the general solution for an unsaturated soil half-space in the frequency domain within a Cartesian coordinate system can be obtained, as shown in Equations 1–11. The derivation of the general solution is detailed in literature by Cui et al. (2022):
where the relevant coefficients in the above equations are given in the study by Cui et al. (2022).
(2) Control equations of the vehicle
As shown in Figure 2, a spring–mass–damper dynamic system is used to model a vehicle traveling along the x-axis. In the figure, mt represents the mass of the vehicle body, and the shock absorbers and the tires of the vehicle are regarded as damping springs. k1 and k2 represent the stiffness of the left and right tires, respectively, and k3 and k4 represent the stiffness of the left and right shock absorbers, respectively. c1 and c2 represent the damping of the left and right tires, respectively, and c3 and c4 represent the damping of the left and right shock absorbers, respectively. V stands for the speed at which the car is traveling.
As the vehicle is symmetric with respect to the x-axis in the model, and both left and right wheels are subjected to the same road-surface irregularities, the vehicle will not experience pitch vibrations along the y-axis. Therefore, the vehicle can be simplified by considering only one-half of it along the x-axis. According to Henchi et al. (1998) and Cai et al. (2015), the dynamic differential equations for the four freedom degrees of the vehicle model can be expressed as
where MV, CV, and KV represent the mass matrix, stiffness matrix, and damping matrix of the vehicle, respectively, and are expressed as follows (Equations 13–15):
Z(t) = [zt, z1, z2]T denotes the displacement vector, and P(t) = [P1, P2]T represents the contact forces between the wheels and the road surface. The other parameters in Equation 12 can be determined from [146]. Thus, Equation 12 can be expressed as
where
The displacement at the kth wheel caused by a harmonic load applied to the jth wheel is denoted as
where Z′W(ω) can be written as
where
(3) Control equations of the pavement
For a typical pavement structure, including the surface layer, base layer, and subbase, the main mechanical parameters of the pavement structure, such as density, elastic modulus, and Poisson’s ratio, do not show significant differences. However, the impact of pavement structures with different thicknesses on the dynamic response of the subgrade is significant. Therefore, it is essential to establish a suitable and computationally feasible model to characterize pavements under various conditions. Lu et al. (2013) used equivalent pavement conversion formulas to investigate the working-area depth in the subgrade under different combinations of pavement thickness and elastic modulus. The results indicate that by converting different pavement structures into equivalent pavements and using Kirchhoff plates to model the pavement system, the dynamic response of the subgrade under various pavement conditions can be represented more concisely. The governing equation for the pavement is expressed as
where
2.2 Solution of the theoretical model
(1) Solution of the system to pavement–unsaturated subgrade coupling
For permeable pavements, the pore water and pore air at the top surface of the subgrade do not have a significant effect on the interface. Assuming smooth contact between the pavement and the top surface of the subgrade, the vertical displacement of the pavement is consistent with the vertical displacement of the top surface of the subgrade. Therefore, the boundary conditions for the permeable pavement can be expressed as
By applying the double Fourier transform, the boundary conditions in Equation 26 can be expressed as
By substituting Equations 1–4 into the boundary conditions of Equation 27 and transforming the matrices, the boundary condition matrix can be obtained as follows (Equations 28–37):
where
The parameters can be referenced from the study by Lu et al. (2018a).
Unknown integral constant A in Equation 37 can be determined based on the boundary conditions. Then, by performing the inverse double Fourier transform on Equation 8, the spatial domain solution can be obtained as follows (Equation 18):
The dynamic response of an unsaturated subgrade to a unit moving load can be expressed as Equation 39
where f(x, y, z, t)(unit response) represents the unit response of displacement or stress in the time domain;
When t = 0, the ground displacement is the same as the pavement displacement, that is, w(x, y, t) = uz(x, y, t). The unit displacement at the
where ljk = aj - ak; ljk is the distance between the jth and kth wheel contact points and aj and ak represent the initial positions of the jth and kth wheel contact points, respectively.
The amplitude of the pavement displacement at the wheel contact point can be expressed as Equations 41, 42
where
The amplitude of the pavement displacement at the wheel contact point can be expressed as Equation 43.
(2) Solution of the system to vehicle–pavement coupling
In a spring–mass–damper system, the stiffness of the spring is given by kHj = kj + iωcj (j = 1, 2). Simplifying the uneven pavement to a sinusoidal wave form, ZR(x) represents the profile of the uneven pavement along the x-direction, as shown in Equation 44:
where A and λp represent the amplitude and wavelength of the pavement roughness function, respectively.
The excitation frequency of the moving load caused by the vehicle is f = V/λp, and the angular frequency is ω = 2πV/λp. The position of the wheel contact point at time t can be expressed as x = aj + Vt. Therefore, the pavement displacement at the jth wheel contact point can be written as Equation 45
Assuming that the wheel always remains in contact with the pavement, then,
Based on Equations 22, 41, the following relationship can be obtained:
By substituting Equations 47, 48 into Equation 46, the following expression can be obtained:
The additional dynamic load
The influence coefficient id for the total wheel load Qj at the jth wheel can be expressed as Equations 50, 51
where Q′j represents the axle load at the jth wheel and Q′1 + Q′2 represents the total vehicle load.
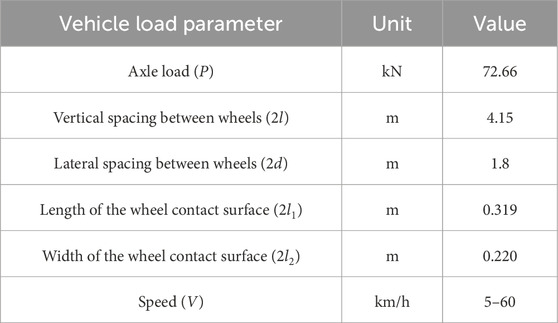
The tire contact area can be considered a rectangle with length l1 and width l2. Therefore, the vehicle’s moving load can be expressed as
where d is half the distance between the left and right wheels and l is half the distance between the front and rear wheels. By substituting Equation 52 into the Fourier transform and neglecting the time-dependent exponential term eiΩt = ei(ω−Vβ)t, the equation for the vehicle load in the frequency domain is as follows (Equation 53):
The dynamic response of unsaturated-subgrade soil under a unit load is expressed as follows (Equation 54):
where xt = x–Vt.
3 Validation of the theoretical model
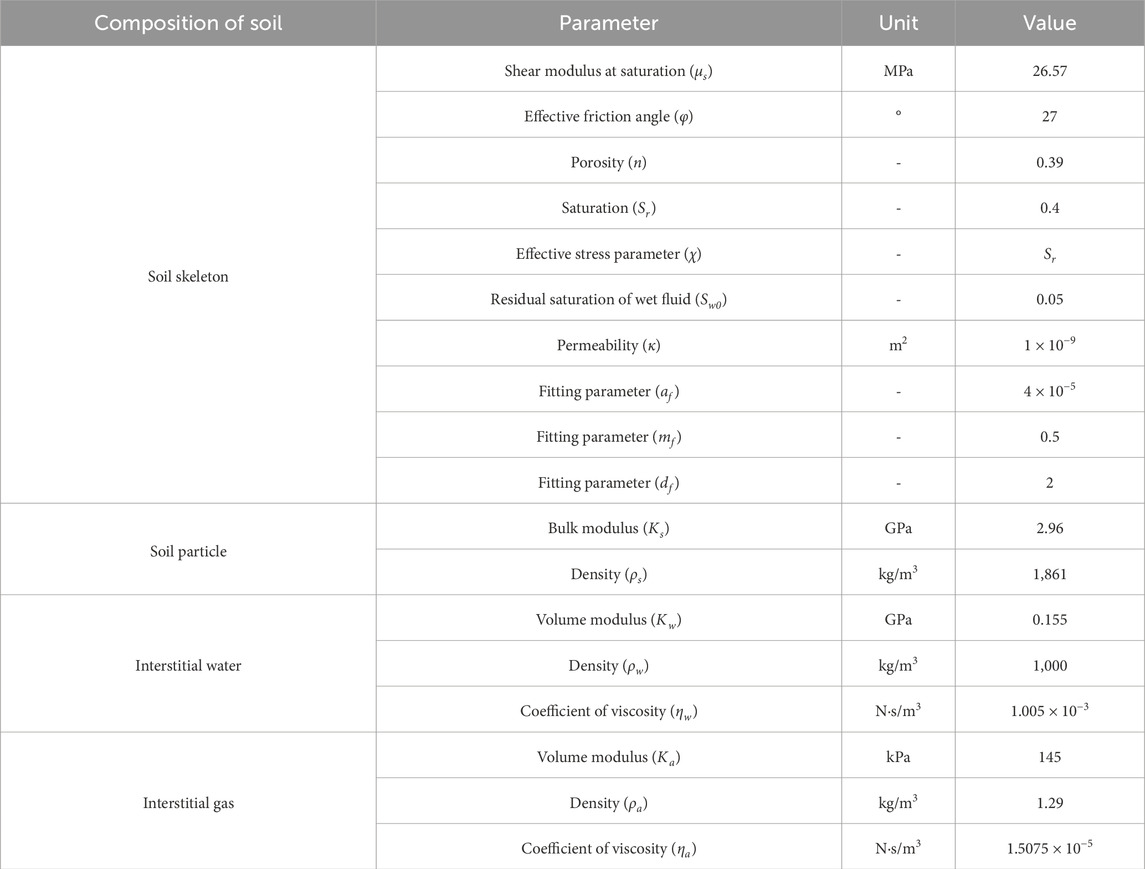
To validate the effectiveness of the established theoretical model, a field test was conducted to measure the three-dimensional dynamic response of a highway subgrade under vehicular load, as shown in Figure 3. A self-developed three-dimensional dynamic soil pressure sensor was used to capture the total stress components within the soil element during vehicle moving, as shown in Figure 3A. The installation procedure for the three-dimensional dynamic stress sensor during the field test was as follows. first, a vertical hole with a diameter of 10 cm and a depth of 2.1 m was drilled downward from the road surface (Figures 3B,C). The sensor was then placed inside the hole, with a layer of fine sand spread over the sensor surface to prevent damage (Figure 3D). Finally, the hole was sealed with asphalt concrete pavement material (Figure 3D). The types of vehicles used in the field test included a three-axle truck, a four-axle truck, and a six-axle truck (Figures 3E–G). The detailed results of the field test are given in the study by Cui et al. (2023b) and will not be elaborated upon here. To validate the effectiveness of the established theoretical model, the dynamic stress generated at the subgrade surface by an unloaded three-axle truck traveling at different speeds was compared with the theoretical calculation results. The pavement structure parameters, traffic load parameters, and unsaturated soil parameters used in the theoretical model are given in Tables 1–3, respectively. The unsaturated soil parameters are based on the study by Cui et al. (2022).
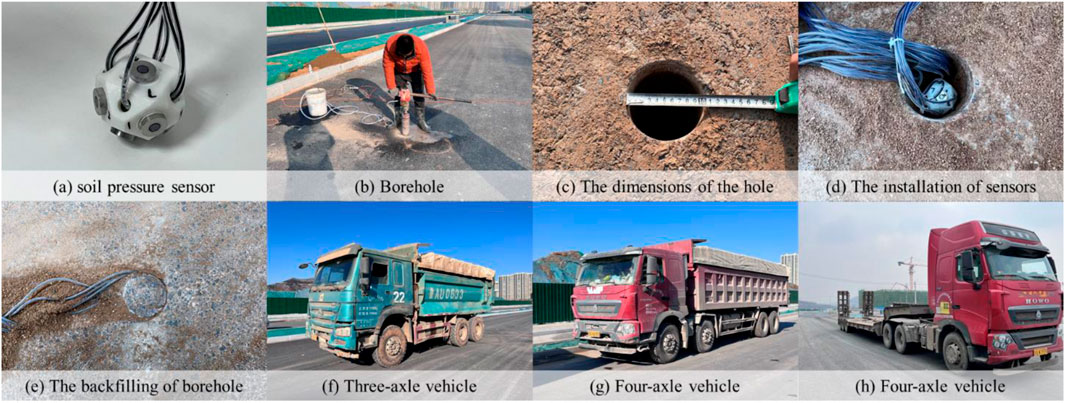
Figure 3. Field tests: (A) Soil pressure sensor, (B) Borehole, (C) The dimensions of the hole, (D) The installation of sensors, (E) The backfilling of borehole, (F) Three-axle vehicle, (G) Four-axle vehicle, (H) Four-axle vehicle.
The sensor used during the experimental testing is a self-developed three-dimensional soil pressure sensor, capable of measuring the full stress components of subgrade soil elements. The specific working principle is given by Cui et al. (2023a). The sensor needs to be calibrated, and the detailed calibration method is provided in the study by Cui et al. (2023b). The detailed test results of the field tests are published in the study by Cui et al. (2023b). To validate the effectiveness of the theoretical model, in this paper, we compare the field test results of dynamic stress, measured during the passage of an unloaded three-axle vehicle (axle load p = 7.266 t) at different speeds, with the theoretical calculations.
The aforementioned parameters were substituted into the theoretical model to solve for the dynamic stress–time history curves at the subgrade surface under the operating conditions of vehicle speeds of 5 km/h, 20 km/h, 40 km/h, and 60 km/h. The theoretical calculation results were compared with the field test results, as shown in Figure 4. The results indicate that the theoretical and measured time history curves for the dynamic stresses (σx, σy, σz, and τxz) match well. Except for a few instances, the peak values and phases of the time history curves in both the theoretical calculations and field tests also align closely, validating the accuracy of the theoretical model established in this study.
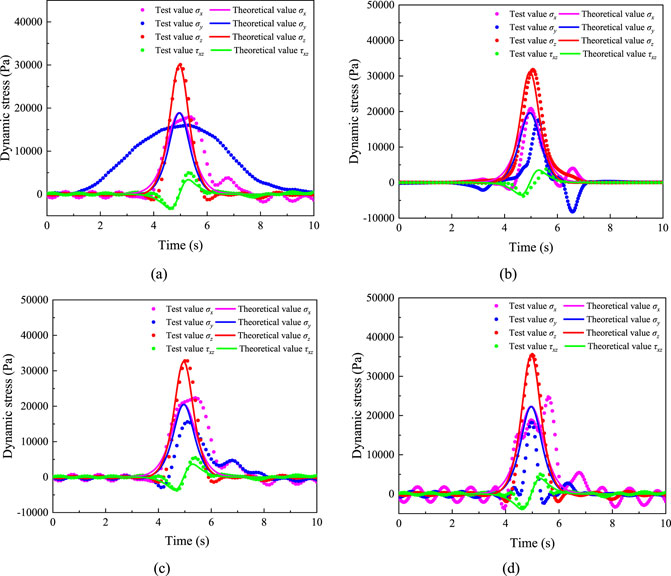
Figure 4. Comparison of theoretical and measured values: (A) v = 5 km/h, (B) v = 20 km/h, (C) v = 40 km/h, and (D) v = 60 km/h.
4 Spatial distribution of dynamic stress and working area depth
4.1 Spatial distribution of dynamic stress in the subgrade
Based on the established theoretical calculation model, the spatial distribution patterns of the three-dimensional dynamic stress in the subgrade were studied under different pavement thicknesses and vehicle axle loads. Considering the speed limit regulations for heavy vehicles in China, the vehicle speed was set to the maximum limit of 100 km/h. In the analysis of the influence of vehicle axle load, the axle load (P) was set to 100 kN, 150 kN, 200 kN, and 250 kN, where 100 kN corresponds to the standard axle load for vehicles as specified in the Specifications for Design of Highway Asphalt Pavement. The pavement thickness was set to 0.72 m, corresponding to a typical semi-rigid base pavement structure. The variation in stress components in the subgrade with depth under different vehicle axle loads is shown in Figure 5. In the analysis of the influence of pavement thickness, considering flexible base, semi-rigid base, and other composite pavement structures, the pavement thicknesses were selected as 0.5 m, 0.6 m, 0.75 m, and 0.9 m. The vehicle axle load was set to the standard axle load of 100 kN, and the calculation results are shown in Figure 6.
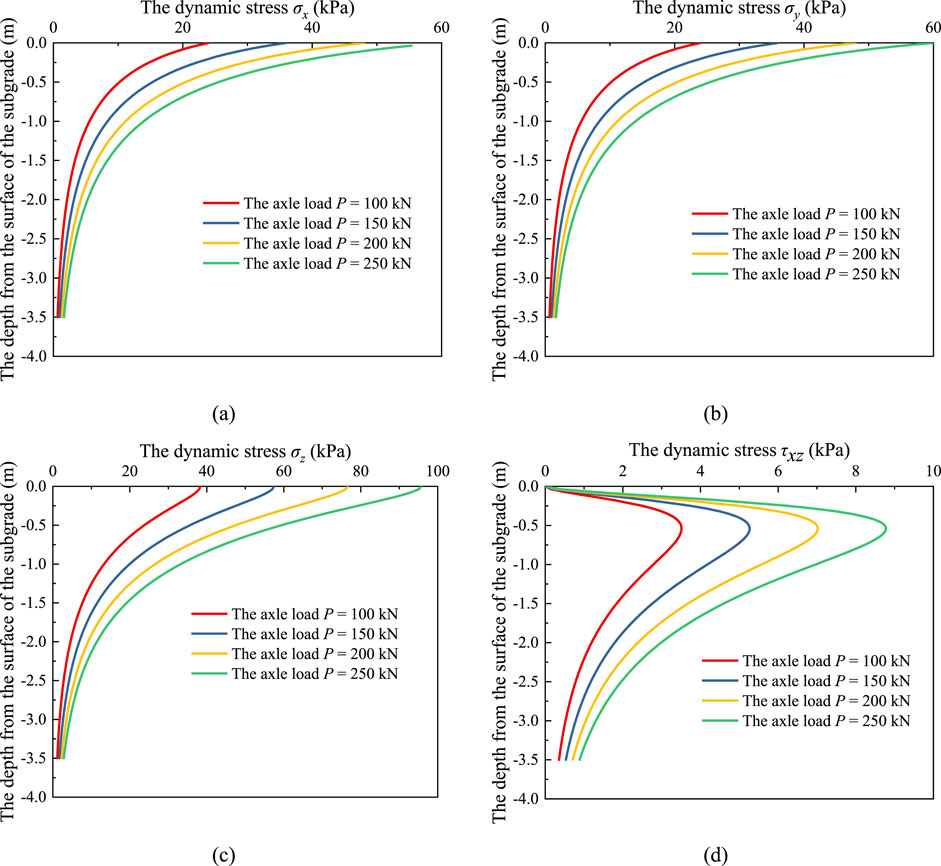
Figure 5. Distribution of dynamic stress of the subgrade under different axle loads: (A) σx, (B) σy, (C) σz, and (D) τxz.
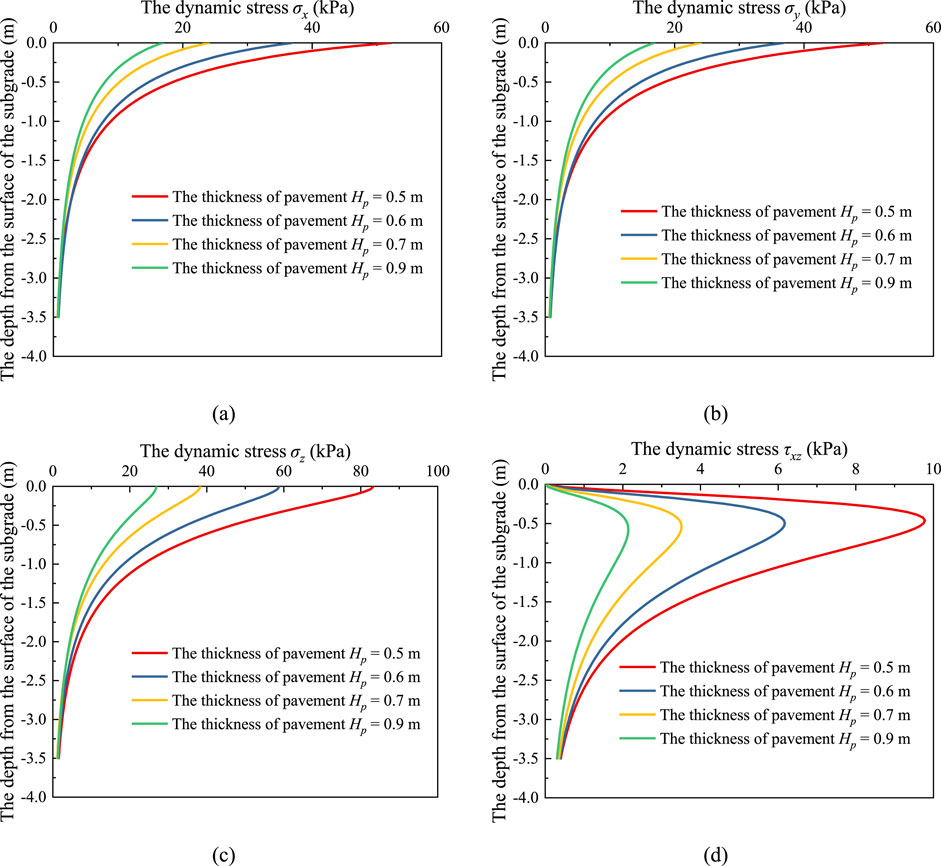
Figure 6. Distribution of dynamic stress of the subgrade under different pavement thicknesses: (A) σx, (B) σy, (C) σz, and (D) τxz.
As shown in Figures 5, 6, at the same subgrade depth, the dynamic stresses (σx, σy, σz, and τxz) all increase significantly with the increase in the vehicle axle load. Conversely, as the pavement thickness increases, the dynamic stresses (σx, σy, σz, and τxz) decrease significantly. Additionally, the curves of the dynamic stresses (σx, σy, σz, and τxz) along the depth direction tend to converge toward a common point. This indicates that as the vehicle axle load increases and the pavement thickness decreases, the attenuation of the peak values of the dynamic stresses (σx, σy, σz, and τxz) along the subgrade depth increases.
4.2 Working-area depth of the subgrade
Lu et al. (2013) determined the depth of the subgrade working area based on the layer where the ratio of additional stress induced by wheel load to the self-weight stress of the subgrade soil is between 1/10 and 1/5. This criterion is then used to determine the thickness of the subgrade.
Based on the established dynamic model, numerical calculations of vertical dynamic stress in the subgrade were conducted under various conditions. The calculations primarily focused on the influence of pavement thickness and vehicle axle load on the working area depth of the subgrade.
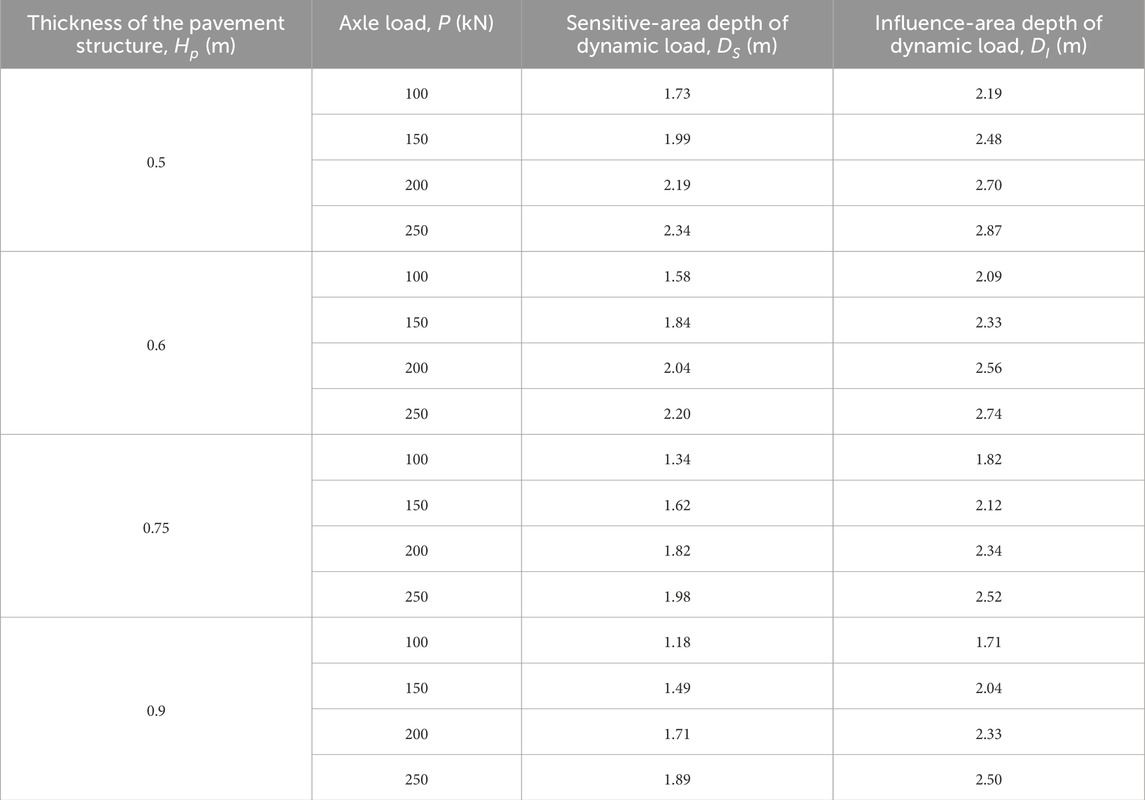
Additionally, in this study, we further divide the subgrade working area under vehicular load into two zones: the sensitive-area depth of dynamic load and the influence-area depth of dynamic load. These correspond to the ratios of additional stress induced by traffic load to the self-weight stress of the subgrade soil being 1/5 and 1/10, respectively. The calculation results are shown in Figure 7. The results indicate that both the sensitive-area depth and influence-area depth of dynamic load are positively correlated with vehicle axle load and negatively correlated with pavement thickness.
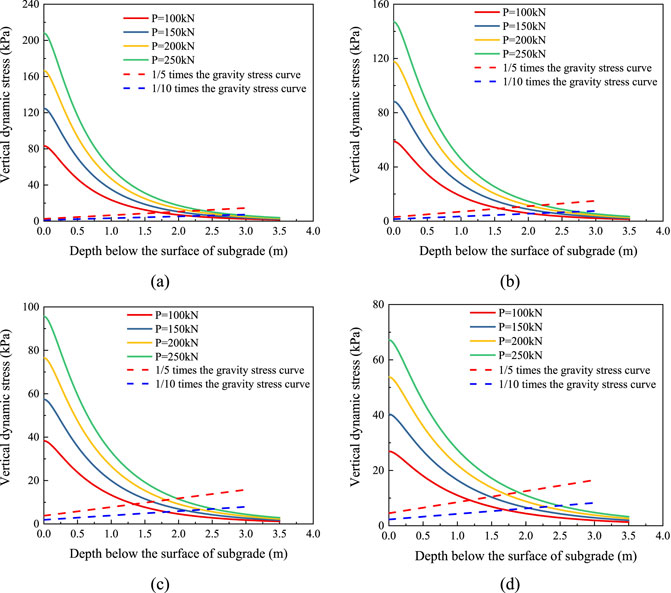
Figure 7. Division of subgrade work depth: (A) Hp = 0.5 m, (B) Hp = 0.6 m, (C) Hp = 0.75 m, and (D) Hp = 0.9 m.
For example, referring to Figure 7A, when the vehicle axle load is 150 kN, 200 kN, and 250 kN, the sensitive-area depth is 1.992 m, 2.190 m, and 2.345 m, respectively. This represents an increase of approximately 15.1%, 26.5%, and 35.4% compared to the sensitive-area depth (1.732 m) for the standard axle load of 100 kN. The influence-area depth of dynamic load is 2.477 m, 2.697 m, and 2.874 m for vehicle axle loads of 150 kN, 200 kN, and 250 kN, respectively. This corresponds to increases of approximately 13.3%, 23.4%, and 31.5% compared to the influence-area depth of dynamic load (2.186 m) for the standard axle load of 100 kN. It can be seen that compared to the standard axle load, the influence depth of dynamic stress on the subgrade under heavy-traffic loads significantly increases, with a more pronounced effect on the sensitive-area depth of dynamic loads. For a vehicle axle load of 250 kN, when the pavement thickness is 0.5 m, 0.6 m, 0.72 m, and 0.9 m, the sensitive-area depth of dynamic load is 2.345 m, 2.199 m, 1.983 m, and 1.893 m, respectively. Compared to the pavement thickness of 0.5 m, these depths are reduced by approximately 6.2%, 15.4%, and 19.2%, respectively. The influence-area depth of dynamic load is 2.874 m, 2.737 m, 2.517 m, and 2.498 m, respectively. Compared to the pavement thickness of 0.5 m, these depths are reduced by approximately 4.7%, 12.4%, and 13.1%, respectively. It can be observed that changes in pavement thickness have a more significant impact on the sensitive-area depth of dynamic loads. The sensitive-area depth of dynamic loads and the influence-area depth of dynamic load under various conditions are listed in Table 4.
To facilitate the design of heavy-load highway-subgrade working areas, predictive expressions for the sensitive-area depth of dynamic loads and the influence-area depth of dynamic load were derived using the above theoretical calculation results, with pavement thickness and vehicle axle load as variables. These expressions are given by Equations 58, 59. The prediction accuracy of the proposed expressions is shown in Figure 8, with statistical precision R2 values all greater than 0.99, as shown in Figure 8.
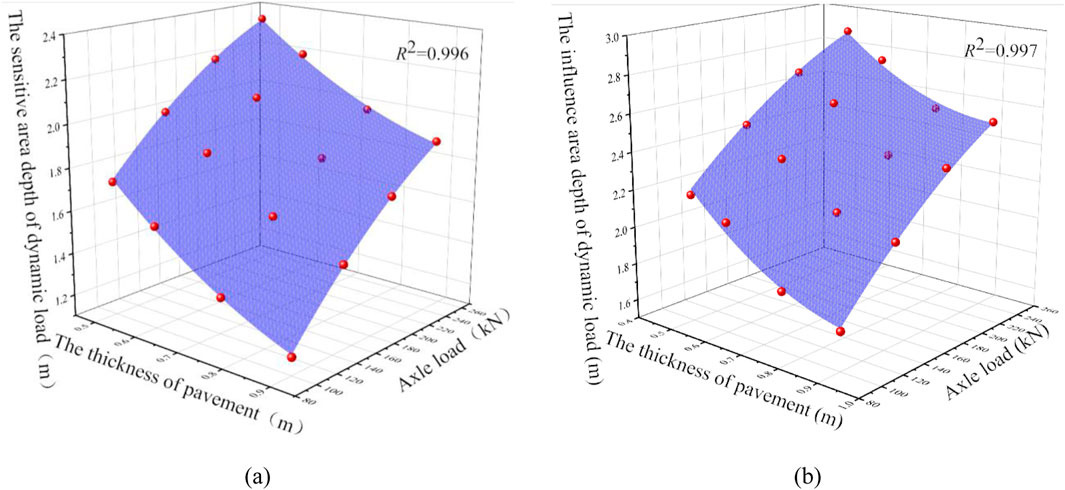
Figure 8. Validation of the fitting of the subgrade work-area depth: (A) sensitive-area depth and (B) influence-area depth.
where DS and DI represent the depths of the sensitive-area depth and the influence-area depth of dynamic load, respectively, P is the vehicle axle load, and Hp is the pavement thickness.
5 Conclusion
A dynamic theoretical model for heavy vehicle–pavement–unsaturated subgrade coupling was established, providing a semi-analytical solution and numerical methods for the three-dimensional dynamic response of a silt subgrade under heavy-vehicle loads. Subsequently, the effectiveness of the theoretical model was validated through field tests measuring the three-dimensional dynamic stress in a highway subgrade. Finally, based on the theoretical model, the spatial distribution characteristics of dynamic stress and the evolution of the working-area depth in a heavily loaded silt subgrade were elucidated. The main conclusions are as follows:
(1) The governing equations for an unsaturated porous elastic foundation were derived, and a three-dimensional dynamic theoretical model was established for the coupling of heavy vehicles, pavement, and unsaturated subgrade.
(2) At the same subgrade depth, dynamic stresses (σx, σy, σz, and τxz) significantly increase with an increase in vehicle axle load, while these stresses decrease notably as pavement thickness increases. Additionally, as vehicle axle load increases and pavement thickness decreases, the attenuation of the peak values of dynamic stresses (σx, σy, σz, and τxz) along the subgrade depth becomes more pronounced.
(3) The traditional subgrade working area can be divided into dynamic load-sensitive area and influence area. The depths of both areas are positively correlated with vehicle axle load and negatively correlated with pavement thickness. Additionally, changes in vehicle axle load and pavement thickness have a more significant impact on the depth of the sensitive area of dynamic load.
In this study, we can provide a theoretical basis for calculating the working zone depth in subgrade structure design. Currently, subgrade structure design only considers the working zone depth without further accounting for the depth of the dynamic load-sensitive zone and the depth of the dynamic load-impact zone. Improvements to the design methodology should be further discussed and researched.
Data availability statement
The original contributions presented in the study are included in the article/Supplementary Material; further inquiries can be directed to the corresponding authors.
Author contributions
YL: writing–original draft and writing–review and editing. YD: formal analysis, writing–original draft, and writing–review and editing. LL: investigation, software, and writing–original draft. JZ: formal analysis, resources, and writing–review and editing. JH: data curation and writing–original draft. XZ: writing–original draft. QJ: funding acquisition, resources, visualization, and writing–original draft. CT: formal analysis and writing–original draft. XL: investigation, software, and writing–original draft. XZ: conceptualization and writing–original draft.
Funding
The author(s) declare that financial support was received for the research, authorship, and/or publication of this article. This work was supported by the National Natural Science Foundation of China (Nos 52027813, 52178429, 51778346, and 52408465), the Postdoctoral Science Foundation (No. 2024M753850), the Postdoctoral Innovative Talent Support Program (No. BX20240451), and the Shandong Postdoctoral Science Foundation (No. SDCX-ZG-202400189).
Conflict of interest
Authors YL, LL, JZ, and JH were employed by Shandong High-Speed Infrastructure Construction Corp Ltd.
The remaining authors declare that the research was conducted in the absence of any commercial or financial relationships that could be construed as a potential conflict of interest.
Publisher’s note
All claims expressed in this article are solely those of the authors and do not necessarily represent those of their affiliated organizations, or those of the publisher, the editors, and the reviewers. Any product that may be evaluated in this article, or claim that may be made by its manufacturer, is not guaranteed or endorsed by the publisher.
References
Ai, Z. Y., and Ye, Z. (2021). Extended precise integration solution to layered transversely isotropic unsaturated poroelastic media under harmonically dynamic loads. Eng. Anal. Bound. Elem. 122, 21–34. doi:10.1016/j.enganabound.2020.10.007
An, L., Zhang, F., Geng, Y., and Lin, B. (2018). Field measurement of dynamic compressive stress response of pavement-subgrade induced by moving heavy-duty trucks. Shock Vib. 2018. doi:10.1155/2018/1956906
Biot, M. A. (1962). Mechanics of deformation and acoustic propagation in porous media. J. Appl. Phys. 33, 1482–1498. doi:10.1063/1.1728759
Cai, Y., Cao, Z., Sun, H., and Xu, C. (2009). Dynamic response of pavements on poroelastic half-space soil medium to a moving traffic load. Comput. Geotech. 36, 52–60. doi:10.1016/j.compgeo.2008.03.007
Cai, Y., Chen, Y., Cao, Z., Sun, H., and Guo, L. (2015). Dynamic responses of a saturated poroelastic half-space generated by a moving truck on the uneven pavement. Soil Dyn. Earthq. Eng. 69, 172–181. doi:10.1016/j.soildyn.2014.10.014
Chen, Z. H. (2014). On basic theories of unsaturated soils and special soils. Chin. J. Geotech. Eng. 36, 201–272. doi:10.11779/CJGE201402001
Chu, X., Dawson, A., Thom, N., Chen, H., and Qin, L. (2024). Permanent deformation characteristics of unsaturated subgrade soils under cyclic loading. Case Stud. Constr. Mater. 20, e03099. doi:10.1016/j.cscm.2024.e03099
Cui, X., Du, Y., Bao, Z., Xiao, Y., Hao, J., Li, X., et al. (2023a). Field evaluation of the three-dimensional dynamic stress state of the subgrade induced by the heavy-haul train load. Transp. Geotech. 38, 100903. doi:10.1016/j.trgeo.2022.100903
Cui, X., Du, Y., Hao, J., Bao, Z., Jin, Q., Li, X., et al. (2023b). Three-dimensional spatial stress state of highway subgrade under vehicle load: experimental evidence and evaluation model. Int. J. Pavement Eng. 24, 1–18. doi:10.1080/10298436.2023.2268795
Cui, X., Li, X., Hao, J., Wang, Y., Bao, Z., Du, Y., et al. (2022). Dynamic response of unsaturated poroelastic ground underlying uneven pavement subjected to vehicle load. Soil Dyn. Earthq. Eng. 156, 107164. doi:10.1016/j.soildyn.2022.107164
Eason, G. (1965). The stresses produced in a semi-infinite solid by a moving surface force. Int. J. Eng. Sci. 2, 581–609. doi:10.1016/0020-7225(65)90038-8
Henchi, K., Fafard, M., Talbot, M., and Dhatt, G. (1998). An efficient algorithm for dynamic analysis of bridges under moving vehicles using a coupled modal and physical components approach. J. Sound. Vib. 212, 663–683. doi:10.1006/jsvi.1997.1459
Lefeuve-Mesgouez, G., Peplow, A. T., and Le Houédec, D. (2002). Surface vibration due to a sequence of high speed moving harmonic rectangular loads. Soil Dyn. Earthq. Eng. 22, 459–473. doi:10.1016/S0267-7261(02)00034-9
Lei, H., Zhang, J. F., Qian, J. G., Dai, Y. C., and Shen, J. (2023). Dynamic shakedown limits of the pavement on saturated subgrade subjected to traffic rolling-sliding loading. Comput. Geotech. 163, 105743. doi:10.1016/j.compgeo.2023.105743
Levin, F. C., Back, M., Vogt, S., and Cudmani, R. (2022). Experiment-based estimation of the settlement potential due to dynamic loads from heavy vehicle traffic on the A 44n motorway built on the dump of the Garzweiler opencast mine. Transp. Geotech. 32, 100674. doi:10.1016/j.trgeo.2021.100674
Lin, P., Tang, L., and Ni, P. (2019). Field evaluation of subgrade soils under dynamic loads using orthogonal earth pressure transducers. Soil Dyn. Earthq. Eng. 121, 12–24. doi:10.1016/j.soildyn.2019.03.001
Lu, J. F., and Jeng, D. S. (2007). A half-space saturated poro-elastic medium subjected to a moving point load. Int. J. Solids Struct. 44, 573–586. doi:10.1016/j.ijsolstr.2006.05.020
Lu, Z., Fang, R., Yao, H., Dong, C., and Xian, S. (2018a). Dynamic responses of unsaturated half-space soil to a moving harmonic rectangular load. Int. J. Numer. Anal. METHODS Geomech. 42, 1057–1077. doi:10.1002/nag.2780
Lu, Z., Hu, Z., Yao, H. L., and Liu, J. (2018b). Field evaluation and analysis of road subgrade dynamic responses under heavy duty vehicle. Int. J. Pavement Eng. 19, 1077–1086. doi:10.1080/10298436.2016.1240560
Lu, Z., Wang, C. B., Fu, J. J., and Zhan, Y. X. (2013). Research on influence depth of road subgrade induced by vehicle loads. Yantu Lixue/Rock Soil Mech. 34, 316–322. doi:10.16285/j.rsm.2013.02.030
Lu, Z., Yao, H., Liu, J., and Hu, Z. (2014). Dynamic response of a pavement-subgrade-soft ground system subjected to moving traffic load. J. Vibroengineering 16, 195–209.
Lyu, Z., Qian, J., Shi, Z., and Gao, Q. (2020). Dynamic responses of layered poroelastic ground under moving traffic loads considering effects of pavement roughness. Soil Dyn. Earthq. Eng. 130, 105996. doi:10.1016/j.soildyn.2019.105996
Tang, C., Lu, Z., Yao, H., Guo, S., and Han, Y. (2021a). Vibration characteristics of unsaturated runways under moving aircraft loads. Int. J. Struct. Stab. Dyn. 21, 2150065. doi:10.1142/S0219455421500656
Tang, C., Lu, Z., Yao, H., Guo, S., Huang, X., and Liu, J. (2021b). Semianalytical solution for dynamic responses of railway track system on unsaturated poroelastic half-space subjected to moving trainload. Int. J. Geomech. 21, 04021016. doi:10.1061/(asce)gm.1943-5622.0001955
Keywords: highway subgrade, dynamic response, working area depth, vehicle loads, theoretical model
Citation: Li Y, Du Y, Liu L, Zhang J, Hao J, Zhang X, Jin Q, Tian C, Li X and Zhang X (2024) Influence depth of highway subgrade under heavy vehicle loads based on a theoretical model. Front. Built Environ. 10:1497868. doi: 10.3389/fbuil.2024.1497868
Received: 18 September 2024; Accepted: 23 October 2024;
Published: 08 November 2024.
Edited by:
Wei Guo, Tianjin University, ChinaReviewed by:
Weibin Chen, University of Macau, ChinaFayun Liang, Tongji University, China
Marian Drusa, University of Žilina, Slovakia
Copyright © 2024 Li, Du, Liu, Zhang, Hao, Zhang, Jin, Tian, Li and Zhang. This is an open-access article distributed under the terms of the Creative Commons Attribution License (CC BY). The use, distribution or reproduction in other forums is permitted, provided the original author(s) and the copyright owner(s) are credited and that the original publication in this journal is cited, in accordance with accepted academic practice. No use, distribution or reproduction is permitted which does not comply with these terms.
*Correspondence: Yefeng Du, NzgxMjUwMDM2QHFxLmNvbQ==; Xiangyang Li, MTEzNDIzNjA5OEBxcS5jb20=
 Yuexiang Li1
 Yefeng Du
 Jianwen Hao