- 1Institute of Hydraulic Engineering and Water Resources Management, RWTH Aachen University, Aachen, Germany
- 2Leichtweiß-Institute for Hydraulic Engineering and Water Resources, Technische Universität Braunschweig, Braunschweig, Germany
- 3Coastal Research Center, Joint Research Institute of Leibniz University Hannover and Technische Universität Braunschweig, Hannover, Germany
German coastal areas are often protected from flood events by a primary sea dike line of more than 1,200 km. Many transition areas, such as the change of surface covering materials and other dike elements such as stairs, fences, or ramps at intermittent locations, characterize the stretch of this sea dike line. During storm surges and wave overtopping, the onset of damage, especially dike cover erosion, is often initiated at these transitions due to locally disturbed flow characteristics, increased loads, and reduced strength at the interface. An in-depth understanding of damage initiation and building stock conditions along coastlines as a foundational element of a flood cycle is essential in order to accurately assess existing defense structures, both deterministically and probabilistically. Thus, the present study is motivated to examine the variety of transition areas on the sea dikes along the German coasts, for further assessment of probability of their damage and failure. A novel remote inventory was elaborated manually, based on satellite images for a length of 998 km along the German North Sea and 123 km along the German Baltic Sea coast and estuaries, and it shows the spatial distribution and frequency of such transitions on sea dikes. During additional on-site investigations at different locations at the coast, detailed information about design variants of dike elements as well as damage to transitions were recorded and reported systematically. The results of the on-site investigations allow the development of a damage catalog in relation to transitions and the validation and verification of the remote inventory. By categorizing and spatially analyzing a large number of transitions (n ≈ 18,300) and damages along the coast, particularly vulnerable transitions and hot spots of loading can be further investigated regarding the flow-structure-soil interaction. Through this, structural layouts and material combinations can be optimized for the design of sea dikes.
1 Introduction
Sea dikes serve to protect the low-lying hinterlands from flooding. Unlike other countries, in Germany, coastal protection of the mainland consists mainly of sea dikes. More than 1,200 km of sea and estuarine dikes serve as technical flood protection for the German North Sea and Baltic Sea coast in case of storm surges (Schüttrumpf, 2008). Therefore, planning, structural implementation, maintenance and repair of sea dikes have to be designed for the expected loads, especially also considering the intensifying coastal hazards due to climate change (e.g., sea level rise and increasing intensity of storm surges), as their functionality is a critical protection measure at any time (Oppenheimer, 2019; NLWKN, 2007; Simm et al., 2021).
The German standard green sea dike design and construction method comprises a sandy dike core, clay or marl sealing layer, and a vegetated top layer (EAK, 2007). However, it does not remain with this homogeneous structure. To meet different demands and functions on the coastal protection structure, typical green sea dikes are characterized by many heterogeneities of material and/or geometrical changes as well as dike elements on the structure (Figure 1). Revetments, for example, are added for protection against hydraulic loads, dike paths and ramps for dike maintenance and defense, stairs, benches, or signage for touristic purposes, and sluices, barrages or other hydraulic engineering structures for drainage and storm surge protection. Those transition areas represent potential weak points in a dike’s structure. Reduced strength combined with increased loads in contact and transition areas showed in past storm surges that the onset of damage in the form of erosion often started at these locations (Pilarczyk, 1995; Schüttrumpf and Oumeraci, 2004; Tourment et al., 2012; Simm et al., 2021; van Bergeijk et al., 2022). Especially wave overtopping caused damage to structures in and on the dike in form of erosion scour and gullies (Kolb et al., 1962) and is also one of the most frequent causes of dike failures (EurOtop, 2018).
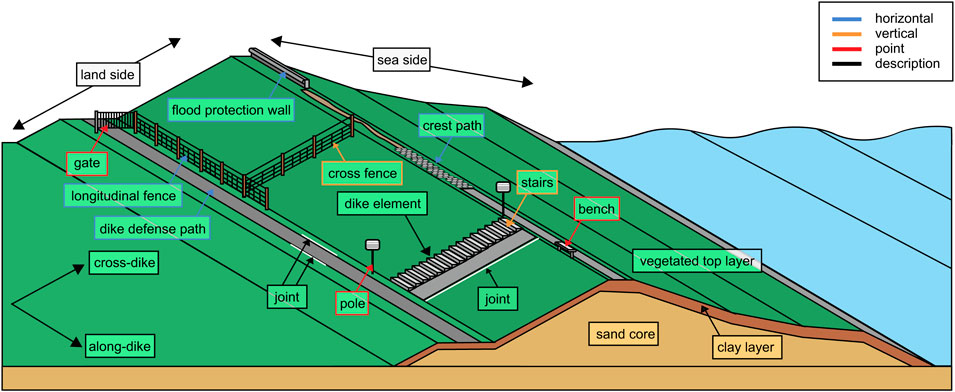
Figure 1. Schematic representation of dike structure, description of used terms and various transitions on a sea dike categorized in horizontal, vertical and point transitions.
Although transition areas constitute a large part of the dike structure and have been identified as a central weak point for damage initiation in past storm surges, these elements are not clearly defined in the literature, nor are they given importance in the relevant regulations, recommendations, and manuals for national and international river and sea dikes. There is no clear and universal term addressing transitions. A distinction is made between dike elements, which are automatically characterized by many transitions to other surfaces, and the specific transition area as a point or line between two dike elements. Besides the term transitions, dike elements (EAK, 2007) like stairs or pasture fences are called installations (Schüttrumpf and Oumeraci, 2004), structures (CIRIA, 2013; Tourment et al., 2012), obstacles (EurOtop, 2018; Hoffmans et al., 2018), obstruction (EurOtop, 2018), flow-blocking objects (Hoffmans et al., 2018), encroachments (CIRIA, 2013), non-water-retaining structures (Verheij et al., 2012) or dike furniture/facilities (van der Meer and Calle, 2012). Sometimes, they are even called non-dike elements because they do not serve flood protection, making an element’s function an essential factor to consider. The interfaces between the dike earthwork and any element from curbstones to stairs are called joints (Pilarczyk, 1995) or connections (van der Meer and Calle, 2012; van Steeg and van Hoven, 2013b). Most dike elements, called transitions in this study, have more than one linear joint to the surrounding (vegetated) top layer. A dike defense path, for example, is one linear dike element but has two linear joints, one between the grass revetment and the road surface and another one from the road surface back to the grass revetment (Figure 1). In addition to dike elements, geometric changes such as height differences or changes in slope inclination can also be regarded as transitions (van Bergeijk, 2022). The definition of a transition for the study is, therefore, any form of change in the dike in terms of materials and cover layers or geometry, such as slope changes and elevations.
Derived from and based on previous approaches for categorization of dike features (van Steeg and van Hoven, 2013b), the transitions are classified due to orientation relative to the dike as well as their location on the dike in this study, which enables the division of all differentiated dike elements into horizontal, vertical and point transitions on the seaward side, crest or landward side (Figure 1). This categorization may later also allow the development of simple recommendations to planners and maintainers of dikes in a practicable way, since the countermeasures will be applied in the influence areas of the same orientation around these transitions. The interface used for orientation relative to the dike is always the one that has the longest incision into the grass cover and is, therefore, the most vulnerable location of damage due to attack of the wave. Stairways, for example, have a significantly greater extension in the cross-dike direction than in the along-dike direction, so these are classified as vertical transitions.
1.1 Approaches to preventive design of transitional areas
The recommendations for the geometric and structural design of sea dikes in Germany (as well as in other countries) are issued by the federal state and are often based on empirical values, mostly combining traditional experience and evidence from experimental modelling (EAK, 2007; Schüttrumpf, 2008). While there is a DIN standard for river dikes in Germany (DIN 19712, 2013), coastal dikes are only covered by a non-binding manual with recommendations (EAK, 2007), which do not contain detailed information about transitions. There are some design notes and construction sketches for toe protections, but especially for dike elements located on the crest and landward side of the dikes, such as dike ramps, dike walkways or closure gates, the design stipulations are primarily limited to aspects such as position, elevation, slope angle, width, thickness and spacing of the elements. If other construction sectors, such as road or path construction works, are involved to add elements to the earthworks of a dike body, reference is usually made to road construction guidelines and guidelines for path construction (DIN 19712, 2013; EAK, 2007). Specific recommendations for joining the dike body with dike elements in order to minimize or prevent damage processes that frequently occur at the interface of these areas are usually missing. Here, it is noted that the overall dike system can only be as strong as the weakest section (Pilarczyk, 1995), which makes vulnerable transition areas essential for consideration in design.
As a general principle, transitions should be avoided as far as possible (Pilarczyk, 1995; Schüttrumpf and Oumeraci, 2004; EAK, 2007; DIN 19712, 2013; Tourment et al., 2012; Kolb et al., 1962). If this is not possible, the rule for systems adjacent to a transition is that the same or higher resistance and reliability should be present to avoid system vulnerabilities (Pilarczyk, 1995; Tourment et al., 2012). Several options are available to achieve this design goal. The load on the transition can be reduced, the strength can be increased, or residual strengths in the area of the transition can prevent the failure of the dike (van Steeg and van Hoven, 2013a). This could be achieved by overprofiles, optimized materials or thicker and better clay quality layers. Tourment et al. (2012) state possible problems and solutions for some main types of transitions like linear and non-linear as well as revetments or flood walls. These general solutions mainly include adapted drainage, filtration, sealing, improved stability and smooth geometric and rough transitions between structures.
Existing constructive measures involve reinforcement by thickened or grouted cover layers and concrete edge strips or boards along the structure (Pilarczyk, 1995; EAK, 2007). The design of a transition roughness for the transition from hard to grass surface layers through, e.g., open cell blocks or open block mats is also proposed (Pilarczyk, 1995; TAW, 1992). For grouted riprap revetments, recommendations are provided for the design from solid structures or fully grouted to partially or unbounded armored stone (MAV, 2017). As needed, ground reinforcement in the form of honeycomb or grid panels as well as geogrids for tensile stress protection is suggested for connecting asphalt or concrete block pavement dike crest paths to the green dike crest edge (EAK, 2007). Further design aspects of transition structures, including design sketches especially for toe protection with crushed stone, grass, asphalt and gravel, can be found in TAW (1992). For internal transitions from stiff structures to earthen embankments such as dike gates, the roughening or painting of concrete with adhesive compounds such as bituminous paint is recommended to increase contact between fill material and concrete and prevent lateral seepage (CIRIA, 2013). The transition from a dike to a flood control wall is asked to be constructed with slope protection like concrete slope paving, grouted riprap or concrete erosion mats, as well as integration of the wall inside the dike (CIRIA, 2013; Tourment et al., 2012). Flowable, non-shrink grouts can be applied to prevent internal erosion between two materials (CIRIA, 2013). For levelling out transitions in elevation, it is proposed to utilise non-erodible materials such as asphalt, to reduce the transitions height, or to increase the resistance of the grass revetment by grass concrete blocks, elastocoast, or geogrids (van Bergeijk, 2022). In particular, when constructing transitions, attention should also be paid to the feasible maintenance of the areas (van Bergeijk, 2022). While existing approaches are loosely prescribed in a number of grey literature or have emerged in first publications, a thorough review on and evidence for best-practice structural design guidelines for transition areas in sea dikes remains unavailable. In particular, it remains unknown how well the design solutions fare in actual loading conditions as no experimental or observational evidence exists.
1.2 Conducted tests and damage mechanisms associated with transitions
Damage mechanisms of dikes have already been considered in several studies (Le et al., 2017; Piontkowitz et al., 2009). This work, hence, only considers relevant damage mechanisms observed in association with transitions on green sea dikes. A differentiation between primary and secondary effects regarding stability and damage associated with transitions has proven useful (van Steeg et al., 2015). The primary effects that influence damage to transitions include hydraulic loads caused, for example, by wave impact, wave run-up or wave overtopping. Secondary effects at transitions occur through the construction process, maintenance, animal activity or tourist use. These secondary effects can reduce the strength of the sea dike at transitions (Hoffmans et al., 2018; Simm et al., 2021) and when the hydraulic action exceeds the surface layer’s resistance force, erosion begins. The presence of transition zones has the effect of both increasing the hydraulic load (due to increased turbulence, jet impacts, concentrated discharges/blockages of the flow or increased shear stresses at the transitions) and reducing the strength of the surface layer. Collectively, this can result in a net increase in erosion (van Bergeijk, 2022).
Several in-situ experiments on wave overtopping, wave run-up as well as wave impacts on existing dikes in the Netherlands and Vietnam have focused on transitions in the last decade (Verheij et al., 2012; Steendam et al., 2014). The in-situ experiments give further evidence that the onset of erosion is often initiated at transitional areas. Using the Wave Overtopping, Wave Run-up and the Wave Impact Simulator, different hydraulic loads on the dike were tested (van der Meer et al., 2010; Steendam et al., 2011; Trung, 2014; van Steeg and van Hoven, 2013a; Verheij et al., 2012; Steendam et al., 2012; van Steeg et al., 2015). A brief overview of some of the previous in-situ experiments focusing on transitions on dikes, along with the observed damage patterns, is given in Table 1.
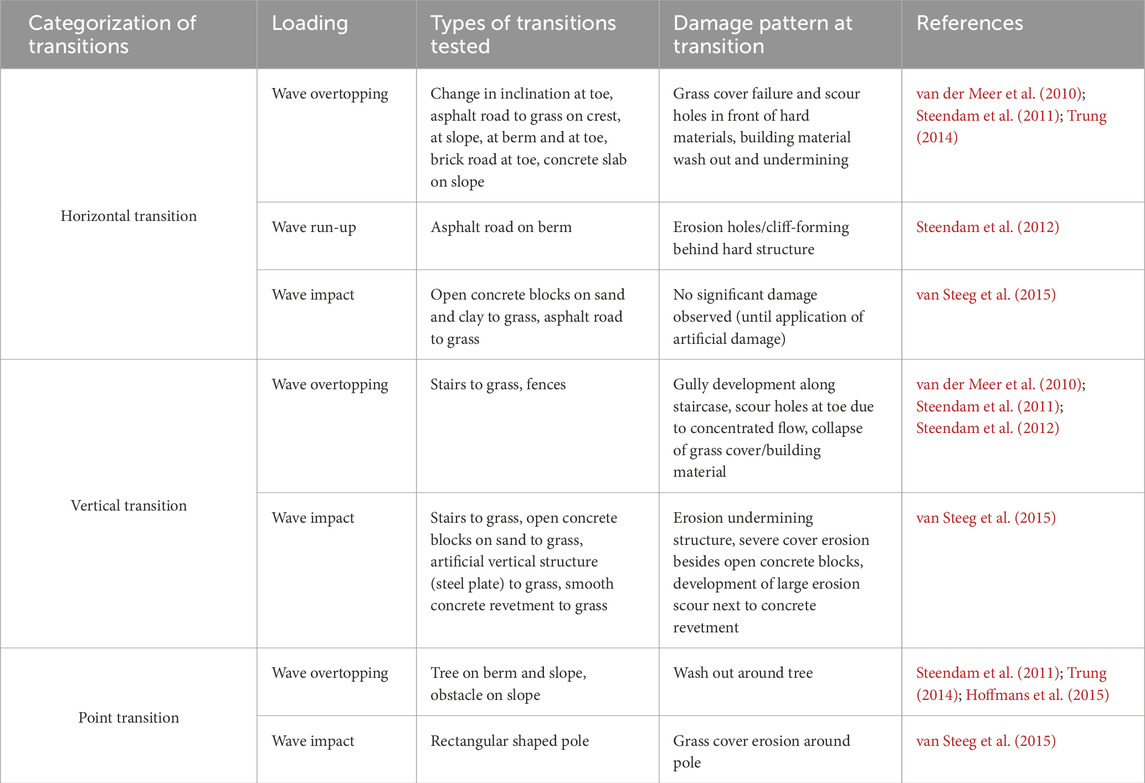
Table 1. Overview of previously conducted in-situ tests as reviewed in this work, categorized by vertical, horizontal and point transitional areas, as defined in Figure 1.
The damage mechanisms associated with transitions are primary surface erosion and scour hole forming. The damage develops in the same direction as the transition on the dike. Horizontal transitions such as paths cause damage in the along-dike direction, while vertical transitions such as stairs show the development of erosion gullies in the cross-dike direction. The tests with point transitions show damage in their vicinity. The area of influence of the damage caused by transitions is therefore an important indicator for optimally strengthening transitions through measures.
For the overtopping tests, which have been most in the research focus, one of the main observations was that the horizontal transition, in particular the slope change from the landward slope to the horizontal berm or hinterland, is a weak point for erosion in the dike cross-section. Since this geometrical transition exists for every dike, erosion and eventually scour holes occur regardless of the degree of mounting of the horizontal. The geometric change in the dike is considered one of the most critical for damage initiation (van der Meer et al., 2010; Verheij et al., 2012). Smoothening the changes in inclination (EAK, 2007) and a gradual change can reduce the stresses (van Bergeijk, 2022). However, the exact gradation during a change of inclination to reduce damage is still unknown.
As a result of the aforementioned literature review, it has become evident that the effect of transitional areas on dike structures have not been sufficiently studied. Amongst the current lack of knowledge, the following items have come to the focus: (a) there is neither a standardized description of transitions nor a qualitative and quantitative overview of existing transitions on sea dikes along the German coast, (b) best-practice design guidelines for transition areas are not available nor is there proof of countermeasures for optimized construction of material boundaries at transitions to prevent erosion, and (c) only a limited amount of conducted studies regarding overtopping currents interaction with transitional areas on the landward slope of sea dikes exists, and there is even less information on the seaward transitional areas.
In light of the identified knowledge gaps, this work addresses the main objective to build and analyze a comprehensive inventory of transitional areas on sea dikes in Germany and their statistical distribution of transition categories. The specific scope of this work includes: (a) to collate and classify transitional areas on sea dikes, (b) to understand their statistical distribution along the German coast, and (c) to analyze potential damage patterns at them for further improvement of weak points.
2 Materials and methods
2.1 Study area
For this study, all German main sea dikes and estuarine dikes were investigated, using remote-sensing material with satellite and aerial imagery. Dikes in the second protection line and regional dikes as per German administrative classification were neglected for the analysis. Germany’s sea dikes and estuarine dikes are distributed across five federal states. The longest dike sections are located in the provinces Lower Saxony and Schleswig-Holstein (Figure 2).
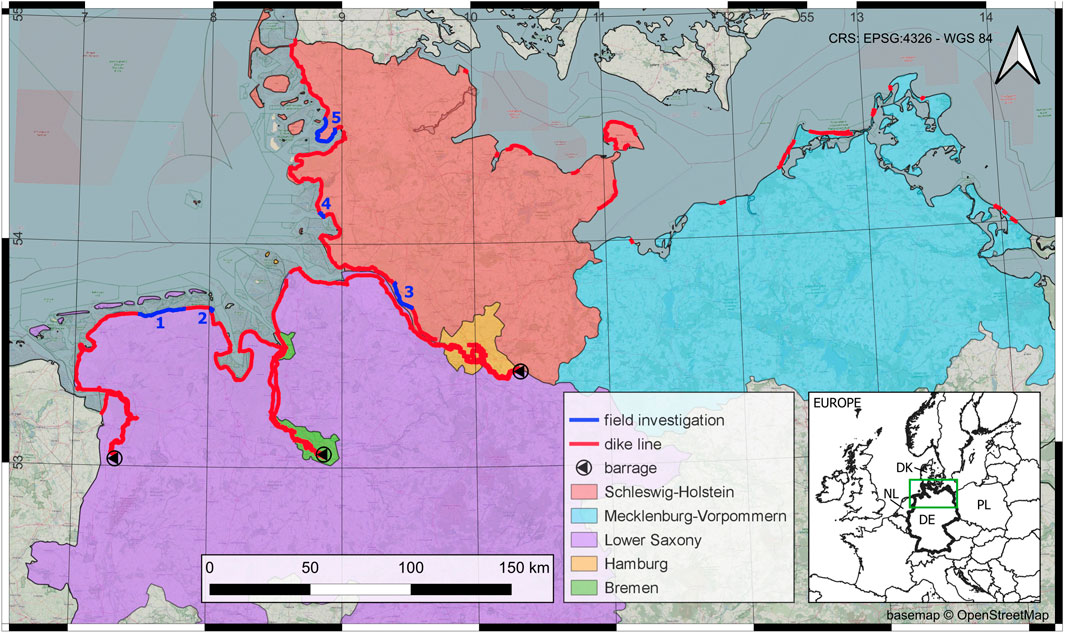
Figure 2. Study area of remote inventory and field investigations with field campaign number according to Table 2 (basemap: www.openstreetmap.org/copyright; dike line Lower Saxony: Niedersächsischer Landesbetrieb für Wasserwirtschaft, Küsten- und Naturschutz (NLWKN); dike line Schleswig-Holstein: Landesbetrieb für Küstenschutz, Nationalpark und Meeresschutz Schleswig-Holstein (LKN.SH)).
Overall, an almost continuous 998 km long dike line was investigated for the remote inventory at the North Sea coast and estuaries. The investigation of the tidal river dikes extended to the tidal limit of the rivers that are regulated by tidal barrages. The tidal limit of the river Elbe is at the barrage in Geesthacht (N53.425139°, E10.336389°), the limit of the Weser at the Bremen Weser weir (N53.060413°, E8.864702°) and the limit of the Ems at the Herbrum weir (N53.031731°, E7.314145°). The total length of the main sea dikes on the outer Baltic Sea coast was 123 km. In contrast to the North Sea coast, the dike line on the Baltic Sea coast is very fragmented and not continuous due to the change of steep and flat coasts. Coastal protection at the flat coasts does not only consist of dikes but also of dunes and the combination of dunes and coastal forests in the foreland of dikes (LM MV, 2006; EAK, 2007). Bodden, lagoon and regional dikes on the inland coast of the German Baltic Sea are not included in the analysis. In a cross-sectional perspective, the sea dikes were evaluated from the inland trench to the seaward toe, considering the seaward area of the Wadden sea irrelevant for a closer understanding of the processes during storm surge conditions with high water levels. While the investigation focused on sea dikes with and without foreshores, transitions in the foreland were not incorporated in the analysis.
In order to verify the accuracy of the remotely elaborated inventory data, exemplary on-site investigations at the North Sea coast were carried out at five dike areas. Two of these were located in Lower Saxony and three field visits were conducted in Schleswig-Holstein (Figure 2; Table 2). In two field campaigns of 1 week, a total dike length of about 75 km of the German sea dike line was investigated by in-situ field teams.
2.2 Data sources and collection
The basis for the visual image interpretation and manual mapping of transitions has been satellite and aerial photo data mainly from Google Maps Satellite. Further data was collected by geo-information of the federal states (NLWKN, 2007; MELUND, 2022; LSBG, 2007; LM MV, 2006), and own aerial images generated by a drone.
The Google Maps imagery displays considerable variability in both resolution and age, yet it is also subject to continuous updates. The imagery used for mapping at the German Coast originates from different sources like GeoBasis-DE/BKG (2009), Airbus or Maxar Technologoies who provide resolutions of up to 30 cm (1 image pixel = 30 cm × 30 cm). For every pixel 3-band RGB values are stored.
For the on-site investigations a visual inspection of the dike sections (Table 2) was carried out. Besides the documentation of visual observations using georeferenced photographs (examples in Figures 4–6, Supplementary Appendix Figures S1, S2 with corresponding coordinates in Supplementary Appendix Table S1), some dike sections were investigated by drone-based recordings, and additional laser scans for further geometrical information of different transitions and comparing the results with the remote inventory. Specific dike elements like stairs, fences and paths were recorded to collect sample data of existing construction methods and previous damage at the transitions. Also, construction plans of recently built transitions were evaluated to assess the present design and construction of dike elements.
2.3 Mapping and spatial analysis
Since most installations on the dike are not subject to state authorities, as they usually do not perform any hydraulic engineering tasks in terms of coastal protection, these dike elements are not centrally collected and updated in a geodatabase. Accordingly, all transitions at dikes along the coast were remotely identified and mapped. The dike elements distinguished in the mapping include linear (cross-dike/vertical and along-dike/horizontal) and point transitions. The open-source software QGIS version 3.28.4-Firenze was used as the geographic information system to set up the database of different transitions.
For each type of dike element, a separate shape-layer was created. Point and vertical dike elements were marked as points and all horizontal elements were marked out as lines in QGIS. In addition to the coordinates of the transitions, further attributes in each shape-layer include the location on the dike separated into seaside, crest and landside, and the orientation in case an element can be either vertical or horizontal (like ramps or fences). Seaward transitions are mapped in the area of the dike toe until the crest. Landward transitions are found not only on the slope but also in the hinterland up to the dike trench (Figure 3). Some transitions also extend over the entire cross-section of the dike. Those transitions were mapped as two individual points to fulfill the goal of an evaluation of the most present elements on the dike differentiated according to the different loads. Dike elements that sometimes extend over the entire cross-section are, for example, stairways, ramps, cross fences, bridges, pipes or cross structures.
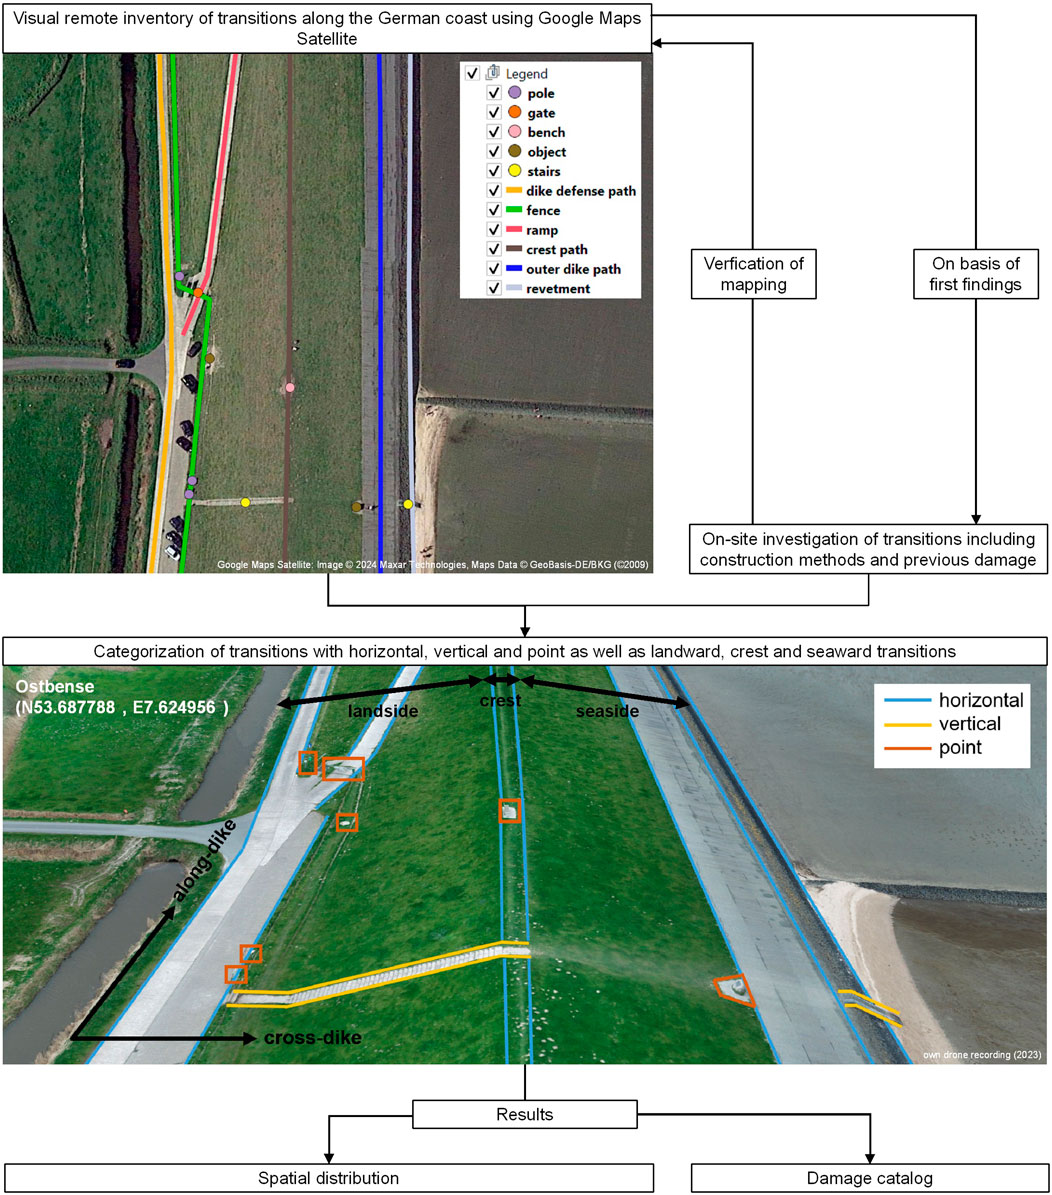
Figure 3. Work flow from identifying and mapping dike elements in the visual remote inventory to the output of the spatial distribution and the damage catalog categorized in horizontal, vertical and point transitions.
The inventory allows a statistical and spatial evaluation of the existing contact and transition areas along the German coast. For the analysis, all horizontal transitions were divided into points with a constant distance of 1 km to be able to make a statement about the average transition density per dike kilometer. Using the QGIS software, the sum of all points could be projected back onto the dike line to visualize a transition density per dike kilometer (find the detailed procedure for the QGIS analysis in the Supplementary Appendix).
Furthermore, the remote sensing data was compared with the observations from the field investigations to validate how well a visual remote identification of the transition types works in a proof of concept. Since only parts of the Coast were investigated on-site, the validation results could be used to provide a rough projection of the actual number of transitions on all German sea dikes.
2.4 Types and categorization of transitions
Transitions can be characterized by different dike elements as well as by the specific contact point between the earthwork and any form of modification. For this analysis, 23 main types of different dike elements were identified.
Point transitions are all elements that are a 3D object and do not have a linear expansion in any direction (cross-dike or along-dike). They have the least contact surface with the earthworks of the dike. Point transitions are distinguished between poles, gates, benches, troughs, buildings, bridges and other objects. Poles can be any kind of signage, street lamps, delineators, road signs, information boards, garbage cans, telescopes or other slim installations in the dike. Objects are defined as unique 3D objects which cannot be classified with the other point installations. These can be art, monuments, electricity boxes or maintenance hole structures. All point installations that could not be clearly interpreted for the remote inventory were also mapped as objects (Figure 4).
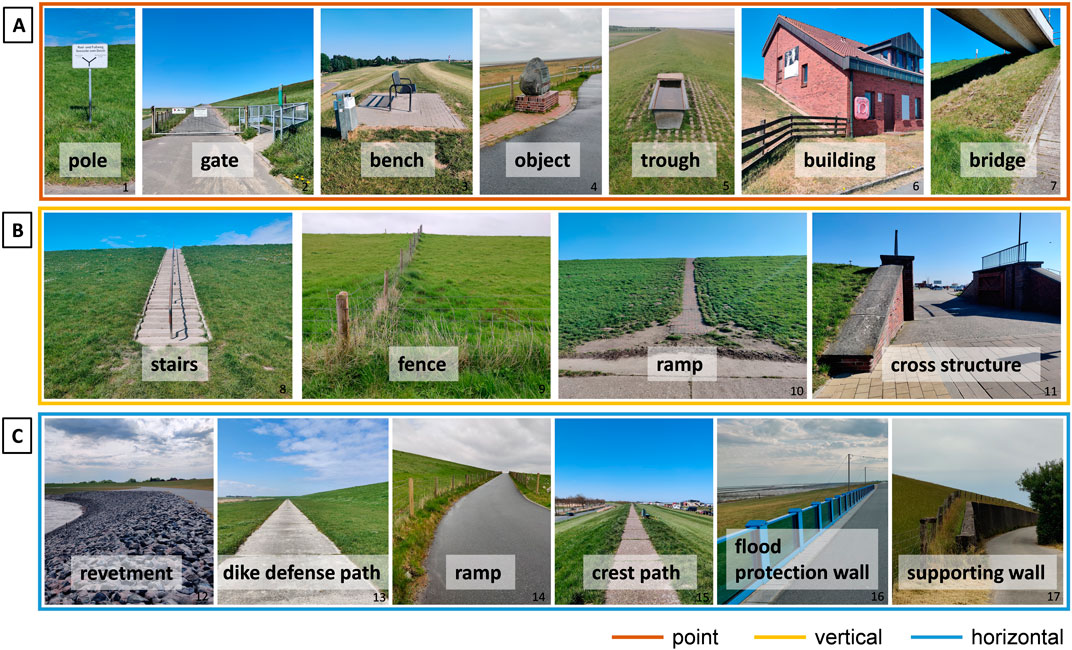
Figure 4. Exemplary photos of different types of transitions (© Ina Schulte 2023) classified by (A) point, (B) vertical and (C) horizontal elements.
Vertical transitions are all arranged in the cross-dike direction and experience a separation of the load in wave direction in case of wave loading. The investigation of the hydraulics is therefore also three-dimensional. Examples of vertical transitions include cross fences, ramps, external pipes or other cross structures. Dike gates, sluices, pumping stations, locks or barrages are summarized as cross structures in the dike (Figure 4).
Horizontal transitions are elements uniform in the along-dike direction and assumed to be loaded equally in the case of a storm. Therefore, a two-dimensional consideration is sufficient. Longitudinal fences, dike defense paths, seaward dike paths (flashover protection and driftwood removal paths), revetments, acute-angled ramps, crest paths, crest streets, flood protection walls, supporting walls, groves and railway tracks could be identified as horizontal transitions (Figure 4).
2.5 Damage catalog
Based on the visual observations of failures near transitions in the on-site investigations (Table 2), a damage catalog has been developed (Rodermund, 2023). With the help of existing national and international regulations for the inspection and monitoring of engineering structures, the observed damage was cataloged according to dike zone, transition categorization, damage type and damage level. In addition, the location of the damage, the time of year and weather conditions during the survey were taken into account as well as the cause of the damage (when known).
The classification of the damage into a dike zone was carried out as the areas hinterland, landward dike foot, landward slope, crest, seaward slope, seaward dike foot and foreland. The transitions are categorized as described in Section 2.4. Damage types for transitions were derived from existing assessment procedures that already exist for dam and defense structure inspections nationally (BAW, 2017) and internationally (Bown et al., 2014; Digigids, 2019; STOWA, 2012) and summarized in eight categories. An assessment aid with sample photos and descriptions has been developed based on Digigids (2019) to evaluate the severity of damage (Supplementary Appendix Table S2). This methodology allows for the categorization of damage based on visual inspection by the survey teams into three distinct levels: light, medium and heavy.
The damage categories in the catalog were defined as open patches of turf, weeds, missing stones/broken pieces, cracks/holes, sagging/subsidence and bulging, erosion of embankment material, burrowing animals/small mammals and water leakage (Figure 5). All georeferenced pictures taken during the on-site investigation have been categorized into the damage catalog to finally evaluate the type and frequency of damage at the various transitions.
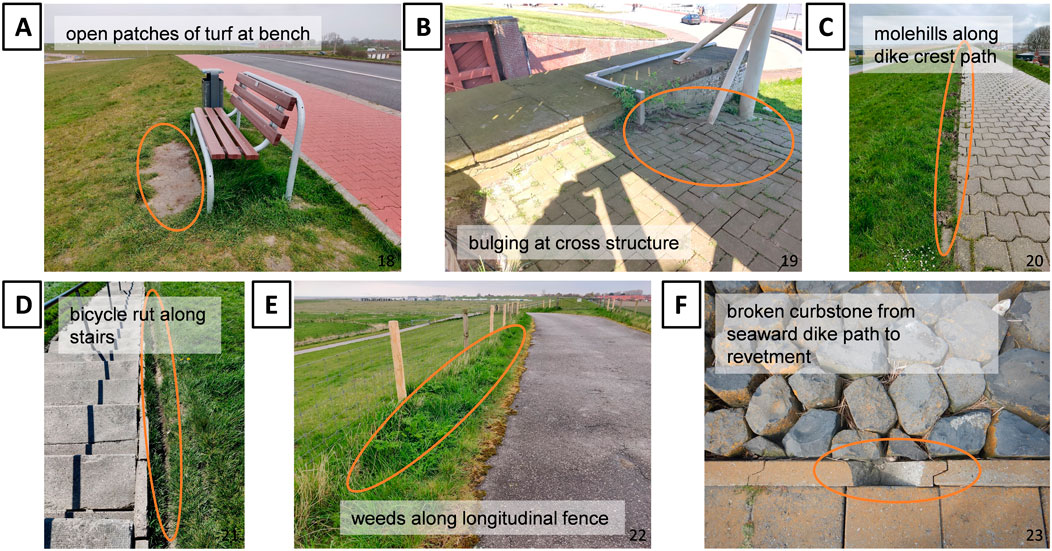
Figure 5. Exemplary photos of different damages at transitions (© Ina Schulte 2023): (A) open patches at a bench on the crest, (B) sagging/subsidence and bulging at paving on the crest near a cross structure, (C) burrowing animals/small mammals along a dike crest path, (D) crack/hole along landside stairs, (E) weeds along longitudinal fences, (F) missing stones/broken pieces at a transition from a revetment to seaward dike path on the seaside.
3 Results
3.1 Types and design of transitions
Different design variants were found for each transition. The structural and geometric designs of dike elements depend strongly on local conditions, the various federal states’ organizational units and the coastal municipalities’ financial resources. There are no standard construction methods or materials found. Structural differences between transitions on the land and sea side or the crest were also not observed. However, construction plans show that material transitions on the seaward side are often constructed with dike end stones that are embedded deeper into the ground than on the inland side. Paving next to and under transitions such as stairs and other point elements on the dike are to be established by the federal coastal organizational units as seen in newer construction plans that were made available to the author team. This measure is also noticeable in the field already (Figure 6). The pavings protect the grass sods from damage caused by humans and animals while ensuring that the transition from hard to soft installations is gradually levelled, especially in terms of ground-level installations. However, the measure has not been set by regulations nor have the dimensions of these pavements been scientifically investigated yet.
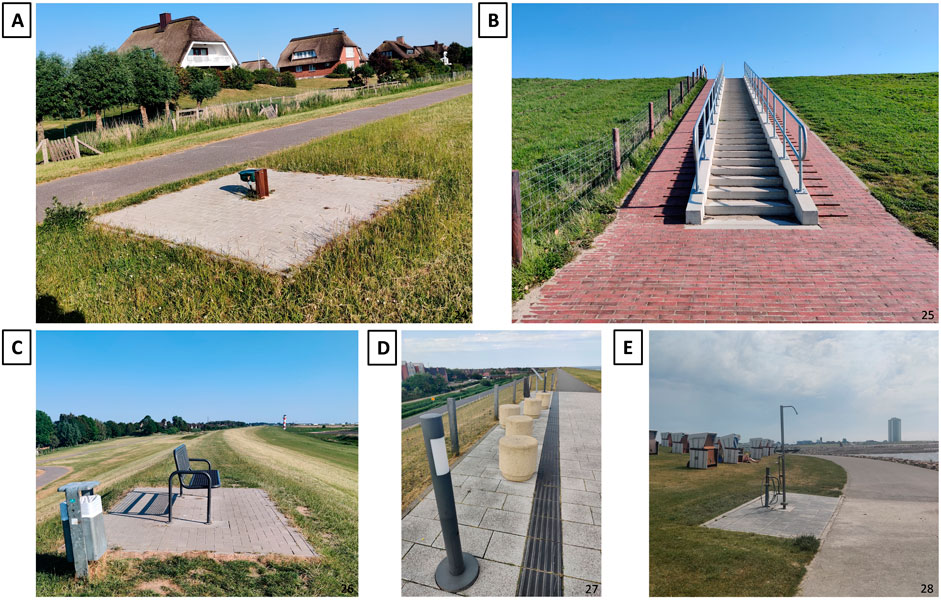
Figure 6. Exemplary photos of paving at transitions (© Ina Schulte 2023): (A) trough on landside, (B) stairways on landside, (C) bench on crest, (D) poles and objects on crest, (E) shower on seaside.
3.2 Spatial distribution along the coast
Over 18,300 transitions were recorded on the German Coast. On average, at least sixteen transitions per dike kilometer over the entire German Sea coast dike line, including the tidal-influenced river dikes, were found (Table 3). Over half of all transitions are point installations into the dike. Approximately 27% of all transitions are vertical transitions, and 20% are horizontal transitions (assuming a transition point per kilometer).

Table 3. Summary of point, vertical and horizontal transitions at the North Sea and Baltic Sea coast dikes.
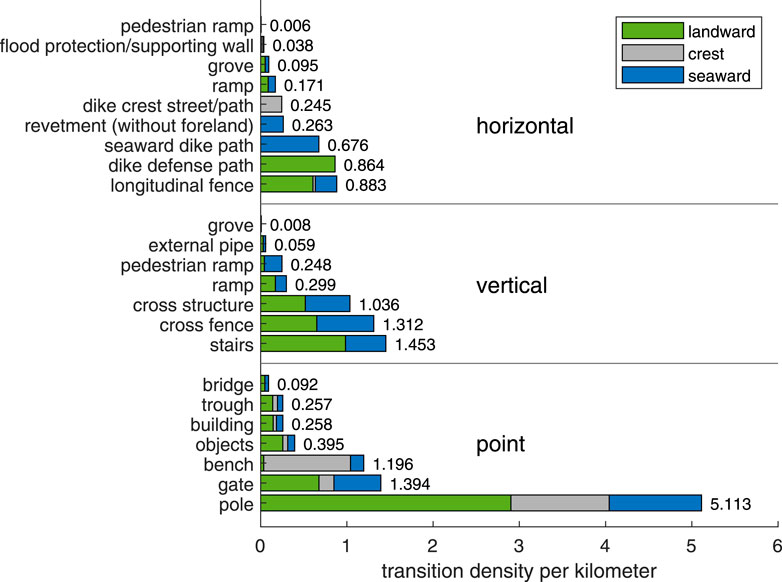
Considering a lateral perspective, a total of 50% of all transitions can be found on the landward side, 17% are located on the dike crest, and 33% on the seaward side of the dike. Figure 7 displays the density of all 23 different types of transitions identified in the mapping of the dikes of the German North Sea and Baltic Sea Coast. The results are categorized in horizontal, vertical and point transitions and indicating in which location on the dike the transition can be found. Looking at the type of transitions, poles are by far the most common elements on the dike. The distribution of stairs on German sea dikes has been found to be about 1.45 stairs per dike kilometer, making them the most common vertical transitions. Longitudinal fences, closely followed by dike defense paths, are the most common horizontal transitions.
All differentiated transitions can be found in different locations on and at the dike. Dike defense paths are only on the landward side of dikes, whereas the seaward dike path and revetments are only on the seaward side of the dikes. There are no vertical transitions on the crest, but a lot of point transitions, like 84% of the benches are located on the crest. Flood protection walls, which are included in the investigation are only found on the crest of the dikes, whereas the supporting walls are installed in the seaward (57%) or landward (43%) slope. While stairs are usually used to access the dike on the land side (68%), vertical pedestrian ramps are often built on the seaward side (83%). Longitudinal fences are usually built at the foot of the dike on the seaward (25%) or landward (66%) side of the protection or the seaward dike path, but there are also sections with fences on the crest (3%) or slope (6%) especially along access ramps. Cross fences, cross structures, acute-angled ramps, bridges, external pipes and rails usually extend over the entire cross-section of the dike, so there is a transition on the land and the seaside of the dike.
By comparing the transition density of the North Sea and the Baltic Sea dikes, some differences become apparent (Figure 8). Point transitions like poles and benches, which mainly serve as touristic installations, are found with a density of 12.7 point transitions per dike kilometer with 54% more frequently on the main sea dikes on the Baltic Sea coast. It is also noticeable that there are 213% more vertical ramps as well as 64% more landward stairways for access to the dikes on the Baltic Sea compared to the dikes on the North Sea coast relative to the total length of the dikes. The existing dike sections on the Baltic Sea coast show overall more touristic design elements like poles with signage and info boards, benches or dike crest paths. On the other hand, gates are found with 70%, troughs for sheep with 86% and fences (cross-sectional and longitudinal) with 37% more frequently on North Sea dikes, which are maintained by sheep grazing, compared to the Baltic Sea coast relative to the total dike lengths. While 19% of the dikes on the North Sea coast are equipped with dike crest paths, 68% of the dikes surveyed on the Baltic Sea coast have a crest path. In contrast, 41% more of the North Sea coastal dikes have dike defense paths and 64% more have outer dike paths compared to the dikes on the Baltic Sea coast. North Sea dikes have with 33% no foreshore and thus have 63% more revetments than the Baltic Sea dikes. In contrast, 23% of the dikes on the landward side and 22% on the seaward side of the dikes on the Baltic Sea coast are covered with groves at the base of the dike, which represents an increase of 6 times and 10 times, respectively, compared to the North Sea coast. This is indicative of a strong dependence on the combination of coastal protection with dunes, coastal forests and dikes in combination at the Baltic Sea coast.
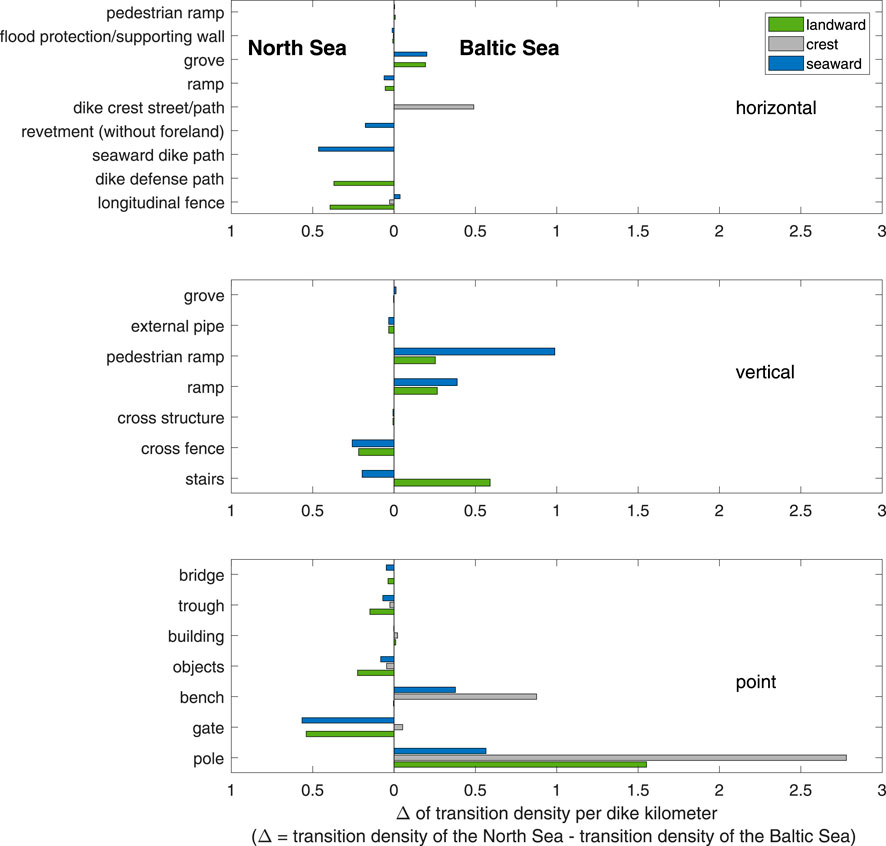
Figure 8. Comparison of transition densities of the North Sea and Baltic Sea coast with the difference of the density per dike kilometer.
On the seaward side of sea dikes, horizontal material transitions from revetments to the seaward dike path or the adjacent grass revetment are prevalent. For landward dike slopes, the transition from the grass cover layer to hard materials at point installations, as well as stairs, fences, paths or roads, is of particular significance. The crests of the dikes are characterized by point installations such as benches and poles.
The spatial analysis of transitions along the North Sea coast reveals that there is a dependency on larger harbour sites, coastal cities and touristic areas. While on dike sections where there is little settlement in the hinterland, the classic transition density is between 1-21 transitions per kilometer, up to 111 transitions per kilometer can be found on dike sections close to touristic communities and cities like Norddeich, Neuharlingersiel, Cuxhaven, Büsum or Norderhafen (Figure 9). In the large metropolitan areas of Bremen and Hamburg along the tidal rivers Weser and Elbe, the transition densities are, contrary to expectations, not as high as anticipated. In the densely populated inner city areas, there are no classic green dikes but flood protection walls, and in many other places, for space reasons, there are combined structures consisting of dikes and angled supporting walls. However, the densely populated surroundings of Hamburg in the area of the tidal Elbe with classic green dikes are categorized by a high transition density of about 11-61 transitions per kilometer.
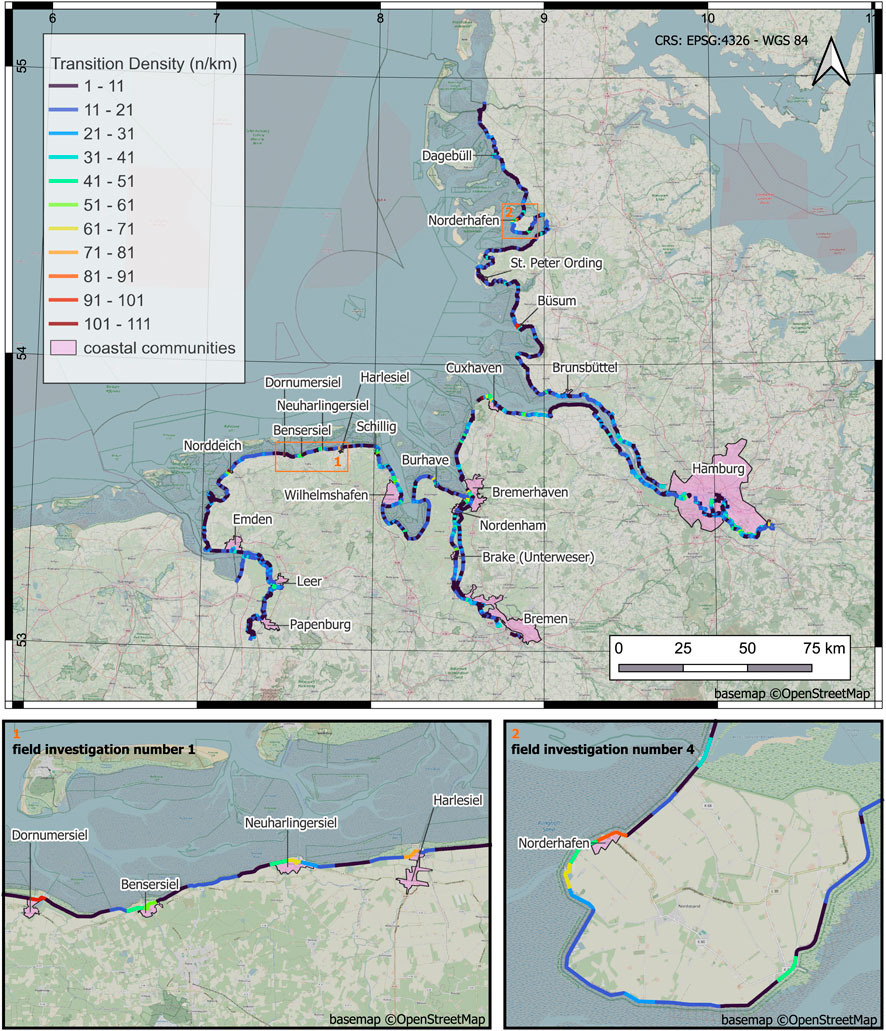
Figure 9. Density analysis of transitions at sea and estuary dikes at the German North Sea Coast (basemap: www.openstreetmap.org/copyright).
On the Baltic Sea coast, slightly higher transition densities were found overall, with up to 121 transitions per kilometer (Figure 10). Many of the communities along the Baltic Sea coast are rather smaller compared to the North Sea, but still have many transitions due to the high level of tourism development. The highest densities are found at the dike section in Stein and Schönberger Strand, which are just northeast of the harbour city Kiel.
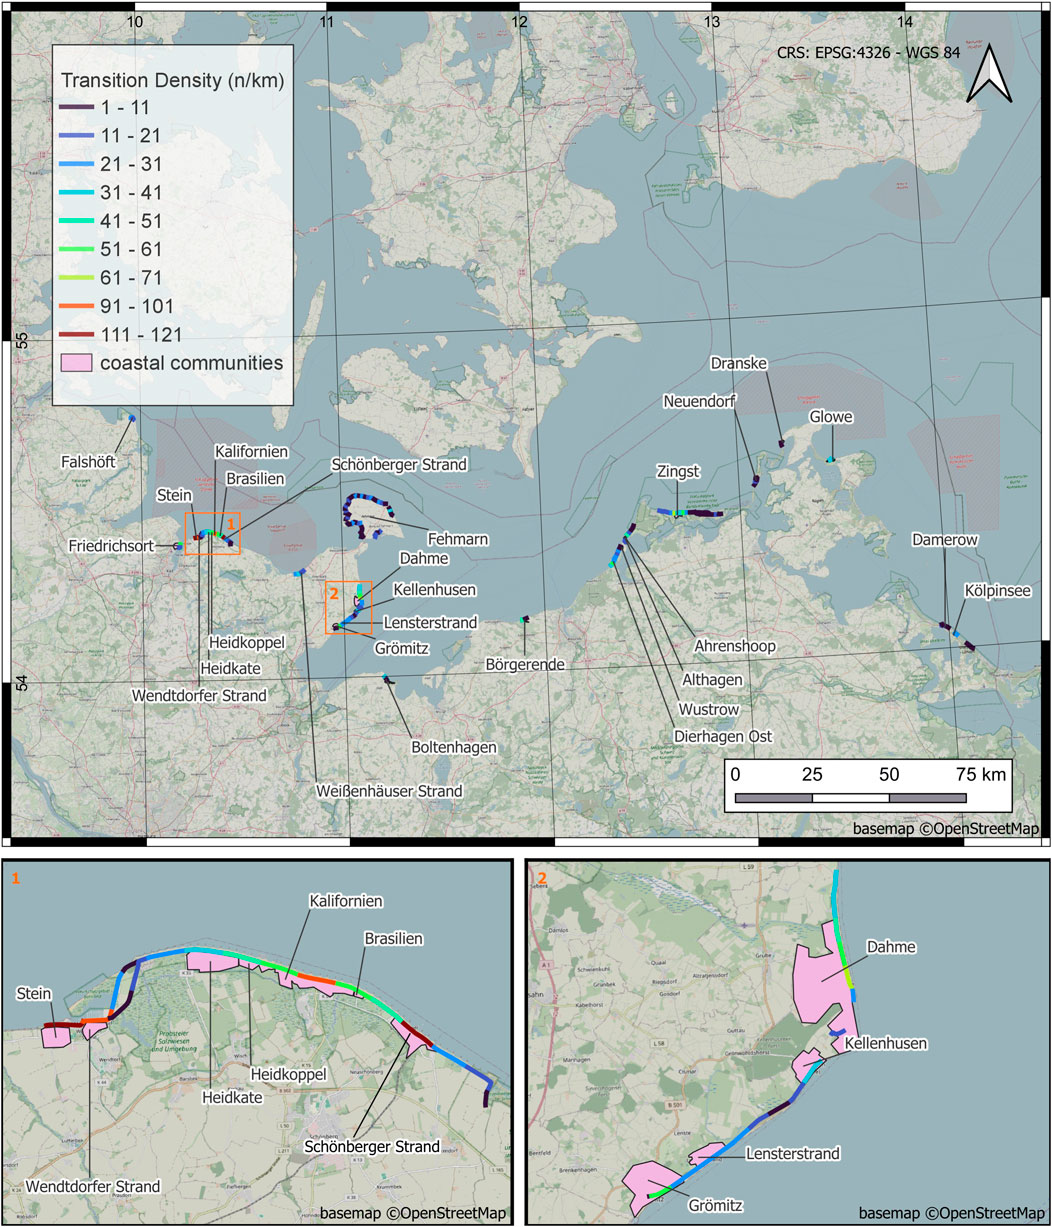
Figure 10. Density analysis of transitions at sea dikes at the outer German Baltic Sea Coast (basemap: www.openstreetmap.org/copyright).
Of about 735 investigated sea dike kilometers on the German North Sea coast, 33% are determined as dikes without a foreland, and 67% as foreshore dikes. In general, dikes without a foreland are already characterized by more horizontal transitions on the seaside, like the transition from the revetment to the seaward dike path and the adjacent vegetated top layer or the change in different slope inclinations. In contrast, on dikes with a foreland, point transitions are often found in the foreland, which, however, are not part of the analysis.
Furthermore, many transitions that were observed occur in combinations of transitional elements. For example, at stairs which are for touristic use, there are also benches and garbage cans on the dike crest as well as posts for signage; sluice structures always come with a building and have stairs for access and traffic routes and especially crossroads rarely occur without traffic signs or delineators (Supplementary Appendix Figure S1).
Different demands on and usage behavior of the dike structure result in variations of transition areas. Sheep grazing, for example, requires many types of transitions, such as longitudinal and cross fences, gates, and drinking troughs. However, some of Hamburg’s dikes (HPA managed) have hardly any fences as there is no sheep grazing. Although fences are counted as vertical and horizontal transitions, the fence posts regularly interfere with the dike surface. Extrapolated to the entire length of all identified fences on the coast and assuming a post spacing of 3 m, there are additionaly over 344,500 posts for the entire dike length of the German North and Baltic Sea coast.
3.3 Verification of remote inventory
To assess the accuracy of geometric and surface feature detection based on satellite imagery using Google Maps Satellite in comparison to ground-truthing data, an analysis was conducted. By means of on-site investigations at several dike sections along the North Sea coast, numerous pictures of the current condition of the dikes were taken. These images serve as a comparison with the transitions detected by remote sensing. Dividing into horizontal, vertical and point transitions, it was possible to determine transitions with varying degrees of accuracy. The number of transitions observed in the field is compared with the identified number of transitions from Google Maps Satellite. As a result, 88% of all vertical and 91% of all horizontal transitions were detected, whereas only 53% of point transitions were identified in the remote inventory compared to the field investigation. Extrapolating the results of the verification for the dike sections of the field investigations of 75 km to the entire dike length of the German coast of 1,121 km, it is calculated that transition densities of up to 25 transitions per dike kilometer are possible (Table 4). The projected number of transitions for the entire coast with correction of the verification results is initially derived from the figures determined by remote sensing in Table 3. The predicted density can then be calculated accordingly from the dike length for the entire coast. However, it should be emphasized that the verification data is only available for areas with higher densities since these were selected for the on-site investigations.

Table 4. Projection of transition density with verification data generated by comparing the remote inventory with the in-situ investigations.
A closer comparison of the transition types with the structures and objects actually found in the field reveals that detailed recording is not always possible in the remote inventory. For example, there is a risk of confusion between stairs and vertical pedestrian ramps, benches with drinking troughs or the general misinterpretation of point installations. However, dike elements within a classification class (horizontal, vertical, point) were always assigned correctly.
Shadows cast by tall buildings or plants or even the covering of transitions and the presence of people or sheep in highly touristic or grazed sections of the dike make it challenging to recognize small or point elements in particular (Supplementary Appendix Figure S2). Poles, lanterns, road signs and other slender, tall structures can be identified almost exclusively by the shadows they cast. The recognition of slender objects extending upwards is, therefore, particularly dependent on the image quality, resolution and the time and angle of the satellite images. The dike sections are subject to constant change due to reinforcement measures or tourist development, so that the time and timeliness of the satellite data are also relevant for verification.
3.4 Observations of failure at transitions
A total of 327 damages on the seaward slope (45%), 201 damages on the crest (27%) and 206 on the landward side of the dikes (28%) were recorded in the damage catalog. Converted to the examined dike length of 75 km, this results in a damage density of 9.79 damages at transitions per kilometer for the overall dike structure. Based on the number of transitions in the investigated dike stretch an overall density of 0.36 damages at transitions per number of transitions where found. Figure 11 presents a breakdown of damages per transition classified according to the type of transition. Additionally, it shows the distribution of these damages across the dike, differentiating between landward, crest and seaward areas.
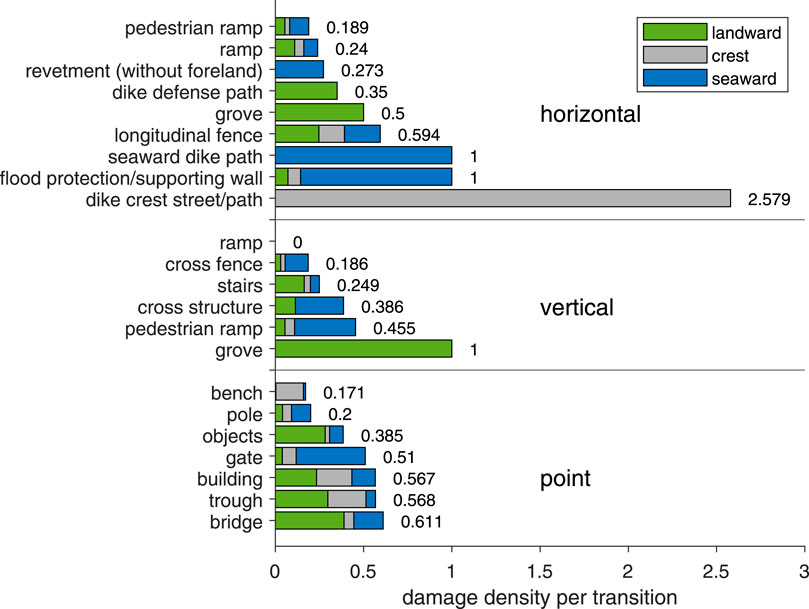
Figure 11. Damages at transitions along the German coast per number of transitions in the examined dike stretch.
The analysis based on the classification of transitions shows that 43% of the damage was found at point transitions, 24% at vertical transitions and 33% at horizontal transitions. Bridges, troughs, buildings and gates show the highest susceptibility to damage for the point transitions, with damage to the transition in over half of all identified objects of the respective type. For the vertical transitions, groves and pedestrian ramps are characterized by the highest damage density per transition. The highest density of damage is found at dike crest streets/paths, with over two damages per kilometer of the path. Flood protection walls and seaward dike paths were also found to have an average of one damage per kilometer of the wall or the path, respectively, during the field campaigns.
The damages are mainly caused by secondary effects. Damage to the various dike elements identified in the field was in particular due to heavy animal activity by voles, moles, rabbits and sheep, among others, the use of bicycles and tractors (traffic lanes), and heavy human use in the form of trampling and bare patches in the turf. Material leaching due to drainage problems, drying cracks, soil loosening, and slumping could also be recorded in isolated cases in the area of transitions.
In addition to the location of the damage and the type of transition where the damage occurred, Figure 12 also shows the extent of damage to the respective transition type. The distribution of the three damage classes light (yellow), medium (orange) and heavy (red) are shown with the absolute number of recorded damages on the landward side, crest and seaward side.
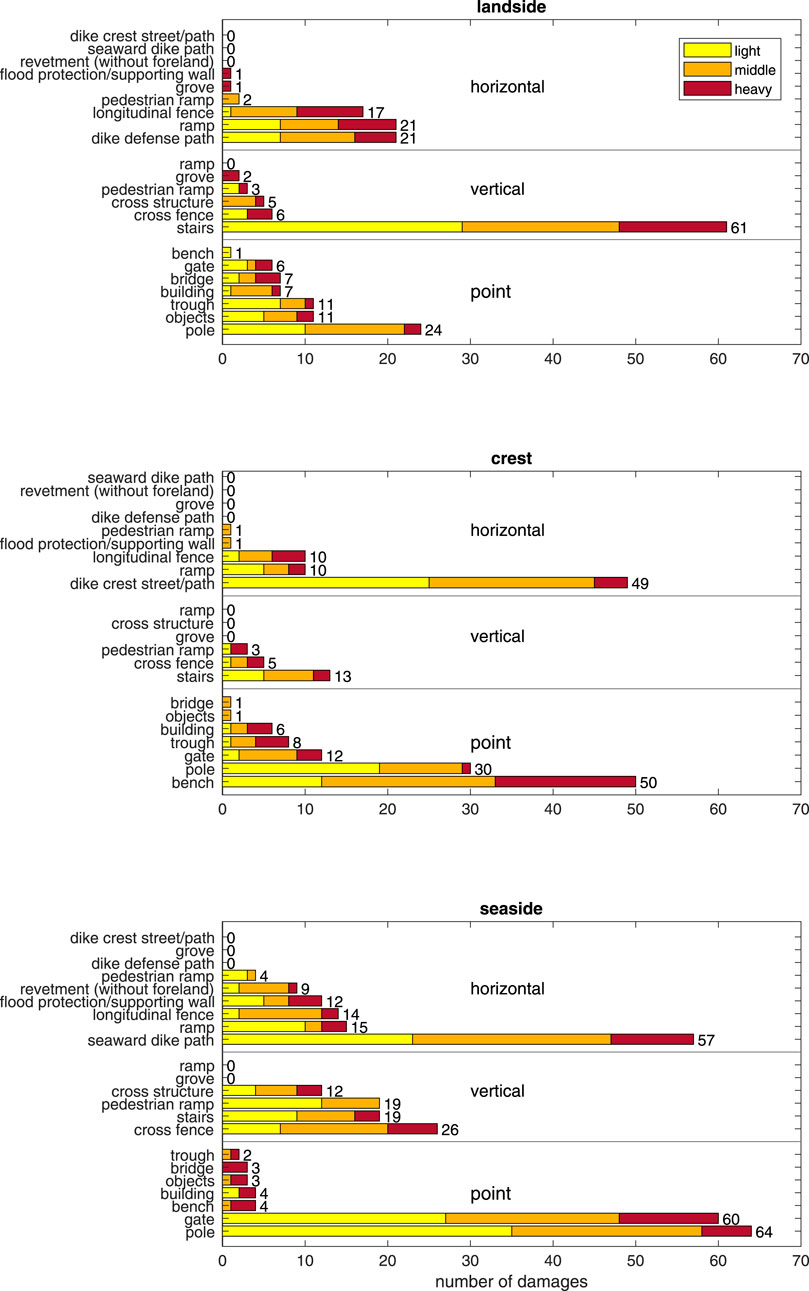
Figure 12. Absolute number of damages at transitions classified by damage class and location on the dike.
In total, 40% of the damages were classified as light, 39% as middle and 21% as heavy (based on the decision aid in Supplementary Appendix Table S2). On the seaward side, most damage is found to be light, whereas moderate damage predominates on the crest and heavy damage is seen more often than average on the landward side. In absolute terms, most heavy damage was found near benches, stairs and longitudinal fences.
An analysis of the absolute number of damages compared to the relative number per existing transition type in the dike section studied (Figure 11) shows that the order of vulnerability of the transition types changes. Bridges, buildings and troughs, for example, show a lot of damage in relative terms, but are also found much less frequently on the dikes compared to poles, benches or gates. These conditions are not only evident at the point transitions, but also at the vertical transitions with stairways and cross fences and the horizontal transitions with ramps and dike defense paths. As the investigation aims to optimize frequent transitions that are subject to a lot of damage, the absolute number of cases of damage should not be neglected.
The type of damage depends on the type of transition and is not uniformly distributed. The presentation in matrix form in Figure 13 makes it possible to show the relationships between damage category and transition type. By far, the most common type of damage is damage to the vegetated top layer in the form of open patches, accounting for 56% of all damage recorded (Figure 13). Missing stones and break-offs, weeds, burrowing animals and small mammals as well as cracks and holes are responsible for further damage with 8%-9.5% each. Damage caused by subsidence/settlement and bulging was identified at 6.5%, erosion of the dike body material at 1.8% and water leakage at only 0.5%.
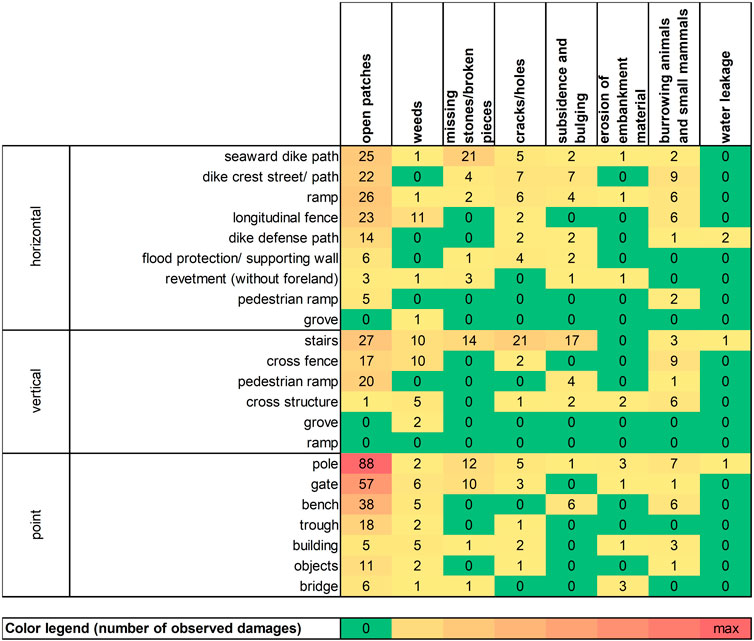
Figure 13. Heat map showing the most frequent forms of damage per transition type in absolute numbers of damages observed in the field (see Legend: from green = no damage to red = most frequent combination of damage form and transition type).
Most of the damages are found at poles, where 74% of the damages are due to open patches. Other point transitions that showed high damage rates were gates and benches, which were also mainly characterized by open patches in the turf. For vertical transitions most damage was observed at stairways, where especially open patches and holes of, for example, bicycle tracks were found. Along fences and at gates, tracks of sheep could be seen. In addition to open patches in the turf, the activity of smaller animals or weeds on fences was also observed. The most vulnerable horizontal transitions where identified as seaward dike paths, dike crest paths as well as ramps and longitudinal fences. Open patches and burrowing animals caused most damage at these transitions as well as cracks which could be identified at the paths and ramps.
4 Discussion
Contact and transition points of sea dikes have been identified in past storm surges as weak points in the dike structure as one of the potential causes of damage or dike failure due to hydrodynamic loads (Schüttrumpf and Oumeraci, 2004). In existing German and international guidelines and regulations, however, transition points have not yet been sufficiently considered. In addition, damage mechanisms from initiation to the possible complete loss of serviceability of structures at contact and transition points have not yet been comprehensively investigated and analyzed.
The present study aimed to identify the existing transitions on the German sea dikes and discusses the existing damages near such transitions. Differentiation and categorization of transitions are included in the analysis in a highly simplified form. This simplification is a feasible means to capture the complex diversity of all the different transitions and possibilities for categorization. However, the attempt to classify transitions corresponds to a purely theoretical subdivision (van Steeg and van Hoven, 2013b). A clear definition, standardization and classification of the transitions must be achieved so that it is clear what is being referred to, and hence, uniform terms can be used in future regulations, and generally applicable recommendations can be issued. Classification into horizontal, vertical and point transitions is a simple approach in terms of the appearance of the transitions, which summarize geometrical and material changes at the same time. However, the flow patterns can differ within a group due to changes in roughness, geometry or position, which can also change the loads and possible countermeasures in protecting transition areas. While the classification and simplification has been motivated by geometrical and apparent criteria, there will be future work on evaluating those transitions with a stronger focus on the magnitude and directionality of the hydraulic loading, which eventually is the driving force with respect to damage initiation and failure.
Not only the results of the literature but also of the comprehensive optical remote inventory and visual interpretation show the diversity of transitions on the green sea dikes in Germany. With the aim of the study to identify the wide variety and spatial distribution of transitions, the inventory is a snapshot of the coast on the basis of freely available aerial images. The timeliness of the records at the time of mapping is relative. Continuous dike reinforcement measures and the increase in new installations due to increased usage requirements, for example, due to tourism, could therefore not be mapped. The identification of the transitions is not only limited due to the topicality but also the resolution of the satellite images, the observation in plan view and atmospheric conditions like the daytime of recording the images in terms of sun angles and shadow directions (Janga et al., 2023; Lillesand et al., 2015). Elements on the dike that do not have a large footprint and are characterized in particular by dimensions perpendicular to the dike contact surface are, therefore, much more difficult to recognize by optical remote sensing (Lillesand et al., 2015). The recognition of inclinations or changes in inclination cannot be derived precisely, which also results in errors in the exact localization of the transitions through the visual analysis. Other remote sensing techniques like LiDAR or Radar data are capable of providing information about the third spatial dimension in height but also come along with limitations such as more complex data processing, low availability and high costs (Janga et al., 2023). In addition to shadows and the spatial resolution, characteristics like tone, shape, texture, pattern and sizes can help with the estimation of the objects (Lillesand et al., 2015). Poles, signs and lanterns can be recognized mainly by shadows and less high fence posts, especially due to the high vegetation along these installations. The results of the verification of the remote inventory also showed the same. Visual image interpretation with the freely available data worked adequately for the application in this study, especially for vertical and horizontal transitions, with 88% and 91% correctly identified transitions, respectively. The interpretation becomes less accurate as the level of detail of the transitions increases with the point transitions (53%) and available pixel sizes are not sufficient anymore for recognition. An extrapolation of the verification data to the whole coastline must be evaluated critically, as the available field data are only existing for urban areas, which are characterized by a particularly large number of tourist installations. There is also no guarantee that the resolution of the satellite images in the areas under consideration corresponds to the average of the available data sets. Even though the analysis was carried out by only one researcher, the visual interpretation and manual acquisition of transitions at the coast cannot be regarded as consistent throughout and, therefore, can be another limiting factor for the accuracy of the mapping due to subjective judgment (Boloorani et al., 2023; Lillesand et al., 2015). However, the results can be regarded as a conservative estimate, as other studies on visual image interpretation in many applications with high-resolution, freely available image material and experienced interpreters also show (Pandey, 2019; Boloorani et al., 2023). Nevertheless, due to the high number of transitions, the study shows how relevant the consideration of transitions in the course of maintenance, design and risk assessment is. The study facilitates the immediate spatial recognition of areas with high transition densities or transitions identified as particularly vulnerable through further research.
The use of open-access satellite data is often used for geospatial analysis and is not limited to the visual imagery from Google Satellites but also includes multispectral and hyperspectral sensors as well as synthetic aperture radar (SAR) data. In detail, the open access data include, for example, Sentinel-2, Landsat and MODIS as visual and multispectral data and Sentinel-1 as radar data (Radočaj et al., 2020). All of these data sources have strength and weaknesses, which requires new and multidisciplinary approaches where several techniques can be integrated to complement the data sets and allow for further analysis (Nikolakopoulos et al., 2023; Kopiika et al., 2024). The use of SAR images with crowdsourced information and high-resolution images can overcome different levels of spatial resolution as well as influences of weather and line-of-sight impacts (Kopiika et al., 2024).
For the visual interpretation, no automated methods or data sources other than visual imagery were used. The use of AI-supported image recognition is to be considered for future analyses (Janga et al., 2023), particularly in the application of damage assessment and mapping (Braik and Koliou, 2024). For a possible damage assessment and structural health monitoring using remote sensing in particular, not only the spatial resolution but also the time-flexible access and permanent availability of current images (revisit time) are relevant (Kopiika et al., 2024; Macchiarulo et al., 2022; Nettis et al., 2023). For the damage assessment in this study, ultra-high spatial resolution (≤1 m) is needed as the observed damages at the transitions are of smaller scales. SAR techniques are often used for deformation analysis, which is one form of damage defined for the damage catalog at transitions but does not cover all damage categories. Further damage assessments use change detection methods to determine temporal changes for the detection of damage (Wen et al., 2021; Kopiika et al., 2024) or a combination of very high-resolution satellite imagery and machine learning (Macchiarulo et al., 2024). Many very high-resolution sensors have limited spectral information as well as spectral variabilities, making spectral-based methods for change detection ineffective and setting other image features in the focus (Wen et al., 2021). Since the focus of the study was more on the first generation and evaluation of a data set than the development of remote sensing approaches for the identification of transitions and associated damage, an integrated approach combining different remote sensing techniques for the damage assessment on dikes is to be considered for future studies.
The spatial distribution of transitions along the coast shows that mainly urban areas along the coast, which also pose the highest vulnerability, are characterized by high transition densities. In particular, elements installed into the earthwork of the dike body have been considered in the analysis, since the German coast is predominantly protected by dikes. Through an expert survey, van Steeg and van Hoven (2013b) also found that transitions in and on the dike pose one of the most important transitions to consider for the Netherlands. In addition, transitions from dikes to other forms of coastal protection measures like flood protection walls or dunes are to be considered. Previously conducted in-situ experiments have already focused on horizontal, vertical and point transitions as well (van der Meer et al., 2010; Steendam et al., 2012; van Steeg et al., 2015). However, these studies have mainly focused on the landside loading mechanisms on the sea dike and the impact of seaside loadings still have to be considered in more detail.
Other assumptions and simplifications made for the inventory analysis are the uniformity of transitions and the size of the dike interference surfaces. On the one hand, horizontal transitions are assumed to be uniform in the along-dike direction, even though geometrical and material changes are likely throughout. On the other hand, point and vertical transitions are each considered to be one transition, although they can have significantly different sizes. In the investigation, a pole is evaluated in the same manner as a cross fence, although in simplified terms, the fence represents around 30 slender intersections in the dike body per kilometer. Even a building, that offers considerably more attack surface than a bench, is weighted equally. A consideration of the contact area would be appropriate at this point with regard to the vulnerability of transitions. It is also not possible to define the dike footprint precisely in each dike section, including the protective strip from the inland to the seaward embankment foot, so the area under investigation was estimated in each case. Geometric transitions, such as changes in slope gradients and dike lines, were not considered in the mapping. Changes in the slope gradients represent linear transitions and are present on all dikes. If the kinks in the dike structures are added, the transition density along the coast is uniformly increased by at least four horizontal transitions, assuming there are no berms. In addition to slope angle changes that lead to high hydraulic loads and erosion in the area of the upper landward slope and the landward toe during wave overtopping (Van Bergeijk et al., 2022), curvatures in the dike line for wave run-up heights and hydraulic loads must also be taken into account (Subramaniam et al., 2019).
Very urban coastal sections, e.g., in the area of Bremen, Hamburg city center or other port cities, also make mapping difficult, as the complexity of the dike structure and the degree of development are significantly increased. Here, a good categorization and delineation of the different transition types is necessary in order to be able to carry out mapping. It is debatable how useful the identification in these areas is, as they differ greatly from the classic green sea dike.
In order to achieve universal solutions for an improved constructive design of the transitions, the focus should be on particularly relevant transitions for German sea dikes. Since 99% of all investigated sea dikes on the German coasts are found to be covered by clay and grass, material transitions from hard structures to soft (grass) must be specifically considered. Even though there are also material transitions from hard to hard structures (i.e., change in toe revetment to the flashover protection or from asphalt to paving blocks), these transitions are not as vulnerable to erosion as grass and therefore of secondary importance in this investigation.
During the field investigations conducted in the spring and summer, hardly any damage from hydraulic loadings, such as wave run-up, wave impact or wave overtopping, was detected. The repair of damage caused by storm surge events from the previous season is usually completed promptly and efficiently through the implementation of targeted maintenance measures. In this respect, seasonal boundary conditions have also been taken into account in the evaluation of the damages. Klerk et al. (2023) found that the detection of damage or damage classes is not consistent and depends on many factors, such as the dike inspector, the experience level or the type of damage. This means that the detection and classification of damage could differ from the assessment carried out by the researchers. The cataloged damages are primarily due to maintenance and intensive use by humans as well as biological factors. The damage was, therefore, caused mainly by secondary effects, which in the case of hydrodynamic stress (primary effects) during flooding events can represent possible initiating points for further damage and hence require cataloging (Wohlenberg, 1965; Schüttrumpf and Oumeraci, 2002; van Steeg et al., 2015; Steendam et al., 2012). Reduced degrees of compaction, loosened and sometimes elevated plant cover, which provides optimal habitat for burrowing animals and small fauna, as well as shading around transition areas result in poorer grass qualities and thus lower strength (Wohlenberg, 1965; van Steeg et al., 2015). Preliminary damage to the dike is therefore relevant for the stability of the dike and must be considered in the further course of treatment. Often, dike damage is also due to multiple causes, so the superposition of meteorology, dike geometry, installations, dike soil, biology, maintenance, as well as flotsam can lead to damage and possible overall failure of the structure (Schüttrumpf and Oumeraci, 2002).
Open patches in the turf were the most frequent damages observed in the field, particularly at tourist installations such as steps and benches. These areas are often frequented by people, and therefore, the turf is affected, particularly in the corner areas, by people quickly taking shortcuts or standing in front of benches. Sheep also create many open patches in the turf. They tend to walk repeatedly along the same paths in the shelter of transitions, as also concluded by van Steeg et al. (2015). The animals use poles, benches, fences and other installations to scrub themselves or seek shade, which reduces the grass quality in these areas. There are also often large open patches of grass around drinking troughs. Besides evaluating and deriving countermeasures for the most frequently occurring damages at transitions, the consideration of special cases is nevertheless relevant, as the dike fails at the weakest point in each case.
The month of mapping is decisive for the type and severity of damage. In the spring and summer months, for example, increased tourist activity, drought and damage caused by sheep grazing are predominant. Towards winter, a lot of preliminary damage is then repaired for the storm surge season. The mapping of damage is, therefore, only a snapshot of the possible diversity and frequency distribution of damages found at the dikes. In further in-field investigations, the focus could be more on damages due to hydrodynamic loadings and the effect of pre-damages of the dike. Since only damage at transitions was considered and there is no comparative data on further damage to the green dike, no quantitative statement can be made on the increased vulnerability of transition areas. However, transition areas offer significantly increased conditions for damage initiation, as there are many other discontinuities in addition to soil/grass quality. While design improvements of the transitions for hydraulic loading can only be derived from physical and numerical investigations, initial recommendations for the layout of transitions can already be derived from observations and the results from the field. With the three main strategies for the further design of transitions by van Steeg and van Hoven (2013b): Reduce the load, increase the resistance or accept damage and plan residual strength, concrete recommendations for transitions on green dikes against the background of the observed damage can be derived. The layout of vertical transitions like stairs, for example, should include an adjacent ramp for bicycles to avoid ruts in the grass turf. Innovative designs like a drive-over stairway integrated with the revetment can also be a solution for increasing the resistance of the transition as well as feasible and mechanized maintenance. Horizontal transitions like paths and ramps often have rutted side areas or curves with open patches in the turf where driving was not intended. Additional pavings, as well as erosion-resistant elements like concrete safety barriers and crash protection or concrete blocks with anchoring to the substrate, are possible to prevent damage to the elements. All constructive measures come with advantages like increased resistance as well as disadvantages. By further pavings around and besides transition areas, height differences to the turf can gradually be decreased but the material transition is just shifted and never removed. Hard measures are not ecologically valuable but require less maintenance of the turf.
5 Conclusion
Transition points proved to be weak points on the dike where damage initiation due to primary and secondary effects often starts. This study classified transitions, generated the first comprehensive data set of transitions along the German coast and analyzed them using remote and field inventory. A total of 998 km length of the coast along the North Sea and 123 km along the Baltic Sea were investigated. Over 18,300 transitions were mapped, of which around 27% were vertical, 20% horizontal and the majority (53%) were point transitions. Of all transitions, 50% were found on the land side, 17% on the crest and 33% on the sea side of the dike. The highest transition densities were found in Norddeich on the North Sea with 104 transitions per kilometer and in Stein on the Baltic Sea with 117 transitions per kilometer. The results are valuable for identifying particularly frequent and vulnerable transitions and providing a basis for further investigations.
This study’s findings also show typical damages associated with transitions, which were mainly caused by maintenance measures as well as intensive anthropogenic and zoogenic activities. In total, 45% of all damage was identified on the sea side, 27% on the crest and 28% on the land side of the dikes. Point transitions accounted for 43% of all damage, vertical transitions for 24% and horizontal transitions for 33%. The most common type of damage observed was damage to the vegetated top layer (56%). The identified damage at transitions aims to help develop new recommendations for the execution of transitions. Initial recommendations for the layout of transitions can be derived against the background of the observed damage. Such recommendations include, for example, the placement of bicycle ramps next to stairs, additional pavings or other erosion-resistant materials. The constructive hard measures can increase resistances, decrease height differences to the turf or ease maintenance but the material transition is always just shifted.
For further analysis of the seaward and landward hydraulic interactions at transitions, and in order to improve the protective function and overall stability of German sea dikes, systematic investigations (experimental and numerical) are required. With respect to the findings in this study the focus of future experiments should be on horizontal path transitions (landward defense, crest path, seaward path), landward vertical access ramps/stairways and cross fences and point transitions of poles and gates on the land- and seaside and benches on the crest of dikes. These investigations can assist in the development of practical and application-oriented recommendations for standard construction methods for contact and transition areas on the dike crest, landward and seaward embankments. New design procedures are necessary to provide a standard for the future protection of German and international coastal areas with green sea dikes.
Data availability statement
The raw data supporting the conclusions of this article will be made available by the authors, without undue reservation.
Author contributions
IS: Conceptualization, Data curation, Formal Analysis, Investigation, Methodology, Visualization, Writing–original draft. HR: Data curation, Formal Analysis, Investigation, Methodology, Writing–review and editing. HSe: Supervision, Writing–review and editing. JB: Data curation, Investigation, Writing–review and editing. CS: Supervision, Writing–review and editing. DS: Supervision, Writing–review and editing. NG: Funding acquisition, Project administration, Supervision, Writing–review and editing. HSc: Conceptualization, Funding acquisition, Project administration, Supervision, Writing–review and editing.
Funding
The author(s) declare that financial support was received for the research, authorship, and/or publication of this article. This study had been supported by the German Coastal Engineering Research Council KFKI and funded by the German Federal Ministry of Education and Research (BMBF) within the research project “Hydraulic stability, damage processes and prevention strategies for coastal protection structures at contact and transition points” (Grant Number 03F0925A-B). Open access funding provided by the Open Access Publishing Fund of RWTH Aachen University.
Acknowledgments
The authors want to thank the student Henrike Rodermund for insides into her student research project with the developed damage catalog of transitions (unpublished). The authors also thank the project support group from the German Coastal Engineering Research Council KFKI for sharing some data and their expertise.
Conflict of interest
The authors declare that the research was conducted in the absence of any commercial or financial relationships that could be construed as a potential conflict of interest.
Publisher’s note
All claims expressed in this article are solely those of the authors and do not necessarily represent those of their affiliated organizations, or those of the publisher, the editors and the reviewers. Any product that may be evaluated in this article, or claim that may be made by its manufacturer, is not guaranteed or endorsed by the publisher.
Supplementary material
The Supplementary Material for this article can be found online at: https://www.frontiersin.org/articles/10.3389/fbuil.2024.1468726/full#supplementary-material
References
Boloorani, A. D., Ramin, P., Masoud, S., Ali, A.-H., Fatemeh, A., Karami, L., et al. (2023). Visual interpretation of satellite imagery for hotspot dust sources identification. Remote Sens. Appl. Soc. Environ. 29, 100888. doi:10.1016/j.rsase.2022.100888
Bown, C., Chatterton, J., and Purcell, A. (2014). Asset performance tools – asset inspection guidance. Report – SC110008/R2. Bristol: Environment Agency.
Braik, A. M., and Koliou, M. (2024). Automated building damage assessment and large-scale mapping by integrating satellite imagery, GIS, and deep learning. Comput. aided Civ. Eng. 39 (15), 2389–2404. doi:10.1111/mice.13197
CIRIA (2013). The international levee handbook. C731. London, UK: Construction Industry Research and Information Association.
Digigids (2019). Digigids. De schadegids voor dijkinspecteurs. STOWA; Rijkswaterstaat. Available at: https://digigids.stowa.nl/.
EAK (2007). “Die Küste. Archiv für Forschung und Technik an der Nord-und Ostsee. EAK 2002 Korrigierte Ausgabe 2007,” in Die Küste (65), 1–589.
EurOtop Van der Meer, J., Allsop, N., Bruce, T., De Rouck, J., Kortenhaus, A., et al. (2018). Manual on wave overtopping of sea defenses and related structures. An overtopping manual largely based on European research, but for worldwide application. Available at: http://www.overtopping-manual.com/.
Hoffmans, G., van Hoven, A., Hardeman, B., and Verheij, J. (2015). Erosion of grass covers at transitions and objects on dikes. doi:10.1201/b17703-84
Hoffmans, G., van Hoven, A., Steendam, G. J., and van der Meer, J. (2018). “Summary of research work about erodibility of grass revetments on dikes,” in Proc. Protections 2018. Grange-over-Sands, UK, 6-8 June.
Janga, B., Asamani, G., Sun, Z., and Cristea, N. (2023). A review of practical AI for remote sensing in earth sciences. Remote Sens. 15 (16), 4112. doi:10.3390/rs15164112
Klerk, W. J., Kanning, W., Kok, M., Bronsveld, J., and Wolfert, A. R. M. (2023). Accuracy of visual inspection of flood defences. Struct. Infrastructure Eng. 19 (8), 1076–1090. doi:10.1080/15732479.2021.2001543
Kolb, A., Otremba, E., and Brünger, W. (1962). Sturmflut 17. Februar 1962. Morphologie der Deich- und Flurbeschädigungen zwischen Moorburg und Cranz. Hamburger Geographische Studien, Heft 16. Universität Hamburg. Hamburg: Institut für Geographie und Wirtschaftsgeographie.
Kopiika, N., Karavias, A., Krassakis, P., Ye, Z., Ninic, J., Shakhovska, N., et al. (2024). Rapid post-disaster infrastructure damage characterisation enabled by remote sensing and deep learning technologies -- a tiered approach. Available at: http://arxiv.org/pdf/2401.17759v4.
Le, H. T., Verhagen, H. J., and Vrijling, J. K. (2017). Damage to grass dikes due to wave overtopping. Nat. Hazards 86 (2), S. 849–875. doi:10.1007/s11069-016-2721-2
Lillesand, T. M., Kiefer, R. W., and Chipman, J. W. (2015). Remote sensing and image interpretation. Editor N. J. Hoboken (Wiley), 7.
LM MV (2006). Generalplan Küsten-und Hochwasserschutz Mecklenburg-Vorpommern. Ministerium für Bau, Landesentwicklung und Umwelt Mecklenburg-Vorpommern.
LSBG (2007). Hochwasserschutz in Hamburg-Bauprogramm 2007 Hamburg, Germany: Ed. Landesbetrieb Straßen, Brücken und Gewässer.
Macchiarulo, V., Giardina, G., Milillo, P., Aktas, Y. D., and Whitworth, M. R. Z. (2024). “Integrating post-event very high resolution SAR imagery and machine learning for building-level earthquake damage assessment,” in Bull earthquake eng. doi:10.1007/s10518-024-01877-1
Macchiarulo, V., Milillo, P., Blenkinsopp, C., and Giardina, G. (2022). Monitoring deformations of infrastructure networks: a fully automated GIS integration and analysis of InSAR time-series. Struct. Health Monit. 21 (4), 1849–1878. doi:10.1177/14759217211045912
MAV (2017). BAWMerkblatt Anwendung von hydraulisch gebundenen Stoffen zum Verguss von Wasserbausteinen an Wasserstraßen (MAV).
MELUND (2022). Generalplan Küstenschutz des Landes Schleswig-Holstein, Fortschreibung 2022. Kiel, Germany: Ed. Ministerium für Energiewende, Landwirtschaft, Umwelt, Natur und Digitalisierung des Landes Schleswig-Holstein.
Nettis, A., Massimi, V., Nutricato, R., Nitti, D. O., Samarelli, S., and Uva, G. (2023). Satellite-based interferometry for monitoring structural deformations of bridge portfolios. In: Autom. Constr., Automation Constr. 147, 104707. doi:10.1016/j.autcon.2022.104707
Nikolakopoulos, K. G., Kyriou, A., Koukouvelas, I. K., Tomaras, N., and Lyros, E. (2023). UAV, GNSS, and InSAR data analyses for landslide monitoring in a mountainous village in western Greece. Remote Sens. 15 (11), 2870. doi:10.3390/rs15112870
NLWKN (2007). Generalplan Küstenschutz Niedersachsen/Bremen. Festland. Norden, Germany: Ed. Niedersächsischer Landesbetrieb für Wasserwirtschaft, Küsten- und Naturschutz.
Oppenheimer, M., Glavovic, B. C., Hinkel, J., van de Wal, R., Magnan, A. K., and Abd-Elgawad, A. (2019). “Sea Level Rise and Implications for Low-Lying Islands, Coasts and Communities,” in IPCC Special Report on the Ocean and Cryosphere in a Changing Climate. Editors H. -O. Pörtner, D. C. Roberts, V. Masson-Delmotte, M. Zhai, E. Tignor, and K. Poloczanska (Cambridge, United Kingdom: Cambridge University Press), 321–445. doi:10.1017/9781009157964.006
Pandey, P. (2019). Inventory of rock glaciers in Himachal Himalaya, India using high-resolution Google Earth imagery. Geomorphology 340, 103–115. doi:10.1016/j.geomorph.2019.05.001
Pilarczyk, K. W. (1995). Design of dikes and revetments. Dutch Practice. Delft, Netherlands: Rijkswaterstaat. Hydraulic Engineering Division. Report A-R-95103.
Piontkowitz, T., Verhagen, H. J., Verheij, H., Mai Cao, T., Dassanayake, D., Roelvink, D., et al. (2009). EroGRASS - failure of grass cover layers at seaward and shoreward dike slopes. Des. Constr. & Exp. Perform. Lemvig (Denmark) Available at: https://kyst.dk/media/fwkjel1w/erograss_report_a_final.pdf.
Radočaj, D., Obhođaš, J., Jurišić, M., and Gašparović, M. (2020). Global open data remote sensing satellite missions for land monitoring and conservation: a review. Land 9 (11), 402. doi:10.3390/land9110402
Rodermund, H. (2023). Auswertung von Bildmaterial und Bestandsplänen von Küstenschutzbauwerken hinsichtlich relevanter Kontakt-und Übergangsbereiche sowie Schadensbilder als Grundlage für die Konzipierung eines Schadenskatalogs (unpublished) Studienarbeit. Braunschweig. Leichtweis-Institut für Wasserbau: Technische Universität Braunschweig.
Schüttrumpf, H. (2008). “Sea dikes in Germany,” in Die Küste 74. Heide, Holstein: Boyens, 189–199. Available at: https://hdl.handle.net/20.500.11970/101604.
Schüttrumpf, H., and Oumeraci, H. (2002). Schäden an See-und Stromdeichen. Ed. Leichtweiss-Institut für Wasserbau Tech. Univ. Braunschw. Mittl. Heft 149, 129–171.
Simm, J., Woods Ballard, B., Flikweert, J.-J., van Maren, E., Dimakapoulos, A., Hassan, M., et al. (2021). “Investigation, assessment and remediation of levee transitions,” Budapest, Hungary. FLOODrisk2020.
Steendam, G. J., Provoost, Y., and van der Meer, J. (2012). Destructive wave overtopping and wave run-up tests on grass covered slopes of real dikes. Coast. Eng. Proc. 1 (33), 64. doi:10.9753/icce.v33.structures.64
Steendam, G. J., van der Meer, J., van Steeg, P., van Hoven, A., and van der Meer, G. (2014). “Simulators as hydraulic test facilities at dikes and other coastal structures,” in From Sea to shore – meeting the challenges of the sea, 2013. Editor W. Allsop Ice Publishing, 1356–1367.
Steendam, G. J., van der Meer, J. W., Hardeman, B., and van Hoven, A. (2011). Destructive wave overtopping tests on grass covered landward slopes of dikes and transitions to berms. Coast. Eng. Proc. 1 (32), 8. doi:10.9753/icce.v32.structures.8
Subramaniam, S. P., Scheres, B., Schilling, M., Liebisch, S., Kerpen, N. B., Schlurmann, T., et al. (2019). Influence of convex and concave curvatures in a coastal dike line on wave run-up. Water 11 (7), 1333. doi:10.3390/w11071333
TAW (1992). Overgangsconstructie in dijkbekledingen Editors W. G. de Rijke, M. Klein Breteler, T. P. Stoutjesdijk, and L. A. Philipse Delft, Netherlands: Rijkswaterstaat, Dienst Weg-en Waterbouwkunde.
Tourment, R., Royet, P., and Morris, M. (2012). Comprehensive report on action 3.1.2: structure transitions.
Trung, L. H. (2014). “Overtopping on grass covered dikes,” Resistance and failure of the inner slopes. Dissertation. Delft, Netherlands: Delft University of Technology.
van Bergeijk, V. M., Warmink, J. J., and Hulscher, S. J. M. H. (2022). The wave overtopping load on landward slopes of grass-covered flood defences: deriving practical formulations using a numerical model. Coast. Eng. 171, 104047. doi:10.1016/j.coastaleng.2021.104047
van Bergeijk, V. (2022). Over the dike top. Modelling the hydraulic load of overtopping waves including transitions for dike cover erosion. Dissertation. Enschede, Netherlands: University of Twente. Water Engineering and Management department.
van Bergeijk, V., Warmink, J., and Hulscher, S. (2022). The effects of transitions in cover type and height on the wave overtopping load on grass-covered flood defences. Appl. Ocean Res. 125, 103220. doi:10.1016/j.apor.2022.103220
van der Meer, J., Schrijver, R., Hardeman, B., van Hoven, A., Verheij, H., and Steendam, G. J. (2010). “Guidance on erosion resistance of inner slopes of dikes from three years of testing with the wave overtopping simulator,” in Coast, marine structures and breakwaters: adapting change. 2nd Edn. Editor W. Allsop (London, UK: Thomas Telford Ltd), 460–473. doi:10.1680/cmsb.41318.0044
van der Meer, M., and Calle, E. O. F. (2012). SBW Golfoverslag en Bekledingen deelproject Overgangsconstructies. Deltares. Report number: 1204204-011-GEO-0006.
van Steeg, P., Labrujere, A., and Mom, R. (2015). “Transition Structures in grass covered slopes of primary flood defences tested with the wave impact generator,” in E-Proceedings of the 36th IAHR world congress. The Hague, Netherlands. 28 June - 3 July.
van Steeg, P., and van Hoven, A. (2013a). Overgangen bij grasbekledingen in primaire waterkeringne. Aanzet tot Oplossingsrichtingen. Deltares. 1208394-000-HYE-0012.
van Steeg, P., and van Hoven, A. (2013b). Overgangen en overgangsconstructies. Deltares. 1208394-000-HYE-0011.
Verheij, H., Hoffmans, G., Hardeman, B., and Paulissen, M. (2012). “Erosion at transitions in landward slopes of dikes due to wave overtopping,” in ISCE6-2012 - sixth international conference on scour and erosion. Paris, France, August 27–31, 2012.
Wen, D., Huang, X., Bovolo, F., Li, J., Ke, X., Zhang, A., et al. (2021). Change detection from very-high-spatial-resolution optical remote sensing images: methods, applications, and future directions. IEEE Geosci. Remote Sens. Mag. 9 (4), 68–101. doi:10.1109/MGRS.2021.3063465
Wohlenberg, E. (1965). “Deichbau und Deichpflege auf biologischer Grundlage,” in Die Küste 13. Holstein: Boyens, 73–103. Available at: https://hdl.handle.net/20.500.11970/100874.
Keywords: sea dikes, transitions, German coast, inventory, design, damages, flow-structure-soil interaction, coastal flooding
Citation: Schulte I, Rodermund H, Selvam H, Becker J, Schweiger C, Schürenkamp D, Goseberg N and Schüttrumpf H (2024) Inventory of transitions on sea dikes at the German coast: spatial analysis, design and damages. Front. Built Environ. 10:1468726. doi: 10.3389/fbuil.2024.1468726
Received: 22 July 2024; Accepted: 31 October 2024;
Published: 27 November 2024.
Edited by:
Corrado Altomare, Universitat Politecnica de Catalunya, SpainReviewed by:
Riccardo Briganti, University of Nottingham, United KingdomNadiia Kopiika, University of Birmingham, United Kingdom
Copyright © 2024 Schulte, Rodermund, Selvam, Becker, Schweiger, Schürenkamp, Goseberg and Schüttrumpf. This is an open-access article distributed under the terms of the Creative Commons Attribution License (CC BY). The use, distribution or reproduction in other forums is permitted, provided the original author(s) and the copyright owner(s) are credited and that the original publication in this journal is cited, in accordance with accepted academic practice. No use, distribution or reproduction is permitted which does not comply with these terms.
*Correspondence: Ina Schulte, c2NodWx0ZUBpd3cucnd0aC1hYWNoZW4uZGU=
 Ina Schulte
 Henrike Rodermund
 Harish Selvam
 Jessica Becker
 Constantin Schweiger
 David Schürenkamp
 Nils Goseberg
 Holger Schüttrumpf1
