 Giulia Barbano1*†
 Aodh Maguire1†Harshit Singh1Zaid Batayneh1Lorenzo De Donatis1
 Niall Byrne1Els Heyvaert2Rutger Baeten2Christel Vandenhouten2
- 1Integrated Environmental Solutions R&D Limited, Dublin, Ireland
- 2Brussels Airport Company, Brussels, Belgium
Airports have ambitious decarbonization objectives, with many EU airports pledging to reach net-zero carbon emissions by 2050 for all emissions fully under their control. This requires setting a baseline and defining roadmaps composed of decarbonization measures that intend to reduce energy demand and carbon emissions from that baseline. However, there is substantial uncertainty in defining the impact that can be achieved through these roadmaps, which can be substantially reduced through the use of a digital twin. In this paper, we present the creation of a baseline digital twin of the built environment of Brussels Airport, which will be used to analyze the impact of decarbonization measures before they are deployed. To create the digital twin, an extensive data collection exercise was carried out to ensure that the created model is a realistic representation of the core airport systems and that its simulations are accurate in forecasting results. Utilizing the IES Apache physics-based engine, the digital twin predictions have been validated against actual energy consumption data. The present work demonstrates the methodology and results achieved, offering insights on how to tackle the complex challenge of creating a digital twin of the built environment of an entity as complex as an airport while focusing the baselining efforts on the most significant aspects, with the ultimate objective of reducing uncertainty of future decarbonization investments. The digital twin has been used to calculate the energy consumption and CO2 emission baseline, and it will be utilized to model key decarbonization measures that are part of the Brussels Airport net zero carbon roadmap.
1 Introduction
The European Commission has set out the European Green Deal to tackle the transformation of the EU economy, with the clear target of achieving climate neutrality across the continent by 2050 and reducing net greenhouse gas (GHG) emissions to at least 55% of 1990 levels by 2030. To achieve this goal, the EU has set out several policies and targets that have a synergistic effect. In particular, it has identified the foremost priority as the decarbonization of the energy system by shifting to renewable sources, as energy use in EU economic sectors accounts for 75% of GHG emissions; renovating buildings to substantially reduce their demand, which alone accounts for 40% of EU energy consumption; and reducing transport emissions by 90% by 2050, as mobility causes a quarter of EU GHG emissions (European Commission, 2019; 2021).
These three priorities come together in airports, which are a complex nexus of human activities as transport hubs that occupy a substantial surface of the land, are composed of a variegated built environment, and produce energy on-site. Airports are comparable to small cities, with airport management companies overseeing the energy and transport flows (Rowlings, 2016). Therefore, airports have multiple energy efficiency and decarbonization targets, both on the airside and landside, to reduce the demand and provide decarbonized energy to their multiple customers (Ortega Alba and Manana, 2016; Mańkowska et al., 2023).
To deal with this complex challenge, European airports (under the aegis of ACI Europe) have committed to achieving net-zero carbon1 (NZC) emissions by 2050 for all the emissions fully under their control and to outline a roadmap to reach this target by 31st May 2024 (ACI Europe, 2019; ACI Europe, 2023a). These roadmaps are developed through a best-practice approach that requires mapping the carbon footprint of the airport, exploring potential decarbonization measures, and combining them into scenarios and pathways that are then used to compose the roadmap itself (To70, 2023). The roadmaps to NZC prepared by European airports are made available to the broader public (ACI Europe, 2023b) and include measures that address the decarbonization of on-side thermal energy and vehicle fleet, the adoption of energy efficiency measures, and the decarbonization of power via renewables both on-site and from the grid (To70, 2022).
The creation of roadmaps toward net zero is a broadly applied methodology at various scales and scopes. It is a necessary step to achieve ambitious decarbonization targets; however, by their nature, roadmaps imply substantial uncertainty in their management over their implementation lifetime (Mathy et al., 2016). This uncertainty has been discussed in the literature as a challenge for cities (Ziozias et al., 2023), supply chains (Niu et al., 2022), and power systems (Pilpola and Lund, 2020). This challenge, if unaddressed, can have drastic results on sector efforts to decarbonize as the size of investments required from public and private sources is substantial, and investments must be allocated toward the most impactful interventions. Decarbonization investments have been characterized as high risk, low return opportunities and suffer from variable risk aversion among investors (Muñoz and Bunn, 2013). To address this challenge, the use of energy modeling has been proven to be effective in reducing the impact of uncertainties on future decarbonization pathways (Jose Valdez Echeverria et al., 2023). The European Commission has also identified the opportunity offered by the parallel green and digital transitions, which can support each other. “Simulation and forecasting using digital technologies can […] enable or improve the analysis, planning, and decision-making in the energy sector. For example, they can improve estimates of renewable power generation potential or facilitate the management of large datasets accumulated by smart meters. In addition, digital technologies can help optimize system management, particularly the operation of energy systems, power plants, electricity grids, electricity markets, or supply chains and facilities that serve such markets” (Muench et al., 2022, p. 44).
The present paper describes an approach to reduce the uncertainty in decarbonization pathways by adopting a digital twin paradigm, applied to the case of Brussels Airport, to create a reliable digital twin baseline that can be used to analyze the impact of decarbonization measures ahead of their deployment, support investment decisions, and ensure that ambitious targets toward net-zero emissions can be met. In the following section, we will describe the context of the test case of Brussels Airport, explain the methodology applied to create and utilize a digital twin, and present the work carried out to create the baseline digital twin of Brussels Airport, which can accurately forecast the energy balance in the built environment of the airport.
2 Materials and methods
2.1 Brussels Airport case
Brussels Airport started operating as a civil aviation airport in 1958 and has since grown into a high-traffic passenger and cargo airport, serving over 25 million passengers in 2019 and covering an area of 1,245 ha (Brussels Airport, 2024b; Brussels Airport, 2024c; Brussels Airport, 2024a). It manages its environment and energy according to ISO 14001 and 50001 certifications, and in 2018, it received the Airport Carbon Accreditation (ACA) Level 3+, which requires complete carbon neutrality for scope 1 and scope 2 emissions and the minimization of emissions by offsetting (Airport Carbon Accreditation, 2024a; Airport Carbon Accreditation, 2024b). Only a few airports are certified at the highest level as climate neutral, a challenging objective currently achieved only by early adopters and the first movers in the field (Falk and Hagsten, 2020). The ACA framework, developed by Airports Council International (ACI), is widely used to inventory GHG emissions in airports (Greer et al., 2020) and utilizes the definitions of scopes from the de facto standard for GHG emissions, as defined in the Greenhouse Gas Protocol (Ranganathan et al., 2004). The ACI framework recognizes that the airport can directly control the GHG emissions from scope 1 sources (e.g., on-site energy generation for heating, cooling, electricity, and airport-owned vehicles) and scope 2 sources (off-site electricity, heating, and cooling generation for airport-controlled uses). On the other hand, scope 3 sources (including emissions from aircraft engines and ground traffic to and from the airport) are outside the direct control of the airport, which can only influence them (e.g., emissions from airline GSEs) (Giuffre’ and Grana, 2011; Greer et al., 2020).
As a signatory of the 2019 ACI Europe resolution to reach net zero by 2050 on the emissions fully within the control of member airports and its 2023 update (ACI Europe, 2023a), Brussels Airport has prepared and published its roadmap, which includes measures on five pillars: fossil-free heating, electric equipment and vehicles, local green electricity, a robust electricity system, and connection with the community (Brussels Airport, 2022). The roadmap is practical and detailed, outlining the specific interventions that will affect the built environment and networks of the airport, such as the renovation of existing buildings, the transition to renewable energy sources (onsite where possible) that can power heat pumps to decarbonize heating, and an infrastructural transformation of the power grid to accommodate sufficient loading capacity for electric vehicles in the airport.
To support the delivery of the European Green Deal, the European Commission launched a call for proposals for research and innovation projects in 2020, which included a topic on demonstrating solutions for green airports at scale (Horizon 2020 Framework Programme, 2020). As coordinator and lighthouse airport, leading a consortium of 22 partners, Brussels Airport was granted the Stargate project (SusTainable AiRports, the Green heArT of Europe), which started in November 2021 (Stargate, 2021). The Stargate project is based on five pillars. The first is to utilize a digital twin ecosystem to model the lighthouse airport; the second is the focus on multimodal, sustainable, and smart mobility; the third is the optimization of terminal operation; the fourth is the investigation on energy and the production and use of sustainable aviation fuels (SAFs) for aircraft; and the fifth covers cross-cutting aspects on multi-actor governance, framework conditions, noise, and emissions (CORDIS, European Commission, 2024). Within the very diverse and ambitious scope of the Stargate project, the work presented in this study was carried out as part of the digital twin pillar, and in particular, it focused only on the modeling of scope 1 and scope 2 emissions from the built environment of the airport. The other pillars of the Stargate project (mobility, terminal operations, SAFs, and cross-cutting aspects) are not discussed in the present paper.
2.2 Digital twin and baselining methodology
As part of the Stargate project, substantial emphasis was placed on a performance measurement and verification (PM&V) methodology to be tested in the project, with the ultimate objective of creating a best practice for the decarbonization of airports globally. The PM&V methodology adopted in the Stargate project requires an initial definition of a baseline, evaluating the initial performance metrics across the multiple dimensions of sustainability addressed in the project. Then, actions and interventions to be demonstrated in the lighthouse, Brussels Airport, would be planned and designed to identify in detail the scope of the experiment to be defined and the expected output (i.e., the performance change against the baseline). Finally, a set of initiatives would be deployed with ongoing measurement of key metrics for a sufficient time period to evaluate the actual performance achieved in comparison to the initial target.
To enable this methodology, an overarching digital twinning approach was pursued, creating digital twins of various systems at Brussels Airport to be used as the virtual testbed for innovation actions before their deployment, allowing for the definition of scenarios and evaluation of their potential across various dimensions of sustainability (while considering the time dimension to account for their deployment in time). Digital twins are emerging in a plethora of industries as a key enabling technology for knowledge-driven services (Raj and Surianarayanan, 2020), and it is broadly recognized that the decarbonization of energy systems is inextricably intertwined with digitization (Sareen and Müller, 2023). The novelty of the present work on utilizing digital twins for decarbonization analysis is supported by literature reviews that show publications starting in 2019, with a marked increase from 2022 onward (Papadonikolaki and Anumba, 2023). Previous research outlines the potential of digital twins to offer novel services for planning and energy reduction (Galera-Zarco and Papadonikolaki, 2023). The current scientific landscape shows multiple applications and interpretations of digital twins, from asset-based (Vieira et al., 2023) to IoT-driven (Hosamo et al., 2023). The present research utilizes the definition of digital twins as a virtual double of a group of physical buildings that respond and behave like their real-world counterparts, which are to be used to support complex decision making on forecasting and support net-zero and decarbonization goals (Bagireanu et al., 2024). In practical terms, the creation of this virtual double of the built environment and energy networks relies on the digital twin solution of Stargate, which utilizes physics-based building simulation modeling engines developed by IES; this is further discussed in Section 2.4.1 “Software used.” The utilization of the physics-based model coupled with real building, network, and weather data translates it from a model to a proper digital twin, avoiding the innate risks of purely data-driven models such as extrapolation without the boundaries of physical knowledge of the behavior of the asset and obtaining a digital twin that is sufficiently physics-based, accurate, and quick to run to support useful decisions (Wright and Davidson, 2020).
Within the built environment domain, there are two main modeling approaches that are suitable for the analysis of energy demand and consumption: “top-down,” which is utilized in urban-level analyses to disaggregate overall data to specific buildings (Swan and Ugursal, 2009), and “bottom-up,” which analyzes each building separately. In urban studies, the methodology chosen greatly depends on the available data to create the model underpinning the digital twin (Buckley et al., 2021). Extensive reviews across the thriving research field of urban building energy modeling (UBEM) show a predominance of estimations in building geometry to create UBEM models and very large variability in accuracy at the single-building scale (Oraiopoulos and Howard, 2022). Innovative calibration methodologies for UBEM allow for reaching accuracies within ± 5% at the aggregated level for thousands of buildings (Tardioli et al., 2020). However, the present research is placed at the less explored scale of campus-level UBEMs, which focuses on the analysis of clusters of buildings with different ages and uses (Lin et al., 2023) and utilizes a “bottom-up” approach to modeling, i.e., building by building. The accuracy needed for building-level models at the campus level requires undertaking calibration approaches (Dong et al., 2014). Model calibration is a well-known and tested approach for individual buildings (Fabrizio and Monetti, 2015), which utilizes real data from the building to adjust the configuration of the virtual model and obtain an accurate simulation that matches the actual performance of the building (within an acceptable range) (Coakley et al., 2014). A formalization for the calibration approach was recently proposed by CIBSE in Technical Memorandum TM63 (Jain et al., 2020), requiring detailed data on the building to enable the creation of an accurate replica and actual energy consumption data at a monthly (ideally hourly) resolution that used to adjust the model to an actual in-use baseline, which then becomes a representative virtual replica of the building as it exists and is used (vs. how it was originally designed). This procedure has been followed, in principle, in the creation of the digital twin baseline for Brussels Airport; however, it was adjusted where needed to account for its application at the campus scale. For this reason, the approach documented in this research is described as “model validation” instead of “calibration” as it was applied at a much larger scale than model calibration as properly defined for individual buildings in the literature and relevant standards. When we utilize the term “validation,” we adopt the definition of the US Department of Defense: “the process of determining the degree to which a model is an accurate representation of the real world from the perspective of the intended uses of the model” (Oberkampf and Roy, 2010).
2.3 Baseline scoping
2.3.1 Choice of baseline metrics
The first step in defining the scope of the baseline is the selection of the key metrics that are used to evaluate the performance of the baseline model and that should be output from simulations carried out through the airport digital twin. These metrics should address the core objectives of the decarbonization roadmaps and should be used to evaluate the success of undertakings toward net-zero goals. Such metrics can then be utilized to carry out the aforementioned M&V approach to evaluate the actual impact of decarbonization projects as they are deployed in the airport. The two key metrics used for this purpose in this study are (1) energy consumption at the building and site level, divided into gas and electricity, and (2) CO2 emissions. Within the broader Stargate project scope, a comprehensive framework for circularity has been developed (University Hasselt and Brussels Airport Company, 2022), which includes these and other metrics (such as, for example, renewable generation on-site), which can be interrogated through the digital twin. The twin metrics of energy and CO2 emissions were chosen to identify measurable impacts that will be analyzed in the upcoming years of the Stargate project.
2.3.2 Definition of baseline boundaries
2.3.2.1 Emission scopes
To define the boundaries of baseline, a first selection was made to include the two main emission scopes on which airports have the most direct control, i.e., scope 1 (emissions from airport-controlled sources) and scope 2 (emissions from purchased electricity). Within these two scopes, the ACA framework specifically includes the following: for scope 1, vehicles and ground support equipment (GSE) that belong to the airport, on-site waste management, on-site water management, on-site power generation, firefighting exercises, boilers and furnaces, de-icing substances, and refrigerant losses; for scope 2, off-site electricity generation for heating, cooling, and lighting. When creating a baseline on the built environment, this means including in the model the main sources of CO2 emissions included in the above scopes, which are also those that will be affected the most by the decarbonization measures included in the roadmap developed by Brussels Airport. As such, the baseline analysis documented here does not include wastewater management, firefighting exercises, de-icing, or refrigerant losses. Furthermore, as far as vehicles and GSE are concerned, they are considered only from the perspective of their future electrification and its impact on the on-site grid, power demand, and generation. As part of the research activities carried out within the Stargate project, a baseline analysis and categorization of on-site waste generation and management was carried out; however, this activity and its results are outside the scope of the present paper and are not described here.
2.3.2.2 Reference year
Brussels Airport identified the year 2019 as the most suitable choice for a reference year. This is because 2019 was the last year of operations that had not been affected substantially by the COVID-19 pandemic, which had massive impacts on both the airport and building standard operations. Furthermore, 2019 was the most recent year for which data were available for one full year to support the evaluation of the above-defined metrics and feed into the development of the digital twin model. This choice is also in line with industry commitments that endeavor to make 2019 the peak year in emissions from European aviation (Finger et al., 2021). The evaluation of further years before 2019 was considered; however, it was discarded due to two main factors: on one hand, the limitations of the available data meant that 2019 was the most complete dataset; on the other hand, the challenges in the static data collection on the geometry and systems of buildings implied the risk of reduced accuracy in the assumptions on the model, which increased the further the analysis went back in time. In keeping with the objective of the present research to pursue an acceptable trade-off between effort and accuracy in the creation of a digital twin baseline, it was decided to restrict the baseline to one single year.
2.3.2.3 Built environment boundaries
The Brussels Airport site boundary contains over 250 buildings. As such, an initial exercise was undertaken jointly by the authors to identify buildings that are the most significant from the perspective of decarbonization. This meant, in practice, identifying the buildings that have the highest contribution to the energy consumption of the airport and the ones that will be affected by decarbonization projects according to the Brussels Airport roadmap. This exercise had the two-fold outcome of ensuring that the scope of analysis remained focused on the most relevant buildings and that the effort and time put into the data collection and creation of the baseline models was the most effective.
At the first stage of the analysis, the airport terminals and a subset of directly adjacent buildings were identified as relevant due to their high energy consumption, extensive passenger use, and the substantial amount of available data. Furthermore, these buildings encapsulate the core functionalities of the airport and its management company. The buildings included in this terminal subset are identified in Figure 1. These 11 buildings are identified by unique 1–2 letter sets in the markers in the image. It shall be noted that buildings S and Pr are considered one for the data collection and organization purposes and, as such, have been combined in the following analyses. For the purposes of this study, the digital twin includes 10 buildings in the terminal subset. Where relevant, other buildings were included in the analysis. This will be highlighted as required in the subsequent pages and summary tables.

Figure 1. Core terminal buildings included in the analysis. Map data from: Google; data SIO, NOAA, U.S. Navy, NGA, GEBCO; IBCAO. Imagery from the dates 14/12/2015–18/07/2022.
In the second stage, it was decided to ensure that the analysis would thoroughly address the decarbonization of the district heating networks (DHNs), which serve the terminal side (passenger services) and the cargo side of the airport, respectively. As such, the scope was expanded to include the technical service buildings that house the heat generation system for each DHN. Furthermore, all buildings connected to each of the DHNs were considered relevant for inclusion in the baseline. On the passenger terminal side, this accounts for the 11 buildings previously identified, with the addition of a further 12 models in the DHN. On the cargo side, this accounts for 11 buildings that are part of the DHN. All these buildings are then further included in the modeling of the power network, which includes four additional buildings on each side that have sufficient data for their addition to the digital twin. As a result, the final number of buildings included in the Brussels Airport digital twin (BADT) is 40, with 27 on the passenger terminal side and 13 on the cargo side.
This was considered a sufficient number to comprise a significant baseline upon which to carry out an extensive data collection exercise and the creation of a digital twin, which includes both the buildings and the networks that connect them. The chosen buildings have an aggregated demand that is the majority of the whole site consumption. Therefore, it is expected that undertaking decarbonization measures on these buildings will have the greatest potential to reduce both the demand for energy and CO2 emissions. Therefore, the detailed modeling of these buildings and networks was the focus of the data collection and baseline creation. The buildings included in the baseline, visualized in the context of the whole airport site, can be seen highlighted in green in Figure 2. To provide a coarse indication of the size of the buildings in the BADT, Table 1 shows an approximate calculation of the volume of each of the 40 buildings and the total on the terminal and the cargo sides.
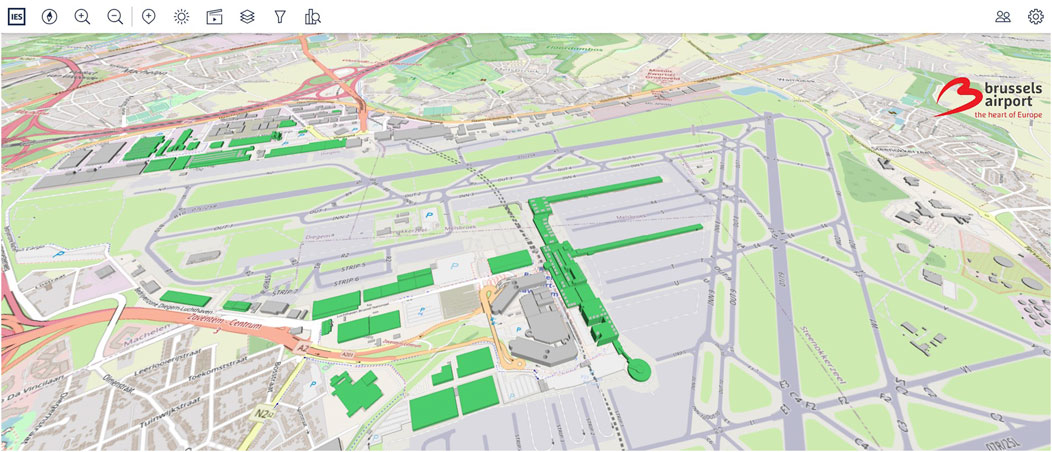
Figure 2. Baseline buildings highlighted in green (cargo to the north and passenger terminal to the south) in the 3D digital twin viewer provided by IES (iCIM). Map data © OpenStreetMap.

Table 1. Approximate volumes of buildings on the passenger terminal side (left) and the cargo side (right), which were calculated from building footprint and height.
2.3.3 Data collection
2.3.3.1 Data sources
The data required to create the baseline digital twin model can be broadly divided into two categories: static and dynamic data. Static data are defined as information that does not vary over the operational life of the building or network; this includes intrinsic properties that descend from the construction of the infrastructure, e.g., its geometry, shape, and location; physics parameters such as thermal resistance; or the presence and characteristics of large fixed equipment. Dynamic data are defined as information that can change over variable time spans, from very brief resolutions (minutes) to a yearly scale. These data, usually collected and organized as time-series, include (metered) energy consumption, patterns of occupancy, and local weather (e.g., outdoor air temperature and solar irradiance). Further data can be useful for the analysis of the present study if available, such as metered CO2 emissions and sub-metering of electricity consumption through dedicated measurement of significant plug loads or lighting. Finally, other dynamic data that are relevant in a broader digital twinning perspective and have been reviewed in the scope of this work but are not required for the analysis discussed in the paper include data on solid waste, water consumption, local noise, and air quality.
2.3.3.2 Data collection process
Data collection, at its core, is by its nature an iterative process with subsequent layers of increasing depth. At the start of the Stargate project in November 2021, IES, with extensive support from Brussels Airport, performed a site visit to inspect the built environment of the airport. At this stage, the authors endeavored together to define the scope for baseline modeling and the creation of the digital twin. The terminal buildings were the main focus of this first site visit, during which observations were made on the approach to develop the model for these spaces and structures. Furthermore, the activities focused on defining the initial set of data that would need to be provided from Brussels Airport to IES to start developing the baseline model, focusing on the passenger terminal side. By spring 2023, a large part of the initial data collection process was completed. In August 2023, a second site visit was undertaken to survey the buildings and networks that were further included in the scope of the DHNs on both the terminal and cargo sides. The aim of this visit was to evaluate the condition of these buildings and identify their functions and the equipment they house, which would generate the highest energy demand. This second site visit laid the groundwork for additional insight and alignment between IES and Brussels Airport on defining the level of accuracy required for the modeling in the digital twin of the baseline and in understanding the scope and ambitions of the net-zero carbon goals in the Brussels Airport roadmap relevant for the development of the BADT.
From the perspective of the process of data collection, it is worth highlighting that on-site observations and unstructured conversations with the occupants and operators of the buildings have been crucial to capturing information that otherwise would not have been available in the static or dynamic data provided via more structured data transfer of files and datasets. The data collection process consisted of site visits and ongoing, frequent online meetings to communicate as clearly as possible regarding the data required by IES to create the digital twin and the data available from Brussels Airport regarding their built environment.
2.3.3.3 Collected data
As a result of this extensive data collection process, a subset of key data items emerged as the most relevant for the creation of the BADT: a site map, detailed drawings of the buildings, insulation properties, metered energy data, network diagrams, and carbon emission coefficients. As a first step, the site map of all buildings included in Brussels Airport was provided, which locates all buildings and identifies them with a unique numerical identifier and the building name. This information is helpful in understanding the function and use of the building. For security reasons, in the present paper, this information is not shown, and the buildings are assigned a number or letter identifier. This unique identification is the key at the start of the data collection process as it is used in further datasets (e.g., metered energy consumption) to organize the information provided. As such, the site map acts as an initial match list to ensure that data provided subsequently can be assigned to the correct building. In the core subset of passenger terminal buildings, static data were available at a high level of detail. For several of these buildings, Brussels Airport provided technical drawings such as floor plans, elevations, and detailed lists of the equipment installed. This information was key for allowing a high level of detail in the modeling of their geometry.
To enable accurate analysis of the energy demand, a key factor to include in the models is the insulation of the buildings. It has a significant impact on both cooling and heating demand, and its estimation by way of the thermal transmittance of various parts of the envelope (U-values of walls, roofs, floors, and windows) is crucial to achieving an accurate virtual representation of the buildings from the thermal perspective. For this purpose, Brussels Airport provided U-values and dates of construction for key structures in the buildings to be included in the BADT. An extract of these data is shown in Table 2. These data were provided for buildings on both the terminal and cargo sides.
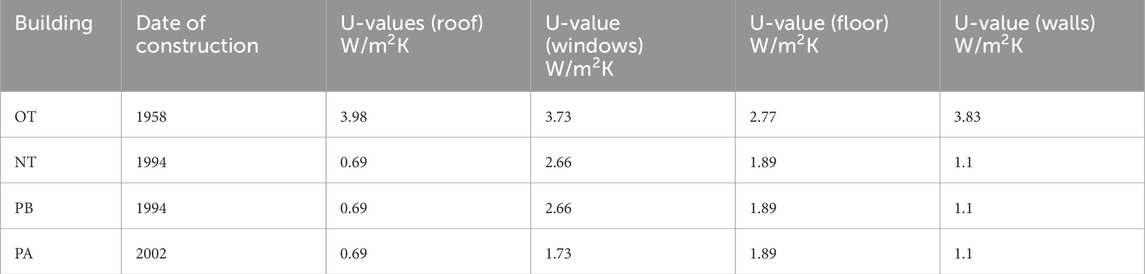
Table 2. Sample of U-values provided for the airport buildings (extract of the terminal subset).
To develop an accurate baseline digital twin model of the airport, the most important dynamic dataset is metered electricity and gas consumption. At the time of the work reported in this paper, Brussels Airport was transitioning across data platforms as part of an extensive effort to catalog and streamline the management of metered data. IES was provided access to these platforms and collected all available data. The dataset available was not fully complete due to the ongoing transition effort; however, it made it possible to collect data at high resolution on the overall live site consumption and the production of existing PV installations on site. These data were exported as time-series to be made available to the digital twin. In addition to these data, Brussels Airport also provided IES with a large dataset of daily electricity consumption data ranging from 2010 to 2019. These data are limited to the buildings owned and controlled by the airport company as other tenants on site have their own metering provided by their utility, and these data are not shared with the airport company. This set of data was the main source of energy consumption (electricity) for the 2019 baseline for the buildings included in the BADT. On the gas data side, the most detailed set available to Brussels Airport and shared with IES was identified as the dataset used to create energy audit reports. These reports cover both the terminal and cargo networks and follow the same data collection approach, which ensured that a consistent approach was also translated to the digital twin. The reports themselves were additionally helpful in providing further details on the DHNs, the generation and transmission equipment and piping, and the buildings served. Finally, to model the DHN in detail, Brussels Airport provided IES with layouts of the networks themselves, including geospatial information and details of the infrastructure properties. These data were needed to ensure a sufficient level of detail in the DHN model, enabling the creation of an accurate digital twin of the networks that would be decarbonized and electrified in the future.
The last data point needed to create the baseline is the CO2 emission coefficients for the baseline year 2019 in the local context of Belgium. These coefficients are required to convert various energy consumption amounts into the equivalent CO2 emissions. For this purpose, data on the carbon emissions per various energy sources were collected from the online service Electricity Maps. The information included in the service comes from sources such as ENTSO-E and is subsequently post-processed (Electricity Maps, 2024).
2.4 Baseline creation
2.4.1 Software used
The digital twin suite utilized to create the BADT is the Intelligent Communities Lifecycle (ICL) software suite developed by IES (Integrated Environmental Solutions Ltd, 2019). For the purpose of the creation of the BADT, four tools in the ICL suite were used: iCD (intelligent Community Design), iVN (intelligent Virtual Network), iSCAN (cloud platform for data management and analysis), and iCIM (intelligent Community Information Model). A high-level graph of ICL software utilized within the Stargate project, showing all interconnections between the tools in the ICL suite, is shown in Figure 3.
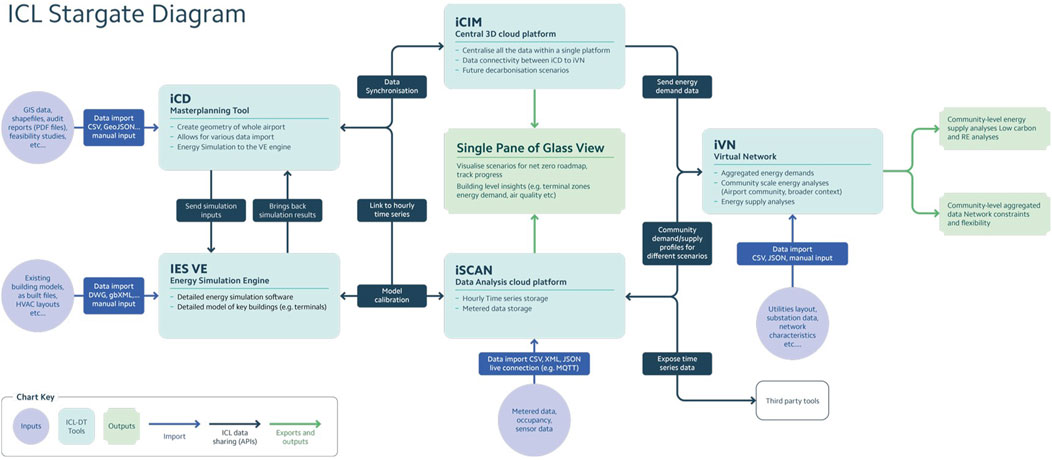
Figure 3. Overarching architecture of the ICL software suite utilized in the present research, showing data inputs and APIs for data sharing across the digital twin tools. For the purposes of the research work presented in this paper, only iCD, iVN, iSCAN, and iCIM are relevant.
The first software program used is iCD, which is a masterplanning desktop tool used to create and modify the 3D geometry of the airport (including its campus and local context) (Integrated Environmental Solutions, 2024a). The iCD allows the energy modeler to assign a number of relevant attributes to each building. This includes both static performance parameters (such as thermal transmittance of the envelope and the glazing ratio of windows) and variable parameters that depend on the configuration and occupancy of the buildings and their systems (such as the installed lighting type, its power and related heat gain, the profiles of use of lighting, heating, and cooling, and the efficiency of the systems). In iCD, it is also possible to import and assign metered consumption data to each building that is present in another tool of the ICL suite, iSCAN (discussed further below). In short, iCD is used to edit the buildings’ geometry and geolocation and assign all relevant static and dynamic data to each of them. Once this is completed, the created physics-based model can be used to run simulations of energy demand using the embedded dynamic thermal simulation engine Apache, a dynamic thermal simulation program based on first-principles mathematical modeling of the heat transfer processes occurring within and around a building. The proprietary Apache engine also powers the IES Virtual Environment (VE) software, which has been extensively tested for its accuracy by the scientific community (Christensen et al., 2013; Reeves et al., 2015; Erdogan, 2020) and is broadly used by researchers for a wide variety of investigations of the performance of the built environment (Ahmad et al., 2017; Mane et al., 2020; Thomson and Partners, 2020; Chang et al., 2024). iCD has been utilized for analyses at the building scale, such as for public building portfolios (Bo, 2021) and urban districts (Byrne et al., 2024).
The other desktop software program used is iVN, which is used to model, compare, and optimize networks of different on-site resources, such as power, water, district heating, and cooling (Integrated Environmental Solutions, 2024c). The network model can be set up to include the demand from buildings, electric vehicles, and other on-site loads on the local grid and the on-site generation of power and energy, including from renewable sources (Pierce et al., 2024). The software program was used, in the scope of the present study, to analyze the design and management of heating and electricity networks in the BADT. The demand of the building is generated by iCD software, and it can be exported to the iVN and linked to the relevant building nodes in the analyzed networks. iVN software utilizes 2D schematic models for interconnected virtual networks on multiple commodities (e.g., electricity, heat, and water) to perform simulations to aggregate the demand per commodity and allocate loads based on the demand in the networks. It also includes physics models for multiple assets that can be included in the network as demand or generation nodes, such as PV panels, wind turbines, and storage devices. The network modeling allows accounting for a hierarchy of aggregation via parent–child relationships between linked nodes, and for each node, it is possible to define a control strategy that specifies how loads are allocated (balanced, ranking, and sequential strategies) (Integrated Environmental Solutions, 2024c).
The dynamic time-series data on energy consumption (metered) and demand (simulated from iCD) are centralized in iSCAN, a data analytics cloud platform tool (Integrated Environmental Solutions, 2024b), which in the BADT is used to include both datasets. The iSCAN platform allows the collection of time-series data from multiple building and energy management systems, IoT sensors, and historic datasets (Kerrigan et al., 2020). Data can be imported manually or retrieved via automated connections such as FTP, MQTT, email, or via REST API in multiple open formats (CSV, JSON, SQL, and XML), and it is organized as channels (time-series of one measurement), which are grouped in projects and buildings. While the iSCAN platform allows for very high granularity of data (visualizable down to 1-min steps), interaction with iCD exports the data at time-steps of 1 h, which can be used to validate a model baseline.
The physics-based models created in iCD and iVN, enhanced and validated to become an accurate digital twin using metered data available in iSCAN, can be interrogated through the iCIM, a cloud-based 3D viewer that allows access, navigation, and interaction with the models. iCIM further supports the interconnection of multiple iCD models of the same area, allowing collaborative work on the same digital twin. It is used to present the digital twin via scenarios and scenes, which can be configured to filter the data in the DT to create relevant visualizations for end users and decision makers.
2.4.2 Model creation
The creation of the baseline model, much like the previous data collection phase, is an iterative process of refinement, with further details added to the buildings and network models as they become available. The first stage is the development of the geometry. This is followed by the characterization of key thermal properties for each building. Then, finally, the reference data for the baseline year are processed.
2.4.2.1 3D model of the built environment
Within iCD software, all buildings on the Brussels Airport site were created as shells. This is shown in Figure 4. On the subset of 40 buildings that compose the baseline, the geometry was developed to a greater detail, which corresponds to the level of detail (LoD) 2 in the CityGML standard (Gröger et al., 2012). LoD 2 is an intermediate level of accuracy that includes building installations and roof structures. LoD 2 allows the representation of subdivisions of the exterior shell of the building (walls, roofs, and ground plates), creating a generalized geometry that can be utilized by energy simulation (Malhotra et al., 2022). Beyond the geometry definition, where information was available on the static properties of these buildings, it was assigned to each building; otherwise, relevant templates were used where data were not available. For example, for office buildings, the modelers assigned the overall building’s primary use as “office,” which in turn assigns default values from building codes and international standards like ASHRAE to several parameters of the building. An example of such default assignment and manual overrides where data were available is shown in Figure 5. Furthermore, the appropriate CO2 emission coefficients for Belgium for 2019 were configured in software to be used in the subsequent analyses. These values were set to 0.515 gCO2-eq/kWh for natural gas and 0.202 gCO2-eq/kWh for electricity. Once these assignments were completed to the best of the modelers’ knowledge, based on all information collected from site visits and documentation shared by Brussels Airport, it was possible to run a first simulation for the year 2019 to generate the first set of results to be compared with the 2019 metered historical data.
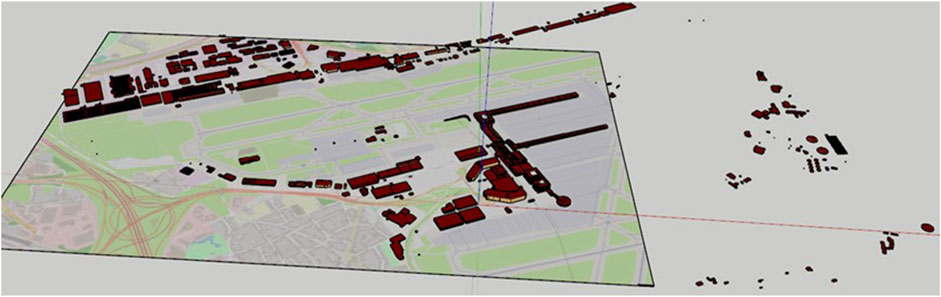
Figure 4. Geo-located 3D model of Brussels Airport, with detailed geometry on the 40 buildings included in the baseline subset. Map data: OpenStreetMap.
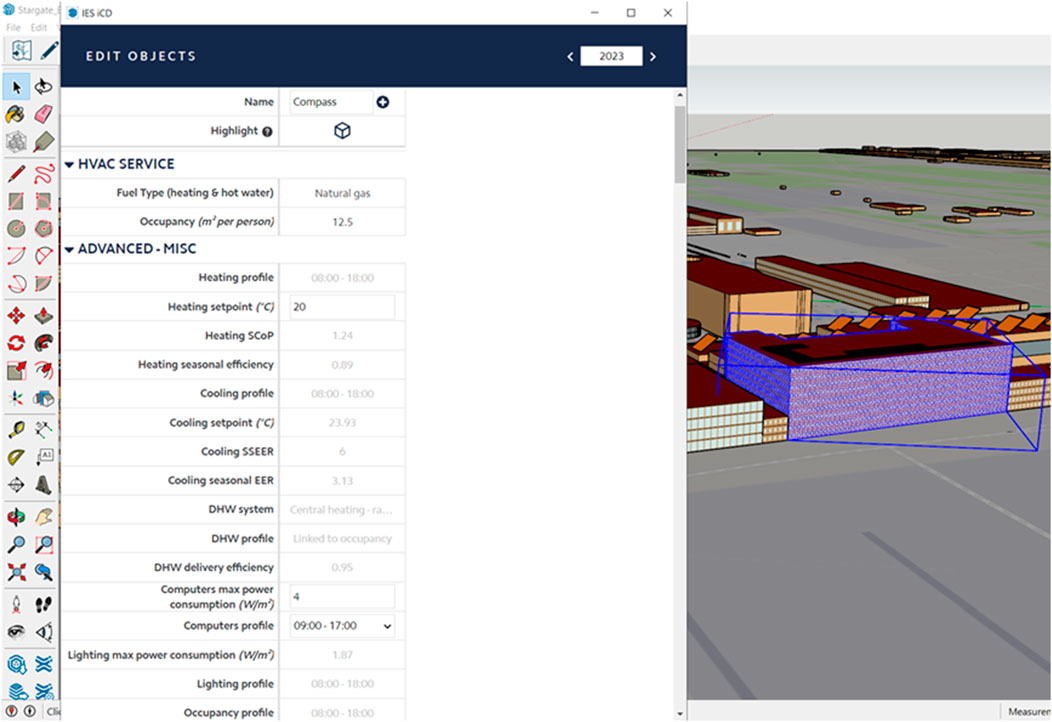
Figure 5. Detailed assignment of envelope, systems, and occupancy parameters to each building in the digital twin. The information in gray descends from templates, while the information in black is from manual input where data were available (e.g., the heating set-point of 20°C).
2.4.2.2 Processing of historical metered data
The electricity time-series data for key buildings owned and managed by Brussels Airport, available at daily resolution from 2010 to 2019, were imported to the iSCAN data management platform, from which they could be interrogated and further post-processed as required. As previously mentioned, the reference year chosen for the baseline is 2019, and as such, these were the data used for the validation of the BADT. A sample of these time-series for one building is shown in Figure 6. As previously mentioned, the gas time-series data were made available at monthly resolution for the year 2019, and as such, it did not require further post-processing.
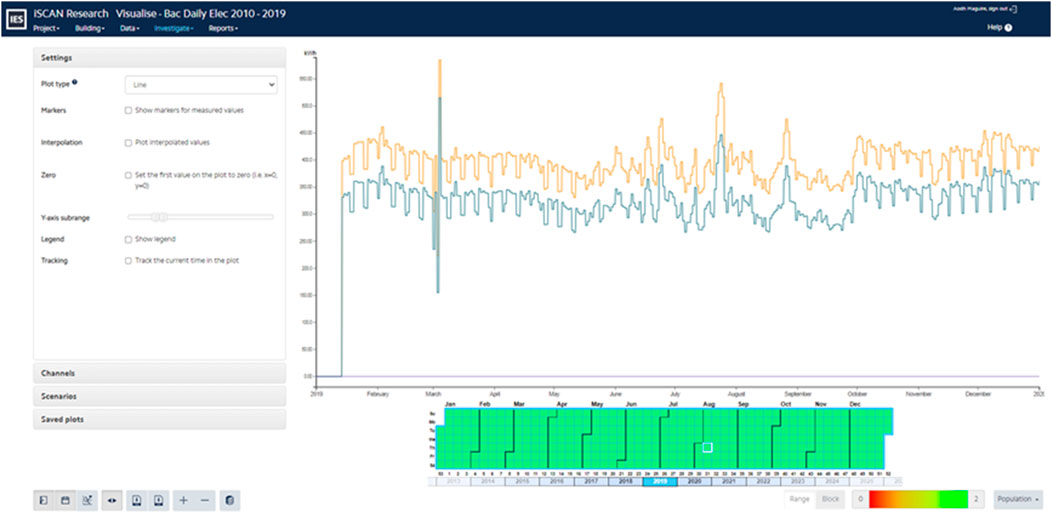
Figure 6. Daily electricity consumption for the OT building (raw data for the year 2019); data stored and visualized in the iSCAN platform.
2.5 Baseline validation
2.5.1 Model validation process
The 40 buildings in the BADT were then each validated against the yearly gas and electricity consumption collected for the year 2019, as previously described in 2.3.3.2 “Data collection process.” Validation for each building was considered achieved once the difference between the yearly demand for 2019, simulated from the BADT, was within ±10% of the measured data for the baseline year. To reach this result, uncertain and unknown parameters were adjusted. This adjustment was carried out within acceptable ranges, as defined by the expert assessment from an energy modeler, who could identify the ranges for each parameter that would better represent the reality and behavior of the buildings at Brussels Airport. In particular, the validation process started by identifying those parameters that were expected to be the most relevant in contributing to the energy demand and CO2 emissions of the buildings, which differ between gas and electricity consumption. For gas consumption, these parameters are boiler efficiency, heating set-points, thermal transmittance, and the demand for domestic hot water (DHW). For example, heating set-points could vary between 16°C and 22°C depending on building use and age, while boiler efficiencies could be as low as 75% for older systems. To set these parameters, it is crucial that the evaluation is done by an expert energy modeler with a background in building physics and that robust reference sources are utilized when in doubt regarding the acceptable ranges of key parameters. For electricity consumption, these parameters are the type and profiles of lighting, the demand for auxiliary energy, the consumption of IT equipment, and on-site processes. In electricity consumption profiling, understanding the schedules of use is key, along with the types of equipment (e.g., the type of lighting could be halogen, fluorescent, or LED, depending on the lamping age, and each of the types comes with substantially different W/m2 consumption). Furthermore, while for offices, the main driver of electricity consumption is lighting and IT equipment, on other buildings (which is the case of airports), the consumption of large plug loads and on-site processes can be substantial. For both gas and electricity consumption, occupancy and use of each building are highly relevant. It is important to note that there is a delicate balance that must be achieved on these parameters to validate both the gas and electrical consumption as the two sets of parameters are interconnected with cross-domain impacts. For example, an increase in on-site equipment usage (which directly impacts electricity consumption) can decrease the demand for heating and, thus, gas consumption due to the excess heat provided by electrical loads in indoor spaces. Similarly, the definition of thermal set-points that must be maintained throughout the operation of the buildings (and by the virtual replicas of their systems) can impact the electricity demand, for example, from a cooling perspective. As such, a practical recommendation for energy modelers undergoing this validation activity is to consider these interconnections when working on model adjustments, start by adjusting a small number of most uncertain assumptions with the biggest impact, and analyze the results on both gas and electrical consumption before proceeding further. When working on models with high resolution (e.g., requiring calibration at 1 h time-steps), this process should be supported by a sensitivity analysis to illuminate the impact of model parameters and their correlation (Tardioli et al., 2022) and be able to identify where to best devote the calibration effort; however, this was not required for the resolution of the present work.
For each of the 40 buildings in the BADT Baseline, simulations were run in iCD for the full year of 2019 at hourly time-steps. These data were exported to iSCAN and aggregated to yearly totals for comparison to the available metered data. All sources of electricity demand were utilized for its validation, while for gas validation, the results used combined room-level heating load simulations and building DHW demand. In this process, the validation accuracy of the heat demand and the consumption of natural gas were considered of higher priority compared to the validation of the electricity demand. This is due to the high priority given by Brussels Airport to the reduction of scope 1 emissions (fossil-free heating) in its roadmap: the baseline must be fit for the purpose, with the heating network validated to a higher level of accuracy, affording greater confidence in using the BADT to model the net-zero projects on heating decarbonization in the Brussels Airport roadmap.
2.5.2 Resource network modeling
Once validation was achieved and its results were made available as simulated heating and electricity demand for all buildings in the baseline, these results were imported to the iVN, where the main resource networks in Brussels Airport were modeled as interconnected nodes. These network models were created according to the schematics and maps provided to IES by Brussels Airport as part of the data collection stage. The network models include on-site demand for buildings (from validated simulation) and assets and on-site energy generation. A schematic view of the networks in the passenger terminal and cargo sides is shown in Figure 7. These networks are modeled with the geospatial reference to the buildings and assets in the digital twin, as shown in Figure 8.
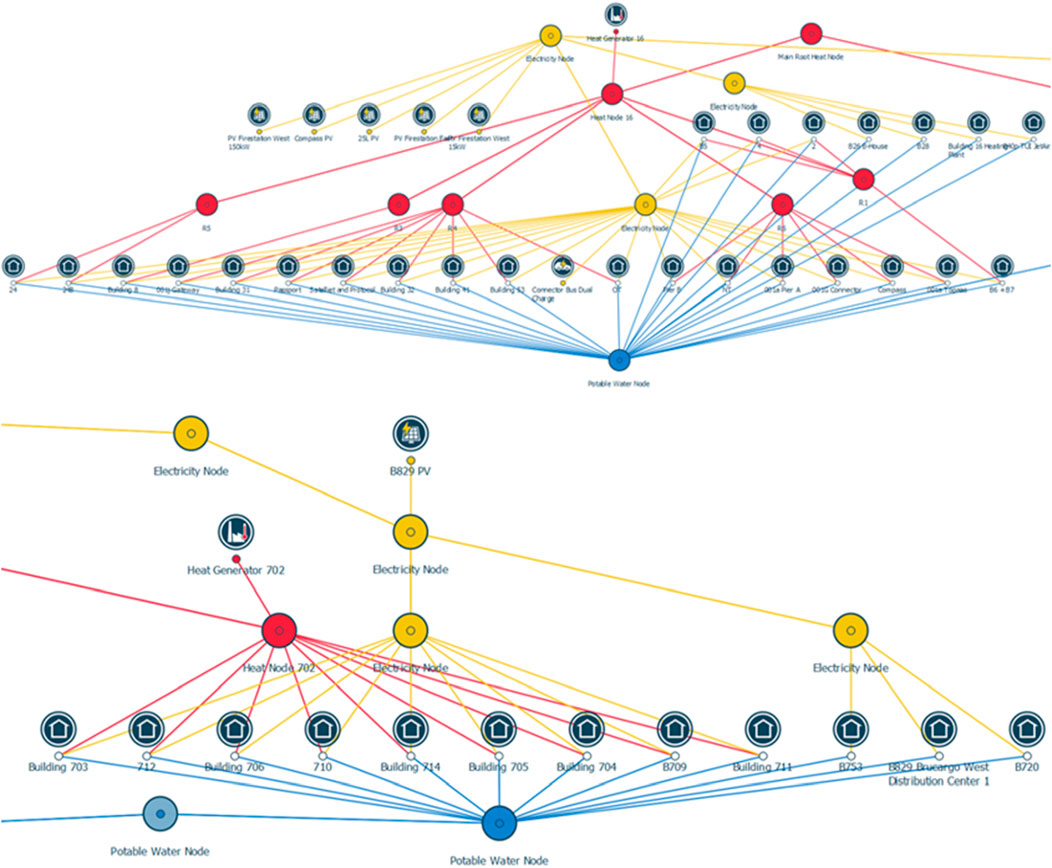
Figure 7. Schematic view of the resource networks of the Brussels Airport digital twin (passenger terminal side above and cargo side below) in the iVN. The yellow network is the electricity grid, the red network is district heating, and the blue network is potable water.
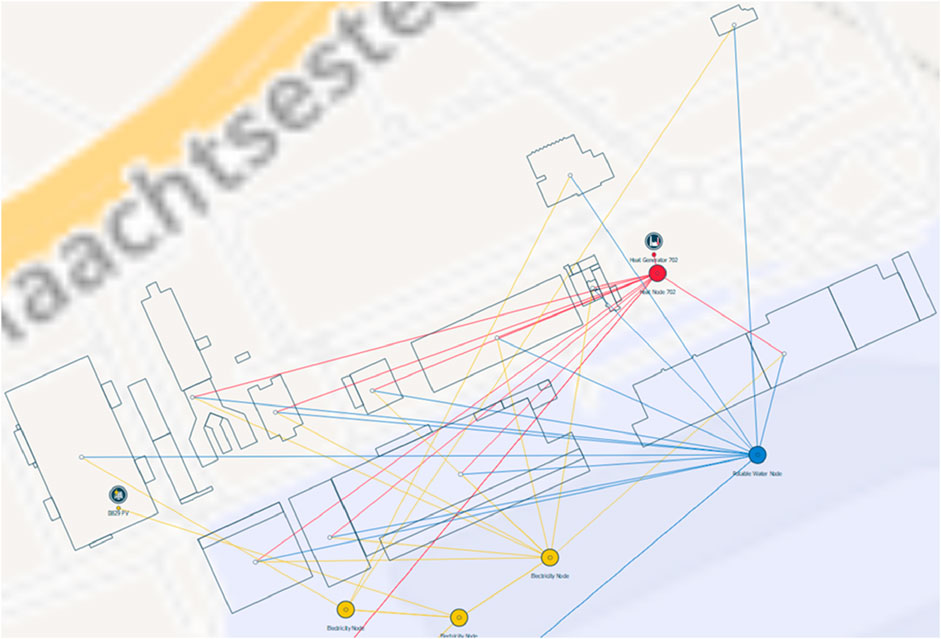
Figure 8. Extract of the geographic view of the networks on the cargo side, showing the connection of network nodes to the buildings on site.
On one hand, the heating networks interconnect the technical installations and gas boilers to the buildings where demand originates; on the other, the electricity networks modeled in the BADT include not only the buildings but also the 30 EV charging stations, which are already present in Brussels Airport, and six existing PV arrays on both building roofs and the land managed by the airport.
3 Results
3.1 Energy consumption
3.1.1 Terminal side
The results of the validation process on the passenger terminal side are shown in Tables 3, 4, which show, respectively, the heating demand of the buildings on the terminal side DHN and the electricity demand of relevant buildings on the passenger terminal side. In both tables, the first column encodes the building identifier, the second shows the measured consumption for the year 2019, and the third shows the demand simulated by the digital twin for the same year. The last column shows the difference between these figures. Finally, the totals for both the measured consumption and simulated demand are shown to calculate the overall accuracy of the DT on the local heating and power network demand forecasts.

Table 3. Validation results for the gas demand of the heat network on the passenger terminal side showing comparison of yearly consumed and simulated data for the year 2019 and the percentage difference.
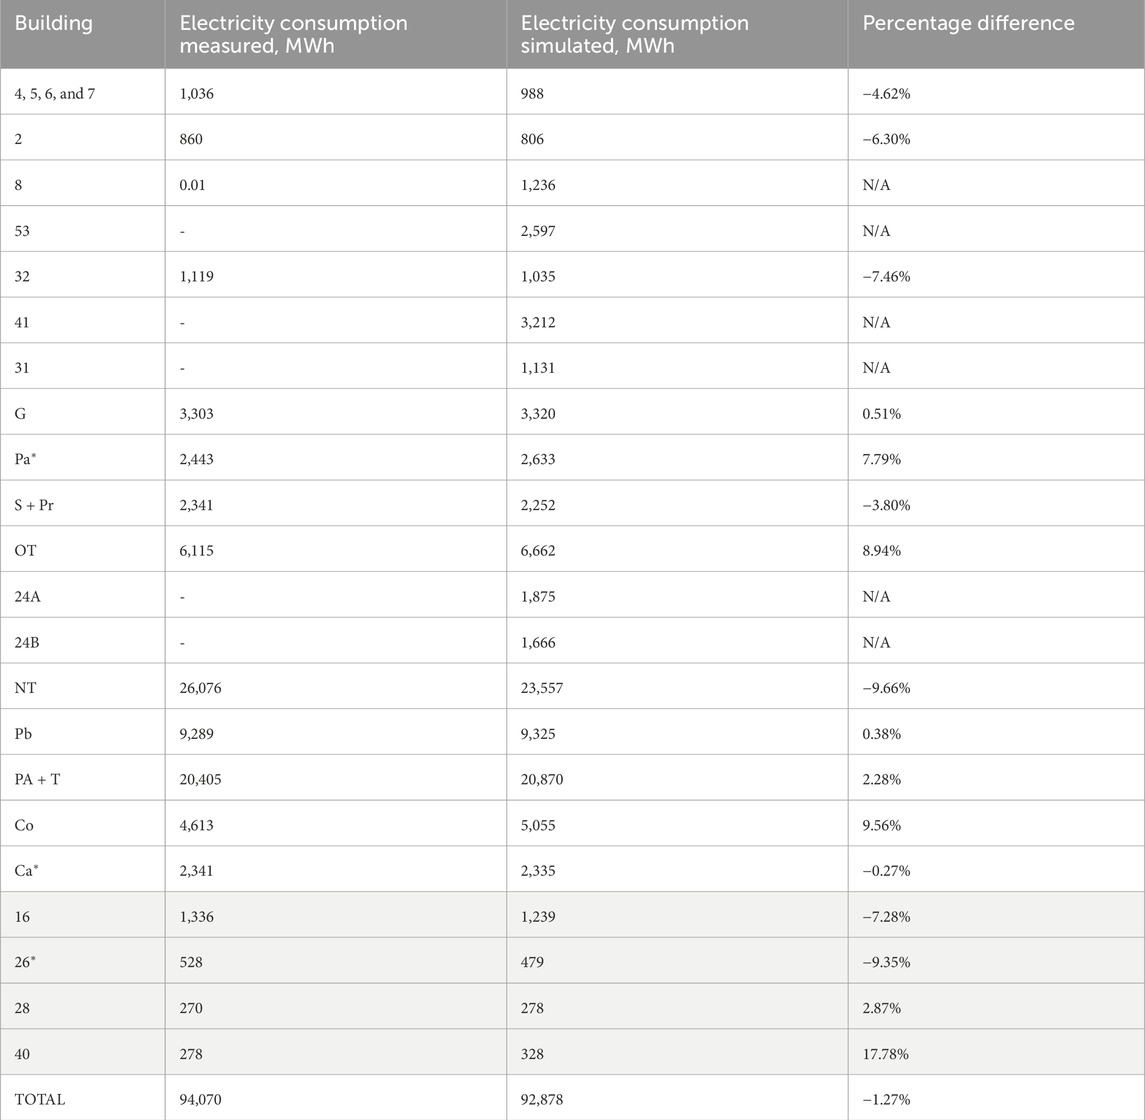
Table 4. Validation results for the electricity demand of buildings on the passenger terminal side showing comparison of yearly consumed and simulated data for the year 2019 and the percentage difference. The four shaded rows at the end are buildings that are included only in the electricity network.
3.1.1.1 Details of heating demand results
The total metered demand on the passenger terminal side heating network buildings for the baseline year 2019 is 43,885 MWh, while the total simulated demand is 44,051 MWh (an overall approximation error of 0.38%, with accuracies ranging from −9.34% to 10.09%, an average of 1.62%, and a standard deviation of 5.92%). Where relevant, buildings were combined based on how the data are grouped in the source dataset of the energy audits carried out by Brussels Airport. It is also worth noting that the buildings noted with an asterisk (∗) have had their measured data calculated through an equivalent building energy use intensity (EUI) approach. Specifically, this has been applied to building 24A and Ca. In building 24A, the source data were for an incomplete period and, as such, much smaller than expected. On the other hand, building Ca was completed and occupied in the year 2022. As such, no data were available; however, the building is relevant for the baseline of future decarbonization actions undertaken by Brussels Airport. The EUI approach followed in this work consists of identifying the most similar building in the dataset by function and usage pattern, calculating the energy consumption per m2 of that building (reference building, RB), and applying it to the relevant surface of the building with missing consumption data (target building, TB):
For example, for building 24A, the neighboring building 24B was chosen as the most appropriate equivalent building. Similarly, for Ca, the EUI for S + Pr was used (as these two buildings were in use in 2019 for the same function as Ca since it has become operational in 2022).
3.1.1.2 Details of electricity demand results
The total metered demand on the passenger terminal side power network for the baseline year 2019 is 94,070 MWh, while the total simulated demand is 92,878 MWh (an overall approximation error of −1.27%, with accuracies ranging from −9.66% to 17.99%, an average of 0.11%, and a standard deviation of 7.89%). Here, it shall be noted that, as above, the EUI approach was applied to buildings Pa (reference building: G) and Ca (reference building: S + Pr). For a few buildings, no metered data were available in the data repositories nor were there any alternative buildings to be used as references for EUI calculation. However, these buildings were confirmed to be validated for the heat demand (which is the main priority for the present analysis). Furthermore, their simulated demand is overall 10% of the total, and as such, the lack of metered data did not substantially alter the analysis. These buildings are 8, 24A, 24B, 31, 53, and 41. For the total calculation of metered data, the simulated values were used for the purpose of calculating the overall error on the simulation. Excluding these buildings, the total metered demand is 82,353 MWh and the total simulated demand is 81,162 MWh, with an overall error of −1.45%, which confirms the accuracy of the electricity simulation results.
Finally, it can be noted that building 40 is not validated, with the simulated demand being almost 20% higher than the measured consumption. However, based on the known characteristics of the building, it would have been inappropriate to change model parameters to attempt to achieve a better match, which would not have been realistic of how the building is actually used.
3.1.2 Cargo side
The results of the validation process on the cargo side are shown in Tables 5, 6, which show, respectively, the heating demand of the buildings on the cargo side DHN and the electricity demand of relevant buildings on the cargo side. The last column shows the difference between these figures. Finally, the totals for both the measured consumption and simulated demand are shown to calculate the overall accuracy of the DT on the local heating and power network forecasts.
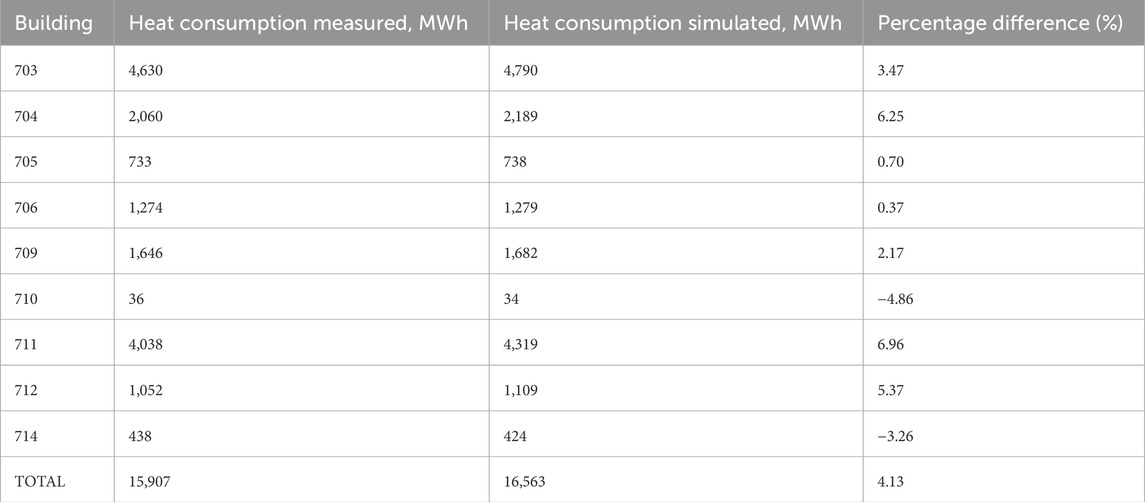
Table 5. Validation results for the gas demand of the heat network on the cargo side showing comparison of yearly consumed and simulated data for the year 2019 and the percentage difference.
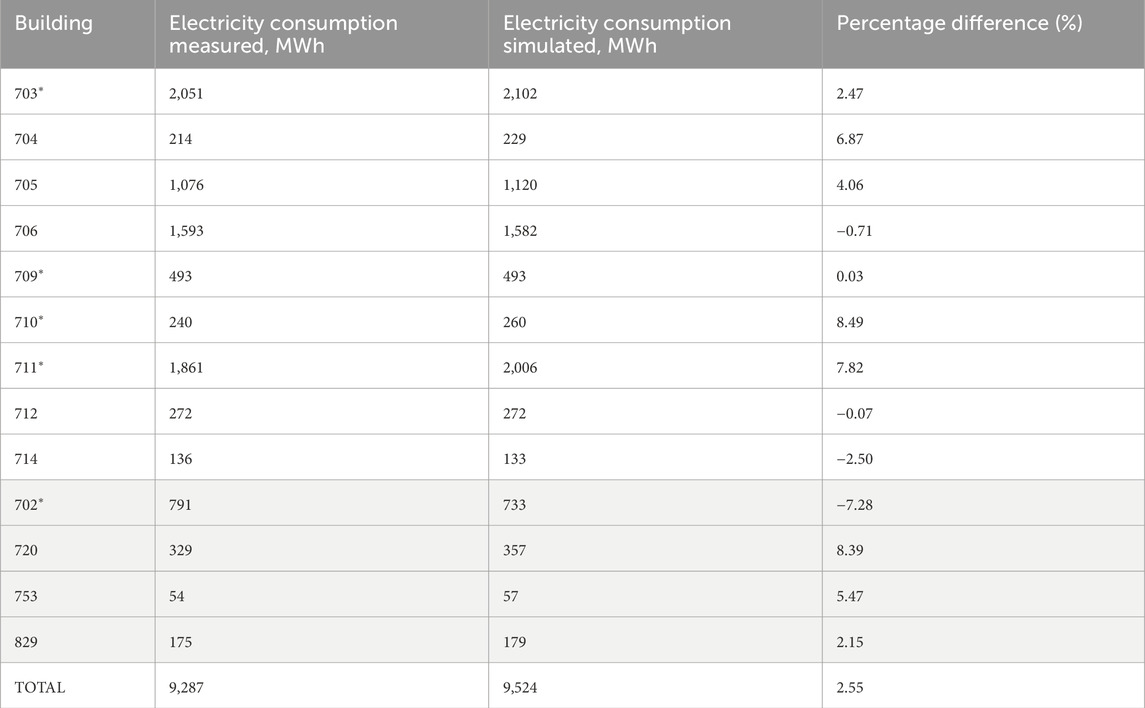
Table 6. Validation results for the electricity demand of buildings on the cargo side showing comparison of yearly consumed and simulated data for the year 2019 and the percentage difference. The four shaded rows at the end are buildings that are included only in the electricity network.
3.1.2.1 Details of heating demand results
The total metered demand on the cargo side heating network buildings for the baseline year 2019 is 15,907 MWh, while the total simulated demand is 16,563 MWh (an overall approximation error of 4.13%, with accuracies ranging from −5.56% to 6.96%, an average of 1.84%, and a standard deviation of 4.25%).
3.1.2.2 Details of electricity demand results
The total metered demand on the cargo side power network for the baseline year 2019 is 9,287 MWh, while the total simulated demand is 9,524 MWh (an overall approximation error of 2.55%, with accuracies ranging from −7.33% to 8.51%, an average of 2.76%, and a standard deviation of 4.75%). Here, it shall be noted that building 704 had a 2019 electricity demand of 69.70 MWh, which did not appear to be a realistic value due to the building function and usage pattern. As such, the electricity demand of 2017 was identified as a more appropriate value for a baseline reference. Furthermore, the above-mentioned EUI approach was applied where measured data were not available, as follows: for building 702, the reference was building 16 (both are technical installations); for buildings 703, 709, and 710, the reference was building 705 (a warehouse); and building 711, a mixed-use building, had the EUI of buildings 705 and 706 (offices) applied in proportion to the relevant floor area.
3.1.3 Overall airport demand
The overall total heating demand in the baseline year for 2019 is 59,791 MWh (measured), and the value calculated by the BADT as the model reference baseline is 60,615 MWh (approximation error of 1.38%). The overall total electricity demand in the baseline year for 2019 is 103,355 MWh (measured), and the value calculated by the BADT as the model reference baseline is 102,402 MWh (approximation error of −0.92%). As can be expected, the core terminal buildings that were identified as the most relevant in the initial stages of selection of the baseline built environment boundaries (OT, NT, PA, Co, T, and Pb) account for a significant quota of the energy demand over the total baseline. Specifically, these core buildings together account for ca. 37% of heating and 64% of electricity demand over the entire baseline. Within the passenger terminal side networks only, they consume 51% and 71% of the heating and electricity, respectively.
Finally, the overall site electricity consumption of all 250+ buildings on-site in the reference year 2019 was 160,819 MWh. As such, it can be deduced that the baseline set of 40 buildings was correctly selected as a representative sample as these buildings consume 64% of the overall site electricity. The aforementioned core terminal buildings account for 41% of the total site electricity consumption. It can, therefore, be concluded that this baseline is a significant sample, including the foremost quota of on-site energy consumption and, as such, the most relevant target for the application of net-zero carbon measures.
3.2 CO2 emissions
The carbon emissions for the baseline year 2019 were simulated from the validated baseline model. The model of the heating networks included the efficiencies of each DHN based on the information provided by Brussels Airport: this allows the calculation of the actual building consumption for heating and DHW, accounting for the efficiency losses in transmission and at the point of generation. The carbon emission coefficient for natural gas for Belgium for 2019 previously defined was applied to each building to simulate the hourly values of CO2 emissions for the baseline year 2019. Similarly, the equivalent carbon emission coefficient for electricity was utilized. The resulting time-series was then exported to iSCAN to make the information available for inspection in the 3D viewer of the digital twin together with the energy demand. An example of this is shown in Figure 9. The total CO2 emissions for each building in the baseline can be seen in Table 7 for both the passenger terminal and the cargo sides. The total emissions on the terminal side for the baseline set of buildings for 2019 are 44,946 tons of CO2-eq, while the total emissions on the cargo side are 9,894 tons of CO2-eq. The overall emissions in the 2019 baseline are thus 54,840 tons of CO2-eq.

Figure 9. CO2 emissions and energy demand calculated from the DT simulation, shown as aggregated monthly values, attached to each building in the online DT viewer (iCIM).
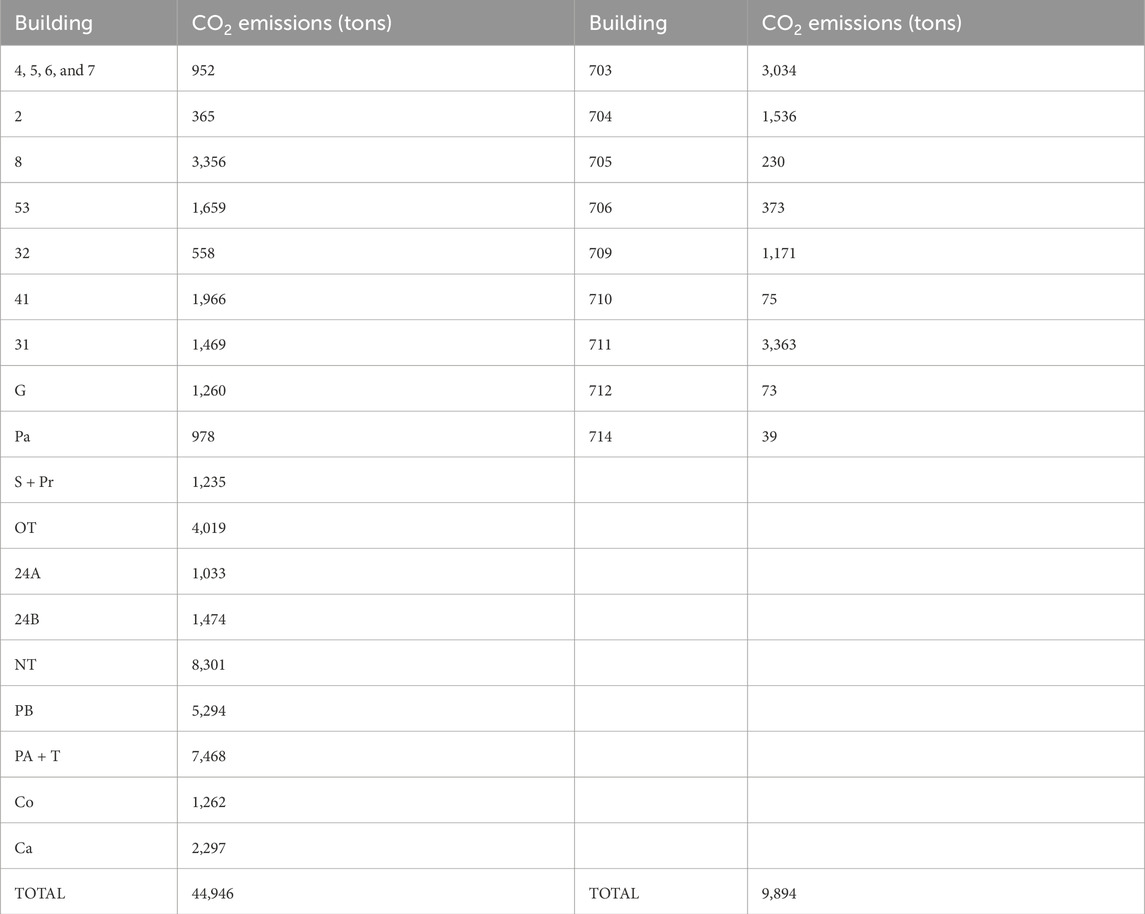
Table 7. Baseline CO2 emissions on the passenger terminal side (left) and the cargo side (right) based on simulated data for the year 2019.
As can be seen from the building-level data, the core terminal buildings (NT, OT, PA, Co, T, and Pb) have a substantial contribution to the overall CO2 emissions. However, differences can be identified in the relative weight of buildings in the CO2 emissions compared to the energy demand. For example, the Co building has a lower relative weight on emissions compared to its energy demand quota. This is because it has a comparatively low heating demand but a high electricity demand. The reverse is true, e.g., building 8, which has higher heat demand and lower electricity demand. The carbon emission factors in the Belgian context are much higher for gas than for electricity, which has a high contribution of renewable and nuclear energy. As such, it is expected that the CO2 emissions in the baseline will tilt toward the buildings that require high gas consumption for heating. Finally, it is worth noting that the cargo emissions are approximately 18% of the total baseline: as such, interventions in this area will yield lower overall impact than interventions on the passenger terminal side.
4 Discussion
In conclusion, based on the results obtained, it can be confirmed that the chosen set of 40 buildings out of the 250+ on the Brussels Airport site is a representative subset to form the baseline and utilize it to create the digital twin of Brussels Airport. Furthermore, through the validation process carried out against the actual data available for the year 2019, it was possible to conclude that the models are accurate in their simulation results, and, as such, they are suitable to be used for the modeling of the decarbonization projects included in the net-zero roadmap of Brussels Airport. It is worth highlighting that while the achieved validation shows very accurate results at the overall aggregated level, the range of accuracies at the building level varies within the defined +/−10% boundaries, with standard deviations in the 4%–8% range. The effort put in data collection, and in particular in understanding the usage patterns of each building (which can greatly affect the accuracy of models), has proven crucial in achieving robust results, enabled by accurate dynamic thermal simulations that are based on first-principles mathematical modeling of heat transfer processes occurring within and around a building. On the other hand, it is likely that the accuracy of the model on a more granular scale (monthly or daily), with the same input profiles, would have resulted in higher deviations due to the increase in resolution of the validation data not being matched by an increase in the resolution of the model data.
There are some limitations in the work presented due to the level of consumption data available, which allowed testing the accuracy of the model only at the yearly level. However, it must be highlighted that the purpose of the work of this paper was to create a digital twin baseline that would be reliable in analyzing the impact of long-term decarbonization measures over the period of several years, reducing the uncertainty in the future evolution of energy demand (a highly sensitive parameter for decarbonization pathways). As such, given the 20–30-year outlook of decarbonization roadmaps, accuracy at the yearly level appears sufficient at the time of writing. Furthermore, the work has uncovered the existence of a trade-off in the effort put in the data collection, modeling, and validation phases compared to the results. There appears to be a point of diminishing returns when it comes to the efforts put in the model preparation and creation of the digital twin, which the authors believe was reached in this work. One such example is the case of the previously mentioned building 40, which was not validated; however, given the small relative contribution to the overall energy demand and CO2 emissions, a substantial investment of effort, e.g., deploying additional data collection campaigns and audits, would have had a vanishing impact on the total performance of the digital twin.
We can thus conclude that the best practice when setting out to create a digital twin baseline for an entity as complex as an airport is to consider the overall purpose of creating such a baseline and make decisions on data collection and modeling efforts accordingly. Our recommendation for this type of work is to identify upfront what the decarbonization projects in the roadmap are, which will be tested on the digital twin, as this helps the team working on data collection and modeling to always focus their efforts toward the most relevant aspects.
As part of future work, this assumption can be tested further. For example, as more data are available at higher granularity in the Brussels Airport datasets, we will reconsider whether a higher resolution validation approach is needed (e.g., at a monthly level) or if the yearly scale remains sufficient. The data collected on the performance of the decarbonization projects themselves can also be utilized to evaluate the resolution of the BADT. Furthermore, as part of the Stargate project, the digital twin approach is replicated in the three fellow airports of Athens, Budapest, and Toulouse, which will allow the validation of the baseline approach in different climates and contexts.
The Brussels Airport digital twin is now available and being utilized, at the time of writing, to analyze the expected impact of the deployment of net-zero measures in the Brussels Airport roadmap on the five pillars of fossil-free heating, electric equipment and vehicles, local green electricity, a robust electricity system, and connection with the community. In practice, this work consists of changing the model characteristics and parameters to accurately include decarbonization interventions such as renovating existing buildings, installing PV solar and EV chargers, and electrifying heating by replacing gas boilers with heat pumps. From the substantial impact of gas on the baseline CO2 emissions shown in the current paper, it is expected that the change in energy source from gas to electrical power will contribute significantly to the reduction in GHG emissions from the built environment of the airport. This ongoing work will help us further test and validate the baseline approach presented in this paper to confirm its robustness and replicability.
Data availability statement
The datasets presented in this article are not readily available because all detailed data on the characteristics and performance of the airport built environment are confidential. Requests to access the datasets should be directed to Z2l1bGlhLmJhcmJhbm9AaWVzdmUuY29t.
Author contributions
GB: conceptualization, funding acquisition, project administration, supervision, writing–original draft, and writing–review and editing. AM: conceptualization, data curation, formal analysis, investigation, methodology, validation, writing–original draft, and writing–review and editing. HS: data curation, methodology, visualization, and writing–review and editing. ZB: data curation, methodology, visualization, and writing–review and editing. LD: investigation, methodology, supervision, and writing–review and editing. NB: investigation, methodology, supervision, and writing–review and editing. EH: data curation, investigation, resources, and writing–review and editing. RB: data curation, investigation, resources, and writing–review and editing. CV: funding acquisition, project administration, supervision, and writing–review and editing.
Funding
The author(s) declare that financial support was received for the research, authorship, and/or publication of this article. This paper has received funding from the European Union’s Horizon 2020 research and innovation programme under grant agreement GA101037053.
Acknowledgments
The authors would like to acknowledge colleagues in IES and Brussels Airport Company (BAC) for their contributions and support. In particular, Olivier Neu and Susan Pierce, IES, for support on the conceptualization and external review of the methodology, based on their expertise on urban decarbonization analyses and Kenny Evers, Kevin Creutzburg, Adrien Cordier, Ludi Verhaegen, and other colleagues in BAC Asset management, HVAC, Sustainability, and GIS teams for their extensive support in the data collection effort.
Conflict of interest
Authors GB, AM, HS, ZB, LD, and NB were employed by Integrated Environmental Solutions R&D Limited. Authors EH, RB, and CV were employed by Brussels Airport Company.
Publisher’s note
All claims expressed in this article are solely those of the authors and do not necessarily represent those of their affiliated organizations, or those of the publisher, the editors, and the reviewers. Any product that may be evaluated in this article, or claim that may be made by its manufacturer, is not guaranteed or endorsed by the publisher.
Footnotes
1Net zero is defined by the IPCC as the state “when anthropogenic CO2 emissions are balanced globally by anthropogenic CO2 removals over a specified period” (Intergovernmental Panel on Climate Change, 2022).
References
ACI Europe (2019). What is net zero? Available at: https://www.aci-europe.org/netzero (Accessed February 15, 2024).
ACI Europe (2023a). ACI Europe resolution. Available at: https://www.aci-europe.org/downloads/content/ACI%20EUROPE%20RESOLUTION%202023.pdf (Accessed February 15, 2024).
ACI Europe (2023b). Repository of airports’ net zero carbon roadmaps. Available at: https://www.aci-europe.org/netzero/repository-of-roadmaps.html (Accessed February 15, 2024).
Ahmad, J., Larijani, H., Emmanuel, R., Mannion, M., Javed, A., and Phillipson, M. (2017). “Energy demand prediction through novel random neural network predictor for large non-domestic buildings,” in 2017 annual IEEE international systems conference (SysCon), Montreal, QC, Canada, 24-27 April 2017, 1–6. doi:10.1109/SYSCON.2017.7934803
Airport Carbon Accreditation (2024a). Accredited airports. Airpt. Carbon Accreditation. Available at: https://www.airportcarbonaccreditation.org/accredited-airports/(Accessed February 18, 2024).
Airport Carbon Accreditation (2024b). Level 3+: neutrality. Airpt. Carbon Accreditation. Available at: https://www.airportcarbonaccreditation.org/about/7-levels-of-accreditation/neutrality/(Accessed February 18, 2024).
Bagireanu, A., Bros-Williamson, J., Duncheva, T., and Currie, J. (2024). Digital twins: towards an overarching framework for the built environment.
Bo, C. (2021). Energy retrofit of complex building assets: the school buildings of Milan municipality. Available at: https://www.politesi.polimi.it/handle/10589/183312 (Accessed August 2, 2024).
Brussels Airport (2022). Roadmap to net zero carbon 2050. Available at: https://www.aci-europe.org/downloads/content/Roadmap%20Net%20Zero%20Carbon%202050_09.06.2022_light_Brussels%20Airport.pdf (Accessed February 15, 2024).
Brussels Airport (2024a). The history of Brussels airport | Brussels airport. Bruss. Airpt. Website. Available at: https://www.brusselsairport.be/en/our-airport/about-brussels-airport/history (Accessed February 18, 2024).
Brussels Airport (2024b). Airport infrastructure | Brussels airport. Bruss. Airpt. Website. Available at: https://www.brusselsairport.be/en/our-airport/facts-figures/airport-infrastructure (Accessed February 18, 2024).
Brussels Airport (2024c). Monthly traffic figures | Brussels Airport. Bruss. Airpt. Website. Available at: https://www.brusselsairport.be/en/our-airport/facts-figures/monthly-traffic-figures (Accessed February 18, 2024).
Buckley, N., Mills, G., Reinhart, C., and Berzolla, Z. M. (2021). Using urban building energy modelling (UBEM) to support the new European Union’s Green Deal: case study of Dublin Ireland. Energy Build. 247, 111115. doi:10.1016/j.enbuild.2021.111115
Byrne, N., Pierce, S., De Donatis, L., Kerrigan, R., and Buckley, N. (2024). Validating decarbonisation strategies of climate action plans via digital twins: a Limerick case study. Front. Sustain. Cities 6. doi:10.3389/frsc.2024.1393798
Chang, R., Mondol, J. D., Smyth, M., Zacharopoulos, A., and Pugsley, A. (2024). A comparison of the use of traditional glazing and a novel concentrated photovoltaic glazing (CoPVG) for building solar gain analysis using IESVE. Archit. Intell. 3, 2. doi:10.1007/s44223-023-00044-x
Christensen, J. E., Schiønning, P., and Dethlefsen, E. (2013). Comparison of simplified and advanced building simulation tool with measured data. Available at: https://www.aivc.org/resource/comparison-simplified-and-advanced-building-simulation-tool-measured-data (Accessed February 17, 2024).
Coakley, D., Raftery, P., and Keane, M. (2014). A review of methods to match building energy simulation models to measured data. Renew. Sustain. Energy Rev. 37, 123–141. doi:10.1016/j.rser.2014.05.007
CORDIS, European Commission (2024). SusTainable AiRports, the green heArT of Europe | STARGATE | project | news and multimedia | H2020 | CORDIS | European commission. STARGATE Proj. CORDIS Eur. Comm. Available at: https://cordis.europa.eu/project/id/101037053/reporting (Accessed August 2, 2024).
Dong, B., O’Neill, Z., Luo, D., and Bailey, T. (2014). Development and calibration of an online energy model for campus buildings. Energy Build. 76, 316–327. doi:10.1016/j.enbuild.2014.02.064
Electricity Maps (2024). Live 24/7 CO2 emissions of electricity consumption. Available at: http://electricitymap.tmrow.co (Accessed February 17, 2024).
Erdogan, E. (2020). Comparative studies of building performance simulation tools (EnergyPlus, IES-VE, IDA-ICE). Milan, Italy: Politecnico di Milano. Available at: https://www.politesi.polimi.it/handle/10589/166623 (Accessed February 17, 2024).
European Commission (2019). Communication from the commission to the EUROPEAN parliament, the EUROPEAN council, the council. The European Economic And Social Committee And The Committee Of The Regions The European Green Deal. Available at: https://eur-lex.europa.eu/legal-content/EN/TXT/?uri=CELEX%3A52019DC0640 (Accessed February 13, 2024).
European Commission (2021). The European green deal - European commission. Available at: https://commission.europa.eu/strategy-and-policy/priorities-2019-2024/european-green-deal_en (Accessed February 13, 2024).
Fabrizio, E., and Monetti, V. (2015). Methodologies and advancements in the calibration of building energy models. Energies 8, 2548–2574. doi:10.3390/en8042548
Falk, M. T., and Hagsten, E. (2020). Time for carbon neutrality and other emission reduction measures at European airports. Bus. Strategy Environ. 29, 1448–1464. doi:10.1002/bse.2444
Finger, M., Montero-Pascual, J. J., and Serafimova, T. (2021). Navigating towards the decarbonisation of European aviation. Fiesole, Italy: European University Institute (EUI). doi:10.2870/512368
Galera-Zarco, C., and Papadonikolaki, E. (2023). “Digital twin-based services: a taxonomy,” in International Conference on AI and the digital economy (CADE 2023), (hybrid conference), Venice, Italy, 26-28 June 2023, (Venice, Italy: Institution of Engineering and Technology), 98–102. doi:10.1049/icp.2023.2578
Giuffre’, O., and Grana, A. (2011). Managing greenhouse gas emissions for airport inventories: an overview. J. Sustain. Dev. 4, p67. doi:10.5539/jsd.v4n5p67
Greer, F., Rakas, J., and Horvath, A. (2020). Airports and environmental sustainability: a comprehensive review. Environ. Res. Lett. 15, 103007. doi:10.1088/1748-9326/abb42a
Gröger, G., Kolbe, T. H., Nagel, C., and Häfele, K.-H. (2012). OGC city geography markup language (CityGML) encoding standard. Available at: https://mediatum.ub.tum.de/1145731 (Accessed August 1, 2024).
Horizon 2020 Framework Programme (2020). Green airports and ports as multimodal hubs for sustainable and smart mobility (LC-GD-5-1-2020). Available at: https://ec.europa.eu/info/funding-tenders/opportunities/portal/screen/opportunities/topic-details/lc-gd-5-1-2020 (Accessed February 18, 2024).
Hosamo, H. H., Nielsen, H. K., Kraniotis, D., Svennevig, P. R., and Svidt, K. (2023). Digital Twin framework for automated fault source detection and prediction for comfort performance evaluation of existing non-residential Norwegian buildings. Energy Build. 281, 112732. doi:10.1016/j.enbuild.2022.112732
Integrated Environmental Solutions (IES) (2024a). iCD scalable energy analysis | products. Glasgow, United Kingdom: IES. Available at: https://www.iesve.com/products/icd (Accessed August 2, 2024).
Integrated Environmental Solutions (IES) (2024b). iSCAN in-use building data analysis | products. Glasgow, United Kingdom: IES. Available at: https://www.iesve.com/products/iscan (Accessed August 2, 2024).
Integrated Environmental Solutions (IES) (2024c). iVN local energy decarbonisation | products | Glasgow, United Kingdom: IES. Available at: https://www.iesve.com/products/ivn (Accessed August 2, 2024).
Integrated Environmental Solutions Ltd (2019). Digital twins for the built environment. Glasgow, United Kingdom: IES. Available at: https://www.iesve.com/digital-twins (Accessed February 17, 2024).
Intergovernmental Panel on Climate Change (IPCC) (2022). ““Annex I: glossary,” in global Warming of 1.5°C: IPCC special Report on Impacts of global Warming of 1.5°C above pre-industrial Levels in Context of strengthening Response to climate change,” in Sustainable development, and efforts to eradicate poverty (Cambridge: Cambridge University Press), 541–562. doi:10.1017/9781009157940.008
Jain, N., Burman, E., Mumovic, D., and Davies, M. (2020). Operational performance: building performance modelling and calibration for evaluation of energy in-use (TM63). London, United Kingdom: CIBSE. Available at: https://www.cibse.org/knowledge-research/knowledge-portal/operational-performance-building-performance-modelling-and-calibration-for-evaluation-of-energy-in-use-tm63 (Accessed February 18, 2024).
Jose Valdez Echeverria, A., Palacios, J., Cerezo Davila, C., and Zheng, S. (2023). Quantifying the financial value of building decarbonization technology under uncertainty: integrating energy modeling and investment analysis. Energy Build. 297, 113260. doi:10.1016/j.enbuild.2023.113260
Kerrigan, R., Pyburn, I., Cabrera, A. G., Saini, N., Shiel, P., and West, R. (2020). “Minimizing the performance gap of A-Rated Buildings while supporting high levels of user comfort,” in ESim 2020: 11th conference of IBPSA, Vancouver, Canada, 14 - 16 June 2020.
Lin, Z., Hong, T., Xu, X., Chen, J., and Wang, W. (2023). Evaluating energy retrofits of historic buildings in a university campus using an urban building energy model that considers uncertainties. Sustain. Cities Soc. 95, 104602. doi:10.1016/j.scs.2023.104602
Malhotra, A., Bischof, J., Nichersu, A., Häfele, K.-H., Exenberger, J., Sood, D., et al. (2022). Information modelling for urban building energy simulation—a taxonomic review. Build. Environ. 208, 108552. doi:10.1016/j.buildenv.2021.108552
Mane, K., Agrawal, N., and Date, A. (2020). “Some investigations of external shading devices on thermal and daylighting performance of a building,” Advances in energy research. Editors S. Singh, and V. Ramadesigan (Singapore: Springer), Vol. 1, 421–428. doi:10.1007/978-981-15-2666-4_41
Mańkowska, M., Tłoczyński, D., Wach-Kloskowska, M., and Bulczak, G. (2023). Factors determining the implementation of green practices in airport management. The case study of Polish airports. J. Air Transp. Manag. 111, 102438. doi:10.1016/j.jairtraman.2023.102438
Mathy, S., Criqui, P., Knoop, K., Fischedick, M., and Samadi, S. (2016). Uncertainty management and the dynamic adjustment of deep decarbonization pathways. Clim. Policy 16, S47–S62. doi:10.1080/14693062.2016.1179618
Muench, S., Stoermer, E., Jensen, K., Asikainen, T., Salvi, M., and Scapolo, F. (2022). Towards a green and digital future. Publications Office of the European Union. Available at: https://ketlib.lib.unipi.gr/xmlui/handle/ket/3979 (Accessed February 12, 2024).
Muñoz, J. I., and Bunn, D. W. (2013). Investment risk and return under renewable decarbonization of a power market. Clim. Policy 13, 87–105. doi:10.1080/14693062.2012.750473
Niu, W., Xia, J., and Shen, H. (2022). Decarbonizing investment in a supply chain with information asymmetry under innovation uncertainty. Ann. Oper. Res. doi:10.1007/s10479-022-04761-w
Oberkampf, W. L., and Roy, C. J. (2010). Verification and validation in scientific computing. Cambridge: Cambridge University Press. doi:10.1017/CBO9780511760396
Oraiopoulos, A., and Howard, B. (2022). On the accuracy of urban building energy modelling. Renew. Sustain. Energy Rev. 158, 111976. doi:10.1016/j.rser.2021.111976
Ortega Alba, S., and Manana, M. (2016). Energy research in airports: a review. Energies 9, 349. doi:10.3390/en9050349
Papadonikolaki, E., and Anumba, C. (2023). “How can digital twins support the net zero vision?,” in Advances in information technology in civil and building engineering. Editors S. Skatulla, and H. Beushausen (Cham: Springer Nature Switzerland), 81–97. doi:10.1007/978-3-031-32515-1_7
Pierce, S., Pallonetto, F., De Donatis, L., and De Rosa, M. (2024). District energy modelling for decarbonisation strategies development—the case of a University campus. Energy Rep. 11, 1256–1267. doi:10.1016/j.egyr.2023.12.048
Pilpola, S., and Lund, P. D. (2020). Analyzing the effects of uncertainties on the modelling of low-carbon energy system pathways. Energy 201, 117652. doi:10.1016/j.energy.2020.117652
Raj, P., and Surianarayanan, C. (2020). “Chapter Twelve - digital twin: the industry use cases,” in Advances in computers. Editors P. Raj, and P. Evangeline (Elsevier), 285–320. doi:10.1016/bs.adcom.2019.09.006
Ranganathan, J., Corbier, L., Bhatia, P., Schmitz, S., Gage, P., Oren, K., et al. (2004). The greenhouse gas Protocol.
Reeves, T., Olbina, S., and Issa, R. R. A. (2015). Guidelines for using building information modeling for energy analysis of buildings. Buildings 5, 1361–1388. doi:10.3390/buildings5041361
Rowlings, A. J. (2016). Sustainable energy options for the future airport metropolis. Brisbane, Australia: Queensland University of Technology. Available at: https://eprints.qut.edu.au/93363/(Accessed February 17, 2024).
S. Sareen, and K. Müller (2023). Digitisation and low-carbon energy transitions (Cham: Springer International Publishing). doi:10.1007/978-3-031-16708-9
Stargate (2021). Stargate web site. Stargate. Available at: https://www.greendealstargate.eu/(Accessed February 15, 2024).
Swan, L. G., and Ugursal, V. I. (2009). Modeling of end-use energy consumption in the residential sector: a review of modeling techniques. Renew. Sustain. Energy Rev. 13, 1819–1835. doi:10.1016/j.rser.2008.09.033
Tardioli, G., Filho, R., Bernaud, P., and Ntimos, D. (2022). An innovative modelling approach based on building physics and machine learning for the prediction of indoor thermal comfort in an office building. Buildings 12, 475. doi:10.3390/buildings12040475
Tardioli, G., Narayan, A., Kerrigan, R., Oates, M., O’Donnell, J., and Finn, D. P. (2020). A methodology for calibration of building energy models at district scale using clustering and surrogate techniques. Energy Build. 226, 110309. doi:10.1016/j.enbuild.2020.110309
Thomson, K., and Partners, C. (2020). Integrated sustainable farm structures. 2013 Soc. Eng. Agric. Conf. Innov. Agric. Technol. Sustain. Future, 306–312. doi:10.3316/informit.876255294908586
To70 (2022). ACI EUROPE summary repository - airport net zero roadmaps. Available at: https://www.aci-europe.org/downloads/content/ACI%20EUROPE%20Summary%20Repository%20-%20Airport%20Net%20Zero%20Roadmaps.pdf (Accessed February 17, 2024).
To70 (2023). Developing an airport net zero carbon roadmap - ACI EUROPE guidance document. 2nd Edn. Available at: https://www.aci-europe.org/downloads/roadmap/Developing%20an%20Airport%20Net%20Zero%20Carbon%20Roadmap%20-%20ACI%20EUROPE%20Guidance%20Document%20-%202nd%20Edition.pdf (Accessed February 17, 2024).
University Hasselt and Brussels Airport Company (2022). Conceptual framework for circularity. Available at: https://cordis.europa.eu/project/id/101037053/results (Accessed February 27, 2024).
Vieira, J., Poças Martins, J., de Almeida, N. M., Patrício, H., and Morgado, J. (2023). Reshaping the digital twin construct with levels of digital twinning (LoDT). Appl. Syst. Innov. 6, 114. doi:10.3390/asi6060114
Wright, L., and Davidson, S. (2020). How to tell the difference between a model and a digital twin. Adv. Model. Simul. Eng. Sci. 7, 13. doi:10.1186/s40323-020-00147-4
Keywords: digital twin, decarbonization, airports, baseline, built environment, energy, carbon emissions
Citation: Barbano G, Maguire A, Singh H, Batayneh Z, De Donatis L, Byrne N, Heyvaert E, Baeten R and Vandenhouten C (2024) A physics-based digital twin baseline to decarbonize the built environment of airports: the Brussels Airport case. Front. Built Environ. 10:1393682. doi: 10.3389/fbuil.2024.1393682
Received: 29 February 2024; Accepted: 27 September 2024;
Published: 17 October 2024.
Edited by:
Adriano Bisello, Eurac Research, ItalyReviewed by:
Massimiliano Manfren, University of Southampton, United KingdomGraziano Salvalai, Polytechnic University of Milan, Italy
Copyright © 2024 Barbano, Maguire, Singh, Batayneh, De Donatis, Byrne, Heyvaert, Baeten and Vandenhouten. This is an open-access article distributed under the terms of the Creative Commons Attribution License (CC BY). The use, distribution or reproduction in other forums is permitted, provided the original author(s) and the copyright owner(s) are credited and that the original publication in this journal is cited, in accordance with accepted academic practice. No use, distribution or reproduction is permitted which does not comply with these terms.
*Correspondence: Giulia Barbano, Z2l1bGlhLmJhcmJhbm9AaWVzdmUuY29t
†These authors share first authorship