 Di Jiang
- Guangzhou Power Supply Bureau of Guangdong Power Grid Co., Ltd., Guangzhou, China
In this research, the escalating energy consumption challenges in data centers are addressed by optimizing airflow organization designs. Through the use of computational fluid dynamics (CFD) simulations, three different airflow strategies were evaluated and improved: underfloor precision air conditioning, inter-column air conditioning, and backplane air conditioning. These cooling systems, which are usually considered in isolation, were compared in a comprehensive manner to get a full picture of their efficiency and effectiveness. The findings reveal that the implementation of cold aisle containment (CAC) or hot aisle containment (HAC) significantly improves air supply efficiency (ASE) and reduces the supply heat index (SHI), leading to a more uniform temperature distribution and enhanced cooling performance. Specifically, the ASE increased from 65.69% to 85.57% and 90.25% for underfloor precision air conditioning and from 71.29% to 92.16% and 92.17% for inter-column air conditioning, with corresponding reductions in SHI. The backplane cooling system offered consistent ambient temperatures throughout the room, eliminating thermal hotspots without the need for aisle containment. This study offers a comparative analysis of different airflow organization schemes, highlighting the benefits of aisle containment in precision and inter-column air conditioning and the suitability of backplane air conditioning for high-density cooling without the need for traditional aisle separation. The results are crucial for informing energy-efficient cooling strategies in data center design and operation.
1 Introduction
Data center (DC) is a significant facility in the coming 5G times. Recent booms in internet data usage have resulted in the huge demand of more green efficient DCs with less energy consumption (Nada and Said, 2017). The popular for electronic computer products causes significant increase of servers’ heat load (Rahman and Esmailpour, 2016). According to the Koomey (Ham et al., 2015), the energy consumption of DC has increased sharply year by year. In typical DCs, over 99% of power using by IT equipment is converted into heat, which should be covered by the cooling systems (Lu et al., 2011). Cooling cost for DCs counts for a large portion of total cost in DCs (Kant, 2009). It has been reported that the cooling system takes up about 30%–50% of all energy consumption of DC (Zhang et al., 2014). It is necessary to use efficient technology to optimize airflow distribution in order to reduce cooling energy consumption (Almoli et al., 2012). Thus, high-efficient cooling system is essential for DCs, and a lot of energy can be saved by improving it. Computational fluid dynamics (CFD) programs can be used to optimize the air distribution, such as air velocity and temperature distributions (Almoli et al., 2012; Cho and Kim, 2011). The CFD model proposed by Z. Zhang et al. is considered as a suitable method to predict the thermal performance of airflow in DCs because it can easily simulate different configurations with complex geometric structures (Lu et al., 2018).
Compared with natural cooling, optimization of air distribution is regarded to be effective method to carry out thermal management in the data center. For CRACs, the most important precondition of optimizing operating parameters for energy saving is the safe and reliable operation of data centers (Tang et al., 2022). Cho et al. (Cho et al., 2014) concluded that supply air temperature is main factor that affects airflow efficiency in the data center. 1°C increase in the supply air temperature (SAT) can achieve cooling energy conservation ratio of 4.3%–23.9%. It has been concluded widely that the optimal SAT of CRACs is between 18°C and 23°C.
Hu et al. (Hu et al., 2024) presented an approach to set up high-fidelity CFD model to simulate flow field. Liu et al. (Liu et al., 2023) developed CFD solver, which showed that mean error of air temperature in both cold and hot isles of a data center was 0.7 K. Cho et al. (Cho, 2024) found optimal supply air temperature can guarantee energy efficiency and operational reliability in the data center. Jin et al. (Jin et al., 2023) conducted a data-driven model to calculate the temperature fast in a data center. Tsurumi et al. (Tsurumi et al., 2023) developed a novel method to remotely measure air temperature distribution in a room. Nada et al. (Nada et al., 2016) found that the performance of cooling in DCs was enhanced through the application of appropriate cold aisle containment (CAC), especially in DCs with high power density. R. M. Galante et al. (Choo et al., 2014) conducted experimental, numerical and simulation studies at a medium-sized primary DC on the University of Maryland College Park campus, proposing that cold aisle containment should be provided to reduce energy consumption. Hot aisle containment (HAC) may be a major trend for near future airflow management systems.
In airflow organization optimization, Tradat et al. (Tradat et al., 2021) experimentally validated the introduction of perforated obstructions in the underfloor plenum of data centers, demonstrating that this method significantly improves the airflow distribution across perforated tiles, reduces hotspot areas within the data center, and enhances overall energy efficiency. Xiong and Lee (Xiong and Lee, 2021) proposed a novel cooling solution for data centers, utilizing vortex flow as an alternative to traditional hot aisle containment. Their experimental results indicated that vortex flow hot aisle containment effectively limits hot air recirculation, reducing the average Supply Heat Index (SHI) to 0.11. Kuzay et al. (Kuzay et al., 2022) assessed the thermal performance of small-scale data centers through simulation and experimental methods, with results showing that appropriate plenum height and perforation rate can significantly improve the thermal performance of data centers. Lu and Zhang (Lu and Zhang, 2020) focused on the relationship between the thermal performance of data centers and their geometric configurations and operational parameters, providing important references for the design and retrofitting of data centers.
However, there exists a gap in the comprehensive evaluation and optimization of different airflow organization schemes that integrate precision air conditioners, inter-column air conditioners, and backplane air conditioners. These systems, which deliver air from the floor, provide horizontal air supply, and cool the IT equipment directly, have not been extensively compared or optimized in a unified study to date.
The purpose of this study is to study and optimize different airflow organization schemes in DCs. The innovation of the research lies in its holistic approach to evaluating and enhancing the efficiency of various cooling systems that are typically considered in isolation. By comparing the performance of floor-based precision air conditioners, inter-column air supply, and backplane air conditioners, your study will provide data center operators and designers with a comprehensive understanding of the trade-offs and benefits associated with each scheme. This comparative analysis is crucial for making informed decisions on the most energy-efficient and effective cooling strategies.
2 Materials and methods
2.1 Physical model
The size of the data center computer room is 16.2 m × 9.45 m × 5.125 m (length × width × height), and the area is about 153 m2. There are 55 cabinets in the equipment room, arranged in a “face to face and back-to-back” way, with 3 columns in total. The cabinet size is 600 mm × 1200 mm × 2200 mm (width × depth × height), and a single cabinet consumes 6 kW of power. Figure 1 depicts the equipment room’s cabinet arrangement.
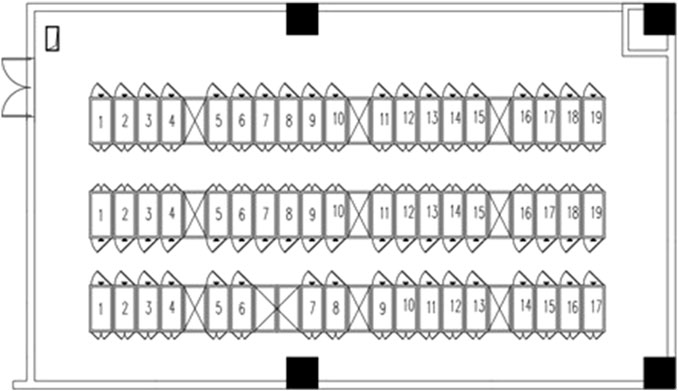
Figure 1. Layout of the equipment room.
2.2 Numerical simulation
Field measurements, simulation experiments and CFD simulations are commonly used in the study of airflow organization optimization in DCs. There are certain limitations in the on-site measurement of the DC equipment rooms, which affects the safe and reliable operation of the DC. DCs operate non-stop and large amounts of data are stored in them. If a multi-condition experiment is carried out, it may lead to IT equipment downtime, and serious losses may be caused by even a few seconds of downtime; the measurement workload is large, and the measurement points are many, which consumes a lot of manpower or material resources; it is easy for workers to cause temperature field disturbance, which affects the accuracy of measurement results and leads to measurement bias. The advantages of the CFD simulation technology are low cost, short cycle, and easy realization of various working conditions.
In this simulation, the CFD simulation software of 6SigmaRoom was used for simulation, and a 3D model of the computer room was created according to different air conditioning schemes, and the thermal environment of the equipment room was simulated and analyzed.
2.2.1 Mathematical model
Problems such as fluid flow, heat, and mass transfer need to be solved using three major governing equations, namely, the mass conservation equation, the momentum equation, and the energy conservation equation. The generalized form of each control equation is shown below.
Where φ is a generalized variable, which can represent the dependent variable in each control equation; Γ is the generalized diffusion coefficient; S is the generalized source term.
The air flow in the equipment room is in a turbulent state both in terms of speed and scale, and its flow mechanism is very complex. The standard k-ε two-equation model is used in this study, with the wall function being used to describe near-wall flow. This function has a high convergence rate and minimal memory needs. The computational results correspond well to the measured results, and the formulas are as follows:
Turbulent kinetic energy k equation:
Turbulent dissipation rate ε equation:
In the formula,
2.2.2 Boundary conditions and solution settings
Before modeling and solving the DC, the following simplifying assumptions are made for the model to improve the calculation speed while ensuring the calculation ac-curacy.
1) The gas flow state in the machine room is regarded as steady state turbulence;
2) The calorific value of a single cabinet does not change with time and is a constant value;
3) The thermal radiation of solid walls and surfaces of indoor objects are ignored;
4) Obstacles such as wires, cables and refrigerant pipes in the equipment room are ignored;
5) The human body heat dissipation and lighting heat dissipation of the staff are ignored.
The boundary conditions mainly include parameters such as air-conditioning air volume, supply air temperature, and cabinet power, which are set according to design drawings and different air-conditioning schemes. The structured grid is generated by the software, the minimum grid size is 0.01m, the target grid number is 107, and the solution residual is set to 1.
2.2.3 Grid independence study and model validation
In order to ensure the accuracy of the simulation results, the grid independence of the model was verified. The result is shown in Figure 2, by comparing the return air temperature of the air conditioning equipment under different grid numbers, the return air temperature of the air conditioner was more stable under three working conditions with grid numbers of 228,718, 1,033,758, and 1607470, respectively. In order to improve the calculation speed while ensuring accuracy, the grid numbers used in the simulation were 228,718.
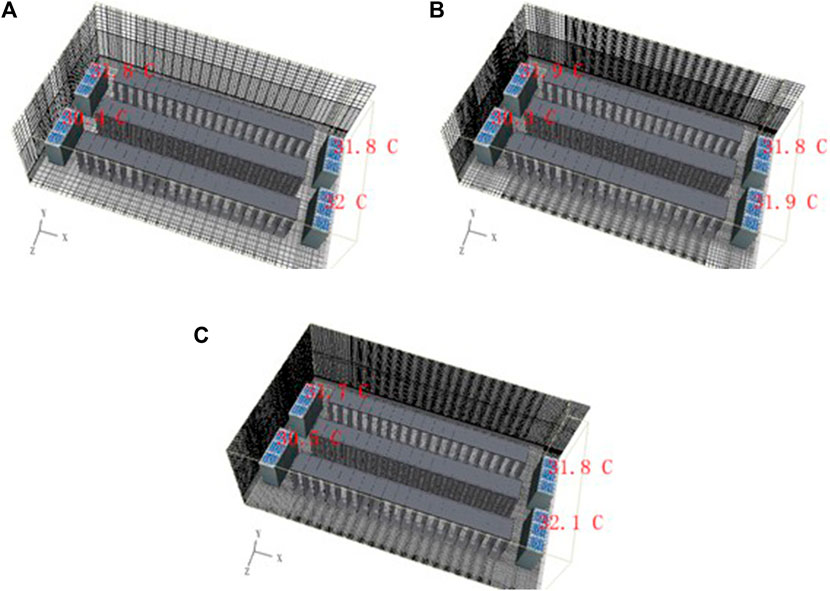
Figure 2. Grid independence study. (A) Grids number: 228718. (B) Grids number: 1033758. (C) Grids number: 1607470.
Since the studied data room is still under construction and the actual data is difficult to obtain, this study for the modular data room using inter-column air conditioning, respectively, using multi-physics field simulation software COMSOL and data center-specific simulation software 6SigmaRoom to simulate it and comparing the difference in the average air inlet temperature of the cabinets in order to validate the accuracy of the results is shown in Figure 3. It can be seen that the error of the average air inlet temperature of each cabinet is below 10%, which can meet the needs of simulation.
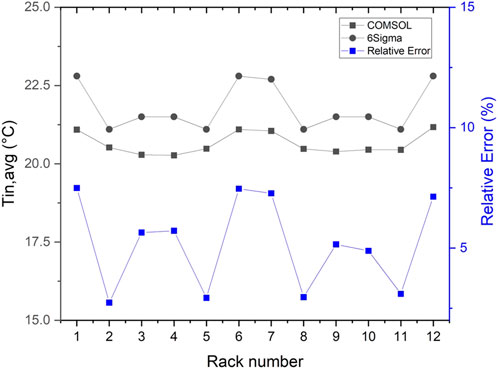
Figure 3. Model validation.
3 Results and discussion
Different airflow organization forms are decisive for the thermal environment and energy consumption level of the DC. Unreasonable airflow organization not only affects servers in the computer room operate normally, but also causes huge waste of energy consumption. Therefore, it is required to do simulation study of air distribution for different air conditioning schemes, and conduct a comprehensive analysis of the simulation data for contrasting the application effects of different air distribution forms.
There are various forms of air supply in the equipment room. Among them, the precision air conditioners that deliver air from the floor is the room-level cooling system that is most commonly used. The static pressure box under the raised floor receives air supply from air conditioner. Through the floor’s perforations, chilly air is directed into the equipment room’s cold aisle. It goes back to the air conditioner to finish the heat transfer procedure after chilling the servers inside the cabinet. The inter-column air conditioner is a cooling solution at the column -to- column level. It is installed between the columns of the cabinet. The cold aisle receives the chilly air that is directed horizontally by the inter-column air conditioner, which absorbs the heat from the servers, and the air is expelled from the back of the cabinet into the hot aisle to complete the refrigeration cycle. Compared with room-level air conditioning solutions, inter-column air conditioning is closer to the heat source, reducing cooling loss and air supply power consumption. Moreover, it is easy to combine with hot and cold aisle containment technology to build a modular equipment room that can be quickly deployed, and the effect of refrigeration and energy saving is obvious. A cooling technique at the cabinet level is the backplane air conditioner. To cool the cabinet directly and release the cold air into the room, a heat exchanger is mounted on the back of the cabinet. The backplane air conditioner is close to the heat source in the cabinet, which can achieve precise cooling and avoid the problems of disordered airflow and local hot spots.
In this paper, three air supply forms, including the precision air conditioners that deliver air from the floor, inter-column air conditioning, and backplane air conditioning, are modeled. CAC and HAC are carried out for the two air conditioning schemes of precision air conditioners that deliver air from the floor and inter-column air conditioning, respectively. A total of 7 combined working conditions are simulated.
3.1 Option 1: Precision air conditioners that deliver air from the floor
3.1.1 Precision air conditioners that deliver air from the floor without aisle containment
The air conditioning system made use of two precision air conditioners. A single air conditioner can reasonably chill a maximum of 230kW, the air supply temperature is 20°C, and the maximum flow rate is 45900 m3/h. The raised floor measures 0.64 m in height, with a floor grille measuring 0.6 m by 0.6 m and a 50% opening rate.
Two planes, Y = 1 m parallel to the ground and Z = 6 m perpendicular to the ground, are selected as typical sections for analysis (Figure 4). The inlet air temperature and exhaust air temperature of the cabinet are not uniform, which is related to the uneven air supply at different positions caused by the uneven pressure in the floor static plenum. There is a side flow phenomenon in the data equipment room. Some hot air flows from the hot aisle flow from the cabinet side to the cold aisle, or the cold air flows from the cold aisle to the hot aisle, resulting in a mixture of cold and hot air, which affects the heat dissipation effect of the cabinet. The height of the cold air sent from the floor exceeds the height of the cabinet, gathers at the top of the cabinet, and some of the cold air diffuses into the hot aisle, resulting in a loss of cooling capacity.
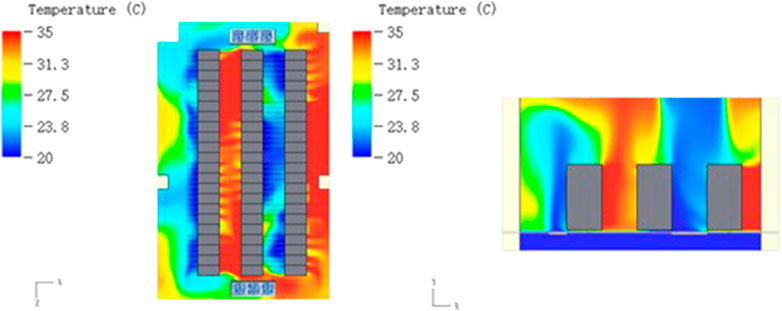
Figure 4. Temperature distribution at Y = 1 m (left) and temperature distribution at Z = 6 m (right).
3.1.2 Precision air conditioners that deliver air from the floor + CAC
The glass or plastic is used to seal the cold aisle in CAC, which can completely isolate the hot air in the equipment room environment and restrict the cold air in the cabinet. The mixing of hot and cold air can be avoided, the heat dissipation of cool air equipment can be limited, the utilization efficiency of cold air can be improved, and the refrigeration efficiency and effect in the equipment room can be improved through this method. On the basis of precision air conditioners that deliver air from the floor, the cold aisle is closed.
Two planes, Y = 1 m parallel to the ground and Z = 6 m perpendicular to the ground, were selected as typical sections for analysis (Figure 5). Due to the cold aisle is closed, the cold air from floor grill begins to rise and fill the entire cold aisle. After absorbing a great deal of heat released by the server cabinet, the cold air is discharged from the rear door of the cabinet to form a hot aisle, and is isolated from the cold air in the cold aisle by the cabinet, preventing the mixing of cold and hot air. The inlet air temperature in the horizontal and vertical directions of cabinets is well distributed, and the temperature in the cold aisle is identical to the supply air temperature, which is 20°C. Hot air in the hot aisle is recovered by the air conditioner in equipment room to form a loop, resulting in a high average ambient temperature in the equipment room, around 31°C, which may affect the thermal comfort of operation and maintenance personnel.
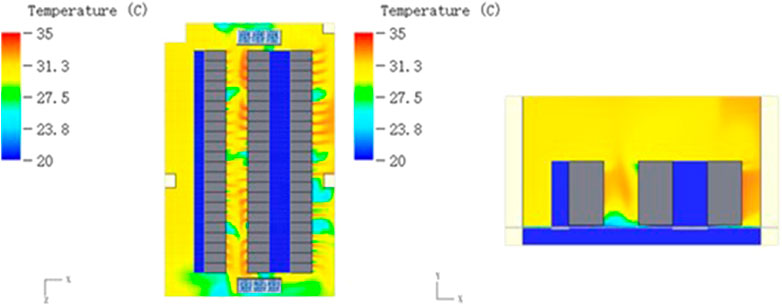
Figure 5. Temperature distribution at Y = 1 m (left) and temperature distribution at Z = 6 m (right).
3.1.3 Precision air conditioners that deliver air from the floor + HAC
HAC is a hot aisle formed by enclosing its hot air area in the equipment room. The hot air is collected in the hot aisle, and under the action of the air-conditioning air return port, it passes through the static pressure box formed by the ceiling and the upper floor, and completes the heated air path by going back to the air return port. On the basis of precision air conditioners that deliver air from the floor, the hot aisle is sealed, the ceiling height is 0.6m, and the air conditioner return air outlet and the ceiling are connected by ceiling air ducts.
Two planes, Y = 1 m parallel to the ground and Z = 6 m perpendicular to the ground, were selected as typical sections for analysis. As can be seen from Figure 6, the situation in the equipment room has changed in the opposite direction compared with the CAC scheme. In the CAC scheme, the cold pool is mainly formed in the cold aisle, thereby reducing the cabinet’s inlet temperature. In the HAC scheme, the main purpose is to constrain the hot air to prevent it from diffusing into the cold aisle and mix with cold air, which reduces not only the inlet air temperature of the cabinet, but also the ambient temperature of the equipment room. In addition, the simulation results show that the air conditioner’s cooling capacity is much more than the heat dissipation capacity of the IT equipment. Unnecessary cooling has been performed on the entire equipment room by the air-conditioning unit, and the cooling capacity is being wasted. Measures can be taken to reduce the air-conditioning air flow rate or increase the temperature of the supply air to save energy.
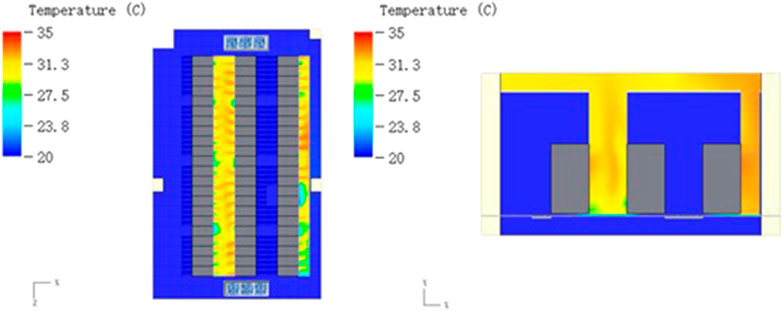
Figure 6. Temperature distribution at Y = 1 m (left) and temperature distribution at Z = 6 m (right).
3.1.4 Quantitative analysis of optimization results
(a) Analysis of the inlet air temperature
In order to obtain more accurate results, this section takes the server room’s second row of cabinets as the subject of analysis and quantitatively evaluates the air conditioner’s cooling effect by analyzing the resultant data from the simulation of the cabinet inlet air temperature.
The air inlet temperature under various working conditions of precision air conditioning is displayed in Figure 7. After the implementation of CAC or HAC, the average air inlet temperature and the highest air inlet temperature of each cabinet are around 20°C, indicating that the temperature of the cabinet air inlet area is low and uniformly distributed, and the air inlet cross-section does not have an obvious temperature gradient, so that the cabinet possesses a more favorable thermal environment, which fulfills the requirements of the design specifications and ensures the servers’ regular functioning. In the default case, the difference in the cabinet air intake temperature is very obvious, and the air intake temperature of cabinet No. 19 is much higher than that of other cabinets, with an average air intake temperature as high as 30.1°C. Ten cabinets’ maximum air intake temperature is higher than the specification requirement of 27°C, and the maximum air intake temperature of cabinet No. 19 reaches 36.7°C, which seriously increases the risk of server downtime. In addition, there is a large temperature difference between the average air intake temperature and the maximum air intake temperature by default, indicating that the distribution of temperatures of the air intake section of a single cabinet is uneven, and there are differences in the cooling effect of the servers, which is prone to local hot spots and fails to meet the requirements for the normal operation of the servers. Therefore, when precision air conditioning is used for underfloor air supply, optimization measures of cold aisle containment or hot aisle containment should be implemented for the server room.
(b) Evaluation of data center thermal environment and energy consumption
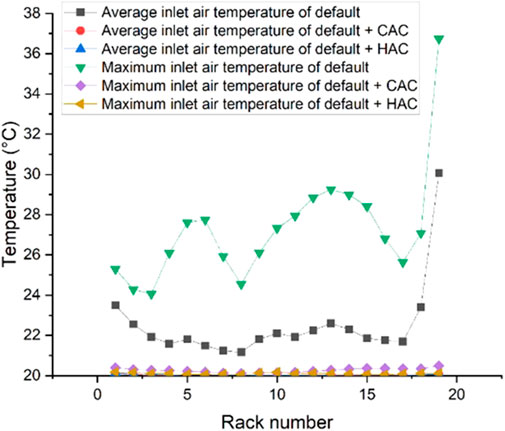
Figure 7. Inlet air temperature of cabinets.
To evaluate the airflow organization and energy consumption in the computer room in a more detailed and specific way, this section uses some index parameters to quantitatively analyze the simulation results of each working condition, which more accurately reflect the thermal environment and energy consumption characteristics in the computer room.
ASE (Air Supply Efficiency) is an indicator that indicates the efficiency of cold air utilization, which is described as the proportion of the flow of cold air sent by the air conditioner that is directly used to cool the IT equipment to the total amount of air supplied; the larger the value, the better, and 100% represents that the air conditioner sends air to be used entirely to cool the IT equipment and that there is no loss of cold air.
Where Vrack-in is the volume of air provided by the air conditioner directly into the cabinet, and Vacu-suplly is the total volume of air supplied by the air conditioner.
ARE (Air Return Efficiency) is that the IT equipment exhausts air circulation in the computer room and does not return to the degree of air conditioning indicators, which is defined as the IT equipment discharged hot air flow accounted for the proportion of entire air conditioning return air volume; the larger the better; 100% represents the IT equipment exhaust all back to the air-conditioning return air intake; there is no formation of the internal cycle of the computer room.
Where Vrack-out is the air volume of cabinet exhaust air flowing directly back to air conditioner Vacu-suplly is the total return air volume of air conditioner.
MCRI (Mean Cabinet Recirculation Index) is an index that indicates the extent to which the cabinet intake air is mixed by hot air, which is described as the ratio of the hot air flow inside cabinet that is returned to the inlet of IT equipment to the total intake air volume of cabinet. The smaller the value, the better, with 0% representing that there is no hot air returned to the inlet of IT equipment.
Where Vrack-return is the return air volume inside the cabinet; Vrack-all is the total intake air volume of the cabinet.
RTI (Return Temperature Index) is an indicator that expresses the balance relationship between the airflow of the air conditioner and the cabinet and indicates the situation of air recirculation and bypass in the server room. Air recirculation refers to the flow process in which the hot air discharged from cabinet returns to cabinet inlet; air bypass refers to the flow process in which the cold air returns directly to the air conditioner’s return air outlet without passing through the cabinet. The indicator of 100% is the ideal state, that is, the air conditioning and cabinet air flow balance; below 100% means air bypass; higher than 100% means air recirculation.
Where Tr is the return air temperature; Ts is the supply air temperature; ∆Tequip is the equipment temperature rise.
SHI (Supply Heat Index) is used to confirm whether the cold air supplied to the cabinet cooling by the air conditioning system is affected by hot air in environment and causes temperature rise, which in turn causes the temperature of the internal airflow of cabinet to rise and reduces cooling effect of cabinet. In the definition of the formula 3-5, the SHI value between 0 and 1, the smaller the value represents the loss of less. When the SHI = 0, all cabinets into the air temperature are equal to the air supply temperature of air conditioning system.
RHI (Return Heat Index) is mainly used to evaluate whether the return air mechanism in computer room brings all the hot air back to air conditioner or whether it also brings back some of the cold air when it brings back the hot air and creates a bypass airflow. According to the definition of the formula 3-6, with an RHI value between 0 and 1, the ideal situation for the air conditioning system’s return air temperature is not influenced by cold air and is reduced, and it is the same as the cabinet exhaust end temperature. The closer the SHI value of 1, on behalf of the use of cold air in the equipment, the better the heat dissipation of the situation. SHI + RHI = 1.
Where Tin is the temperature at the inlet of cabinet; Tout is the temperature at the outlet of cabinet.
The evaluation indexes of precision air conditioning under three working conditions are displayed in Table 1. It can be seen that, by default, the ASE value is 65.69%, and nearly 40% of the cold capacity is not utilized, resulting in a large degree of cold waste. The ARE value is 65.68%, reflecting the phenomenon of obvious circulation in the exhaust air room. The airflow mixing phenomenon is serious. The MCRI value is 2.1973%, indicating that the cabinet has an obvious self-circulation phenomenon, which will cause the emergence of regional hotspots. The RTI value is 77.94%, which indicates that there are more cold air bypass phenomena in the computer room and that the airflow organization is not ideal. SHI and RHI values are 0.141 and 0.859, which show that a phenomenon of hot and cold airflow mixing exists that affects heat dissipation effect of cabinet. CAC and HAC have significantly improved the above problems, and all of them are better than default. The evaluation indexes are better than the default, and the optimization effect is obvious, in which HAC has the best performance of the thermal environment and energy consumption of the server room.
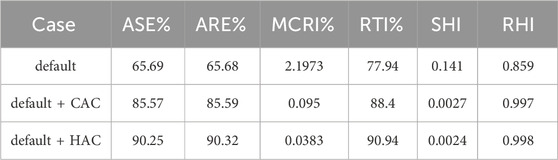
Table 1. Evaluation indexes of precision air conditioners.
3.2 Option 2: Horizontal air supply of inter-column air conditioners
3.2.1 Inter-column air conditioning without aisle containment
Nine intercolumn air conditioners were used in the air conditioning scheme, and each column of cabinets is equipped with 3 intercolumn air conditioners. A single air conditioner has a maximum sensible cooling capacity of 51.1kW, a maximum air volume of 10200 m3/h, and a supply air temperature of 20°C.
Two planes, Y = 1 m parallel to the ground and Z = 6 m perpendicular to the ground, were selected as typical sections for analysis. Figure 8 makes it clear that obvious hot and cold aisles are formed in the equipment room, and the temperature in the aisles is relatively uniform. In contrast to the conventional vertical air supply, the air supply difference was avoided and the air supply uniformity along the height direction at the entrance of cabinet was improved by horizontal air supply of inter-column air conditioner. However, there is also a problem that hot and cold air are mixed due to the lack of aisle containment, which makes some cabinets’ inlet air temperature is higher.
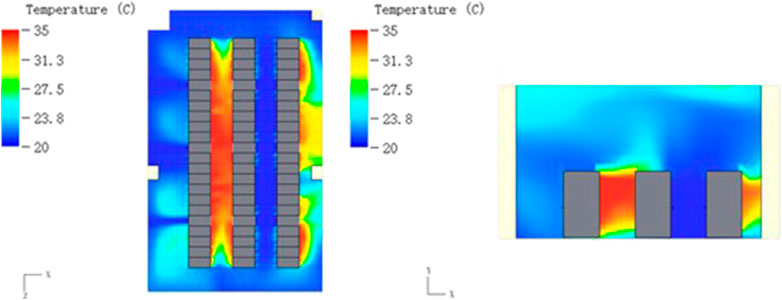
Figure 8. Temperature distribution at Y = 1 m (left) and temperature distribution at Z = 6 m (right).
3.2.2 Inter-column air conditioning + CAC
On the basis of the inter-column air conditioning scheme, the cold aisle is closed.
Two planes, Y = 1 m parallel to the ground and Z = 6 m perpendicular to the ground, were selected as typical sections for analysis. It is evident from Figure 9 that the inlet air temperature of the cabinets in cold aisle is about 20°C, and the exhaust air temperature of cabinets in hot aisle is about 32°C, which meets the requirements for the inlet air temperature of the cabinets and has room for optimization. The mixture of cold and hot air flow is avoided, and the utilization efficiency of cold energy is improved by CAC. It is shown in Figure 9 that the temperature in the lower part of hot aisle is lower, probably because the air in cold aisle leaks into the hot aisle through the gap at the bottom of the cabinet, which can be avoided by adding baffles.
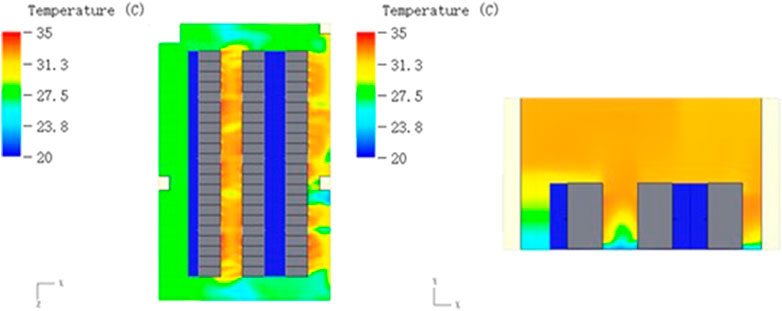
Figure 9. Temperature distribution at Y = 1 m (left) and temperature distribution at Z = 6 m (right).
3.2.3 Inter-column air conditioning + HAC
On the basis of the inter-column air-conditioning scheme, the hot aisle is closed.
Two planes, Y = 1 m parallel to the ground and Z = 6 m perpendicular to the ground, were selected as typical sections for analysis. Figure 10 makes it clear that after the hot aisle is closed for the inter-column cooling system, the environment of equipment room outside hot aisle is completely cooled, indicating that the air conditioning system’s cooling capability is too large and there is a lot of room for energy saving. In Figure 10, the temperature in the hot aisle shows an upward trend from low to high, indicating that some cold air leaks into hot aisle through the gap at the bottom of the cabinet, and there is a certain loss of cooling capacity.
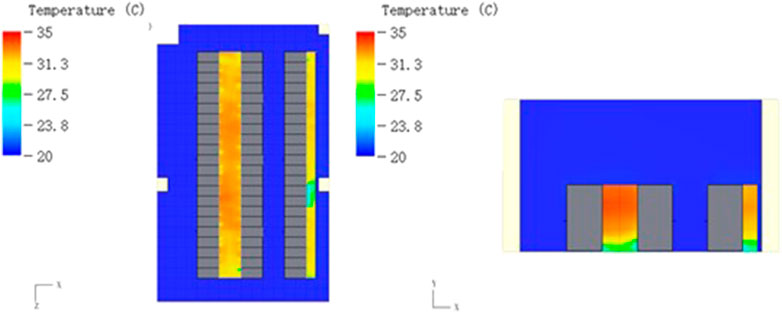
Figure 10. Temperature distribution at Y = 1 m (left) and temperature distribution at Z = 6 m (right).
3.2.4 Quantitative analysis of optimization results
To acquire more precise outcomes, this section takes the first row of cabinets in the server room, which has a poor cabinet thermal environment by default, as the object of study and quantitatively evaluates the cooling effect of the air conditioner by analyzing the resultant data from the simulation of the cabinet inlet air temperature.
Figure 11 displays the temperature of the cabinet inlet under each condition of the inter-column air conditioning. As illustrated in the figure, after the use of CAC or HAC, the average air inlet temperature and the highest air inlet temperature of each cabinet are about 20°C, indicating that the temperature of cabinet air inlet area is low and uniform distribution, there is no obvious temperature gradient in the air inlet cross-section, and the thermal environment of the cabinet is better to meet the design specification requirements, which can make sure the servers are operating normally. In the default case, the difference in cabinet air inlet temperature is very obvious, with 5 cabinets having an average air inlet temperature of more than 27°C and 12 cabinets having a maximum inlet temperature of more than 27°C, which makes it difficult to ensure the safe operation of servers. There is a significant variance in temperature between the average air inlet temperature and the maximum inlet temperature, with the maximum difference reaching 5.1°C, which indicates that the temperature distribution in vertical direction of air inlet port of cabinets is not even. There are differences in the cooling effectiveness of each server, which tends to create localized hot spots. Therefore, measures such as cold aisle containment or hot aisle containment need to be optimized when using an inter-column air conditioning scheme.
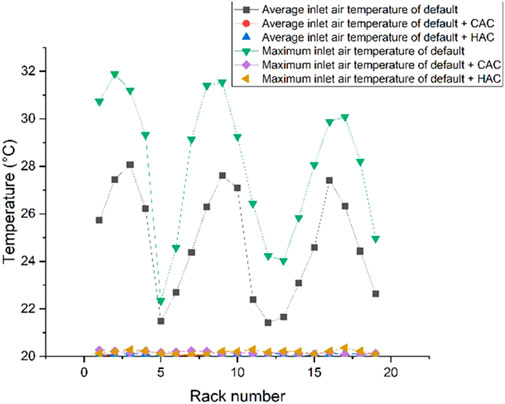
Figure 11. Inlet air temperature of cabinets.
The evaluation indexes of inter-column air conditioning under three working conditions are displayed in Table 2, the results of the calculation show that: by default, with the ASE value of 71.29%, nearly 30% of the cold volume is not utilized, resulting in a certain degree of cold waste; ARE value of 86.9%, reflecting the existence of a certain exhaust air circulation phenomenon in the machine room, resulting in the mixing of hot and cold airflow. The MCRI value is 1.4645%, indicating that the self-circulation phenomenon exists in the cabinet, which leads to the generation of local hot spots; the RTI value is 82.01%, indicating that there is a cold air bypass phenomenon in the cabinet, and the organization of the airflow is not ideal; the values of SHI and RHI are 0.145 and 0.854, indicating that there is a phenomenon of mixing of the hot and cold airflows, which affects the cooling effect of cabinets. CAC and HAC improve above problems, and the evaluation indexes are basically the same and are better than the default.
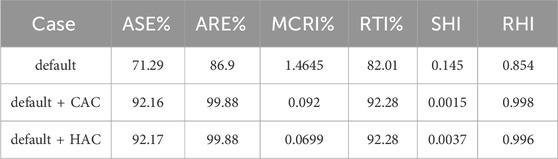
Table 2. Evaluation indexes of inter-column air conditioning.
3.3 Option 3: Backplane air conditioning
The backplane air conditioner’s cooling capacity is set to 6 kW in this simulation. The heat pipe backplane air conditioner corresponds to the cabinet one by one and is close to the back of the cabinet, ensuring good containment effect. The backplane air conditioner has its own fans, which are evenly arranged in the upper, middle and lower parts. The total air volume of each backplane air conditioner is 1200 m3/h.
3.3.1 Analysis of the maximum inlet air temperature
Figure 12 displays the air inlet temperature of cabinets after using the backplane air conditioner, it is evident that the server’s typical operating requirements are satisfied and that each cabinet’s maximum inlet air temperature is fairly constant when the backplane air conditioner is in use. And the average air inlet temperature of cabinets is around 21.5°C, which can ensure the servers’ secure functioning and the cooling effect of each cabinet is the same. In addition, the distinction between the maximum air inlet temperature and the minimum air inlet temperature of each cabinet does not exceed 2°C, which ensures that the servers in the same cabinet are evenly cooled.
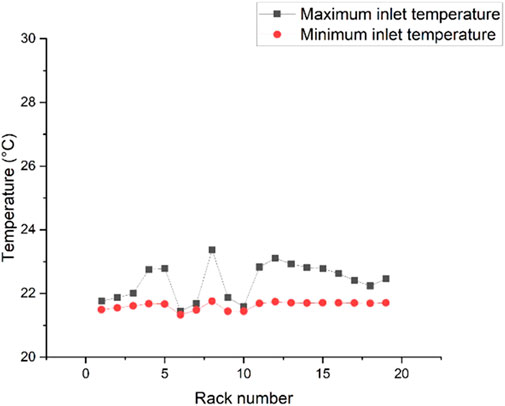
Figure 12. Air inlet temperature of cabinets.
3.3.2 Analysis of temperature field
Two planes, Y = 1 m parallel to the ground and Z = 6 m perpendicular to the ground, were selected as typical sections for analysis. Figure 13 shows that the temperature distribution in equipment room is even and stable at about 22°C by using the heat pipe backplane air conditioner. The ambient temperature of the equipment room meets the specification requirements, and there is no thermal environment in the entire equipment room.
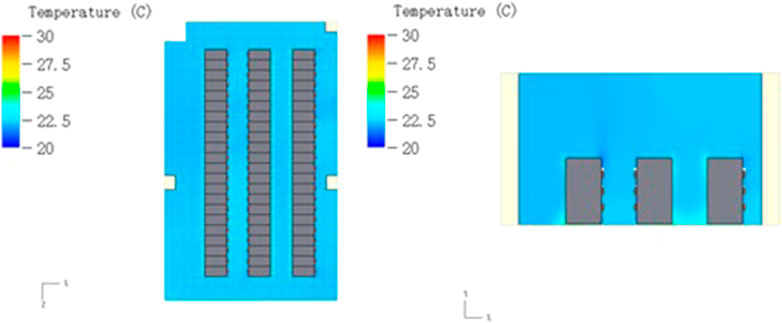
Figure 13. Temperature distribution at Y = 1 m (left) and temperature distribution at Z = 6 m (right).
4 Conclusion
In this study, we simulate and analyze three different forms of data center airflow organization: under-floor precision air conditioning air supply, horizontal air supply for inter-column air conditioning, and rack backplane air conditioning. For the under-floor precision air-conditioning and inter-column air-conditioning schemes, we adopt the optimization methods of cold aisle closure (CAC) and hot aisle closure (HAC), respectively. In total, we simulated seven combinations of working conditions and comparatively analyzed the maximum inlet air temperature, temperature field, and a series of evaluation indicators. The following are our main conclusions:
1) In the underfloor precision air conditioning scheme without aisle containment, the mixing of cold and hot air was more severe, such as cold air overflow and hot air interference in the cold aisle, leading to a decrease in cooling capacity. The inlet air temperature of the cabinets was high, and local hot spots occurred frequently. The use of CAC or HAC could reduce the inlet air temperature of the cabinets and avoid the mixing of cold and hot air streams. The Air Supply Efficiency (ASE) increased from 65.69% to 85.57% and 90.25%, respectively, improving the utilization of cooling capacity, and the Supply Heat Index (SHI) decreased from 0.141 to 0.0027 and 0.0024, respectively, reducing the mixing of cold and hot air.
2) In the inter-column air conditioning system, the heat source is closer to the air supply, the air supply distance is short, and the cooling capacity is fully utilized. Compared to the traditional vertical air supply, the horizontal air supply of the inter-column air conditioner improved the uniformity of the air supply along the height direction at the cabinet inlet. However, due to the lack of aisle containment, the problem of cold and hot air mixing still exists, leading to higher inlet air temperatures in some cabinets. After closing the cold and hot aisles, uniformity of the air inlet temperature distribution can also be achieved, and the efficiency of cooling energy utilization can be improved. ASE increased from 71.29% to 92.16% and 92.17%, respectively, and SHI decreased from 0.145 to 0.0015 and 0.0037, respectively.
3) In the backplane air conditioning system, the air conditioner is close to the heat source, achieving near-end cooling. The ambient temperature throughout the entire machine room is consistent, approximately equal to the outlet air temperature of the backplane heat exchanger. The racks in the machine room are arranged in columns and can be laid out face-to-face or sequentially, without the need for cold and hot aisle containment.
4) By optimizing airflow organization, we can significantly improve the cooling efficiency and energy utilization rate of data centers while reducing the occurrence of local hot spots and ensuring the stable operation of data centers. Notably, the scheme employing HAC demonstrated the best performance in optimizing the thermal environment and energy consumption. These findings provide data center operators and designers with a comprehensive understanding of the trade-offs and benefits associated with each cooling scheme, which is crucial for making informed decisions on the most energy-efficient and effective cooling strategies.
Data availability statement
The original contributions presented in the study are included in the article/Supplementary material, further inquiries can be directed to the corresponding author.
Author contributions
DJ: Writing–review and editing, Writing–original draft, Visualization, Validation, Supervision, Software, Resources, Project administration, Methodology, Investigation, Funding acquisition, Formal Analysis, Data curation, Conceptualization.
Funding
The author(s) declare that financial support was received for the research, authorship, and/or publication of this article. The support of the first batch of new power system innovation projects of China Southern Power Grid Company: Research and Demonstration of Key Technologies for Data Center Energy Conservation and Consumption Reduction (Project No. 20210042) is greatly appreciated.
Conflict of interest
Author DJ was employed by Guangzhou Power Supply Bureau of Guangdong Power Grid Co., Ltd.
Publisher’s note
All claims expressed in this article are solely those of the authors and do not necessarily represent those of their affiliated organizations, or those of the publisher, the editors and the reviewers. Any product that may be evaluated in this article, or claim that may be made by its manufacturer, is not guaranteed or endorsed by the publisher.
Abbreviations
DC, Data Center; CFD, Computational Fluid Dynamics; CRAC, Computer Room Air Conditioner; SAT, Supply Air Temperature; CAC, Cold Aisle Containment; HAC, Hot Aisle Containment; ASE, Air Supply Efficiency; ARE, Air Return Efficiency; MCRI, Mean Cabinet Recirculation Index; RTI, Return Temperature Index; SHI, Supply Heat Index; RHI, Return Heat Index.
References
Almoli, A., Thompson, A., Kapur, N., Summers, J., Thompson, H., and Hannah, G. (2012). Computational fluid dynamic investigation of liquid rack cooling in data centres. Appl. Energy 89 (1), 150–155. doi:10.1016/j.apenergy.2011.02.003
Cho, J. (2024). Optimal supply air temperature with respect to data center operational stability and energy efficiency in a row-based cooling system under fault conditions. Energy 288, 129797. doi:10.1016/j.energy.2023.129797
Cho, J., and Kim, B. S. (2011). Evaluation of air management system’s thermal performance for superior cooling efficiency in high-density data centers. Energy Build. 43 (9), 2145–2155. doi:10.1016/j.enbuild.2011.04.025
Cho, J., Lim, T., and Kim, B. S. (2009). Measurements and predictions of the air distribution systems in high compute density (Internet) data centers. Energy Build. 41 (10), 1107–1115. doi:10.1016/j.enbuild.2009.05.017
Cho, J., Yang, J., and Park, W. (2014). Evaluation of air distribution system’s airflow performance for cooling energy savings in high-density data centers. Energy Build. 68 (PARTA), 270–279. doi:10.1016/j.enbuild.2013.09.013
Choo, K., Galante, R. M., and Ohadi, M. M. (2014). Energy consumption analysis of a medium-size primary data center in an academic campus. Energy Build. 76, 414–421. doi:10.1016/j.enbuild.2014.02.042
Ham, S. W., Kim, M. H., Choi, B. N., and Jeong, J. W. (2015). Energy saving potential of various air-side economizers in a modular data center. Appl. Energy 138, 258–275. doi:10.1016/j.apenergy.2014.10.066
Hu, B., Yin, Z., Hamrani, A., Leon, A., and McDaniel, D. (2024). Super-resolution-assisted rapid high-fidelity CFD modeling of data centers. Build. Environ. 247, 111036. doi:10.1016/j.buildenv.2023.111036
Jin, S.-Q., Bai, F., Chen, Y. J., Feng, X. Y., Li, H. W., et al. (2023). Data-driven model reduction for fast temperature prediction in a multi-variable data center. Int. Commun. Heat Mass Transf. 142, 106645. doi:10.1016/j.icheatmasstransfer.2023.106645
Kant, K. (2009). Data center evolution. Comput. Netw. 53 (17), 2939–2965. doi:10.1016/j.comnet.2009.10.004
Kuzay, M., Dogan, A., Yilmaz, S., Herkiloglu, O., Atalay, A. S., Cemberci, A., et al. (2022). Retrofitting of an air-cooled data center for energy efficiency. Case Stud. Therm. Eng. 36, 102228. doi:10.1016/j.csite.2022.102228
Liu, W., Lian, S., Fang, X., Shang, Z., Wu, H., Zhu, H., et al. (2023). An open-source and experimentally guided CFD strategy for predicting air distribution in data centers with air-cooling. Build. Environ. 242, 110542. doi:10.1016/j.buildenv.2023.110542
Lu, H., and Zhang, Z. (2020). Numerical and experimental investigations on the thermal performance of a data center. Appl. Therm. Eng. 180, 115759. doi:10.1016/j.applthermaleng.2020.115759
Lu, H., Zhang, Z., and Yang, L. (2018). A review on airflow distribution and management in data center. Energy Build. 179, 264–277. doi:10.1016/j.enbuild.2018.08.050
Lu, T., Lü, X., Remes, M., and Viljanen, M. (2011). Investigation of air management and energy performance in a data center in Finland: case study. Energy Build. 43 (12), 3360–3372. doi:10.1016/j.enbuild.2011.08.034
Nada, S. A., and Said, M. A. (2017). Comprehensive study on the effects of plenum depths on air flow and thermal managements in data centers. Int. J. Therm. Sci. 122, 302–312. doi:10.1016/j.ijthermalsci.2017.09.001
Nada, S. A., Said, M. A., and Rady, M. A. (2016). Numerical investigation and parametric study for thermal and energy management enhancements in data centers’ buildings. Appl. Therm. Eng. 98, 110–128. doi:10.1016/j.applthermaleng.2015.12.020
Rahman, M. N., and Esmailpour, A. (2016). A hybrid data center architecture for big data. Big Data Res. 3, 29–40. doi:10.1016/j.bdr.2016.02.001
Tang, Y., Bai, X., Jin, C., Fu, Y., Mao, W., and Xu, X. (2022). Experimental and numerical study on the thermal environment of a data center. Build. Environ. 212 (Mar), 108741. doi:10.1016/j.buildenv.2021.108741
Tradat, M. I., Manaserh, Y., Sammakia, B. G., Hoang, C. H., and Alissa, H. A. (2021). An experimental and numerical investigation of novel solution for energy management enhancement in data centers using underfloor plenum porous obstructions. Appl. Energy 289, 116663. doi:10.1016/j.apenergy.2021.116663
Tsurumi, R., Inoue, J., Oshio, H., and Asawa, T. (2023). Novel method to remotely measure air temperature distribution for indoor environments with heat sources using thermal infrared spectroradiometer. Build. Environ. 241, 110481. doi:10.1016/j.buildenv.2023.110481
Xiong, X., and Lee, P. S. (2021). Vortex-enhanced thermal environment for air-cooled data center: an experimental and numerical study. Energy Build. 250, 111287. doi:10.1016/j.enbuild.2021.111287
Keywords: data center, airflow organization, CFD, thermal environment, aisle containment
Citation: Jiang D (2024) Effects and optimization of airflow on the thermal environment in a data center. Front. Built Environ. 10:1362861. doi: 10.3389/fbuil.2024.1362861
Received: 29 December 2023; Accepted: 23 April 2024;
Published: 10 May 2024.
Edited by:
Ran Gao, Xi’an University of Architecture and Technology, ChinaReviewed by:
Tabish Alam, Central Building Research Institute (CSIR), IndiaDomenico Laforgia, Yale University, United States
Copyright © 2024 Jiang. This is an open-access article distributed under the terms of the Creative Commons Attribution License (CC BY). The use, distribution or reproduction in other forums is permitted, provided the original author(s) and the copyright owner(s) are credited and that the original publication in this journal is cited, in accordance with accepted academic practice. No use, distribution or reproduction is permitted which does not comply with these terms.
*Correspondence: Di Jiang, NTQ0NzM3NjEyQHFxLmNvbQ==