 Satyadhrik Sharma
95% of researchers rate our articles as excellent or good
Learn more about the work of our research integrity team to safeguard the quality of each article we publish.
Find out more
ORIGINAL RESEARCH article
Front. Built Environ. , 26 April 2023
Sec. Computational Methods in Structural Engineering
Volume 9 - 2023 | https://doi.org/10.3389/fbuil.2023.1194658
This article is part of the Research Topic Rising Stars in Built Environment View all 10 articles
Historical quay walls constructed in unreinforced masonry are integral elements of many cities. Originally designed as gravity retaining walls, they are nowadays often subjected to the action of traffic loads as a result of vehicles travelling on roads constructed on their backfill. This paper presents a numerical analysis procedure for carrying out the structural assessment of quay walls under traffic loads. The procedure simulates the non-linear dynamic response of the quay wall under the effect of the passage of a vehicle. Non-linear dynamic calculations are performed not only to be representative of the actual nature of loading but also to produce realistic estimations of structural safety, load redistribution capacities and displacements. Adopting a tier-based approach, the computational burden typically associated with such simulations is significantly reduced. This is obtained by adopting simplifications which allow for the modelling the 3D soil block comprising the backfill of the quay wall only in the first tier of the procedure. To demonstrate the implementation of the procedure, a detailed application to an existing quay wall in Amsterdam, the Netherlands, is presented. Different foundation damage scenarios are also considered. Though the procedure is presented in this paper for a specific typology of quay walls, it has conceptual and methodological value. With appropriate modifications it can be used for the structural assessment of other earth retaining structures as well, under the effect of vehicular traffic on their backfills.
Thousands of kilometres of quays can be found globally in city centres, inland waterways, commercial port areas and flood defence systems (Roubos et al., 2018). Among these, historical quay walls built in unreinforced masonry (URM) delimiting canals and rivers are vital and emblematic features of the infrastructure of many historical cities in Europe. When modern transportation networks did not exist, waterways represented the easiest way with regards to carrying capacity and energy required to move cargoes around efficiently (de Gijt, 2010). Quay walls, which provide stable shores as well as easy access and docking for ships, have been built ever since people started to travel over water (De Graauw, 2022). Consequently, they can be intrinsically linked to the development and economic prosperity of many European cities as well as entire civilizations.
In the Netherlands, with more than a quarter of the country below the sea level and almost one third of the country at a risk of flooding from rivers (Rijkswaterstaat, 2023a), quay walls (along with the water defence system) play an even more vital role of ensuring that Dutch cities remain dry. Many of the quay walls in the Netherlands are currently more than hundreds of years old, a period over which they have suffered damage of different degrees. Such damage can be attributed to overloading, failure or settlements of their timber pile foundations, aging and deterioration of the material, and lack of adequate maintenance, amongst other causes. These problems are undoubtedly the most pronounced in the capital city of Amsterdam, with the actual state and structural capacity of over 200 km of historic quays being currently unknown, as evidenced by several instances of severe damage (Gemeente Amsterdam, 2023) and collapse (Korff et al., 2022) of these structures. In this context, while a few works have focused on the overall stability of the quays (Korff et al., 2022), on the structural response of the timber foundations (van de Kuilen et al., 2021; Hemel et al., 2022; Pagella et al., 2022), on the remote monitoring of the displacements of the quays (Korff et al., 2021) or of the adjacent buildings (Venmans et al., 2020), or even on innovative renewal strategies (van Dorst and Vervoorn, 2017), limited attention has been given to the masonry superstructure.
In particular, there is the need to develop dedicated analysis procedures which can be used to assess the masonry walls under the effects of vehicular traffic on their backfill. To the best of the authors knowledge, no specific guideline or tailored analysis procedure currently exists to assess the safety or remaining structural capacity of masonry quay walls under the effect of vehicular loads. Assessors consequently resort to generalised guidelines or procedures that are likely to induce conservatism, i.e., underestimate the real structural capacity of this specific structural typology. As an example, cross sectional analysis on a historical masonry quay wall with a failed timber pile is very likely to show that the whole system should fail. However, field investigations involving also underwater scuba diver inspections of the pile foundations (NEBEST B.V., 2016) revealed that pile severely damaged are present below standing quay walls. In other words, the structural failure of one foundation pile does not lead necessarily to collapse of the superstructure. Thus, the assessment of masonry quay walls should also account for the possible redistribution of forces along the length of the wall or any other hidden non-linear reserves to prevent unnecessary exceptional maintenance or even renewal, which have high economical and societal costs and impact on the monumental character of the structure. Another aspect to be considered is that interventions are typically carried out on historical masonry quay walls when monitored displacements exceed a certain threshold. Consequently, the developed assessment procedure should also aim to reliably estimate the displacements of the quay wall as well as correlate displacements and structural capacity. A novel methodology to numerically assess the performance of masonry quay walls under the effect of traffic loads is proposed in this paper to address these goals.
The paper is organised as follows: Section 2 introduces the structural configuration of historical quays in the Netherlands, whose structural performance is investigated in this paper. Section 3 presents the proposed assessment procedure. It also elucidates the shortcomings of currently used methodologies and how the proposed procedure tries to overcome such limitations. Section 4 presents the application of the proposed assessment procedure to a case study of a quay wall in Amsterdam, the Netherlands. The concluding remarks along with current limitations and potential avenues of improvement of the procedure are ultimately presented in Section 5.
Quays refer to any structure built along a navigable waterway to offer safe mooring to vessels (Tsinker, 1997). Having been constructed ever since mankind started to travel over water, the structural configuration of quays have varied over time across the world as well as in the Netherlands. These changes have been both along with the development of new materials as well as the advancement in technical knowledge (de Gijt, 2010; De Graauw, 2022). The quays being addressed in this paper refer specifically to a typology that started being constructed in the Netherlands from the 17th century (CUR Commissie 186, 2013). Such structures built next to rivers and canals, can be found throughout many cities of the Netherlands (Figure 1A).
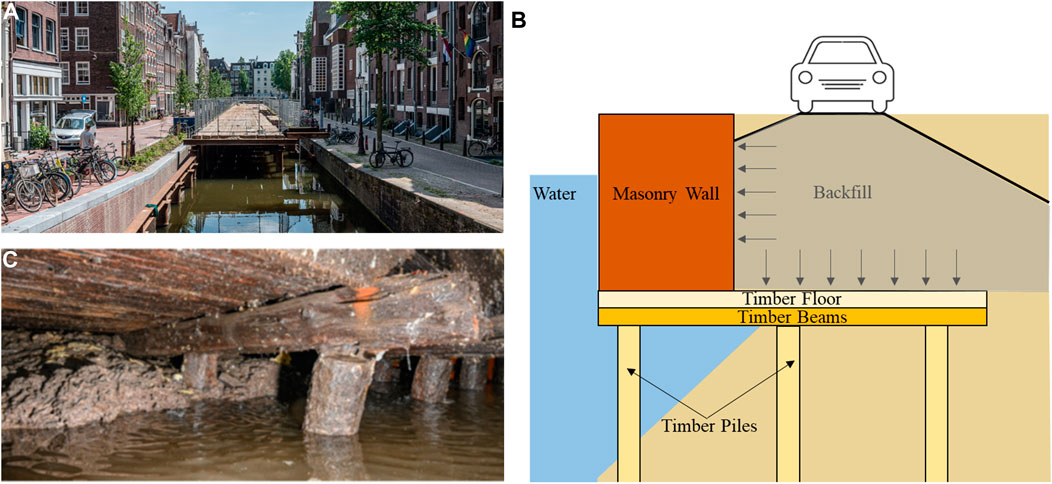
FIGURE 1. (A) Quays in Amsterdam, the Netherlands; (B) schematic cross section of quays in the Netherlands showing how vehicular traffic on them creates pressure distributed by the soil on quay wall structures, and (C) timber floor on top of a timber beam (kespen) connected to a timber pile [Photographs courtesy: Gemeente Amsterdam].
A schematic of a cross section of such quays can be seen in Figure 1B. A masonry wall is placed on a timber floor against the backfill with a foundation of timber piles. In between the foundation piles and the floor, timber beams called kespen are placed (Figure 1C). The masonry wall carries most of the horizontal soil pressure and transfers it via the floor, through the kespen to the piles. The main function of the floor is for construction purposes: the first layer of masonry is built on top of it. However, it also sustains vertical pressure arising from the weight of backfill above it, as well as external forces acting on this backfill. The floor also transfers forces from the wall to the kespen, which in turn provide support to the floor during construction and also ensures an even distribution of forces to the timber piles below. The kespen are normally connected to the timber piles via mortise and tenon joints. The timber piles support the whole system and have a geotechnical function: they are driven to reach the first layer of strong soil. It is important to note that, in the context of this work, the term “quay wall” refers to only the masonry wall in Figure 1B, while “quay” refers to the entire structure, including the masonry wall but also the timber sub-structure.
The original function of the quays was (and still is) making sure that land is safe against high waters and accommodating ships. Keeping these functions in mind, quays were designed primarily as gravity retaining walls, i.e., to be stable against the pressure of the soil behind them. However, today they are subjected to an additional pressure that they were not originally designed for, arising from the increasing vehicular traffic plying on carriageways constructed on top of their backfill (Figure 1B). The procedure proposed in Section 3 addresses the assessment of masonry quays under the effect of vehicular loads.
A methodology to numerically assess the performance of masonry quay walls under the effect of traffic loads is hereinafter proposed to address the goals described in Section 1. A two-tier sub-structured modelling approach is adopted, in analogy to the method used for buildings (Song and Wolf, 1997; Karabalis and Mohammadi, 1998; Zhang et al., 1999; Halabian and El Naggar, 2002; Wegner et al., 2005; Longo et al., 2021). Here, a sub-structured approach refers to the fact that the system constituted of the quay and the adjacent soil (Figure 1B) is divided into two subsystems, each analysed separately. The first sub-system is considered in tier 1, and its associated numerical model consists of just the soil and the road pavement on which the vehicles travel. This model is used to simulate the dynamic propagation of loads resulting from vehicular traffic through the soil onto the quay wall structure. The second sub-system is modelled in tier 2 and consists of just the quay structure. The effects of soil and its interaction with the structure are modelled in a simplified fashion using springs/boundary interface elements. The loading input applied to this second sub-system is obtained from tier 1, in the form of pressure-time series recorded at the locations of the wall and the timber floor. Thus, tier 1 analyses the load propagation through the soil and defines the loads acting on the quay structure, for both the masonry and timber components, while tier 2 assesses the response of the structure to the applied loading input. The “decoupling” of the structural numerical model (i.e., the tier 2 model) from the soil model (i.e., the tier 1 model) allows for the performance of several variations in tier 2 without the need of any modification of the calculations in tier 1. Such variations include but are not limited to variations in structural configurations, geometries, materials, and foundation failure scenarios. Both the tiers are described in more detail in the following sub-sections.
In tier 1 of the proposed procedure, the passage of a vehicle (defined based on the considered traffic load model) is simulated over a limited distance, Δd. This simulation is obtained by performing analyses that consider only the first sub-system, i.e., a 3D solid model of soil and road pavement. The soil block is extended in the direction parallel to the quay for a length sufficient to obtain the whole pressure distribution on the quay structure generated by the vehicle. In the transversal direction the model extends from the waterfront longer than the width of the carriageway over which the vehicle travels. Absorbing boundary conditions (Lysmer and Kuhlemeyer, 1969) are adopted at the external faces of the soil block to simulate the effect of an infinite medium and prevent the reflection of outward waves. No absorbing boundary conditions are modelled on the waterfront, where the quay wall meets the water. A stiffer layer corresponding to the paving of the carriageway over which the vehicle travels is also modelled. Linear-elastic properties are used for all the elements of this model. For the case-study reported in Section 4, these properties correspond to the compacted sand used in Amsterdam, the Netherlands, for the backfill of quays. In particular, values of 1800 kg/m3, 50 MPa and 0.35 were adopted for material density, Young’s modulus, and Poisson’s ratio, respectively. Saturated sand was assigned a higher material density value of 2000 kg/m3. For the pavement, values of 2000 kg/m3, 2000 MPa and 0.25 were adopted for material density, Young’s modulus, and Poisson’s ratio, respectively. An overview of the model used in tier 1 is provided in Figure 2A.
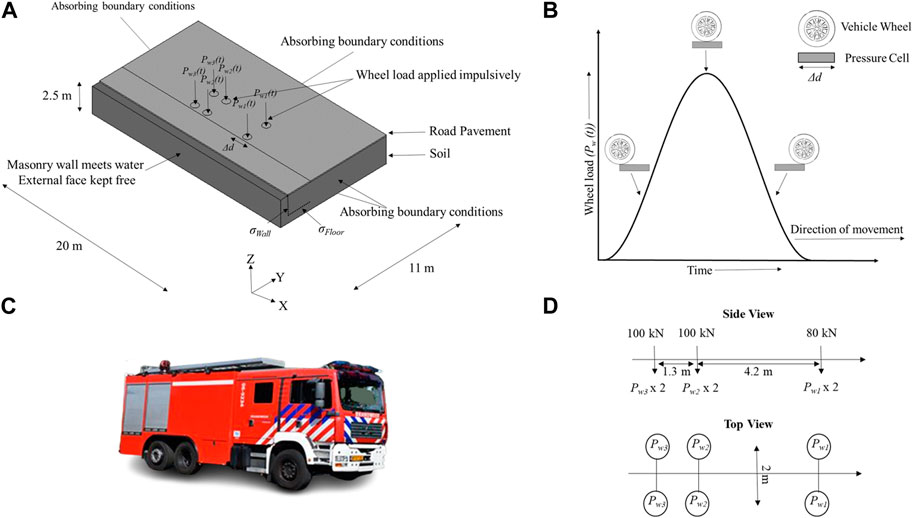
FIGURE 2. (A) Numerical model adopted for tier 1, for a 3 axle, 6 wheeled fire truck; (B) relation between a wheel load impulse (Pw(t)) and the passage of a wheel over a distance Δd; (C) the 3 axle, 6 wheeled fire truck used in Amsterdam and (D) schematic representation of the wheel loads associated with the fire truck.
The passage of the vehicle over a limited distance (Δd) is simulated by applying the weight of the vehicle via each wheel impulsively. The normalized compressive stress impulse used for this purpose corresponds to a haversine impulse fitted to the experimentally readings reported by Loulizi et al. (Loulizi et al., 2002). These experimental readings were measured in an instrumented pavement during the passage of a loaded moving truck over a pressure cell. In the simulation described in this work, Δd corresponds to the diameter of the circular pressure cells used by Loulizi et al. (Loulizi et al., 2002) above which the vehicle travelled when the compressive stress impulse was recorded. As the wheel approaches the pressure cell, the amplitude of the vertical stresses acting on it starts increasing. It reaches its maximum value when the wheel is vertically above the centre of the pressure cell and starts decreasing as the wheel moves further away (Figure 2B). The tier 1 model shown in Figure 2A corresponds to a 3 axle, 6 wheeled fire truck used in Amsterdam, the Netherlands (Figure 2C). This is the traffic load model considered in Section 4 to demonstrate the application of the proposed methodology. The truck is modelled at a distance of 4 m from the quay wall (measured from the inner edge of the quay wall to the longitudinal central axis of the fire truck). Since each wheel load is modelled individually, any traffic load (defined in terms of axle loads and spacing configurations) can be considered in this tier and, consequently, in the proposed assessment procedure.
It can be easily inferred from Figure 1B that vehicles travelling on carriageways constructed on the backfill of quays produce pressure on both the masonry wall and timber floor. The masonry wall and the timber floor are not modelled in tier 1, but the normal compressive stress flow through two surfaces located at their positions is continuously recorded (σWall and σFloor in Figure 2A). From these recordings, a selection is made of the instant at which the stress distributions on the two surfaces result in the maximum net compressive force. The stress distributions at this instant, truncated to get rid of normal tensile stresses which occur simply as a result of the model being linear elastic, define the load to be applied in tier 2 of the methodology. In the tier 1 simulation performed for the fire truck shown in Figure 2C, the net compressive force obtained by integrating the σWall and σFloor distributions maximise simultaneously at the same instant. The two distributions are shown in Figure 3. The time-history of the maxima stresses in these distributions (σMax in Figure 3) are also recorded independently for each surface to be used in step 2 of the methodology.
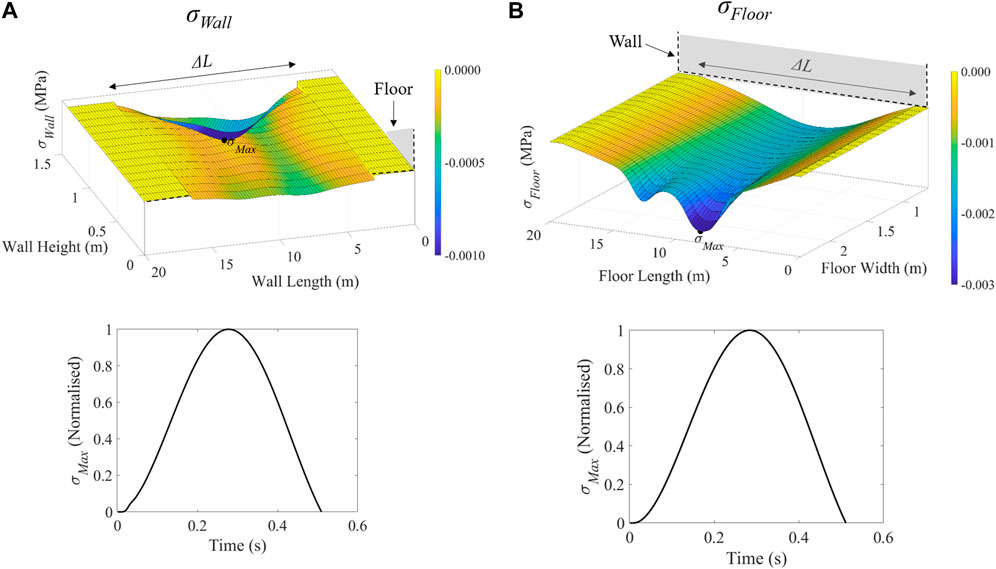
FIGURE 3. Normal stress distributions at the instant of occurrence of maximum net compressive force (top) and time-histories of their maxima (σMax) (bottom) at: (A) masonry quay wall (σWall) and (B) timber floor for a fire truck (σFloor).
In tier 2, the entire structural part of the assessed quay is modelled three-dimensionally. In contrast to tier 1, the soil is left out from the model. However, the impedance of the soil block adjacent to wall and floor is still accounted for through springs/boundary interface elements. The model proposed for tier 2 is used for the structural assessment of the quay wall and is consequently modelled as non-linear. More details of the non-linearities and boundary conditions adopted for the tier 2 model of the selected case study are provided in Section 4.
The effect of vehicular traffic is simulated dynamically along the entire quay wall length by applying the stress distributions σWall and σFloor in combination with the time-histories of their respective maxima σMax, as derived from tier 1 as normal pressure loads on both masonry wall (horizontal pressure) and timber floor (vertical pressure). The pressure loads are applied to a sequence of consecutive sections, each shifted Δd from the previous one along the wall direction, being Δd the same limited distance over which the passage of the vehicle was simulated in tier 1. A time difference of Δt is maintained between load applications on subsequent sections, with Δt calculated as the time required by the vehicle to traverse a distance Δd at the speed to be considered. Since both the time-history of the maxima of stresses and the distributions that generate the largest compressive forces on wall and floor are used, the adopted procedure is simplified yet conservative. The schematic provided in Figure 4 explains this procedure in more detail.
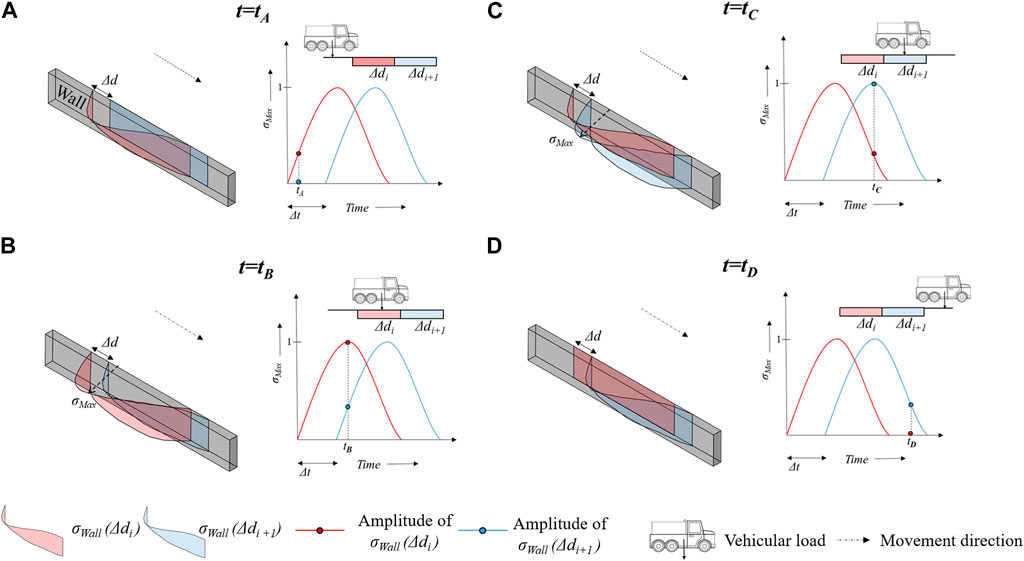
FIGURE 4. Schematic explaining how recordings of step 1 are applied in step 2 to the soil-side face of the wall in order to dynamically simulate the passage of a vehicle: (A) approaching segment Δd1; (B) on top of segment Δd1; (C) on top of segment Δd2; (D) leaving segment Δd2.
Figure 4 shows how the pressure on the quay wall caused by the movement of a vehicle over a distance of two consecutive segments Δdi and Δdi+1 is simulated in tier 2. It should be noted that the schematic provides a qualitative representation of pressure distributions and time-histories. At t = tA in Figure 4A, the vehicle is adjacent to the segment Δdi. The corresponding σWall distribution, i.e., σWall(Δdi), is time-dependent: it is controlled by the time-history at the location of its maxima, i.e., σMax, also recorded from tier 1 and attains its peak when the vehicular load is close to the centre of the Δdi segment, i.e., at t = tB (Figure 4B). Additionally at t = tB, σWall(Δdi+1) also is acting on the wall as the vehicle has started approaching the segment Δdi+1. A time difference of Δt (already defined above as the time required for the vehicle to travel the segmental distance of Δd) is kept between the σMax time-histories controlling the amplitudes of σWall(Δdi) and σWall(Δdi+1) distributions. The σWall(Δdi+1) distribution attains its peak amplitude at t = tc (Figure 4C) when the vehicular load is close to the centre of the Δdi+1 segment; at the same instant the σWall(Δdi) distribution is already decreased in amplitude. The σWall(Δdi) distribution finally stops acting on the wall at t = tD (Figure 4D), while the σWall(Δdi+1) distribution is still applied, although with reduced amplitude, as the vehicle starts moving away from both Δdi and Δdi+1 segments. This procedure is repeated consecutively for all the npassage segments in which the tier 2 model is divided (with npassage = L/Δd, L being the total length of the wall). The same loading procedure is simultaneously performed also for the timber floor. It is important to note here that depending on the magnitude of Δt and period of time over which σMax is recorded to drop down to zero, multiple (more than two as denoted in Figure 4) σWall and σFloor distributions can be acting simultaneously in the tier 2 numerical model.
As it can be noticed in Figure 4, the vehicle also does not necessarily need to be adjacent to a section of the wall (or the floor) for σWall (or σFloor) to be acting on it. As an example, the length ΔL of the wall affected by the compressive stresses generated in tier 1 by the considered vehicle when travelling for a length Δd at a distance of 4 m from the quay wall is approximately 13 m (Figure 3A). Since the value of ΔL largely exceeds the length of the vehicle, it is observed that a significant load pressure is generated on the wall even when none of the vehicle wheels are adjacent to the modelled portion of the quay. This “far-field” effect of vehicular loads is also taken into account while simulating the entry (and conversely also the exit) of the vehicle onto the quay. At the beginning of the simulation in tier 2, the quay is completely unloaded. In the next step, only the outermost Δd-long portion of the entire stress distributions is applied to the wall and floor. Consequently, the entire stress distributions are gradually introduced in Δd-sized portions to simulate the entry of the vehicle to the vicinity of the quay wall and then onwards. The number (nentry) of these Δd-sized portions, which lie outside the length of the model (L), can be calculated as nentry = (ΔL/2)/Δd. Similarly, the stress distributions are also gradually reduced step-wise in Δd-sized portions to simulate the exit of the vehicle, i.e., nexit = nentry. Thus, the total number of Δd-sized portions considered for the complete loading procedure is n = nentry + npassage + nexit.
The tier-based assessment procedure marks a departure from currently used methods in practice on several aspects. Methods recommended in generalised codes (CEN, 2003; AASHTO, 2010; CIRIA, 2017; CSA, 2019) assume a simplified distribution of vehicular loads through soil. The load distribution is also assumed to be time-invariant surcharge, and the dynamic effects are taken into account only by increasing the static load by a factor of safety. This assumed load distribution is then monotonically increased to evaluate the structural capacity. Instead, the proposed procedure computes in tier 1 how soil distributes the vehicular load over time and space, providing a more accurate prediction for these fundamental aspects.
Other methods model the soil explicitly to account for the distribution of vehicular loads through it. Although this approach returns a straightforward representation of the load distribution through the soil, it also makes the model computationally heavy and limits its use to two-dimensional calculations. In the proposed tier-based procedure, which adopts simplified yet conservative assumptions, the soil block can be excluded in tier 2. This makes the proposed procedure efficient for running three-dimensional non-linear analyses. Accounting for the non-linear structural behaviour is essential to identify any possible redistribution capacities or hidden reserves in the quay walls. Besides, interventions and renewal of quay walls are usually decided based on recorded displacements of the walls. Dynamic loading, in addition to being representative of the actual nature of loading, is also necessary for reliably estimating such displacements: unlike static procedures, it accounts for strength-stiffness decay under repeated loading cycles and crack closure (and conversely opening) upon transition from tensile to compressive states (Gatta et al., 2018). Such aspects also make the estimation of both force and displacement capacity of masonry structures based on non-linear dynamic analyses more refined when compared to predictions based on non-linear static analyses.
Finally, it is to be noted that while the numerical analysis procedure has been presented for a particular typology of historical masonry quay walls in this paper, the procedure itself has further conceptual and methodological value. With appropriate modifications in both tiers, it is expected that the procedure can be used for the assessment of other typologies of quays/retaining structures when subjected to loads arising from the movement of vehicular traffic.
The case study to which the proposed procedure is applied to is the Marnixkade quay located along the Singelgracht canal in the North-West side of Amsterdam. According to archival data, this quay was constructed at the end of the 19th century and is now approximately 130 years old. The quay construction consists of a masonry gravity retaining wall standing on a timber floor. The floor is supported on timber piles. Three rows of timber piles parallel to the waterway are present, with timber beams (kespen) on top of them, laid perpendicular to the waterway. Finally, a capstone is placed on top of the wall. This quay was chosen as a case study due to a detailed inspection (NEBEST B.V., 2016) of both superstructure and foundations conducted in 2016 to investigate the feasibility of constructing an underground parking garage in its vicinity. From this inspection, the masonry gravity wall is measured to have average height of 1.4 m and thickness of 0.65 m. The masonry wall is made of clay bricks with a strong trass mortar, consisting of 5 parts lime, 3 parts trass, and 1 part sand. As regards the timber elements, several discrepancies can be found between the original design dimensions in archival records and the information gathered from the field inspection. Environmental actions accumulated over time have led to a reduction of their cross section. The effect of such foundation damage on the response of the quay wall under traffic loading is investigated in section 4.4.2. In particular, the thickness of the timber floor was measured equal to 59 mm, while originally it was 70 mm. Each timber beam (kesp) above the piles is 2.4 m long and was measured to have a cross-section of 189 × 189 mm (originally 200 × 200 mm). The piles have a circular cross-section and are tapered, i.e., their diameter decreases with depth along the length of the pile at a rate of approximately 9.75 mm/m. In the original design, the pile cap diameters varied between 200 and 260 mm, with an average diameter of 235 mm. From the inspection, these diameters were measured to vary between 88 and 242 mm (average of 181 mm). The centre-to-centre distances of the piles in the longitudinal direction vary between 900 mm and 1,200 mm, while in the transverse direction a regular distance of 1,100 mm was measured.
The ground level at Marnixkade is at a height of 0.58 m Normaal Amsterdams Peil (NAP) while the water level is at −0.40 m NAP. Here, NAP refers to the reference plane for water height in the Netherlands: a NAP height of 0 m is approximately equal to the average sea level of the North Sea (Rijkswaterstaat, 2023b). The soil conditions underneath the quay wall have also been investigated via cone penetration tests. Poor soil conditions are found until the first sand layer is detected. The tip of the foundation piles is assumed to reach this layer at approximately −13 m NAP. This results in each pile being approximately 12 m long. Based on the information summarized above, the geometry of the Marnixkade quay is determined (Figure 5).
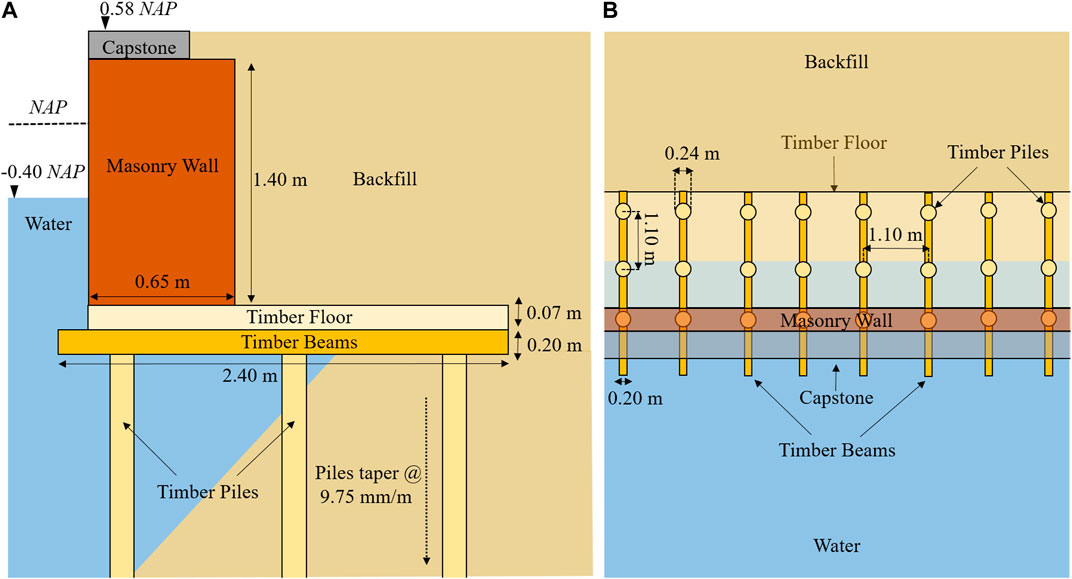
FIGURE 5. Geometry (original dimensions) of Marnixkade as defined in the inspection report (NEBEST B.V., 2016): (A) transversal cross-section and (B) plan view.
All simulations reported in this paper have been performed in the software package Diana FEA 10.5 (DIANA FEA B.V., 2021). The tier 1 numerical model (Figure 2A) adopted for the case study has already been described in Section 3.1. In this sub-section, a more detailed description of the tier 2 numerical model which was adopted for the assessment of Marnixkade is provided (Figure 6). The geometry of this numerical model is obtained by extruding the transversal cross-section in Figure 5A for a length of 30 m. This length was selected on the basis of a sensitivity study that aimed to analyse the effect of the length of the model on the displacements of the quay. Since the Marnixkade quay is much longer (almost 350 m), in-plane restraints are applied as boundary conditions to simulate the confinement provided by the adjacent portions of the quay not considered in this model. An additional sensitivity study was performed to evaluate the effect of presence of dilation joints, numerically modelled by neglecting this confinement and no significant effect was observed.
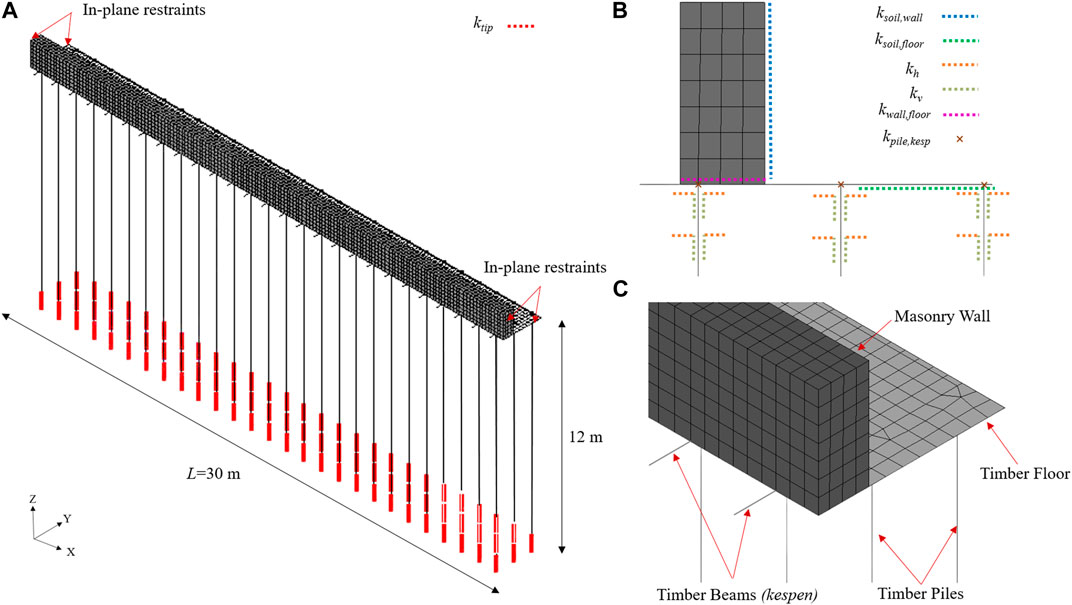
FIGURE 6. Numerical model adopted for tier 2 of the procedure used to assess the response of Marnixkade under traffic loading: (A) general isometric view; (B) transversal cross-section highlighting different interface elements; (C) close-up of the general isometric view.
The quay structure is constructed in masonry and timber. The masonry of the quay wall is modelled via twenty-node isoparametric quadratic solid elements, using an isotropic material model which accounts for both non-linear tensile and compressive behaviour in the principal directions (the Total Strain Rotating Crack model, TSRCM (DIANA FEA B.V., 2021)). Although orthotropic total-strain based constitutive models were recently proposed in DIANA (Rots et al., 2016; Schreppers et al., 2016), the uncertainty about the pattern used within the multi-wythe masonry wall, in which a clear direction for bed- and head-joints cannot be identified, and the fact that the orthotropic model cannot be used with solid elements, led to the use of the TSRCM. The cracking phenomenon in this constitutive law is quantified by the integral under the stress–strain diagram, denoted as fracture energy. Tensile stresses are assumed to diminish linearly, while under compression an initial hardening gives way ultimately to softening defined by a parabolic curve. The timber elements of the quay wall are modelled as linear-elastic. However, the failure of timber elements is still evaluated with an indirect check in the post-process phase, when the maximum stresses that develop in the model are assessed against the material strength defined for different failure mechanisms. Eight-node quadratic curved shell elements are used to model the timber floor, while the kespen and piles are modelled using three-node class III beam elements. The tapering of the piles is taken into account by discretizing the beam elements used for the piles into five segments, each having a different diameter that reduces along with the depth.
The interaction between the different structural components of the quay is also appropriately simulated. The presence of a mortar joint between the masonry wall and the timber floor is simulated using a non-linear interface element (kwall, floor in Figure 6; Table 1), which can capture flexural opening as well as shear sliding. The stiffness of this interface element is determined as per the recommendations of Lourenço (Lourenço, 1996). The connection between the timber floor and the kespen is modelled to be fixed while the connection between the kespen and the timber piles is modelled as a spring with a limited rotational stiffness value of 1E+08 N-mm/rad (kpile, kesp in Figure 6). The stiffness of this connection, typically a mortise and tenon joints cannot be determined unequivocally and the selected value of rotational stiffness was adopted conservatively after assessing the sensitivity of the performed calculations to this parameter.
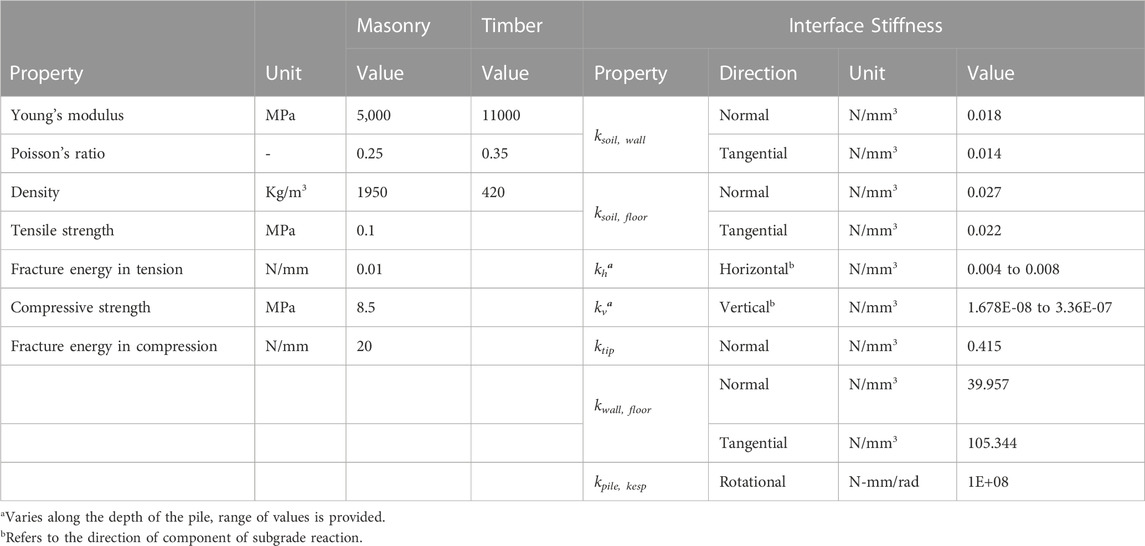
TABLE 1. Summary of material properties adopted in the tier 2 numerical model of Marnixkade.
No soil is modelled in the tier 2 numerical model. However, considerations must be made to account for its presence. To simulate the presence of the soil adjacent to the masonry wall (ksoil, wall in Figure 6) and below the timber floor (ksoil, floor in Figure 6), boundary interface elements with their impedance calculated as per the method summarised by NEHRP (NEHRP, 2012), based on the partially empirical formulation developed by Gazetas (Gazetas, 1991) are adopted. These interface elements are non-linear and act only in compression. The soil around the piles is replaced with linear elastic boundary interface elements that simulate the subgrade reaction (kh and kv in Figure 6). Though simple in its definition, the modulus of subgrade reaction has proved to be a difficult parameter to evaluate. It cannot be measured directly in laboratory tests, but must be back-calculated from full-scale field tests. It is variable not only with the soil type and mechanical properties, but also with stress level and the geometry of the pile. In the absence of detailed information, the coefficient of subgrade reaction may be estimated by several methods. The selected formulations for timber piles are taken from Vesić (Vesić, 1961). Additionally, the interaction with soil at the tip of the timber piles is also simulated using non-linear no tension boundary point elements (ktip in Figure 6). In this case, the stiffness of the interface element is calculated using Boussinesq’s solution for a rigid footing resting on an elastic half-space as reported by Poulos and Davis (Poulos and Davis, 1990).
Regarding material properties, the experimental characterisation of the masonry of Amsterdam quay walls is the subject of an ongoing experimental campaign, complementary to this work (Li et al., 2023). However, given the lack of complete experimental characterisation at the time of running the simulations reported in this paper, material properties for the masonry are adopted from NPR9998 (NEN, 2020), the Dutch code of practice for seismic assessment of structures. The values adopted from NPR9998 in this study for the masonry refer to standard quality clay brick masonry constructed prior to 1945. This set of values was defined from an experimental campaign performed to establish a comprehensive database of material properties (Jafari et al., 2017) towards assessing the vulnerability of the building stock in Groningen, the Netherlands subjected to induced seismicity (Rots et al., 2017). The mortar joint at the wall-floor interface is assumed to have the same tensile and shear strength as the masonry. The timber piles can be correlated to a C24 structural grade according to (NEBEST B.V., 2016). Material properties for C24 strength grade of timber are taken from Eurocode 5 (CEN, 2004). Material properties of soil required to calculate the stiffness of springs (ksoil, wall, ksoil, floor, kh, kv and ktip) simulating the impedance of the soil block adjacent to the wall/below the timber floor and the subgrade reaction are derived from CPTs performed at Marnixkade. All values of material properties used in the tier 2 model are provided in Table 1.
A Rayleigh damping of 2% is accounted for in the calculation. Implicit time step integration using the Hilber Hughes-Taylor method, also called the α method (Hilber et al., 1977) is used to perform the dynamic analyses, adopting a value for α equal to −0.1 and a time step of 0.001 s. The Secant BFGS (Quasi-Newton) method is employed as iterative method. The displacement norm must be satisfied during the iterative procedure with a tolerance of 1%. The Parallel Direct Sparse method is employed to solve the system of equations. Second order effects are also considered via the Total Lagrange geometrical nonlinearity.
The primary traffic load considered in the investigation of the structural behaviour of Marnixkade is the passage of the 3 axle, 6 wheeled fire truck shown in Figure 2C. This truck is assumed to be travelling at a speed of 30 km/h. Additionally, a parking strip runs along the quay wall at ground level. This parking strip consists of spaces for parking diagonally at an angle of 45° with some trees in between. A uniformly distributed load (UDL) of 5 kN/m2 is considered for this parking load for a distance of 2.5 m inland from the quay wall. The effect of the parking load is also applied to the quay using the proposed tiered methodology. Assumed to be time-invariant, the UDL is applied statically to the tier 1 model. The stress distributions σWall and σFloor are recorded after application of the UDL and applied as a preload to the tier 2 model, prior to simulating the dynamic passage of the fire truck. Other static loads applied directly to the tier 2 numerical model before simulating the passage of the fire truck include the gravity load, which is automatically calculated by the software based on the density assigned to each material, and the dead load due to the weight of the capstone. Soil and water pressure are also applied horizontally to the wall. The vertical component of soil and water pressure are also applied on the floor.
On the waterside, several houseboats and boats are parked and anchored to the quay wall. Mooring loads provided by boats-houseboats and ship collisions are not taken into account. The horizontal load on the quay wall caused by the counteraction of the roots of the trees in the parking strip when subjected to wind load is not considered either.
The methodology proposed in this paper is applied to assess the performance of the case study Marnixkade assuming different structural conditions for the 81 timber piles that compose the foundation of the modelled length of the quay. Section 4.4.1 presents the outcomes of the simulations performed for Model 1 (Figure 7A), in which all the timber piles are assumed to be present in undamaged state, i.e., having the original average diameter of 235 mm for all the pile caps. In contrast, Section 4.4.2 considers 4 different damage scenarios for the foundation to investigate the effect of environment induced actions on the timber piles on the structural response of the quay, i.e., to account for the discrepancy in dimensions with respect to the original design that was observed during the inspection in 2016 (NEBEST B.V., 2016). In all of the considered scenarios, 27 out of the total of 81 piles are assumed to be missing. Model 2 and Model 3 both assume the 27 missing piles to be adjacent to each other. However, in Model 2 all 27 piles in the front row (water side) are missing (Figure 7B), while in Model 3 the central 27 piles are missing (Figure 7C). The functional piles are all assigned a pile cap diameter of 128 mm, which is the average diameter they are expected to have currently (in 2023) as per the inspection carried out in 2016. Model 4 and Model 5 consider the location of these 27 piles to be distributed randomly across the model. While the same locations for the missing piles are assumed in both of these models, Model 4 assumes a pile cap diameter of 128 mm for all the functional piles (Figure 7D). Model 5, instead, assumes different pile cap diameters for each functional pile, with these diameters also being randomly distributed based on a log-normal distribution and a median pile cap diameter of 128 mm (Figure 7E).
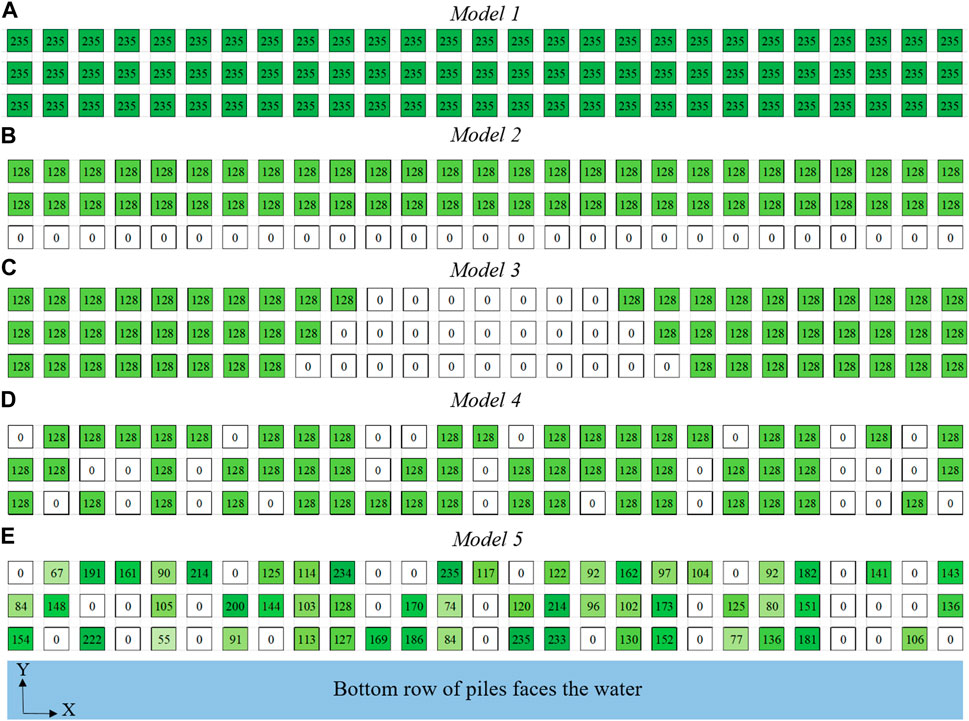
FIGURE 7. Pile cap diameters considered during application of traffic loads: (A) Model 1 (B) Model 2; (C) Model 3; (D) Model 4 and (E) Model 5. Plan view: each square corresponds to a pile. All dimensions are in mm.
It is also to be noted that in Models 2–5, the piles are modelled to be damaged (i.e., reduced in diameter) or missing (diameter equal to zero) only during the application of the traffic loads, both the UDL representing parking and the passage of the fire truck. All models start with 81 undamaged piles having a pile cap diameter of 235 mm, and the self-weight of the structure, dead load of the capstone as well as soil and water pressures are applied to this configuration. Post-application of these loads, the pile diameters are reduced linearly over a time period of 100 years before subjecting the model to the traffic loads, and the additional deformations as well as the incremented stresses are recorded.
In this work, the UDL representing the parking load is first applied. After, the load associated with the passage of the vehicle is progressively increased to evaluate the structural capacity of the quay. In the context of the proposed methodology, this simply requires scaling up the σWall and σFloor recordings made from the tier 1 model by multiplying them with a scalar Load Multiplier (LM). It should be noted that LM = 1 corresponds to the load produced by the single passage of the reference fire truck, so that the outcomes of the corresponding analysis provide insight on the damage that the wall undergoes due to the transit of such vehicle. The values of the LM are then scaled up to failure of the wall. In each analysis corresponding to a LM, the wall is initially undamaged. In other words, no damage accumulation is considered when repeating the analyses for increasing values of LM.
The out-of-plane (OOP) displacements of the quay wall at three different instants during the passage of the fire truck along Model 1 (LM = 1) are shown in Figure 8. These instants are (A) when the fire truck has entered the quay and is at a location L/4, (B) when the fire truck is at L/2, and (C) when the fire truck is heading towards exiting the quay and is at a location 3L/4. Very limited displacements can be observed and the wall remains in an undamaged state. The OOP displacement time-histories of the quay wall at the same three locations, i.e., L/4, L/2 and 3L/4, are shown in Figure 8D. While the fire-truck requires only 3.60 s (= 30 m/30 km/h) to travel the length of the model, approximately another 2.80 s are required to simulate its gradual entry and exit. Additional 10 s are provided in each analysis after the fire-truck has completed its passage along the quay, for the quay to find its equilibrium after unloading.
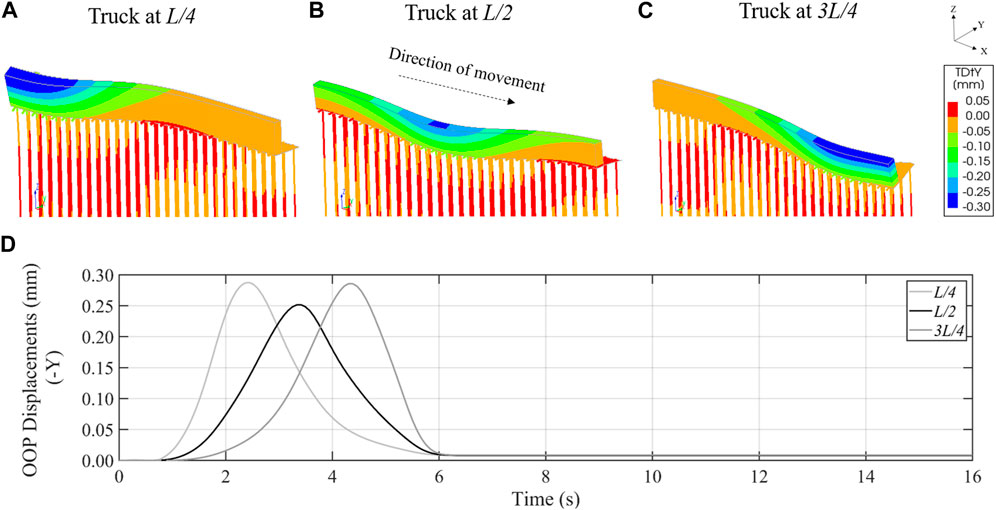
FIGURE 8. Out-of-plane displacements of Model 1 during the passage of the fire-truck (LM = 1) at different instants: truck at (A) L/4; (B) L/2; (C) 3L/4 (Deformation scale factor = 2000) and (D) displacement time-histories at L/4, L/2 and 3L/4.
The quay exhibits seemingly linear elastic behaviour until a LM value of 5. Even at a LM value of 10, the maximum OOP displacements are still limited to about 10 mm. Diagonal cracks can be observed to form in the masonry wall as the truck makes its passage, though they are of limited crack width. However, what is of more interest is the observation that these cracks can close when the truck progresses along the quay wall and is no longer in its vicinity (Figure 9). This behaviour is possible due to the dynamic nature of the loading applied which allows crack closure upon transition from tensile to compressive state. Principal crack widths provided in Figure 9 as well as all other figures of this paper are defined as the product of the crack strain and crack bandwidth. Crack strains are output in each crack individually and calculated as: total strain–elastic strain. Crack bandwidth for the solid elements used to model the quay wall are computed as:
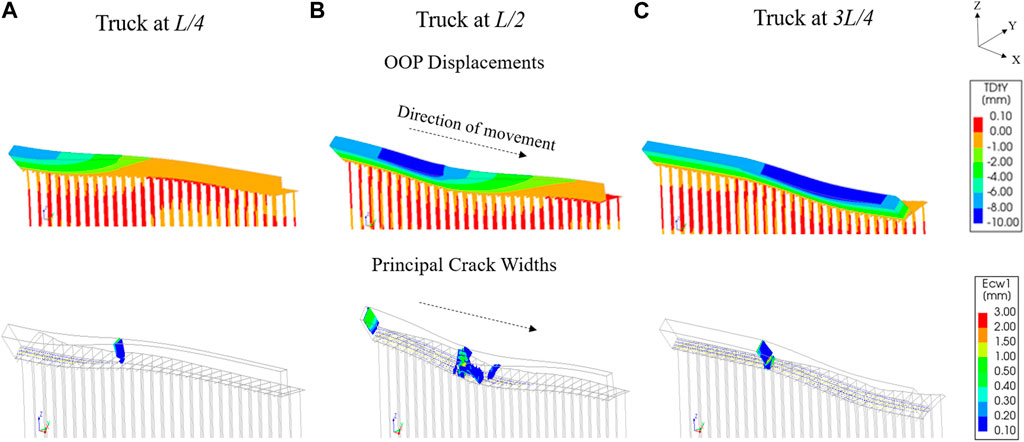
FIGURE 9. Out-of-plane displacements and principal crack widths of Model 1 during the passage of the fire-truck (LM = 10) at different instants: truck at (A) L/4; (B) L/2 and (C) 3L/4. (Deformation scale factor = 200).
Significant OOP deformation and crack openings, indicative of collapse, are seen in the quay wall only at a LM value of 40. The entire wall cracks as the truck passes and, unlike for the analysis run with LM = 10, the cracks formed at the passage of the truck remain open even when the truck is not in the vicinity. These cracks also pass through the entire thickness of the wall, while the wide flexural crack near the base of the wall suggests imminent overturning of the wall (Figure 10). The shear strength of all the timber beams/kespen is also checked to have been exceeded at the end of the analysis run with a value of LM = 40.
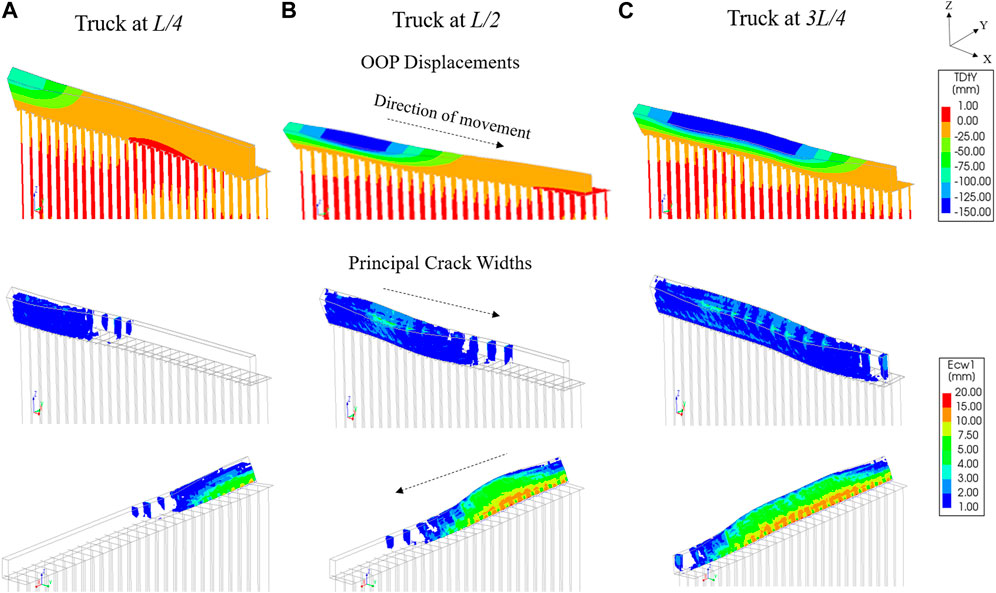
FIGURE 10. Out-of-plane displacements and principal crack widths of Model 1 during the passage of the fire-truck (LM = 40) at different instants: truck at (A) L/4; (B) L/2 and (C) 3L/4. (Deformation scale factor = 10).
Models 2–5 all start from different states in terms of displacements as well as damage before any traffic load is applied to them, due to the deformation of the model under the static loads caused by the gradual reduction of the pile diameter over time. The highest displacements are exhibited by Model 2, in which the entire quay rotates with the front tilting forward and downwards due to the first row of piles being missing. As a result of the whole system rotating, no cracks can be observed in the wall in Model 2. The highest amount of cracking can be observed instead in Model 3. This cracking can be attributed to the bending of the wall in the central region where the missing piles are located. In comparison, the quay in both Model 4 and Model 5 (which have the same number of missing piles as Model 2 and Model 3 but distributed randomly throughout the length of the model) show relatively limited displacements as well as damage. Cracking in both these models is limited to a vertical crack which passes through the whole thickness of the quay wall.
Starting from the states described above, both Model 2 and Model 3 exhibit collapse under the application of the parking load, albeit due to different failure mechanisms. In case of Model 2, the application of the parking load exacerbates the rotation of the quay. While no cracks form in the quay wall, the bending moment that develops in all the piles in the back row of the quay exceeds their bending strength (=4.94 kNm) and the quay can be considered to have collapsed (Figure 11A). For Model 3, the application of the parking load leads to an increase in the damage resulting from settlement due to foundation damage. The numerical solution diverges after the application of 32% of the parking load. At this stage, the stresses developed in the timber members of Model 3 do not exceed their strength, but the central portion of the wall exhibits heavy damage and ultimately overturns locally (Figure 11B).
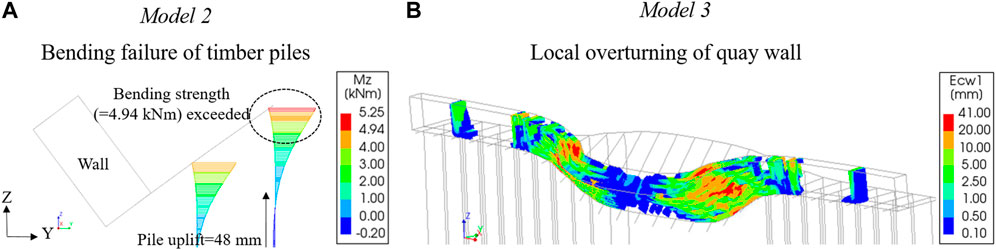
FIGURE 11. Failure mechanisms of (A) Model 2 (generic cross-section) and (B) Model 3.
Model 4 and Model 5 show only limited increase in displacements as well as crack widths under the application of parking load, with further increase occurring during the passage of the fire truck with LM = 1. More damage appears in both these models only at LM = 5. The increase in damage is larger in the case of Model 5, with the appearance of a second vertical crack in addition to the one that develops prior to the application of any traffic load (Figure 12D). This can be observed in Figures 13A, B, which shows the maximum principal crack widths that develop in the quay wall at any time of the passage of the fire truck (and not at a single instant of time).
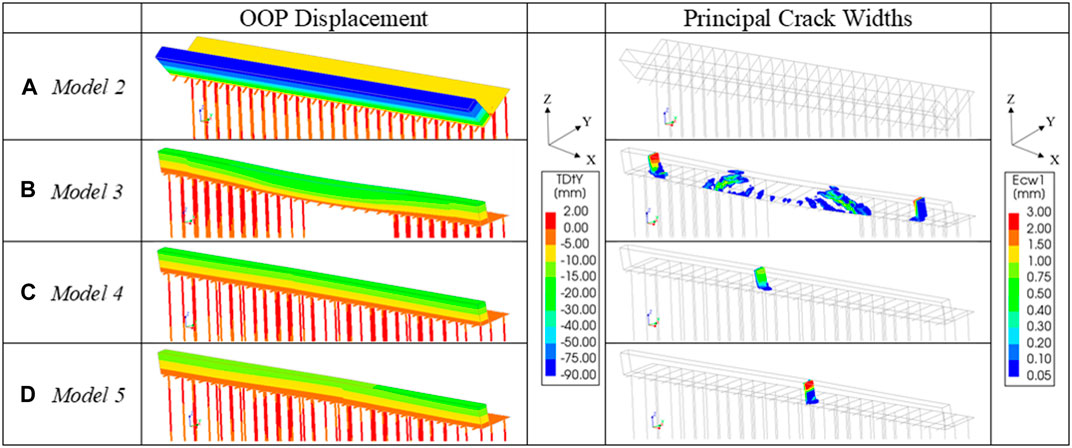
FIGURE 12. Out-of-plane displacements and principal crack widths of the quay wall before application of traffic load: (A) Model 2; (B) Model 3; (C) Model 4 and (D) Model 5. (Deformation scale factor = 10).
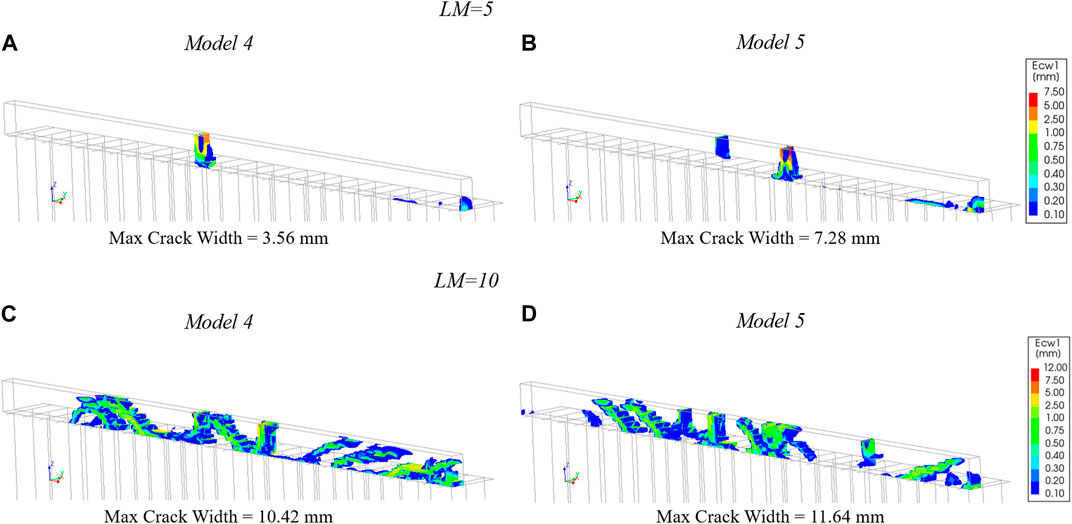
FIGURE 13. Maximum principal crack widths developed during the passage of the fire-truck: with LM = 5 for (A) Model 4; (B) Model 5 and with LM = 10 for (C) Model 4; (D) Model 5.
More extensive damage in the quay wall is observed for both these models at LM = 10. This damage is in the form of diagonal cracks which develop along the quay wall as the fire truck passes by. The diagonal cracks do not close when the truck is not in their vicinity. Instead, they connect to adjoining diagonal cracks via horizontal flexural cracks which develop at the base of the quay wall. The nature of the damage to the quay wall is similar in both models, though it is slightly more pronounced in terms of crack width in the case of Model 5 with respect to Model 4 (Figures 13C, D). Also, the normal and shear stresses exceed the timber compressive and shear strength, respectively, in one timber pile and two timber beams/kespen in Model 5, while no such exceedance is detected in any of the timber members of Model 4.
Significant OOP deformation and crack openings, indicative of collapse, are seen in both Model 4 and Model 5 at LM = 20. The behaviour of both Model 4 and Model 5 at LM = 20 is similar to what Model 1 exhibits at LM = 40 (Figure 10). Although the response is characterized in both models by a large number of timber members exceeding their compressive, flexural or shear strength, this number is higher in the case of Model 5 with respect to Model 4. The entire quay wall cracks as the truck passes by and a wide flexural crack near the base of the wall suggests imminent overturning of the wall. Despite the lower value of LM = 20 causing collapse, both Model 4 and Model 5 exhibit crack widths similar to Model 1 at LM = 40, while lower OOP displacements can be observed in Model 4 and Model 5 as compared to Model 1.
To investigate the effect of foundation damage on the response of the quay wall, a plot of the maximum reaction forces recorded in the wall for a given value of LM against the maximum OOP displacement of the wall in the same analysis is provided in Figure 14 for Model 1, 4 and 5. 27 damaged foundation piles located near each other cause both Model 2 and Model 3 to collapse already under the application of the parking load and are consequently excluded from this plot. The maximum reaction force plotted in Figure 14 is also normalised with respect to the length of the quay wall being analysed, i.e., L = 30 m.
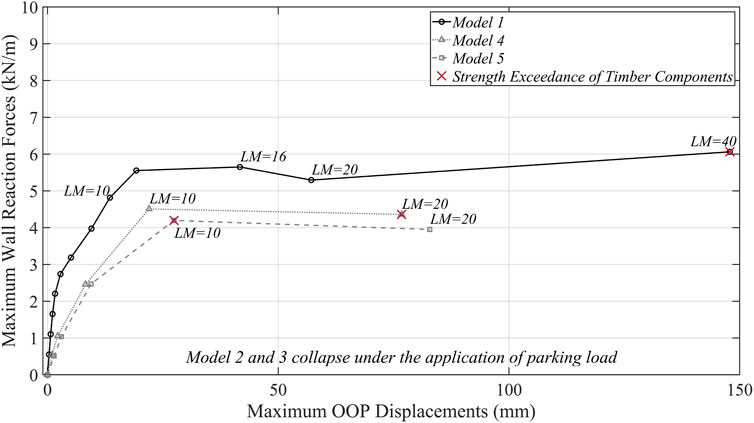
FIGURE 14. Maximum wall reaction force vs. maximum out-of-plane displacement curves for undamaged and damaged foundation scenarios.
It can be easily inferred from Figure 14 that foundation damage largely affects the response of the quay wall. The differences in the response of the quay wall in Model 1 and Model 4/Model 5 are already easily perceptible from the lower range of values of LM, as the stiffness of the wall, already lower since the beginning for Model 4/Model 5, further reduces starting from LM = 2. A peak of the maximum reaction forces is found at LM = 16 in Model 1. The force decreases at LM = 20, after which it exhibits a hardening behaviour till LM = 40. This hardening can be attributed to the fact that each data point in the curves in Figure 14 corresponds to a separate analysis in which the wall was undamaged to start off with and is then subjected to the passage of a fire-truck whose wheel loads are multiplied by the LM. As LM values are scaled up, even the amplitude of the initial stress distributions (σWall and σFloor) applied to the undamaged wall can be large enough to cause the wall to respond with a reaction force larger than the peak value associated with the previous values of LM. Such hardening behaviour is not observed for Model 4 and Model 5 for the values of LM considered. The peak of the maximum reaction forces is predicted for both these models at LM = 10, at a value approximately 20% lower than that computed for Model 1 at LM = 16. As described in the previous section, Model 1 exhibits behaviour indicative of collapse at LM = 40, whereas Model 4 and Model 5 at LM = 20. In Figure 14, such behaviour indicative of collapse is also revealed by the disproportionate increment of maximum OOP displacements from LM = 20 (for Model 1) and LM = 10 (for Model 4 and Model 5). The first instance of strength exceedance of the timber components for Model 1 also occurs at LM = 40. This occurs much earlier for Model 4 and Model 5, occurring at LM = 20 and LM = 10 respectively.
Lastly, the comparison of Model 4 and Model 5 allows to quantify the influence on the quay structural response due to the use of the individual diameter for each pile or of a median value. Both models start from a similar state of damage due to the degradation of their foundations, and similar damage due to the passage of the fire-truck is found for low values of LM (LM = 1, LM = 2). Differences start emerging from LM = 5, when larger damage is observed in Model 5. Although the peak maximum reaction force is reached for both models at LM = 10, the force for Model 5 is 8% lower than for Model 4, while the corresponding displacement is 20% higher. Finally, both models exhibit behaviour indicative of collapse at LM = 20. As already mentioned, the first instance of strength exceedance also occurs earlier for Model 5 with respect to Model 4.
A novel two-tier analysis procedure is proposed in this paper to numerically assess the response of masonry quay walls under the effect of traffic loads. Adopting simplified yet conservative assumptions, the procedure simulates the passage of a vehicle over carriageways constructed on the backfill of quays. The proposed analysis procedure requires the explicit modelling of the soil block comprising the backfill only in the first tier assumptions, which allows a dramatic reduction of the computational burden with respect to traditional approaches. The simulations performed are also non-linear dynamic, allowing for realistic estimates of structural safety and peak/residual displacements. Load redistribution capacity of the masonry quay walls can be identified, thanks to the adopted time- and space-variance of the applied loading and the three-dimensional model. Application of the analysis procedure to a case study in Amsterdam, the Netherlands, is presented. The procedure shows promising potential towards predicting the failure of the structural components and capturing the effect of foundation damage on the structural response of quay walls under traffic loads. As it is to be expected, foundation damage reduces the capacity of the wall, with this reduction being larger when the damaged piles are located in the vicinity of each other. Differences in the spatial distribution of the damaged piles leads to the development of different failure mechanisms; from the global to the local overturning of the masonry walls, up to the failure of single timber elements in the foundation system. Finally, though the analysis procedure and its implementation are presented for a typology of historical masonry quay walls in this paper, it has further conceptual and methodological value. With modifications it is expected that the procedure can be used for the assessment of other typologies of earth retaining structures as well when subjected to loads arising from the movement of vehicular traffic on their backfill.
The implementation of the analysis procedure presented in the paper can be developed in several aspects. Multiple passages of vehicles and damage accumulation from such passages should be considered instead of increasing the traffic load associated with a single vehicle to quantify structural capacity. The timber components can also be modelled with non-linear material models instead of checking the strength exceedance of stresses developed in them. Similarly, the interface elements simulating the subgrade reaction could also be modelled with non-linear behaviour. As these points have not been considered in the demonstrated application of the analysis procedure, results presented for the case-study cannot be directly used for the structural assessment of the quay. In addition, future work on developing the analysis procedure itself (not its implementation) should focus on: accounting for failure of the backfill itself, cross-checking the proposed methodology against numerical models considering the soil block representing the backfill explicitly, and validating it against experimental recordings from an earth retaining structure when a vehicle travels on its backfill.
The presented results are available via the 4TU.ResearchData repository at http://doi.org/10.4121/39908ad6-1af8-4592-b6f3-e71106c971aa. The data are distributed under the license type CC BY.
SS: Conceptualization, Methodology, Formal Analysis, Visualization, Validation, Data Curation, Writing—Original Draft. ML: Conceptualization, Methodology, Software, Formal Analysis, Investigation, Visualization, Validation, Data Curation, Writing—Review & Editing. FM: Conceptualization, Methodology, Writing—Review & Editing, Supervision, Project Administration, Funding Acquisition.
This research was funded by the municipality of Amsterdam via the Amsterdam institute for Advanced Metropolitan Solutions (AMS) within the scope of the research programme Bridges and Quay Walls (Programma Bruggen en Kademuren).
The authors would like to thank to Rick Voortman and Berber Renckens of Ingenieursbureau Gemeente Amsterdam for providing data related to the case study adopted in the paper.
The authors declare that the research was conducted in the absence of any commercial or financial relationships that could be construed as a potential conflict of interest.
All claims expressed in this article are solely those of the authors and do not necessarily represent those of their affiliated organizations, or those of the publisher, the editors and the reviewers. Any product that may be evaluated in this article, or claim that may be made by its manufacturer, is not guaranteed or endorsed by the publisher.
AASHTO (2010). AASHTO LFRD bridge design specifications. Washington, DC, United States: American Association of State Highway and Transportation Officials.
CEN (2003). Eurocode 1: Actions on structures - Part 2: Traffic loads on bridges. Brussels, Belgium: The European Union.
CEN (2004). Eurocode 5: Design of timber structures - Part 1-1: General - common rules and rules for buildings. Brussels, Belgium: The European Union.
CIRIA (2017). Report C580 Embedded retaining walls – guidance for economic design. London, United Kingdom: Construction Industry Research and Information Association.
CSA (2019). CAN/CSA-S6-06 Canadian highway bridge design code. Toronto, Canada: Canadian Standards Association.
de Gijt, J. G. (2010). “A history of quay walls, techniques, types, costs and future,”. Doctoral Thesis. Delft.
Gatta, C., Addessi, D., and Vestroni, F. (2018). Static and dynamic nonlinear response of masonry walls. Int. J. Solids. Struct. 155, 291–303. doi:10.1016/j.ijsolstr.2018.07.028
Gazetas, G. (1991). Formulas and charts for impedances of surface and embedded foundations. J. Geotechnical Eng. 117, 1363–1381. doi:10.1061/(asce)0733-9410(1991)117:9(1363)
Gemeente Amsterdam (2023). Gemeente Amsterdam. Available at: https://www.amsterdam.nl/projecten/kademuren/.
Halabian, A. M., and El Naggar, M. H. (2002). Effect of non-linear soil-structure interaction on seismic response of tall slender structures. Soil Dyn. Earthq. Eng. 22, 639–658. doi:10.1016/S0267-7261(02)00061-1
Hemel, M.-J., Korff, M., and Peters, D. J. (2022). Analytical model for laterally loaded pile groups in layered sloping soil. Mar. Struct. 84, 103229. doi:10.1016/j.marstruc.2022.103229
Hilber, H. M., Hughes, T. J. R., and Taylor, R. L. (1977). Improved numerical dissipation for time integration algorithms in structural dynamics. Earthq. Eng. Struct. Dyn. 5, 283–292. doi:10.1002/eqe.4290050306
Jafari, S., Rots, Jan. G., Esposito, R., and Messali, F. (2017). Characterizing the material properties of Dutch unreinforced masonry. Procedia Eng. 193, 250–257. doi:10.1016/j.proeng.2017.06.211
Karabalis, D. L., and Mohammadi, M. (1998). 3-D dynamic foundation-soil-foundation interaction on layered soil. Soil Dyn. Earthq. Eng. 17, 139–152. doi:10.1016/S0267-7261(97)00047-X
Korff, M., Hemel, M.-J., and Peters, D. J. (2022). Collapse of the grimburgwal, a historic quay in Amsterdam, The Netherlands. Proc. Institution Civ. Eng. - Forensic Eng. 175, 96–105. doi:10.1680/jfoen.21.00018
Korff, M., Venmans, A., and Stoppelman, P. (2021). “City scale InSAR monitoring of (buildings behind) quay walls,” in 2021 IEEE International Geoscience and Remote Sensing Symposium IGARSS, Belgium, 11-16 July 2021 (IEEE), 1966–1969. doi:10.1109/IGARSS47720.2021.9553784
Li, X., Messali, F., and Esposito, R. (2023). “Mechanical characterization of multi-wythe masonry bridge in the city of Amsterdam,” in Structural analysis of historical constructions (Japan: Kyoto).
Longo, M., Sousamli, M., Korswagen, P. A., van Staalduinen, P., and Rots, J. G. (2021). Sub-structure-based ‘three-tiered’ finite element approach to soil-masonry-wall interaction for light seismic motion. Eng. Struct. 245, 112847. doi:10.1016/j.engstruct.2021.112847
Loulizi, A., Al-Qadi, I. L., Lahouar, S., and Freeman, T. E. (2002). Measurement of vertical compressive stress pulse in flexible pavements: Representation for dynamic loading tests. Transp. Res. Rec. J. Transp. Res. Board 1816, 125–136. doi:10.3141/1816-14
Lourenço, P. (1996). Computational strategies for masonry structures. Doctoral Thesis. Delft, Netherlands: Delft University of Technology.
Lysmer, J., and Kuhlemeyer, R. L. (1969). Finite dynamic model for infinite media. J. Eng. Mech. Div. 95, 859–877. doi:10.1061/JMCEA3.0001144
NEBEST B.V. (2016). Marnixkade in Amsterdam. Funderingsonderzoek. Ref: 27854-01-01, definitive. Netherlands: Vianen.
NEHRP (2012). Soil-structure interaction for building structures. USA: U.S. Department of Commerce National Institute of Standards and Technology.
NEN (2020). Assessment of structural safety of buildings in case of erection, reconstruction and disapproval – induced earthquakes – basis of design, actions and resistances. Delft, Netherlands: NPR9998+C1, 2020.
Pagella, G., Ravenshorst, G., Gard, W., and Kuilenvan de, J. (2022). “Characterization and assessment of the mechanical properties of spruce foundation piles retrieved from bridges in Amsterdam,” in International conference on timber Bridges (Switzerland: Biel/Bienne).
Poulos, H. G., and Davis, E. H. (1990). Pile foundation analysis and design. New York, USA: Wiley and Sons.
Rijkswaterstaat (2023a). Rijkswaterstaat. Available at; https://www.rijkswaterstaat.nl/en/water/water-management.
Rijkswaterstaat (2023b). Rijkswaterstaat. Available at; https://www.rijkswaterstaat.nl/zakelijk/open-data/normaal-amsterdams-peil.
Rots, J. G., Messali, F., Esposito, R., Jafari, S., and Mariani, V. (2016). “Computational modelling of masonry with a view to Groningen induced seismicity,” in Structural analysis of historical constructions (Belgium: Leuven).
Rots, J. G., Messali, F., Esposito, R., Mariani, V., and Jafari, S. (2017). Multi-scale approach towards groningen masonry and induced seismicity. Key Eng. Mater 747, 653–661. doi:10.4028/www.scientific.net/kem.747.653
Roubos, A. A., Steenbergen, R. D. J. M., Schweckendiek, T., and Jonkman, S. N. (2018). Risk-based target reliability indices for quay walls. Struct. Saf. 75, 89–109. doi:10.1016/j.strusafe.2018.06.005
Schreppers, G. M. A., Garofano, A., Messali, F., and Rots, J. G. (2016). DIANA Validation report for Masonry modelling. Delft, Netherlands: DIANA FEA B.V.
Song, C., and Wolf, J. P. (1997). The scaled boundary finite-element method—Alias consistent infinitesimal finite-element cell method—For elastodynamics. Comput. Methods Appl. Mech. Eng. 147, 329–355. doi:10.1016/S0045-7825(97)00021-2
van de Kuilen, J. W. G., Beketova, J. W., Hummel, O., Pagella, G., Ravenshorst, G., and Gard, W. (2021). “An integral approach for the assessment of timber pile foundations,” in World conference on timber engineering (Chile: Santiago).
van Dorst, R., and Vervoorn, R. (2017). “Non-invasive method for quay wall reconstruction in historic inner cities,” in International conference on soil mechanics and geotechnical engineering (South Korea: Seoul).
Venmans, A. A. M., op de Kelder, M., de Jong, J., Korff, M., and Houtepen, M. (2020). Reliability of InSAR satellite monitoring of buildings near inner city quay walls. Proc. Int. Assoc. Hydrological Sci. 382, 195–199. doi:10.5194/piahs-382-195-2020
Vesić, A. B. (1961). Bending of beams resting on isotropic elastic solid. J. Eng. Mech. Div. 87, 35–53. doi:10.1061/JMCEA3.0000212
Wegner, J. L., Yao, M. M., and Zhang, X. (2005). Dynamic wave–soil–structure interaction analysis in the time domain. Comput. Struct. 83, 2206–2214. doi:10.1016/j.compstruc.2005.04.004
Keywords: quay walls, historical infrastructure, traffic loading, soil-structure interaction, unreinforced masonry, foundation damage, finite element method, non-linear dynamic
Citation: Sharma S, Longo M and Messali F (2023) A novel tier-based numerical analysis procedure for the structural assessment of masonry quay walls under traffic loads. Front. Built Environ. 9:1194658. doi: 10.3389/fbuil.2023.1194658
Received: 27 March 2023; Accepted: 14 April 2023;
Published: 26 April 2023.
Edited by:
Giovanni Castellazzi, University of Bologna, ItalyReviewed by:
Antonio Maria D'Altri, University of Bologna, ItalyCopyright © 2023 Sharma, Longo and Messali. This is an open-access article distributed under the terms of the Creative Commons Attribution License (CC BY). The use, distribution or reproduction in other forums is permitted, provided the original author(s) and the copyright owner(s) are credited and that the original publication in this journal is cited, in accordance with accepted academic practice. No use, distribution or reproduction is permitted which does not comply with these terms.
*Correspondence: Satyadhrik Sharma, S.Sharma-9@tudelft.nl
Disclaimer: All claims expressed in this article are solely those of the authors and do not necessarily represent those of their affiliated organizations, or those of the publisher, the editors and the reviewers. Any product that may be evaluated in this article or claim that may be made by its manufacturer is not guaranteed or endorsed by the publisher.
Research integrity at Frontiers
Learn more about the work of our research integrity team to safeguard the quality of each article we publish.