 Zhihui Ye
 Issa Chaer
 Rusdy Hartungi
- School of the Built Environment and Architecture, London South Bank University, London, United Kingdom
The United Kingdom (UK) has pledged to reduce its greenhouse-gas emissions to net zero by 2050. However, in July 2022, the High Court ruled that the government’s net zero strategy failed to outline policies that would enable it to meet the target. As a result, the government published a new plan that sets out opportunities for innovative technologies like Floating Offshore Wind Manufacturing, and hydrogen, which will not only help us reach net zero. For wind, the government’s goal is to develop up to 50 GW of offshore wind by 2030. The challenge of such an expansion is huge. It means the United Kingdom will need to install an estimated 3,200 new, and much larger, wind turbines by 2030—roughly three new turbines every 2 days. Airborne Wind Energy (AWE) systems are part of a new class of wind energy converters that is receiving considerable attention in the renewable energy generation arena. AWE systems benefit from the steadier and stronger wind streams at high altitudes to generate more energy from wind while avoiding the expense of tower construction. This paper presents a feasibility study of using AWE systems in the UK and particularly in the City of Aberdeen to generate renewable energy. The characteristics of wind energy distributions were theoretically investigated by developing a wind speed distribution model, and then the annual power production of a kite system and a turbine system with 30 kW generator were analysed by applying the annual wind profile in Aberdeen to the performance models of these two systems. It was found that the annual power production of the kite system was two times higher than that of a normal turbine system.
1 Introduction
To help defeat the worldwide expectation regarding a gap between energy supply and demand, together with the possible effects of climate change due to the excessive burning of fossil fuels, the United Kingdom government has defined a leading-edge objective, to decrease the United Kingdom’s economy-wide greenhouse gas emissions by at least 80% compared to 1990 levels by 2050 and has authenticated this target through the Climate Change Act (Committee on Climate Change, 2008).
Additionally, the United Kingdom government has similarly agreed to enlarge its share of final energy usage from renewable sources such as wind, biomass and solar to 15%. This desire from the United Kingdom government works with and supports the EU in meeting the necessary objective of a 20% decrease in global emissions by 2020 (Commission of the European Communities, 2008).
In the United Kingdom, wind can produce higher energy values in comparison with most other renewables resources such as biogas or solar, as there are regions where average wind speeds reach up to 10 m/s (Met Office, 2022).
Wind power generation accounted for 24% of total electricity generation in the United Kingdom in 2020; of this, offshore wind and onshore wind accounted for 13% and 11% respectively (Office for National Statistics, 2021). Both onshore and offshore wind power generation have grown substantially during the last decade. However, ground-based wind energy is approaching its technical and economic limit as developments seem to be reaching a peak and levelling off. It is essential for wind energy systems to improve in numerous key areas including the investigation and creation of materials such as carbon-fiber blade designs, the efficiency of wind energy conversion technologies, and reducing the frequency of maintenance schedules which in turn decreases the operating expenses of the system (Bošnjaković, et al., 2022). It is challenging to enhance the cost-efficiency of traditional wind turbine systems unless an innovative technology is developed to explore wind power (U.S. Department of Energy, 2021).
Airborne Wind Energy systems are an innovative technique for harvesting wind energy at higher elevations, normally beyond 150 m. At greater altitudes, AWE systems are expected to capture more wind energy and produce more electrical energy due to the higher and steadier wind speed. AWE systems are made of two main components 1) a ground system and 2) at least one aircraft that is mechanically and electrically connected by tethers (Diehl, 2013), as shown in Figure 1. Among various AWE systems, pumping cycle kite power (henceforth referred to as kite) systems are the most developed technology (Cherubini, et al., 2015). During the last decade, kite systems have been developed by several companies and research groups. The concept of kite systems is that of utilising a kite to capture wind energy and transmitting it to a ground station by tether cables. Inside the ground station, the tether cables are connected to drums which are fixed to generator motors.
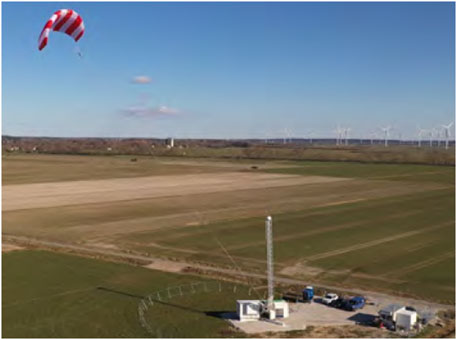
FIGURE 1. AWE Ground-Gen systems (SkySails, no date).
Currently, the cost of energy production for AWE systems is higher than for traditional wind turbine systems. As public investment in AWE technology increases, AWE systems will become more competitive and will have a lower average price than traditional wind turbine systems by the mid-2030s (BVG Associates, 2022). The upfront cost of AWE systems is much lower than for traditional wind turbine systems as it is 15% of total discounted project costs for AWE systems whilst it is 40% for traditional wind turbine systems (BVG Associates, 2022). Operating expenses for AWE systems are estimated to be a higher fraction of the total cost than for traditional wind turbine systems, due to higher annual operating expenses of 3%–20% of capital expenses versus 2%–3% for traditional wind turbine systems (U. S. Department of Energy, 2021).
The aim of contrasting a kite system with a traditional wind turbine system is to examine how the annual wind energy generation profiles differ between the two systems throughout the year and to review whether a change in altitude has any influence on the power performances of the systems.
Scotland is the most favourable location in the United Kingdom for the application of AWE systems (Ye, et al., 2018a). The energy produced by kite systems has been investigated for five locations in Scotland (Ye, et al., 2018b). However, how much more power kite systems can generate compared to traditional turbine systems has not yet been investigated. In this study, firstly, wind data was obtained from Energy Plus Simulation Software and analysed using the Weibull distributions and Hellmann’s power law to develop the wind speed profile. Secondly, the equations of predicted power generation were obtained by fitting a polynomial curve to the generator’s manufacturer specification power curves. Finally, the predicted power generation of both systems was calculated by inputting the wind speed to the predicted power generation equations.
2 Theoretical background of energy in wind
In order to harness the wind’s power, it is essential to understand the wind energy resource and the amount of energy it provides. Wind power is a function of the moving air density (
It can be seen from Equation 1 that both wind speed and density influence the magnitude of the wind power. When comparing wind power at ground level versus at elevated altitudes, two aspects must be considered: 1) wind speed tends to rise with altitude, and 2) air density reduces with increased altitude. Due to the power being a function of the wind speed cubed, higher wind speeds are essential for increasing the amount of power being generated. The huge reliance on wind speed for power generation is the key driving force for scientists to exploit airstreams at elevated altitudes as they try to increase wind power production (Manwell, et al., 2009).
AWE is defined to be wind power produced at altitudes beyond those of traditional ground-built wind turbines that are typically 100–150 m in tower height. AWE can be considered at heights from above 150 m to approximately 16 km.
Meteorological data shows that air density decreases with increasing temperature and altitude (Jha, 2011). The density of air changes from 1.225 kg/m3 at sea level to 0.413 kg/m3 at an altitude of 10 km (Husain, 2010). This shows that the energy generated at a specified wind speed at sea level would be three times more than the energy generated by an identical wind turbine situated at an altitude of 10 km. The change in air density is approximately linear with height, since the density at an altitude of 1 km is 1.112 kg/m3, i.e. 9.2% below the density at sea level. Considering the annual average temperature, the effect of seasonal changes in temperature on wind power availability is negligible (Jha, 2011).
3 Working principles of pumping cycle kite power systems
The pumping cycle kite power system is the most extensively studied AWE system in the world. The kite system captures energy from the wind through tether cables that connect the kite to a ground-level station, which consists of cable reel drums fixed to generator motors, as shown in Figure 2.
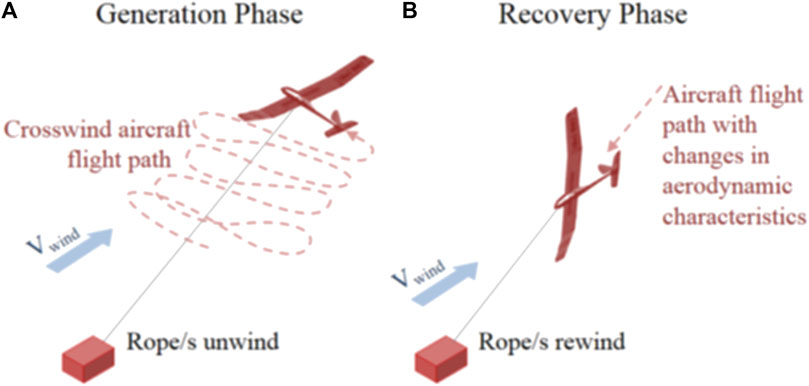
FIGURE 2. Working principle of the pumping kite power system. (A) Power generation phase. (B) Power recovery phase (Cherubini, et al., 2015).
The capture of wind energy by the kite system relies on the production of aerodynamic forces from a kite cutting across the wind, as it glides in a figure eight motion. The production of electrical energy is achieved in a two-phase cycle, i.e., generation phase (traction phase) and recovery phase (retraction phase). In the generation phase, the lift force created by the kite when it is reeling out drags the tether cables, producing electrical energy as it rotates the reel drum connected to the generator. The recovery phase begins when the kite has reached to its maximum height. The kite then performs a fall with low resistance enabling the drum to reel in the tether cables. This results in the kite returning to its original starting position. The two-phase cycle repeats itself, delivering a big gain in net power with every complete kite cycle. This is guaranteed by a control system in the Kite Steering Unit (KSU) that controls the movement of the kite to maximise energy production in the generation phase and minimise energy consumption in the recovery phase (Canale, et al., 2007; Fagiano, et al., 2010).
Within the KSU, there are electric drives, drums and control system hardware. The energy conversion process occurs in the KSU in three steps: 1) the movement of the kite produces traction forces on the tether cables which are transmitted to the drums, therefore capturing kinetic energy from the wind; 2) these forces cause the drums to rotate which converts the kinetic energy into mechanical energy, and 3) consequently, the rotation of the electric drives or generators, as they are connected to the drums, converts mechanical energy into electrical energy, as shown in Figure 3.

FIGURE 3. Energy conservation mechanism (Ye, et al., 2018b).
4 Research methodology
The methodology of this research concentrates on accomplishing the aim of estimating the yearly power generation of a kite system and a traditional wind turbine, and to explore whether a change in altitude has any influence on the power performances of the systems. In order to achieve this, a realistic approach was conducted of developing the annual hourly wind profile of a particular site location to apply to both the kite and turbine systems, by developing a wind model whose results were used to calculate the generator power output. In addition to this, each system was specified to have similar wind cross sectional areas. The generator ratings and operational altitude heights of both systems were designated to be approximately the same.
Applying the analytical model developed by Luchsinger. (2013), Ye, et al. (2018b) studied the annual energy production of the kite system at five different locations in Scotland using average wind speed data from CIBSE (Chartered Institution of Building Services Engineers) Guide J (CIBSE, 2002). Among these five locations, only the hourly wind data in Aberdeen is available from Energy Plus Simulation Software weather data (U.S. Department of Energy’s Building Technologies Office, 2022).
To accurately estimate the annual energy production for both the kite system and wind turbine system, hourly wind direction and wind speed data in Aberdeen, Scotland United Kingdom for years 1982–1994 was acquired from Energy Plus Simulation Software weather data (U.S. Department of Energy’s Building Technologies Office, 2022).
To evaluate the wind energy potential of Aberdeen, Microsoft Excel was used to analyse the wind data. The wind simulation models created in Excel allow for the prediction of the hourly cumulative frequency of different wind speeds as well as how the wind speed profile varies with altitude, orientation, and surrounding terrain characteristics.
In the development of the wind model, the main elements examined were the height of the turbine rotor or airborne kite altitude which changes the wind speed, as well as the direction of wind travel, which is known to alter the wind speed, given that the friction coefficient varies according to the type of terrain.
4.1 Wind speed distribution analysis model
The variation and frequency of wind speeds at a specified location during a year can be expressed by a probability density function. The Weibull and Rayleigh distributions are very suited to fitting wind speed frequency distributions. The Rayleigh distribution function is a special case of the Weibull distribution function where its shape factor
For the Weibull distribution,
In addition to this, the cumulative probability distribution
Fitting the wind speed data to the cumulative form of the Weibull distribution,
Wind speed and installation height above the ground affect the power generation of kite systems and wind turbine systems. The wind data from the Energy Plus Simulation Software weather data provides the meteorological wind speed
where
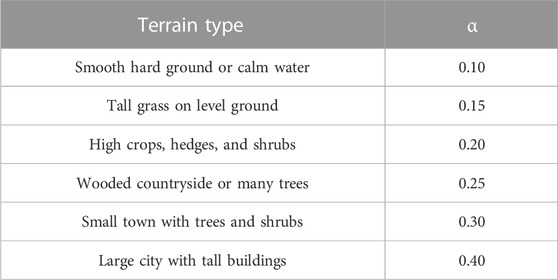
TABLE 1. Typical values of friction coefficient for different terrain (Manwell, et al., 2009).
4.2 Kite and turbine system generator performance
The Wind Power Program database (Wind Power Program, 2019) was used to effectively determine the generator performance of the kite and wind turbine systems. The database comprises a variety of different generator wind performance power curves.
To successfully determine and compare the annual performances of each system at non-standard wind conditions, the generators were chosen out of a range of similar ratings at 30 kW as well as the same wind extraction cross-sectional areas of approximately 80 m2.
At very low wind speeds, the torque exerted by the wind on turbine blades is not large enough to cause them to rotate and therefore produce electrical power. The minimum wind speed at which turbine blades start to rotate and produce electrical power is called the cut-in speed. As the wind speed increases, the forces on the turbine structure greatly increases. Accordingly, there is a risk of damaging the turbine rotor. To protect the rotor from damage, at a certain wind speed, the so-called cut-out speed, the rotor is brought to a standstill by applying a braking system. Wind turbines have rotor blades and therefore the generator wind characteristics in regards to these systems tend to have cut-in and cut-out winds speeds that range between 3.5 and 24 m/s, whereas kite systems features an aerofoil design which means that the generator wind characteristics allow this style of system to be capable of generating power at lower and higher wind speeds between the scope of 1–45 m/s (Wind Power Program, 2019). This allows the generators for both systems to be individually selected based on the corresponding wind characteristics of the different systems.
4.3 Kite and turbine system power prediction
Many AWE developers are focused on small-scale energy generation between 1 and 100 kW (U.S. Department of Energy, 2021). In this study, the Joliet Cyclone 30 kW generator was selected for the wind turbine system and the Fortis Montana 30 kW generator for the kite system due to their similar wind extraction cross-sectional areas and meeting the cut-in and cut-out wind speed requirements of both systems, as shown in Table 2. Each generator’s power was modelled in relation to the weather conditions of the site location of Aberdeen, Scotland using Microsoft Excel.
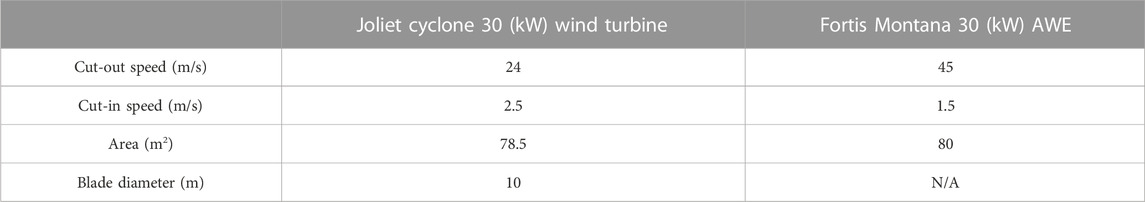
TABLE 2. Manufacturer specifications for the generators (Wind Power Program, 2019).
The actual hourly power profiles of the kite system and turbine system were estimated by fitting a polynomial curve to the generator manufacturer specification power curves.
The power generation for the kite system during the traction phase,
The power consumption for the kite system during the retraction phase,
The power generation for the turbine system,
The equations acquired above were used with the new hourly wind speed profiles obtained from Hellmann’s power law to calculate the power generation of both systems.
5 Results
The wind speeds obtained from the Energy Plus Simulation Software weather data were analysed by using the Weibull distribution function and Hellmann’s power law to create a model for the wind speed profile. The analysed wind speed profile was inputted into the power prediction equations to obtain the power generation for both the kite system and turbine system.
5.1 Wind speed distribution model
The Weibull distribution was modelled to convert the hourly wind information into frequency distributions to investigate and measure the wind potential in Aberdeen, Scotland. The Weibull distribution analysis shows that the mean and most probable wind speeds are 4.8 m/s and 3.52 m/s respectively. Figure 4 shows that for about 60% of the time each year the wind speed is in the range of 2.2–6.5 m/s.
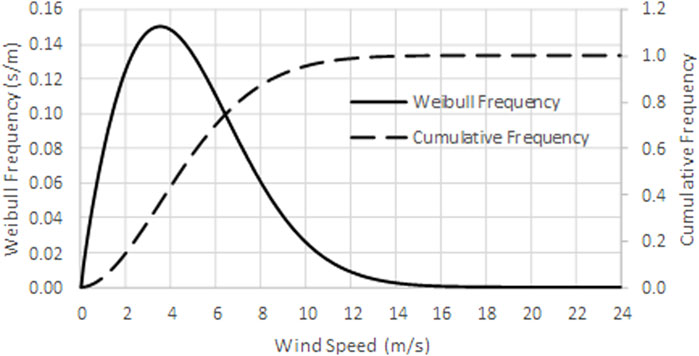
FIGURE 4. Weibull and cumulative frequency distribution of Aberdeen, Scotland.
5.2 Annual wind power generation and installation height comparison
Monthly power generation was compared at an altitude of 100 m and annual power generation was compared at altitudes from 50 to 250 m for kite and wind turbine systems.
At an altitude of 100 m, the kite system has a remarkable total yearly power generation of 108 MWh and an annual average power coefficient of 0.75. In comparison, the traditional wind turbine system produces a total yearly power of 51 MWh and has an annual average power coefficient of 0.32.
Studying the two wind power generation profiles in Figure 5 shows that there is less fluctuation in the power generation of the kite system and the power production is much more uniform annually in comparison to the traditional wind turbine system. It is also evident that the kite system can generate double the amount of power that the turbine system generates for the year. In the month of August, it can be seen that the kite system can even produce an incredible power output of 8.2 MWh which is almost four times more powerful than the wind turbine system at 2.2 MWh.
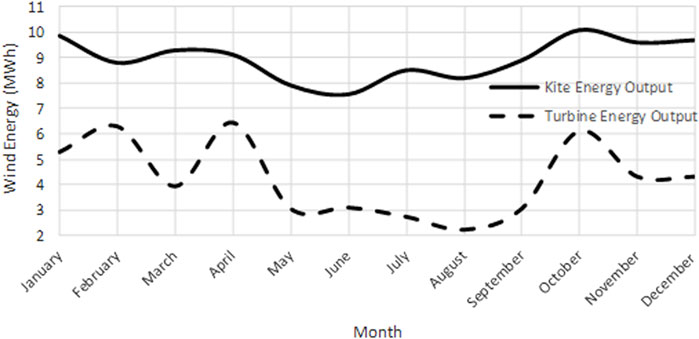
FIGURE 5. Annual wind energy generation system comparison.
Figure 6 shows the increase in annual power generation for both systems with altitude. It is apparent that the rate of power generation for the kite system starts to slow down and level out as the altitude increases. In comparison to the kite system, the annual pace of power production for the turbine system also reduces, however, not as quickly.

FIGURE 6. Annual wind energy generation system comparison at various altitudes.
6 Conclusion
The windy geography of the United Kingdom renders it one of the top locations in the world for harnessing wind power and is often considered to be the best location in Europe for doing so. Since the 1980 s, the number of both onshore and offshore wind farms have increased greatly. This study has investigated the annual wind power generation profiles of the kite system throughout the year in comparison to the wind turbine system, in which it was found that the kite system noticeably generates two times more power annually than the turbine system. The power generation difference between these two systems peaks in August. It was also found that power generation for both systems increased with installation height. This is due to the cut-in and cut-out characteristics of wind turbine blades, in contrast to the aerofoil design of a kite which allows for more generation of power at lower and higher wind speeds. In addition, the power coefficient of the design is another reason for the kite system’s high-power output.
In relation to self-reliance on nationwide energy generation and security, kite systems can deliver a reliable and steady source of local renewable energy to the Scotland region. Therefore, implementing kite systems would certainly help the United Kingdom in reaching the greenhouse gas emission targets set by the United Kingdom government and satisfy the essential objectives of the EU.
Overall, contrasting the predicted annual power generation of a kite system to a traditional wind turbine, the kite system has proven to be the best throughout the year as well as at different altitudes. This establishes that renewable kite technologies have higher power generating potential than old traditional renewable turbine technologies. The results of this study highlight that the power generation of AWE systems can be competitive and there would be a high potential of large power generation by implementing kite systems within the United Kingdom. In terms of the estimated cost efficiency of a completely AWE system, an average price lower than traditional wind turbine systems will be achievable in the mid-2030 s (BVG Associates, 2022).
The Energy Plus Simulation Software weather data used for the yearly, hourly wind speed and direction weather data of Aberdeen, Scotland is not that accurate as 1) the pre-1976 data has a 35%–50% uncertainty and 2) the post-1976 data has a 25%–35% uncertainty (U.S. Department of Energy’s Building Technologies Office, 2022). The quality of wind data significantly influences the analytical results of the wind speed distribution model and the prediction of annual wind power generation. In terms of future work for AWE system development, it is crucial to characterize the quality and quantity of wind resource data for altitudes higher than 150 m, which is beyond traditional wind turbines. Currently, the AWE system is a novel and innovative technology that needs significant further development before it can be implemented at large scale. The environmental impact of AWE systems such as on wildlife should also be studied.
Data availability statement
The raw data supporting the conclusion of this article will be made available by the authors, without undue reservation.
Author contributions
All authors listed have made a substantial, direct, and intellectual contribution to the work and approved it for publication.
Conflict of interest
The authors declare that the research was conducted in the absence of any commercial or financial relationships that could be construed as a potential conflict of interest.
Publisher’s note
All claims expressed in this article are solely those of the authors and do not necessarily represent those of their affiliated organizations, or those of the publisher, the editors and the reviewers. Any product that may be evaluated in this article, or claim that may be made by its manufacturer, is not guaranteed or endorsed by the publisher.
References
Bošnjaković, M., Katinić, M., Santa, R., and Martić, D. (2022). Wind turbine technology trends. Appl. Sci. 12, 8653. doi:10.3390/app12178653
Bvg Associates, (2022). Getting airborne–the need to realize the benefits of airborne wind energy for net zero. White Paper for Airborne Wind Europe. [Online]. Available at: https://airbornewindeurope.org/wp-content/uploads/2023/03/BVGA-Getting-Airborne-White-Paper-220929.pdf (Accessed June 2023).
Canale, M., Fagiano, L., and Milanese, M. (2007). Power kites for wind energy generation: Fast predictive control of tethered airfoils. UK London: IEEE Control Systems Magazine.
Chang, T. J., Wu, Y. T., Hsu, H. Y., Chu, C. R., and Liao, C. M. (2003). Assessment of wind characteristics and wind turbine characteristics in Taiwan. Renew. Energy 28, 851–871. doi:10.1016/s0960-1481(02)00184-2
Cherubini, A., Papini, A., Vertechy, R., and Fontana, M. (2015). Airborne wind energy systems: A review of the technologies. Renew. Sustain. Energy Rev. 51, 1461–1476. doi:10.1016/j.rser.2015.07.053
CIBSE, (2002). Weather, solar and illuminance data: Guide J. The Chartered Institution of Building Services Engineers.
Commission of the European Communities, (2008). Proposal for a directive of the european parliament and of the council on the promotion of the use of energy from renewable source. [Online]. Available at: https://eur-lex.europa.eu/legal-content/EN/TXT/?uri=CELEX%3A52016PC0767 (Accessed June 2022).
Committee on Climate Change, (2008). Building a low-carbon economy–The UK’s contribution to tackling climate change. [Online]. Available at: https://www.theccc.org.uk/publication/building-a-low-carbon-economy-the-uks-contribution-to-tackling -climate-change-2/ (Accessed June 2022).
Diehl, M. (2013). “Airborne wind energy: Basic concepts and physical foundations,” in Airborne wind energy. Editors U. Ahrens, M. Diehl, and R. Schmehl (Berlin: Springer). 3–22 [Chapter 1].
Fagiano, L., Milanese, M., and Piga, D. (2010). High-altitude wind power generation. Control Syst. Technol. IEEE Trans. Energy Conversat. 18 (2), 168–180. doi:10.1109/tec.2009.2032582
Jha, A. R. (2011). “Design aspects and performance requirements,” in Wind turbine technology (Boca Raton: CRC Press, Taylor and Francis Group), 31–78. [Chapter 2].
Luchsinger, R. (2013). “Pumping cycle kite power,” in Airborne wind energy. Editors U. Ahrens, M. Diehl, and R. Schmehl (Berlin: Springer), 47–64. [Chapter 3].
Manwell, J. F., McGowan, J. G., and Rogers, A. L. (2009). Wind energy explained: Theory, design and application. 2nd ed. UK: John Wiley and Sons Ltd.
Met Office, (2022). Where are the windiest parts of the UK. [Online]. Available at: https://www.metoffice.gov.uk/weather/learn-about/weather/types-of-weather/wind/windiest-place-in-uk (Accessed June 2022).
Office for National Statistics, (2021). Wind energy in the UK: June 2021. [Online]. Available at: https://www.ons.gov.uk/economy/environmentalaccounts/articles/windenergyintheuk/june2021 (Accessed June 2022).
Power, SkySails, and No, D. Wind power unleashing its true potential. [Online]. Available at: https://skysails-power.com (Accessed June, 2023).
U. S. Department of Energy, (2021). Challenges and opportunities for airborne wind energy in the united states. Report to congress November 2021. [Online]. Available at: https://www.energy.gov/sites/default/files/2021-12/report-to-congress-challenges-opportunities-airborne-wind-energy-united-states.pdf (Accessed June 2023).
U. S. Department of Energy’s Building Technologies Office, (2022). Energy plus simulation software weather data. [Online]. Available at: https://energyplus.net/weather (Accessed June 2022).
Wind Power Program, (2019).Wind power program. [Online]. Available at: http://www.wind-power-program.com/turbine_characteristics.htm (Accessed July 2022).
Ye, Z., Lawner, H., Chaer, I., and Ross, M. (June 2018b). Feasibility study of pumping cycle power system implication in Scotland UK. Proceedings of the Present. A. T. 3rd Int. Conf. Renew. energy conservation Sydney, Australia.
Keywords: airborne wind energy, pumping cycle kite power system, wind turbine, wind energy, carbon emission
Citation: Ye Z, Chaer I, Hartungi R and Ross M (2023) Theoretical analysis of the power generation of pumping cycle kite power systems compared to traditional wind turbines in Aberdeen. Front. Built Environ. 9:1091068. doi: 10.3389/fbuil.2023.1091068
Received: 06 November 2022; Accepted: 25 July 2023;
Published: 07 August 2023.
Edited by:
Tongyu Zhou, The University of Nottingham Ningbo, ChinaReviewed by:
Dengfeng Du, The University of Nottingham Ningbo, ChinaZhen Peng, Qingdao University of Technology, China
Copyright © 2023 Ye, Chaer, Hartungi and Ross. This is an open-access article distributed under the terms of the Creative Commons Attribution License (CC BY). The use, distribution or reproduction in other forums is permitted, provided the original author(s) and the copyright owner(s) are credited and that the original publication in this journal is cited, in accordance with accepted academic practice. No use, distribution or reproduction is permitted which does not comply with these terms.
*Correspondence: Zhihui Ye, eWV6NEBsc2J1LmFjLnVr