 Nabil Al-Akhras*
 Osama Othman
- Civil Engineering Department, Jordan University of Science and Technology, Irbid, Jordan
There is limited research on the bond behavior of NSM strips embedded in corroded/cracked reinforced concrete (RC). Therefore, this study was initiated to evaluate the bond behavior between corroded/cracked RC and NSM strips. The test specimens consist of two concrete prisms (reinforced and plain) mounted from two opposite sides with NSM strips. After 28 days of moisture curing, twenty-four specimens were immersed in saline solution and were exposed to three accelerated corrosion levels with steel mass loss of 2.2, 4.1 and 8.1%. The bond behavior was evaluated using double shear pullout test. The study showed that the corrosion cracks increased with the increase of corrosion level. The maximum crack width reached 0.91 mm at corrosion level 3. The mass loss of the corroded reinforcing steel increased from 2.1% for corrosion level 1–8.3% for corrosion level 3. The bond strength between NSM strips and corrosion cracked concrete was significantly decreased with maximum reduction of 48% at corrosion level 3. The other bond characteristics including maximum slip, bond toughness and bond stiffness were also decreased with corrosion with percent reduction of (31, 67 and 35%), respectively. The failure mode of the bond between NSM strips and corrosion cracked concrete was splitting of concrete. Theoretical models were proposed for predicting the bond strength between NSM strips and corrosion cracked concrete based on corrosion level and crack width. The proposed models showed excellent agreement with the experimental results from the current study and the literature.
Introduction
Many reinforced concrete (RC) structural elements suffer from degradation and deteriorations with time that reduce the structural capacity of the elements and may cause failure in severe situations. Therefore, repair and rehabilitation are needed to restore the structural capacity of the deteriorated elements. The use of fiber-reinforced polymer (FRP) is a popular practice for the repair of the deteriorated RC elements (Lee et al., 2000; Al-Allaf et al., 2016). The most commonly method used of FRP is externally bonded by wrapping FRP composite laminates to the external surface of the deteriorated RC elements. However, premature debonding between the FRP and concrete usually takes place before reaching the full capacity of the FRP tensile strength (Mukhopadhyaya and Swamy, 2001; Nguyen et al., 2001).
Near surface mounted (NSM) fiber reinforced polymer technique was developed to overcome the premature debonding failure of FRP. This technique uses FRP composite strips inserted into slits inside the concrete cover of the RC member (Lorenzis and Nanni, 2015; Triantafyllou et al., 2018; Dias and Barros 2012; Mosallam et al., 2022). Recently, repair and strengthening using NSM technique showed promising results to increase the load-carrying capacity of the RC members without debonding. The high level of strength efficiency associated with repaired RC elements using NSM strips demonstrated this technique as a viable and promising repair procedure (Bilotta et al., 2011; Coelho et al., 2015).
Corrosion of reinforced concrete (RC) structures is a major problem all over the world especially in structures exposed to marine environment. Corrosion products possess larger volume than the original steel forming tensile stress that causes deterioration in RC structures (Peng et al., 2015; Fernandes et al., 2018; Kreit et al., 2011).
The corrosion of RC elements repaired with NSM strips produce negative impact on the bond strength between NSM strips and concrete. The intensity of the bond degradation is not well established and requires more investigation. Therefore, this study was initiated to evaluate the bond behavior between NSM strips and corrosion cracked concrete using different parameters including three levels of corrosion deterioration, number of NSM strips (Triantafyllou et al., 2018; Al-Akhras and Aleghnimat, 2020) and bond lengths of NSM strips (100 and 150 mm).
Self-compacting concrete (SCC) was considered in this study because SCC is relatively a new type of concrete and there are no research studies reported on the bond behavior between corrosion cracked SCC and NSM strips. The SCC was developed mainly to freely flow to any corner of the formwork without compaction. The SCC has higher compressive strength and lower stiffness than the normal vibrated concrete (Okamura et al., 2003).
Experimental work
Testing program
The testing program is composed of thirty-two concrete specimens. Each specimen consists of two concrete blocks (reinforced and plain). Each concrete block has dimensions of 150 × 150 × 200 mm. The two concrete blocks are mounted with NSM strips at the two opposite sides. The RC block is reinforced with four steel bars with diameter of 12 mm and two stirrups with diameter of 6 mm as shown in Figure 1. Twenty-four specimens were immersed in 3% NaCl solution and exposed to accelerated corrosion process. While eight specimens were kept in water bath at laboratory temperature of 25ₒC as reference (uncorroded) specimens. The testing program investigated is shown in Table 1.
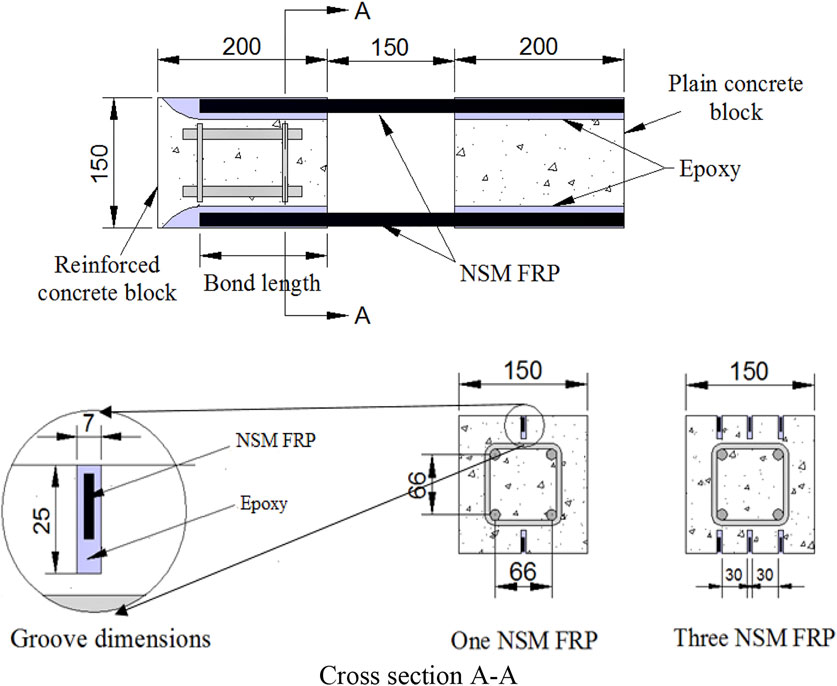
FIGURE 1. Schematics of specimens mounted with NSM (dimensions are in mm).
TABLE 1. Testing program adopted in the study.
Concrete mixing and casting
The SCC mixture was prepared at w/c ratio of 0.45 using Type I cement, crushed limestone coarse aggregate, crushed limestone fine aggregate, silica sand, and high-performance superplasticizer. The coarse aggregate has a maximum aggregate size of 12 mm, bulk specific gravity of 2.61 and absorption of 2.2%. The fine aggregate has a bulk specific gravity of 2.63, absorption of 1.9% and fineness modulus of 2.68. The SCC mixture possesses a compressive strength of 47 MPa and splitting strength of 3.4 MPa after 28 days of moist curing. Table 2 shows the proportions of the SCC mixture.
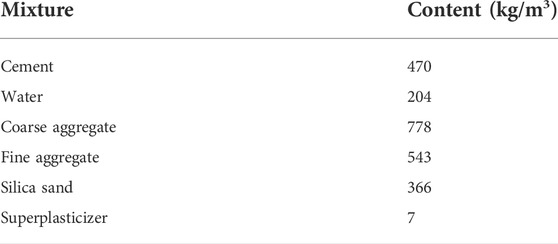
TABLE 2. Proportions of the SCC mixture.
A tilting drum mixer with a capacity of 0.1 m3 was used for mixing the SCC. Twelve concrete blocks (150 × 150 × 200 mm) and six cylinders (100 × 200 mm) were casted from each SCC batch. The SCC mixing procedure was as follows. The inside surface of the mixer was wetted with little amount of water. The coarse aggregate was added and followed by some amount of water with continuous mixing. The cement, fine aggregate, silica sand and water were added gradually and alternatively. Finally, the superplasticizer was added to achieve flowing concrete. After 3 minutes of blending the ingredients, the cohesive SCC was ready for casting in the molds (Figure 2A). The fresh SCC properties including slump flow, V-funnel and L-Box were conducted and found to be 710 mm, 11 s, and 0.9. The fresh concrete was casted into the molds (Figure 2C) without vibration. The casted concrete specimens were covered with wet burlap for 1 day then transferred to a water tank for another 27 days curing (Figure 2D).
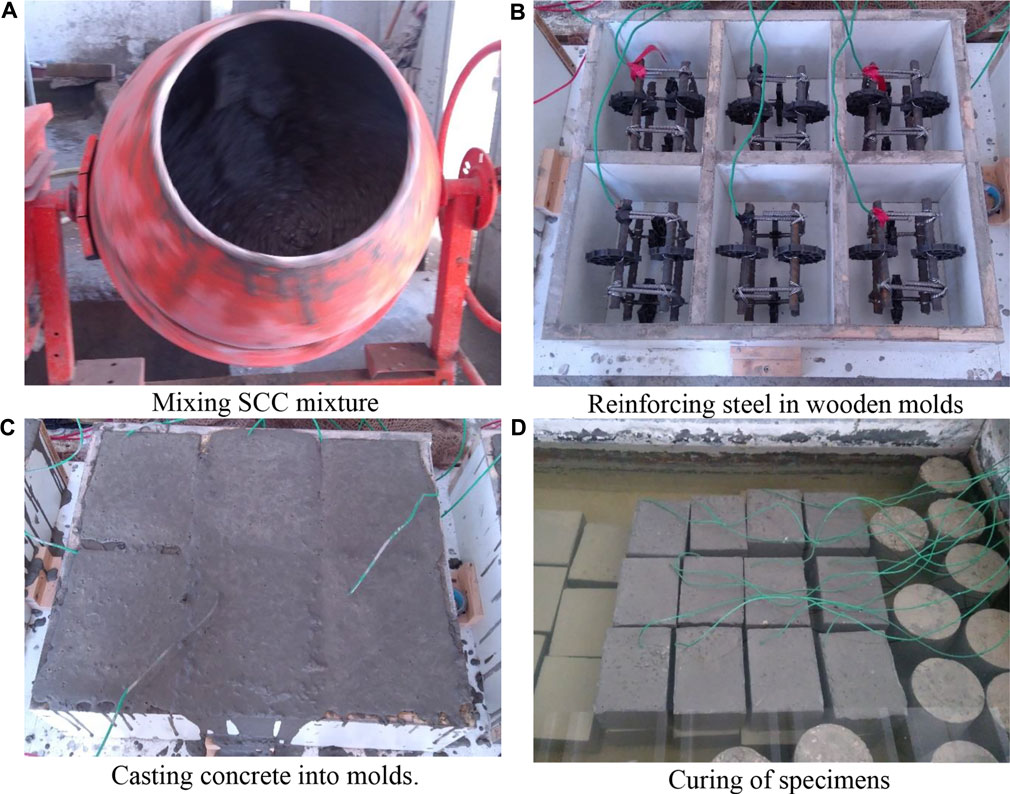
FIGURE 2. Mixing, casting and curing of concrete specimens. (A) Mixing SCC mixture. (B) Reinforcing steel in wooden molds. (C) Casting concrete into molds. (D) Curing of specimens.
NSM strips
The NSM strips were Sika CarboDur S1.525 having a width of 15 mm and a thickness of 2.5 mm. The NSM strips were embedded into slit in the concrete cover (7 mm in width and 25 mm in depth) and bonded with epoxy. The spacing between the slits for the three NSM strips was 30 mm. The mechanical properties of the NSM strips as supplied from the manufacturer were, longitudinal elastic modulus of 160 GPa and longitudinal tensile strength of 2,800 MPa. The adhesive epoxy was Sikadur-30. The mechanical properties of the epoxy as supplied from the manufacturer were: compressive strength of 85 MPa, tensile strength of 17 MPa, shear strength of 7 MPa, and elastic modulus of 10 GPa.
The NSM strips were installed on the SCC specimens using the following procedure (Al-Akhras and Aleghnimat, 2020). The concrete cover was cut into grooves using concrete saw (Figure 3A). The groove length of the plain concrete block was 200 mm and that for the RC block was 100 or 150 mm (Al-Akhras and Mashaqbeh, 2020). The NSM strips were cut into two lengths of 450 and 500 mm for bond lengths of 100 and 150 mm using an electric saw (Triantafyllou et al., 2018). The grooves’ surface was cleaned using brush, vacuum and isopropanol (Figure 3B). (Al-Allaf et al., 2016) The epoxy adhesive was prepared by mixing quantities of parts A and B with ratio of 3:1 using electric mixer. The quantities were mixed for about 3 minutes until the mixture becomes uniform and light brown in color (Figure 3D). (Bilotta et al., 2011) The concrete grooves were filled with epoxy using a trowel and the FRP strips (without surface pretreatment) were pressed firmly into the epoxy of the grooves (Coelho et al., 2015). The grooves’ surface was squeezed and smoothed using a trowel to expel the air and to provide smooth and clean surface.
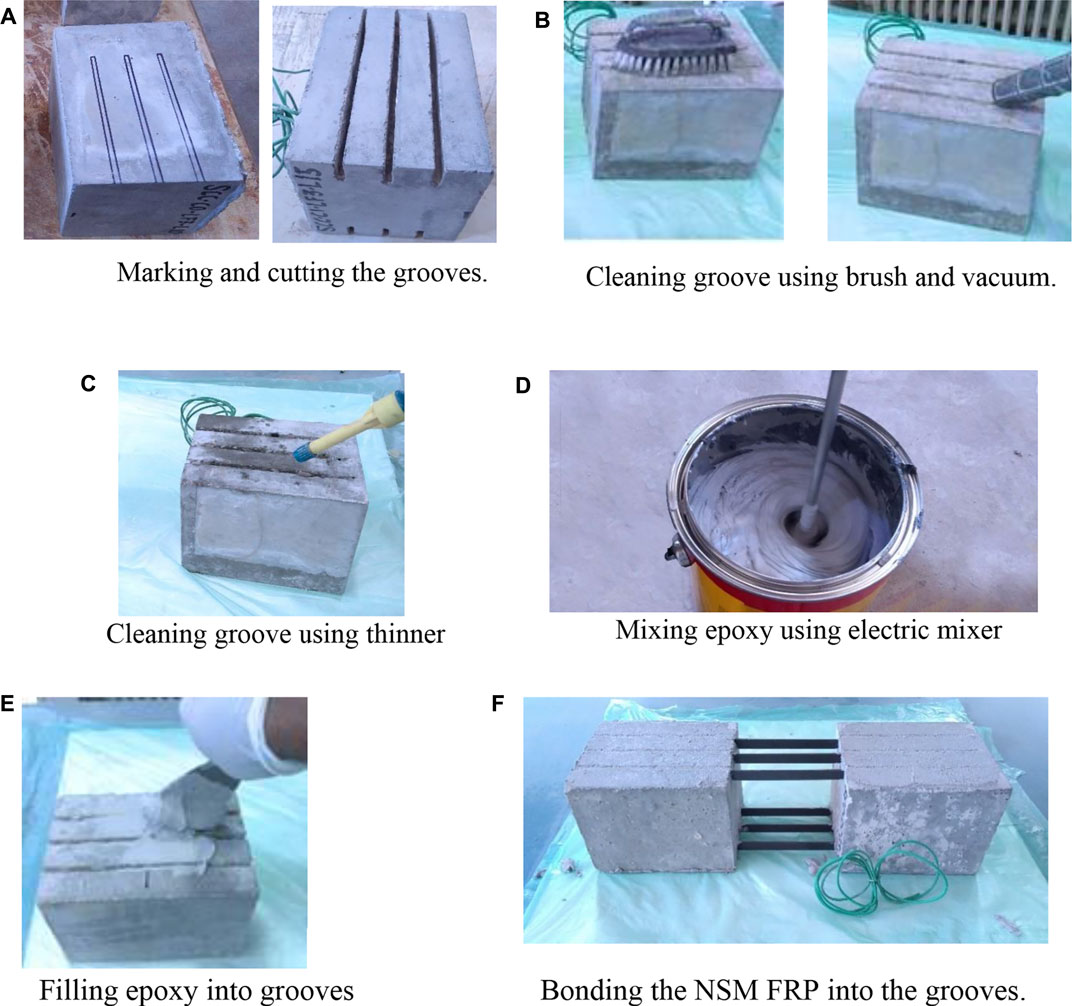
FIGURE 3. Installation of the FRP strips. (A) Marking and cutting the grooves. (B) Cleaning groove using brush and vacuum. (C) Cleaning groove using thinner. (D) Mixing epoxy using electric mixer. (E) Filling epoxy into grooves. (F) Bonding the NSM FRP into the grooves.
Accelerated corrosion process
Twenty-four specimens (RC and plain concrete blocks) were immersed in a circular plastic tank (600 by 1,200 mm) containing 3% NaCl solution for the accelerated corrosion process. The reinforcing steel were connected on parallel to the positive pole of the power supply to act as the anode. The negative pole was connected to rectangular steel plate (cathode) immersed in the tank (Figure 4). Each specimen was exposed to an electrical current of 0.15 A and 12 V for time-periods of 5 (Lee et al., 2000; Mukhopadhyaya and Swamy, 2001; Nguyen et al., 2001; Okamura et al., 2003; Kreit et al., 2011; Lorenzis and Nanni, 2015; Mosallam et al., 2022), days for the first, second and third level of corrosion, respectively. The electrical current values were chosen based on previous work of Al-Akhras and Mashaqbeh (2020) and Al-Akhras and Aleghnimat (2020).
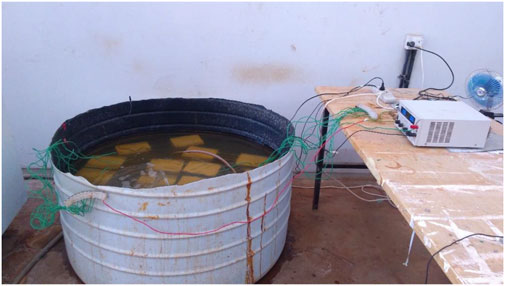
FIGURE 4. Accelerated corrosion process using power supply.
Pullout test
The specimens were removed from the corrosion tank, dried with a cloth to become saturated surface dry and subjected to pullout test using universal testing machine with capacity of 600 kN. The two concrete blocks (plain and reinforced) were pulled from each other using steel fasteners at rate of 0.44 mm/min until failure of the bond of NSM strips. Linear variable differential transducers (LVDT) were placed at each bonded side to measure the slip. The load and displacement measurements were collected using data acquisition system connected to computer. Figure 5 illustrates the pullout test.
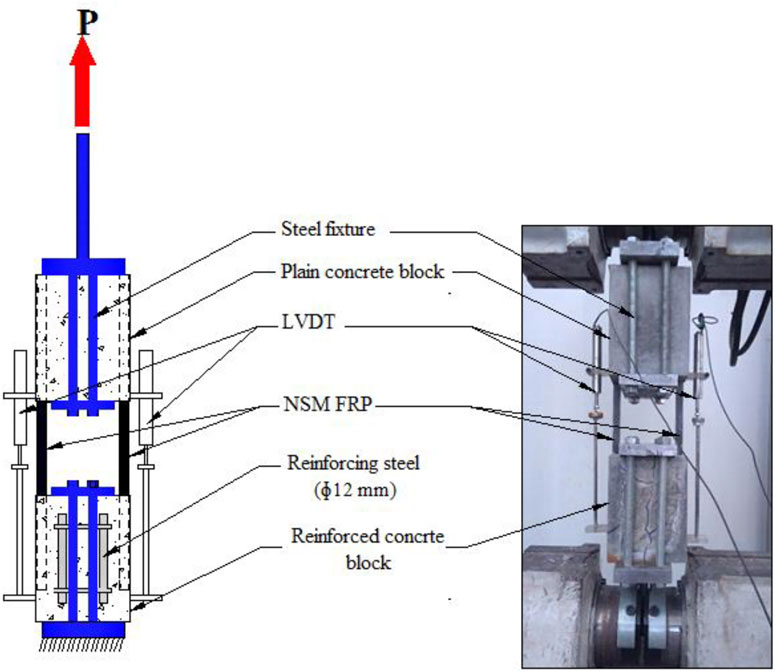
FIGURE 5. Test setup of the double pullout test.
Test result and discussion
Crack pattern
The corrosion crack pattern was monitored for different corrosion levels as shown in Figure 6. The corrosion crack pattern varied with different corrosion level. The number of corrosion cracks increased with the increase of corrosion level. Two small corrosion cracks were observed after the first corrosion level. However, six corrosion cracks were detected for the second corrosion level. Moreover, a network of 10 corrosion cracks was noticed at the third corrosion level.
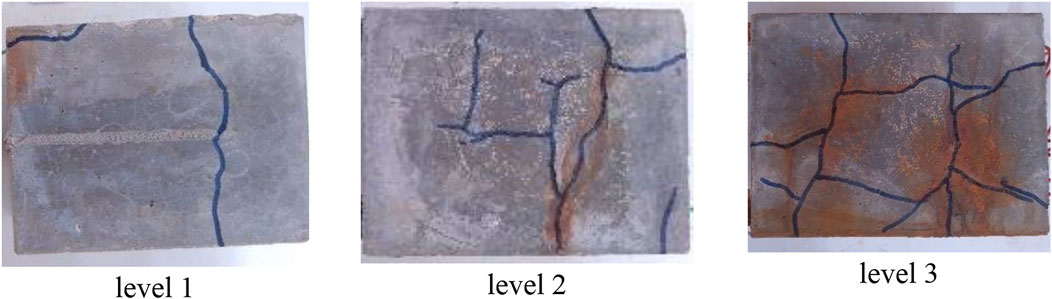
FIGURE 6. Typical crack paterns for different corrosion levels.
Crack width and mass loss
The crack width of the corrosion cracks and mass loss of reinforcing steel were evaluated for different corrosion levels. The crack width was measured using an optical microscope with an accuracy of 0.005 mm. Table 3 shows the maximum crack width and steel mass loss for different corrosion levels. The maximum crack width was increased from an average of 0.25 mm for corrosion level 1 to an average of 0.88 mm for corrosion level 3. Additionally, the mass loss was increased with corrosion level from an average of 2.2% for corrosion level 1 to an average of 8.1% for corrosion level 3.
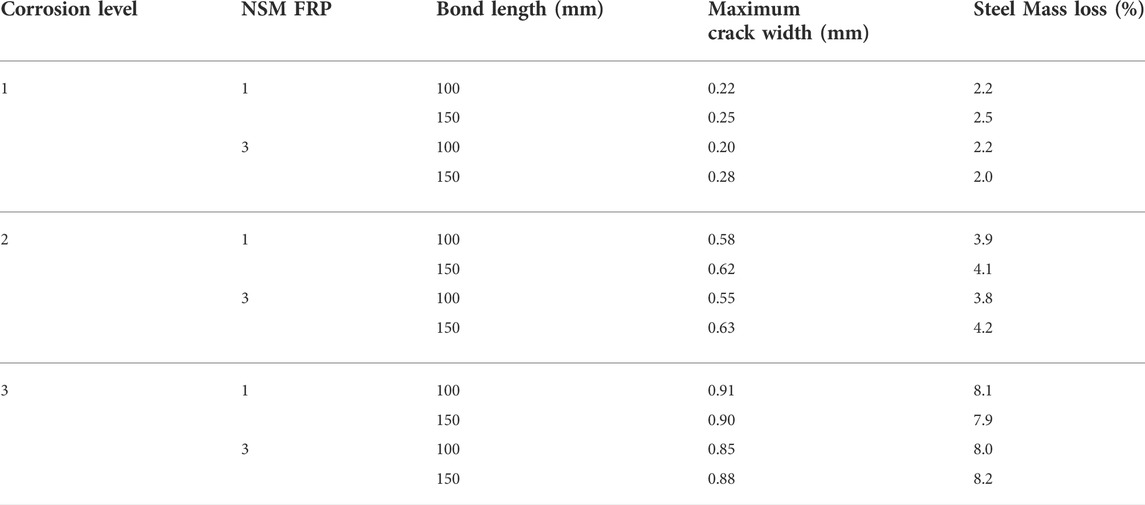
TABLE 3. Maximum crack width and steel mass loss.
Effect of corrosion level on bond behavior
Figures 7–10 depict the effect of corrosion on the bond behavior between NSM strips and concrete. The bond stress was determined based on the average of two specimens using MS Excel. The scatter of the data was small with coefficient of variation of less than 2%. The bond-slip behavior followed similar behavior that consists of linear trend in the beginning then nonlinear behavior up to failure. The post peak behavior did not appear because the epoxy bonding is brittle material that failed suddenly after reaching the ultimate stage.
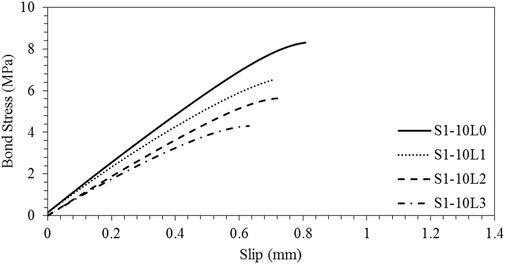
FIGURE 7. Relation between bond stress and slip for S1 strip and bond length of 100 mm.
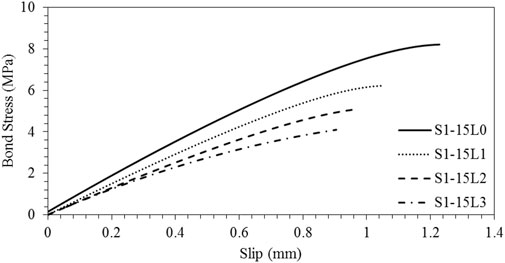
FIGURE 8. Relation between bond stress and slip for S1 strip and bond length of 150 mm.
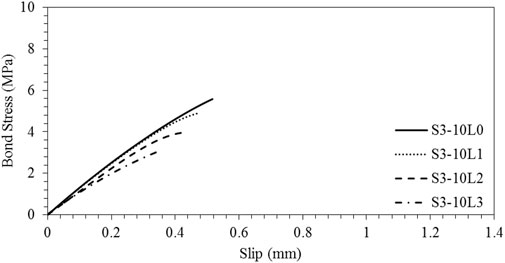
FIGURE 9. Relation between bond stress and slip for S3 strip and bond length of 100 mm.
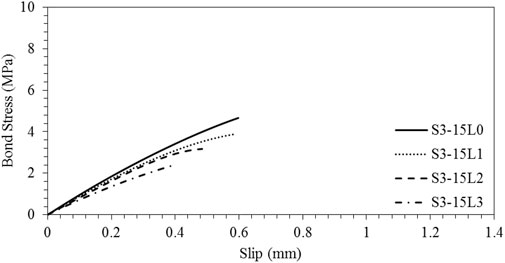
FIGURE 10. Relation between bond stress and slip for S3 strip and bond length of 150 mm.
The results indicated that the bond strength and maximum slip decreased with increasing the corrosion level. This behavior is due to the fact that the corrosion of reinforcing steel cause significant deterioration in the concrete that degrade the bond between the NSM and concrete.
Table 4 provides the bond characteristics (bond strength, maximum slip, toughness and stiffness) of the NSM strips. The bond strength is determined from the maximum stress of the stress-slip curve. The maximum slip is determined from the maximum slip of the stress-slip curve. The toughness is defined as the total area under the stress-slip curve. The stiffness is defined as the slope of the initial line of the stress-slip curve.
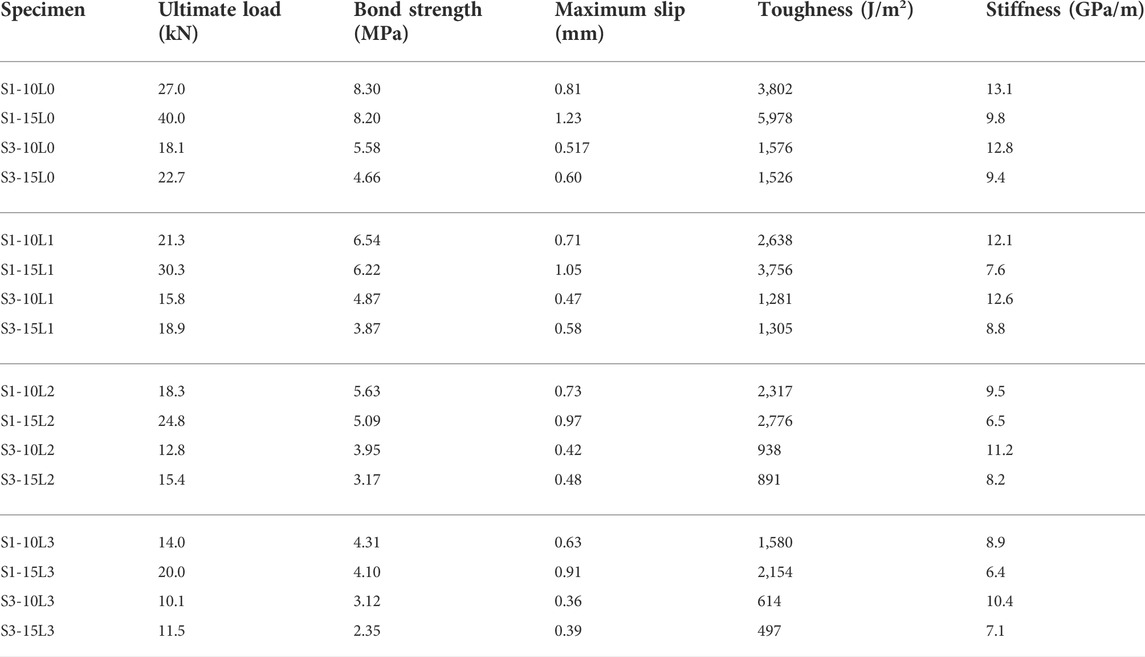
TABLE 4. Bond characteristics for one NSM strip.
The bond characteristics decreased significantly with the increase of the corrosion level. The ultimate load and maximum slip of the one NSM strip at bond length of 100 mm were decreased from (27 kN and 0.81 mm) for uncorroded specimens to (14 kN and 0.63 mm) for corroded specimens at corrosion level 3. The percent reduction in the ultimate load and maximum slip were 48 and 22%.
The toughness and stiffness for one NSM strip with 100 mm bond length were also decreased from (3802 J/m2 and 13.1 GPa/m) for uncorroded NSM strips to (1580 J/m2 and 8.9 GPa/m) for corroded NSM strips at corrosion level 3. The percent reduction in the toughness and stiffness were 58 and 32%.
The bond characteristics were increased with the increase of the bond length from 100 to 150 mm. The ultimate load and maximum slip at corrosion level 2 were increased from (18.3 kN and 0.73 mm) for bond length of 100 mm to (24.8 kN and 0.97 mm) for bond length of 150 mm. The toughness at corrosion level 3 was increased from (1580 J/m2) for bond length of 100 mm to (2154 J/m2) for bond length of 150 mm.
The bond stress for NSM strips with length of 100 mm is observed higher than that for NSM with length of 150 mm. However, the pullout load for NSM strips with length of 100 mm is lower than that for NSM with length of 150 mm. This behavior is explained as follows. The bond stress is determined by dividing the pullout load by the area of the NSM strip. The area of the NSM strip increases with the increase of the NSM bond length. Therefore, the bond stress decreased as the bond length increased (Figure 11).
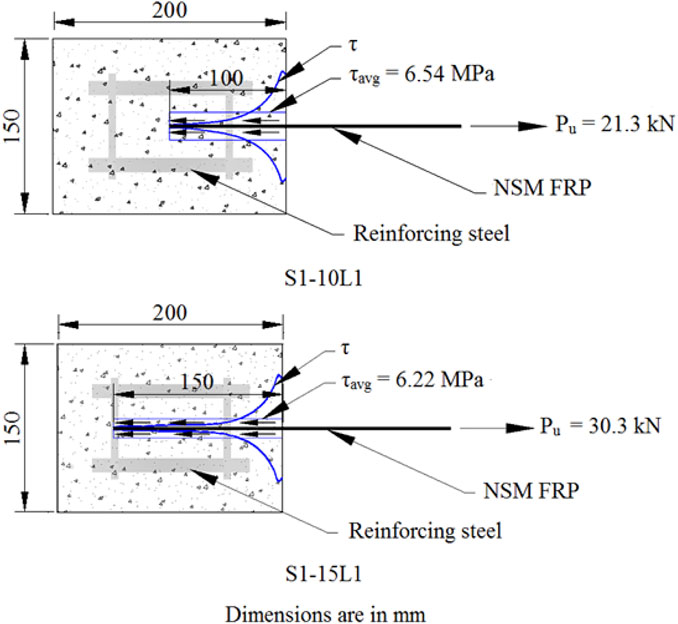
FIGURE 11. Schematics of the stress distribution for S1-15L1.
The slip of the 150 mm NSM strips was higher compared to that of the 100 mm strips. This behavior is attributed to the fact that as the bond length of the NSM increase, the length exposed to slip increases and consequently the slip increase.
The ultimate load and maximum slip for one NSM strips (S1) were higher compared to those for 1 strip of three adjacent NSM strips (S3). This behavior may be explained because the overlapped area between the three adjacent NSM strips cause stress concentration on each NSM strip. Therefore, causing premature failure of the three adjacent NSM strips prior to reaching the maximum capacity of the bond strength (Figure 12).
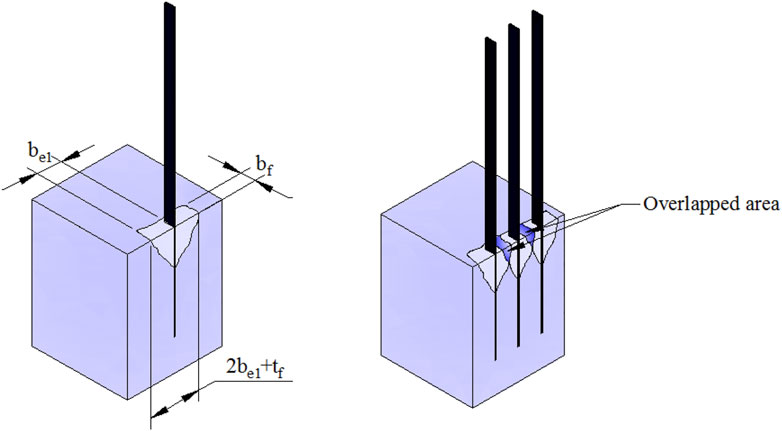
FIGURE 12. Failure mode of one and three NSM strips (After Seo et al., 2013)
The residual values of the bond characteristics are introduced and defined as follows:
Where, R is residual bond characteristic (ultimate bond strength, maximum slip, toughness or stiffness);
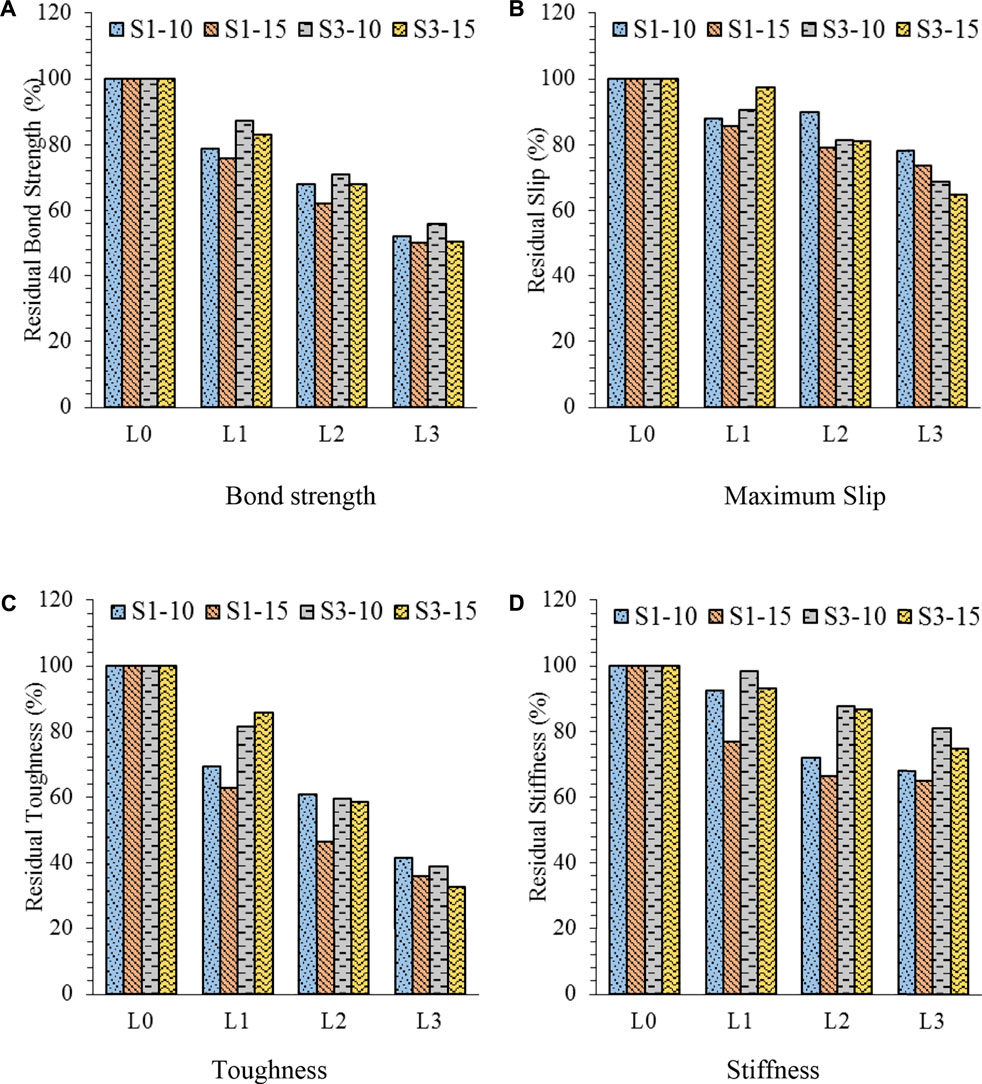
FIGURE 13. Residual bond characteristics for different corrosion levels. (A) Bond strength. (B) Maximum Slip. (C) Toughness. (D) Stiffness.
The residual bond characteristics decreased with corrosion level. The minimum residual bond characteristics (strength, slip, toughness and stiffness) were observed for one NSM strip (S1) at corrosion level 3. The minimum residual strength, slip, toughness and stiffness for one NSM strip with bond length of 100 and 150 mm at corrosion level 3 were (52, 78, 42 and 68%) and (50, 74, 36 and 65%), respectively. The corresponding minimum residual values for 1 strip of the three NSM strips at bond length of 100 and 150 mm at corrosion level 3 were (56, 69, 39% 81%) and (50, 65, 33% 75%), respectively.
Failure mode
The failure mode of the bond between NSM and concrete was splitting of concrete as shown in Figure 14. This behavior is explained by the fact that the tensile strength of the epoxy bond (17 MPa) is significantly higher than the splitting strength of the concrete (3.4 MPa). Therefore, the concrete failed and split before the epoxy bond failed. Small concrete fractures of the split concrete remained attached to the NSM strips after failure. These concrete fractures increased in size with the increase of corrosion level. Large parts of split concrete remained attached to the NSM strips after failure at corrosion level 3. This behavior is due to the fact that corrosion cracks significantly weakened the concrete.
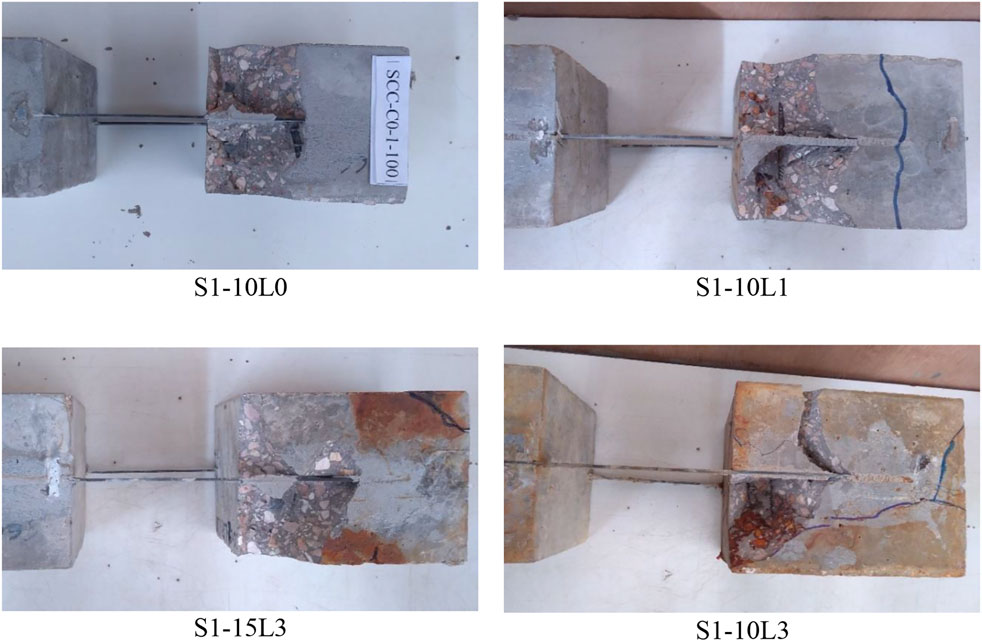
FIGURE 14. Failure mode of the NSM bond with concrete.
Theoretical models
Theoretical models for the effect of corrosion cracks of concrete on the bond strength of NSM were developed using the following procedure (Al-Akhras and Aleghnimat, 2020). Models of the bond between NSM strips and intact concrete were developed (Al-Akhras and Mashaqbeh, 2020). Reduction factors for the effect of corrosion cracks on the bond between NSM strips and concrete were proposed based on corrosion crack width and steel mass loss (Triantafyllou et al., 2018). The bond strengths between NSM and corrosion cracked concrete were determined by multiplying the bond strength between NSM and intact concrete by the reduction factor (Al-Allaf et al., 2016). The theoretical bond strength were compared and validated with the experimental ones.
The bond strengths between NSM strips and intact concrete are modelled using the following equations based on (Seo et al. 2011):
Where;
Where; he is length of failed concrete. Based on observations of the experimental results, the effective width (be1) is found approximately equal to he. The theoretical bond strengths were determined and presented in Table 5 along with the experimental bond strengths. Excellent agreement is observed between the theoretical and experimental bond strengths with maximum difference of 4.8%.
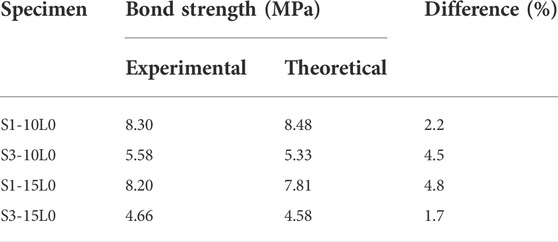
TABLE 5. Theoretical and experimental bond strengths between NSM and intact concrete.
Correlation models between the residual bond strength of NSM and (steel mass loss and maximum crack width) were developed. Quadratic equation models were considered since they showed the best fit compared to other models. The correlation models showed excellent fit between the residual bond strength and steel mass loss with R-square of 0.94 and between residual bond strength and maximum crack width with R-square of 0.95 as shown in Figures 15, 16.
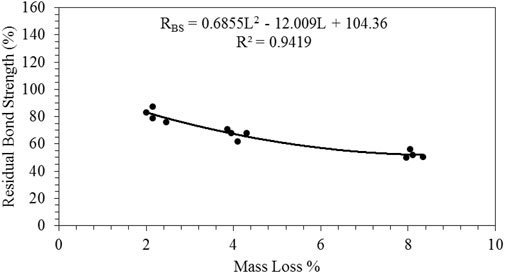
FIGURE 15. Correlation model between residual bond strength (RBS) and mass loss (L).
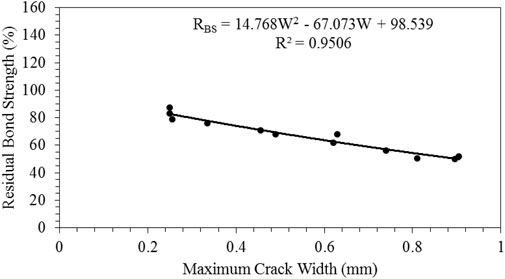
FIGURE 16. Correlation model between residual bond strength (RBS) and crack width (W).
The bond strengths between NSM strips and corroded cracked concrete was evaluated using the following equation:
Where;
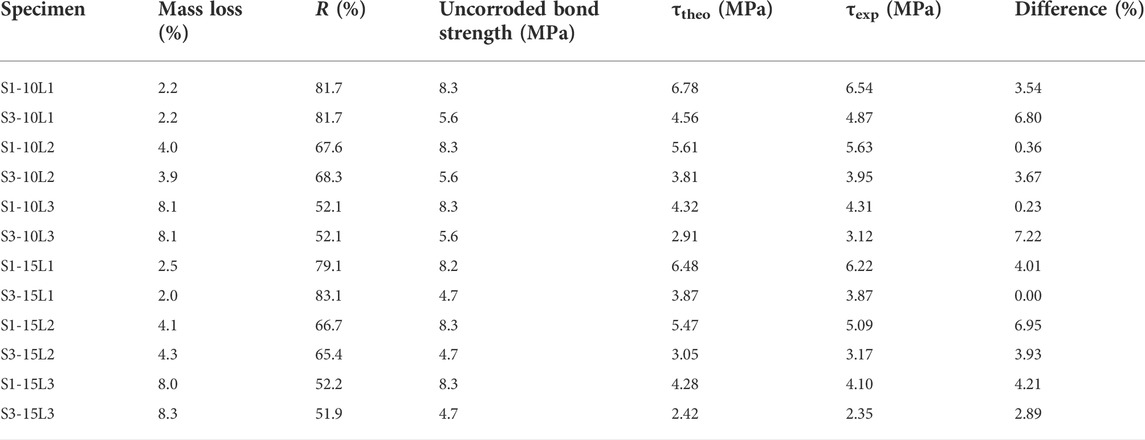
TABLE 6. Validation of the proposed model based on steel mass loss.
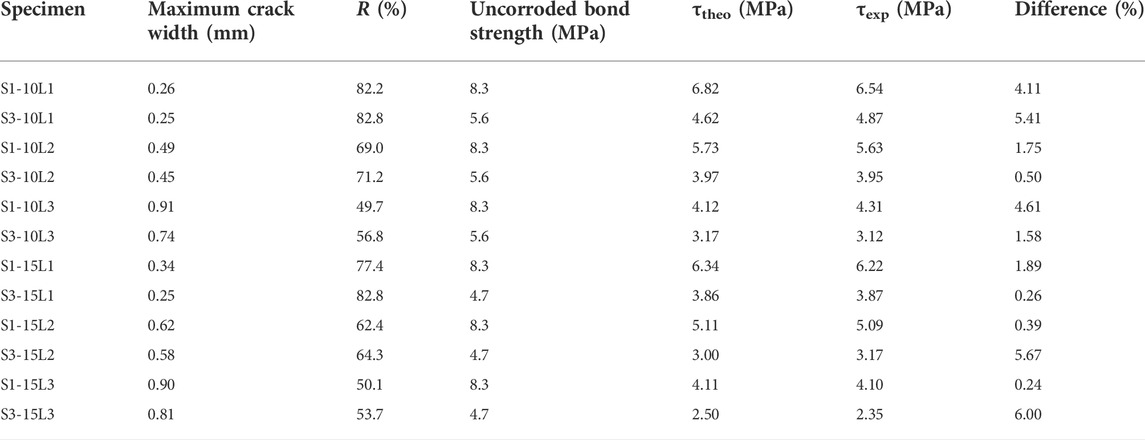
TABLE 7. Validation of the proposed model based on maximum crack width.
Excellent agreement is observed between the theoretical and experimental bond strengths between NSM strips and corrosion cracked concrete with maximum difference of 7.4%.
The proposed models were also validated with the experimental results from the literature (Haddad and Al-Dalou, 2018) who investigated the bond behavior between CFRP laminates and corrosion cracked normal vibrated concrete. The validation of the proposed models with experimental results from the literature based on steel mass loss and crack width are tabulated in Tables 8, 9. Excellent agreement is observed between the proposed model and experimental results based on steel mass loss with difference of 15%. Only two specimens showed a difference of 24%.
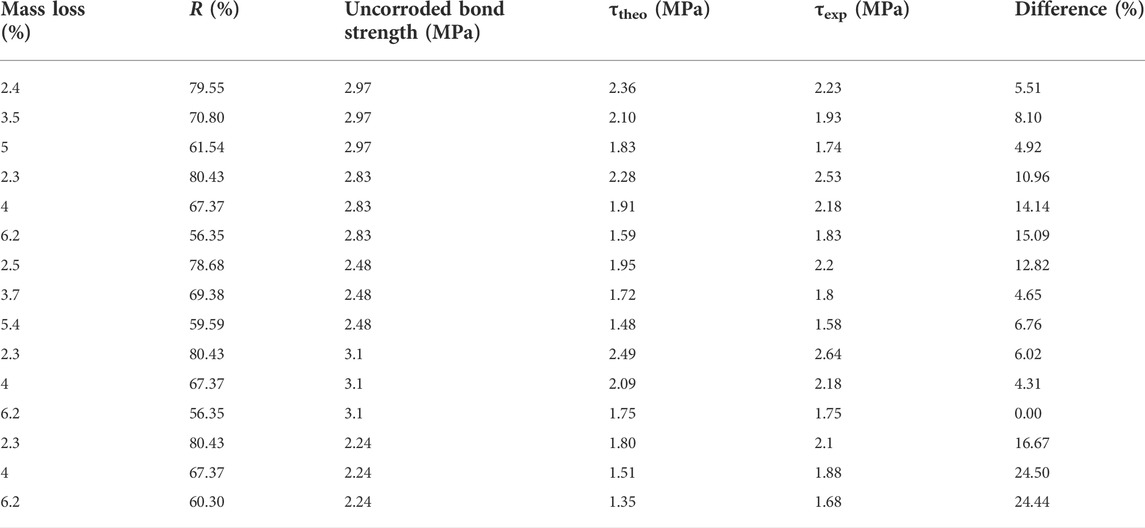
TABLE 8. Validation of the proposed model with Haddad and Al-Dalou (2018) based on steel mass loss.
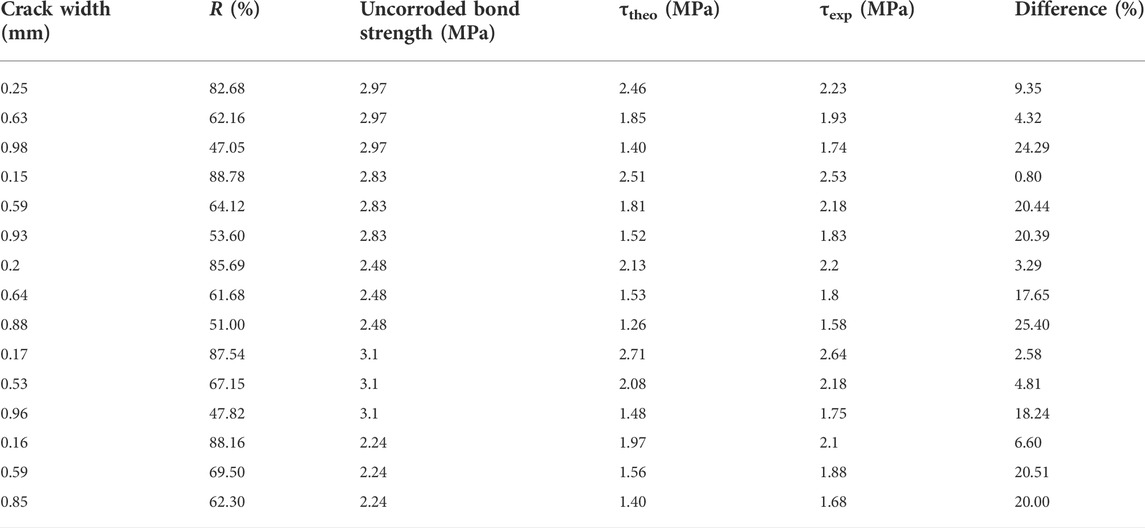
TABLE 9. Validation of the proposed model with Haddad and Al-Dalou (2018) based on maximum crack width.
Also, very good agreement is observed between the proposed models and literature based on crack width with maximum difference of 25%. Although, the work of Haddad and Al-Dalou (2018) was different from the current study where they investigated the bond behavior between CFRP laminate and normal vibrated concrete.
Conclusion
Little information is reported in the literature on the bond behavior between NSM strips and corrosion cracked SCC. Therefore, this study fills the gap in literature on that subject. Based on the results of the study, the following conclusion are drawn:
1) The crack pattern of the corroded specimens varied with different corrosion levels. The number and width of corrosion cracks increased with the increase of corrosion level. The maximum crack width was 0.91 mm at corrosion level 3. The reinforcing steel mass loss increased from 2.1% for corrosion level 1–8.3% for corrosion level 3.
2) The bond strength characteristics between NSM strips and corrosion cracked concrete showed progressive degradation with corrosion level. The minimum residuals of bond strength, maximum slip, toughness and stiffness reached 52, 69, 33 and 65% at corrosion level 3.
3) The pullout load of NSM strips with bond length of 150 mm was higher than that of NSM strips with bond length of 100 mm. The ultimate load and maximum slip for one single NSM strip were observed higher compared to those for one NSM strip of three adjacent NSM strips.
4) The failure mode of the bond between NSM and corrosion cracked concrete was splitting of concrete. Small concrete fractures were remained attached to the NSM strips after failure. These concrete fractures increased in size with the increase of corrosion level.
5) Theoretical models were proposed for predicting the bond strength between NSM strips and corrosion cracked concrete based on crack width and steel mass loss. The proposed models showed good agreement with the experimental results obtained from the current study and from the literature.
Data availability statement
The raw data supporting the conclusion of this article will be made available by the authors, without undue reservation.
Author contributions
NA-A supervise the experimental program that was conducted for the paper and revise thoroughly the draft of the paper OO, write the initial draft of the paper.
Funding
The authors acknowledge the financial support received from the Deanship of Scientific Research at Jordan University of Science and Technology (Grant 367/2017).
Conflict of interest
The authors declare that the research was conducted in the absence of any commercial or financial relationships that could be construed as a potential conflict of interest.
Publisher’s note
All claims expressed in this article are solely those of the authors and do not necessarily represent those of their affiliated organizations, or those of the publisher, the editors and the reviewers. Any product that may be evaluated in this article, or claim that may be made by its manufacturer, is not guaranteed or endorsed by the publisher.
References
Al-Akhras, N., and Aleghnimat, R. (2020). Evaluating corrosion deterioration in self-compacted reinforced concrete beams and prisms using different tests. Constr. Build. Mat. 256, 119347. doi:10.1016/j.conbuildmat.2020.119347
Al-Akhras, N. M., and Mashaqbeh, Y. (2020). Potential use of Eucalyptus leaves as green corrosion inhibitor of steel reinforcement” journal of building engineer. Elsevier 35, 101848. doi:10.1016/j.jobe.2020.101848
Al-Allaf, M., Weekes, L., Augusthus-Nelson, L., and Leach, P. (2016). An experimental investigation into the bond-slip behavior between CFRP composite and lightweight concrete. Constr. Build. Mater. 113, 15–27. doi:10.1016/j.conbuildmat.2016.03.032
Bilotta, A., Ceroni, F., Di Ludovico, M., Nigro, E., Pecce, M., and Manfredi, G. (2011). Bond efficiency of EBR and NSM FRP systems for strengthening concrete members. J. Compos. Constr. 15 (5), 757–772. doi:10.1061/(asce)cc.1943-5614.0000204
Coelho, M. R. F., Sena-Cruz, J. M., and Neves, L. A. C. (2015). A review on the bond behavior of FRP NSM systems in concrete. Constr. Build. Mater. 93, 1157–1169. doi:10.1016/j.conbuildmat.2015.05.010
Dias, S. J. E., and Barros, J. A. O. (2012). NSM shear strengthening technique with CFRP laminates applied in high-strength concrete beams with or without pre-cracking. Compos. Part B Eng. 43 (2), 290–301. doi:10.1016/j.compositesb.2011.09.006
Fernandes, P., Sena-Cruz, J., Xavier, J., Silva, P., Pereira, E., and Cruz, J. (2018). Durability of bond in NSM CFRP-concrete systems under different environmental conditions. Compos. Part B Eng. 138, 19–34. doi:10.1016/j.compositesb.2017.11.022
Haddad, R., and Al-Dalou, A. (2018). Experimental study on bond behavior between corrosion-cracked reinforced concrete and CFRP sheets” Journal of Adhesion Science and Technology. Taylor Francis 32 (6), 590–608. doi:10.1080/01694243.2017.1371912
Kreit, A., Al-Mahmoud, F., Castel, A., and François, R. (2011). Repairing corroded RC beam with Near-Surface Mounted CFRP rods. Mat. Struct. 44 (7), 1205–1217. doi:10.1617/s11527-010-9693-6
Lee, C., Bonacci, J., Thomas, M., Maalej, M., Khajehpour, S., Hearn, N., et al. (2000). Accelerated corrosion and repair of reinforced concrete columns using carbon fibre reinforced polymer sheets. Can. J. Civ. Eng. 27 (5), 941–948. doi:10.1139/l00-030
Lorenzis, L., and Nanni, A. (2015). Strengthening of reinforced concrete structures with near surface mounted FRP rods. ACI Struct. J. 1948 (5), 1–8.
Mosallam, A. S., Ghabban, N., Mirnateghi, E., and Agwa, A. A. K. (2022). Nonlinear numerical simulation and experimental verification of bondline strength of CFRP strips embedded in concrete for NSM strengthening applications. Struct. Concr. 23, 1794–1815. doi:10.1002/suco.202100537
Mukhopadhyaya, P., and Swamy, N. (2001). Interface shear stress: A new design criterion for plate debonding. J. Compos. Constr. 5 (1), 35–43. doi:10.1061/(asce)1090-0268(2001)5:1(35)
Nguyen, D., Chan, D., and Cheong, H. (2001). Brittle failure and bond development length of CFRP-concrete beams. J. Compos. Constr. 5 (1), 12–17. doi:10.1061/(asce)1090-0268(2001)5:1(12)
Okamura, H., Ouchi, M., Schutter, G., Bartos, P., Domone, P., Gibbs, J., et al. (2003). Self-compacting concrete. J. Adv. Concr. Technol. 1 (1), 5–15. doi:10.3151/jact.1.5
Peng, H., Hao, H., Zhang, J., Liu, Y., and Cai, C. S. (2015). Experimental investigation of the bond behavior of the interface between near-surface-mounted CFRP strips and concrete. Constr. Build. Mater. 96, 11–19. doi:10.1016/j.conbuildmat.2015.07.156
Seo, S.-Y., Yoon, S.-J., Kwon, Y.-S., and Choi, K.-B. (2011). Bond behavior between near-surface-mounted fiber reinforced polymer plates and concrete in structural strengthening. J. Korea Concr. Inst. 23 (5), 675–682. doi:10.4334/jkci.2011.23.5.675
Seo, S. Y., Feo, L., and Hui, D. (2013). Bond strength of near surface-mounted FRP plate for retrofit of concrete structures. Compos. Struct. 95, 719–727. doi:10.1016/j.compstruct.2012.08.038
Keywords: concrete, corrosion, bond, CFRP composite, double pullout
Citation: Al-Akhras N and Othman O (2022) Bond behavior of NSM strips in corroded/cracked reinforced concrete. Front. Built Environ. 8:966351. doi: 10.3389/fbuil.2022.966351
Received: 10 June 2022; Accepted: 26 July 2022;
Published: 04 October 2022.
Edited by:
Yasmin Murad, The University of Jordan, JordanReviewed by:
Ayman S. Mosallam, University of California, Irvine, United StatesFaris Matalkah, Yarmouk University, Jordan
Copyright © 2022 Al-Akhras and Othman. This is an open-access article distributed under the terms of the Creative Commons Attribution License (CC BY). The use, distribution or reproduction in other forums is permitted, provided the original author(s) and the copyright owner(s) are credited and that the original publication in this journal is cited, in accordance with accepted academic practice. No use, distribution or reproduction is permitted which does not comply with these terms.
*Correspondence: Nabil Al-Akhras, YWxha2hyYXNAanVzdC5lZHUuam8=