- 1Environmental Health, Harvard T. H. Chan School of Public Health, Boston, MA, United States
- 2Center for Precision Health, School of Biomedical Informatics, The University of Texas Health Science Center at Houston, Houston, TX, United States
- 3Department of Computer Science and Engineering, Brainware University, Kolkata, India
- 4Department of Computer Science and Engineering, Aliah University, Kolkata, India
- 5School of Information Technology, Maulana Abul Kalam Azad University of Technology, Haringhata, India
- 6Human Genetics Center, School of Public Health, The University of Texas Health Science Center at Houston, Houston, TX, United States
Introduction: Association rule mining (ARM) is a powerful tool for exploring the informative relationships among multiple items (genes) in any dataset. The main problem of ARM is that it generates many rules containing different rule-informative values, which becomes a challenge for the user to choose the effective rules. In addition, few works have been performed on the integration of multiple biological datasets and variable cutoff values in ARM.
Methods: To solve all these problems, in this article, we developed a novel framework MOOVARM (multi-objective optimized variable cutoff-based association rule mining) for multi-omics profiles.
Results: In this regard, we identified the positive ideal solution (PIS), which maximized the profit and minimized the loss, and negative ideal solution (NIS), which minimized the profit and maximized the loss for all gene sets (item sets), belonging to each extracted rule. Thereafter, we computed the distance (d +) from PIS and distance (d −) from NIS for each gene set or product. These two distances played an important role in determining the optimized associations among various pairs of genes in the multi-omics dataset. We then globally estimated the relative closeness to PIS for ranking the gene sets. When the relative closeness score of the rule is greater than or equal to the pre-defined threshold value, the rule can be considered a final resultant rule. Moreover, MOOVARM evaluated the relative score of the rule based on the status of all genes instead of individual genes.
Conclusions: MOOVARM produced the final rank of the extracted (multi-objective optimized) rules of correlated genes which had better disease classification than the state-of-the-art algorithms on gene signature identification.
1 Introduction
A microarray (Bandyopadhyay et al., 2014; Bandyopadhyay and Mallik, 2016) has been widely used to measure a large number of genes for determining differences between two groups (e.g., cases versus control samples), including gene expression profile, methylation, and genotype-based association studies. Methylation of cytosine (Navarro et al., 2012) changes the structure of DNA by introducing a methyl group (−CH3) at the carbon5 position of cytosine without altering the underlying DNA sequences. Methylation changes the gene expression, which pathologically leads to cancer. In general, methylation decreases the gene expression level. At present, the association rule mining (ARM) method plays a vital role in generating the significant relationships between two genes (items) in the research field of bioinformatics and biomedical sciences (Mallik, 2013). The rule representing the format is as follows: {G1+, G2−, G4+ ⇒ G3−, G5+ }, where G1, G2, and G4 are the cause variables (antecedent) and G3 and G5 are effective variables (consequent). Of note, here, “+” symbolizes upregulation and “−” denotes downregulation. The aforementioned rule states that when the genes G1 is upregulated, G2 is downregulated, and G4 is upregulated concurrently, it is likely that G3 will be downregulated and G5 will be upregulated simultaneously. The support of a rule {A ⇒ B} (where A and B are items) is defined as the fraction of the number of transactions that contains A and B to the total number of transactions in the database, whereas the confidence of the rule is defined as the ratio of the support of the whole gene set (i.e., A and B) to the support of the antecedent/left-hand side (i.e., A). If the support of the gene set is higher than the user-defined minimum support, then the gene set is called frequent. A useful and fundamental association rule mining method, Apriori, was introduced by Agrawal et al. (1993) for identifying the association among the genes in the gene expression data or other similar kinds of data. Apriori and Eclat are the two benchmark algorithms used for mining the frequent item sets. The Apriori algorithm is introduced by Agrawal et al. (1993), while Eclat was developed by Zaki (2000) (Alves et al., 2010). The basic steps of the Apriori algorithm are as follows: i) obtaining the support (frequency) value for each individual item (feature), ii) filtering out non-frequent items by using a user-defined support threshold, iii) selecting frequent k-item sets (k = 1,2,×), iv) then converting all frequent item sets into association rules, and v) finally, estimating two more rule interestingness measures, viz., confidence and lift. However, the Eclat algorithm (Zaki, 2000) is somewhat different from Apriori (Agrawal et al., 1993). Apriori is basically a join-based algorithm, while Eclat is a tree-based algorithm. In other words, Apriori follows a breadth-first search (horizontal search), while Eclat follows a depth-first search (vertical search). Eclat is faster than Apriori. The Eclat algorithm requires only the support metric. Both the algorithms use static support and static confidence thresholds.
This basic ARM method has been updated and modified depending on the problem types to overcome various limitations by the researchers, such as Han et al. (2004), Creighton and Hanash (2003), Georgii et al. (2005), McIntosh and Chawla (2007), and Martinez et al. (2008). Those updated techniques help us manage the critical problems which arise in our daily life like medical diagnosis, marketing, and traveling. The genes of the gene sets have different types of priority. However, the basic rule mining algorithms treat all genes of the gene sets as belonging to the same class equivalence (quality). To overcome this challenge, the following researchers introduced weighted ARM methods for the classification of genes: Ramkumar (1998), Cai (1998), Wang (2000), Tao (2003), Yun and Leggett (2005), Tseng (2010), and Mallik et al. (2015). The weighted ARM methods were further modified and considered multiple weighted factors for solving transaction data-related problems (Liu et al., 1999; Su et al., 2008; Liu et al., 2011). Some clustering- and biclustering-based techniques were invented for studying gene expression data by Cheng and Church (2000), Pei (2003), Jiang et al. (2004), Madeira and Oliveira (2004), Thalamuthu et al. (2006), and Prelic et al. (2006). StatBicRM (Maulik et al., 2015), another classification analysis, was also developed for this reason, in which Bhasin and Raghava (2004), Paziewska et al. (2014), Martella (2009), Liu and Xu (2009), and Georgii et al. (2005) used a half-space concept for extracting quantitative association rules from numeric microarray datasets without using discretization. The limitation to this approach is that it was unable to find the complete set of significant rules from the microarray data. The GenMiner technique was proposed by Martinez et al. (2008) for finding association rules from a set of gene expression data and the online available terms that were linked to Gene Ontology (i.e., GO-terms). Bhadra et al. (2017), Mallik et al. (2013), and Bhadra et al. (2018) proposed a new concept where the cutoff (threshold) value was considered dynamical and altered for each gene set according to the quality/importance of the whole gene set rather than the quantification property. Some latest works are also based on the ARM/optimization method. Theilhaber et al. (2020) provided a tool in two-arm clinical studies. The methodology was based on the construction and optimization of a predictive multivariate gene signature that can predict the differential survival of patients undergoing anti-cancer therapies. Theilhaber et al. (2020) applied enhanced binary particle swarm optimization (EBPSO) in clinical transcriptomic cohorts to identify accurate, crisp, and significantly prognostic unique candidate signatures. The gene regulator within this signature yields biological insights into the relevant functions that were strongly correlated with their cancer type (Murphy et al., 2022). Nivedhitha et al. (2020) conducted survey research by categorizing different feature selection algorithms under supervised, unsupervised, and semi-supervised learning. This survey presented some latest tools of dimensionality reduction for tumor detection and also analyzed their performances and highlighted limitations and direction of future research to handle the high-dimension and less sample size data. On 2020, Ganguly and Mukherjee (2020) provided a modeling, simulation, and performance analysis study for an isolated hybrid power system (IHPS) which contained the solar thermal power plant, diesel engine generator (DEG), and wind turbine generator (WTG). To achieve better results for the studied IHPS model, authors applied the quasi-oppositional-based whale optimization algorithm and obtained better controller gain than other benchmark algorithms. In addition, there are some existing works of association rule mining which are based on fuzzy or rough theory (Sharmila and Vijayarani, 2019; Singh and Ganesh Wayal, 2012). However, the outcome rules are not good enough. Inclusion of the multi-objective optimization technique is an efficient step to improving the performance of association rule mining. After surveying the literature, we obtained some recently developed multi-objective optimization techniques that were presented by Mudi et al. (2019), Mudi et al. (2021a), Mudi et al. (2021b), Mudi et al., (2022), Ganguly et al. (2018), Ganguly et al. (2017), and Ganguly and Mukherjee (2020). In this article, we developed multi-objective optimized variable cutoff-based association rule mining (MOOVARM) for multi-omics profiles based on the minimum distance from the positive ideal solution (PIS) and that from the negative ideal solution (NIS). In this regard, we first identified (PIS) and (NIS) with respect to all gene sets. Therefore, we calculated the distance (d +) from PIS and distance (d −) from NIS for each product/item set. According to our proposed method, we calculated the relative closeness score value based on those two distances d + and d − for ranking the gene sets. If the relative closeness score of any rule was greater than or equal to the pre-defined cutoff value, the rule could be considered the final resultant rule. The proposed method calculated the relative closeness score globally instead of individual genes. Last, we made the ranking of the rules based on the relative score which had better disease classification performance than the state-of-the-art algorithms in disease diagnosis and therapeutic response.
2 Shortest distance-based cutoffs
The distance-based variable supports (denoted by DbVS) cutoff technique proposed by Mallik and Zhao (2017b) was introduced to obtain some attractive rules from multi-omics datasets by combining co-expression, co-methylation, and protein–protein interactions. The normalized combined correlation score was calculated by the integration of co-expression and co-methylation values (say CECMexm) between the expression and methylation profiles containing a specific number of genes which are both differentially expressed and methylated. Basically, CECMexm measures the similarity of expression and methylation patterns between the two genes. The expression/methylation data of all the diseased and control values are denoted by a gene vector G. Let p and q be two genes, and CECMexm between p and q is denoted by CECMexm (p, q). This is computed as follows:
where Gex(p) and Gm(p) are two vectors consisting of expression and methylation values, respectively, across all samples for the pth gene. Pearson’s correlation coefficient (Mallik, 2013) between the two groups is denoted by r (⋅, ⋅), where PCB(⋅, ⋅) processes the multiplication of Pearson’s correlation score and the BioSIM score (Bandyopadhyay and Bhattacharyya, 2011) between any two genes. Here, the normalization technique is denoted by norm (⋅) which followed the min–max normalization concept. The lower and upper limits CECMexm (⋅, ⋅) were 0 and 1, respectively. Thereafter, the corresponding dissimilarity scores (say Dsimt) were computed with the help of CECMexm scores, i.e., Dsimt (p, q) = (1 − CECMexm (p, q)). Thereafter, we determined protein–protein interactions from the Human Protein Resource Database (HPRD) and selected the interactions of the interactive protein-oriented genes among the set of genes which are differentially expressed and methylated. H is the protein–protein interaction matrix for the selected differentially expressed and methylated genes. In every gene pair (p, q), we multiplied the interaction value in H and the corresponding weighted distance value in Dsimt and subsequently calculated the resultant value, DijStP (p, q). The expression of DijStP (p, q) is given as DijStP (p, q) = (H (p, q)*Dsimt (p, q)). To compute DijStP (p,q) for all gene pairs (p, q), we selected the weighted distance for every gene pair that contained the interactions in their corresponding protein levels among each other. This resulted in a similarity and symmetric matrix. Using this matrix, we constructed a weighted transcriptomic gene regulatory network. Dijkstra’s shortest path algorithm was then used on the gene regulatory network, and the relative weighted shortest distance matrix was generated (denoted by We SD). According to the fundamental biological theory, the biological functions or biological pathways of two genes are the same if the distance between two genes is low. In this work, we utilized the shortest distance between every two genes belonging to the network. Thereafter, we calculated different distances among all gene pairs belonging to the We SD matrix such as the maximum weighted shortest distance (We SDmx), minimum weighted shortest distance (We SDmn), and average weighted shortest distance (We SDavg) that were computed without considering the diagonal elements of the underlying matrix. The distance-based variable supports threshold within the gene set (GS) DbVS(GS) is defined as follows:
where
where ngp indicates the total number of possible gene pairs within GS and c1 and c2 are two constant terms. The value for c1 is set at 0.10, while c2 is a constant scaling factor whose value is set at 1.4826 for the assumption of a Gaussian distribution pattern to utilize any parametric test.
Similarly, another two different types of thresholds, viz., distance-oriented variable confidence (denoted by DbVC) and distance-oriented variable lift (denoted by DbVL), are defined as follows:
where
where UVminC depicts the user-mentioned minimum confidence threshold, and
where
where UDminL represents the user-mentioned minimum lift threshold value, while c1 and c2 denote the constant values for scaling the fractional part.
3 Multi-objective optimized association rule mining for the multi-omics dataset
In this section, we developed a novel algorithm called MOOVARM for multi-omics profiles. Here, we integrated the gene expression, methylation, and protein–protein interaction data based on the idea of multi-objective optimization and weighted shortest distance to produce interesting rules for multi-omics profiles. The three basic steps of this algorithm are explained in the following sections. All abbreviations of Model parameters are discussed in Table 1.
3.1 Finding significant genes
Initially, matched genes and matched samples between gene expression and methylation data were found. Using the zero-mean normalization (Bandyopadhyay et al., 2014) technique, the gene expression/methylation data were normalized genewise. The empirical Bayes test using the limma package (Mallik and Zhao, 2017b; Mallik and Zhao, 2017a; Smyth, 2004) on both normalized expression and methylation data was executed for finding differentially expressed and methylated genes. limma was used because of its effectiveness on normalized gene expression/methylation data for any data distribution and any number of samples. Numerous pairs of genes in the normalized expression/methylation dataset comprised more than one probe. We applied limma for every gene probe individually and found the differentially expressed/methylated probes in terms of the significant Benjamini–Hochberg (BH) corrected p-value. The probes for which the Benjamini–Hochberg (BH) corrected p-value is less than the standard cutoff 0.05, the expression/methylation data are treated as differentially expressed/methylated gene probes. Then, we selected the probe of each gene for which the corresponding Benjamini–Hochberg (BH) corrected p-value generated using the limma tool was the lowest among all probes of each gene. The remaining probes of those genes were deducted from the corresponding dataset. Last, only those genes containing single probes were obtained which were both differentially expressed and methylated and whose respective proteins had interactions in the HPRD.
3.2 Discretization and post-discretization formats
Assuming that N referred to the set of genes which had both the differential expression and differential methylation profiles and which were involved in the protein–protein interaction, while n denotes the number of genes that are both differentially expressed and differentially methylated (N). Let M denote the set of matched samples between the expression and methylation data, while m denotes the number of matched samples between the expression and methylation data (M). The normalized expression and methylation data matrices of the genes belonging to N are symbolized as DiEnorm and DiMnorm, respectively. The row of data matrices represents the gene, whereas the column indicates the transaction (sample). The binary representation of DiEnorm and DiMnorm is essential for the association rule mining. When DiEnorm was normalized applying the zero-mean normalization technique, the rowwise (i.e., genewise) mean values became zero. If the value of expression data was greater than 0, the value was treated as upregulation (denoted as UpR), and thus, it was converted into 1 at the time of discretization, whereas any value which was less than 0 denoting downregulation (denoted by DwR) was turned into 0 during discretization. On the other hand, in the methylation data, the value that was greater than 0 indicating hyper-methylation (denoted as HperM) was converted into 0, whereas any value that was less than 0 indicating hypo-methylation (denoted as HpoM) was converted into 1. The aforementioned discretization procedure for the expression and methylation datasets is described in the following equations, respectively:
where DDiEnorm and DDiMnorm indicate the discretized expression and methylation data matrices, respectively. The range of i and j values are 1–n and 1–m, respectively. Then, all the resultant discretized matrices are transposed as follows:
and
During post-discretization, the transposed discretized expression data (denoted by DDiTEnorm in Eq. 7) and methylation data (denoted by DDiTMnorm in Eq. 8) were merged into a single binary matrix (denoted by PDiDem), with the size of [m × (2*n)]. The integration of the expression and methylation data produced four types of genes, viz., 1) upregulated and hypo-methylated genes, 2) upregulated and hyper-methylated genes, 3) downregulated and hyper-methylated genes, and 4) downregulated and hypo-methylated genes. As gene expression and methylation are inversely proportional to each other, the first and third categories of gene sets (i.e., categories denoted by (i) and (iii)) were selected. As mentioned previously, the column length (gene area) of post-discretization is twice that of the column length (gene area) of the transposed discretized expression/methylation matrix, i.e., the size of PDiDem is [m × (2*n)].
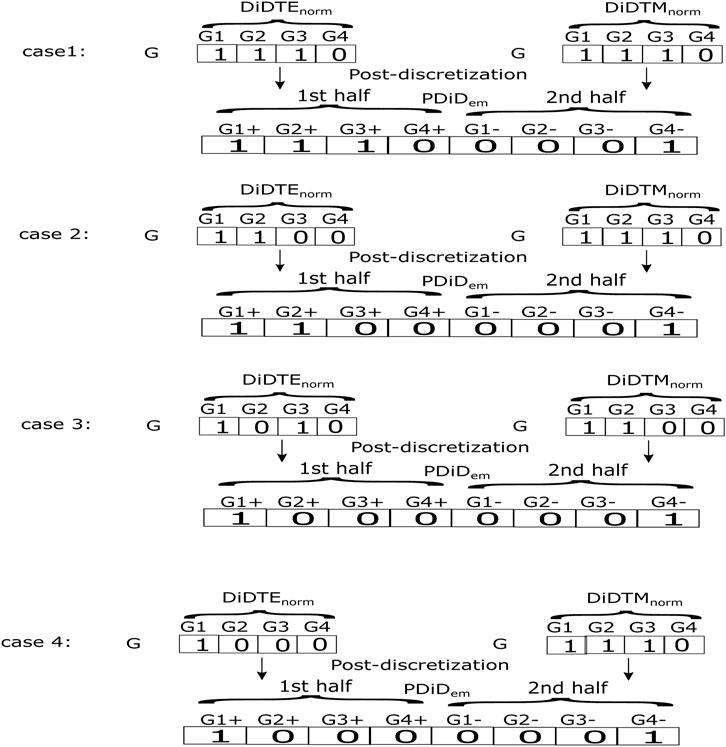
The first half of the column vector of PDiDem is for type (i) upregulation and hypo-methylation, while the second half of the column vector of PDiDem is for type (iii) downregulation and hyper-methylation. Therefore, if the particular cell/house value (say cell at the jth sample and the ith gene) of the transposed discretized expression data matrix DDiTEnorm is 1 (i.e., the so-called upregulated) and the same cell/house value of the transposed discretized methylation data matrix DDiTMnorm is 1 (i.e., the so-called hypo-methylation), it satisfies type (i) upregulation and hypo-methylation. We place a symbol “1” at the same cell/location of the first half of the post-discretized matrix (i.e., cell at the jth sample and the ith gene of PDiDem that are seen as the first joint condition of Eq. 9) that indicated type (i) both upregulated and hypo-methylated genes, and simultaneously we also place a symbol “0” at the same cell/location of the second half of the post-discretized matrix (i.e., cell at the jth sample and the ith gene of PDiDem that are seen as the first joint condition of Eq. 10) which is just the negation of “1.” On the other hand, when both the transposed discretized scores for the same cell/house were 0 (downregulation and hyper-methylation), the resultant post-discretized value for the second half of the post-discretized matrix would be 1 (see the second joint condition of Eq. 10), whereas the same value for the first half of the post-discretized matrix would automatically be the negation of 1 (viz., 0) (see the second joint condition of Eq. 9). In addition, for all the other combinations of the transposed discretized expression value and the transposed discretized methylation value [e.g., (0 and 1), (1 and 0)], the post-discretized values for both the first and second half would be 0.
and
However, we illustrated some examples of aforementioned computations in Figure 1. After the post-discretization step, we carried out transpose on the resultant post-discretized matrix for the next step.
3.3 Proposed association rule mining approach
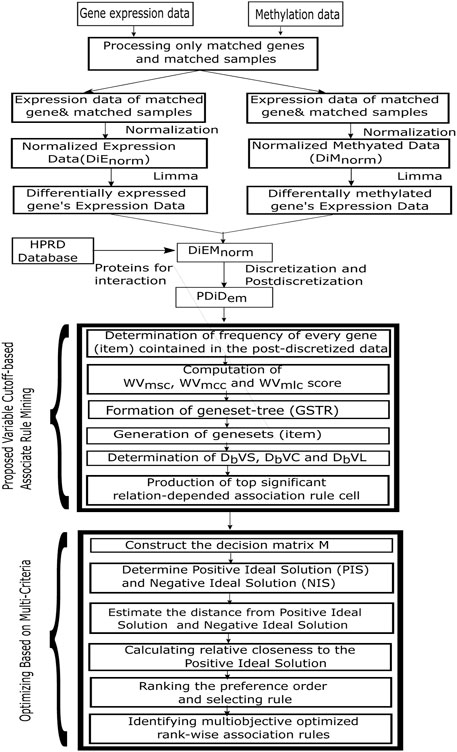
The MOOVARM approach changed the traditional concept of using the static support threshold and a static confidence threshold which were generally applied to maintain these same thresholds across all item sets (i.e., gene sets). In our method, after post-discretization, the association rule mining algorithm utilized the weighted shortest distance depending on multiple minimum support thresholds, multiple minimum confidence thresholds, and multiple minimum lift thresholds instead of the static support threshold and the static confidence threshold. Those multiple minimum thresholds were formed through the integration of gene expression, methylation, and protein–protein interaction profiles. The MOOVARM method worked on three different types of profiles: gene expression, methylation, and protein–protein interaction profiles concurrently instead of the individual dataset, like gene expression or DNA methylation or any other data, and produced multi-objective multi-prolific association rules. The six main steps of this MOOVARM method were as follows: 1) determination of frequency of every gene (item) contained in the post-discretized data; 2) computation of WVmsc, WVmcc, and WVmlc scores; 3) formation of a gene set tree (GSTR); 4) generation of gene sets (item sets); 5) determination of DbVS, DbVC, and DbVL; and 6) production of the top significant relation-dependent association rules.
In the first step, the binary matrix denoted by PDiDem was transformed into the transactional matrix TRDiM, which contained transactions associated with several genes IDs per transaction. The number of transactions that existed in TRDiM was denoted by TRn. Both the user-mentioned minimum support cutoff (UDminS) and user-mentioned minimum confidence cutoff (UDminC) were to be described. UDminL (user-defined minimum lift cutoff) was kept at the value 1. Then, the frequency of every gene from the TRDiM dataset was determined. The frequency of the genes was greater than or equal to UDminS and were considered frequent genes. The frequent genes were arranged according to their frequency (from high to low order). In the second step, the generated cutoff WVmsc (;) was computed for every pair of genes by combining H (;), CECMexm (;), and UDminS. Similarly, WVmcc (;) was evaluated by applying H (;), CECMexm (;), and UDminC, and WVmlc (;) was computed by integrating H (;), CECMexm (;), and UDminL. In the next two phases, the GSTR was first obtained, and the important gene sets were then generated consecutively by following the same steps used in the typical FP-Growth association rule mining method. Next, in the fifth phase, the distance-based cutoff (i.e., DbVS, DbVC, and DbVL) scores were evaluated for every resultant gene set by the initially computed WVmsc, WVmcc, and WVmlc matrices, successively. In the final phase, the support of every resultant gene set was first identified. The frequent gene sets (i.e., the gene sets whose support scores were greater than or equal to the respective individual DbVS threshold instead of the user-specified support threshold UDminS) were then identified. Next, the rules were obtained with respect to the frequent gene sets, and the confidences and lifts of the respective rules were computed. From the aforementioned set of rules, we chose only those rules for which both the confidence and lift scores were greater than or equal to their individual DbVC and DbVL cutoffs instead of UDminC and UDminL, respectively.
A flowchart of the proposed MOOVARM rule mining method is illustrated in Figure 2.
4 Multi-criteria (multi-objective optimization) decision-making technique
Multi-criteria decision-making (MCDM) (Das et al., 2013) is a procedure used to select the best alternative of the set of finite alternatives with respect to multiple criteria. The MCDM technique has various applications in different fields such as economy, management, engineering, and medical diagnosis and helps the decision maker in selecting the best alternative in conflicting situations.
Algorithm 1. MOOVARM.
Input: Gene expression
Output: List of rank wise multi objective optimized association rules
1: Procedure MOOVARM(EX, Mt, PPI)
2: Find the matched genes and matched samples between EX and Mt, and choose only them for EX/Mt
3: Normalize EX/Mt by zero-mean normalization
4: Identify differentially expressed genes from EX and differentially methylated genes from Mt; and intersect them and finally choose those intersected genes that have interactions in HPRD (denoted as DiEMnorm gene set)
5: Discretize the EX/Mt subdata having DiEMnorm gene set into DDiEnorm (:) and DDiMnorm (:), respectively, and post-discretize them together into a single matrix, PDiDem. (See Eqs 5–10)
6: Transpose PDiDem into the transactional matrix TRDiM
7: Generate frequent gene set GS from TRDiM
8: for each gene gi ∈ TRDiM do
9: if frequency (gi) ≥ UDminS then
10: GS ← gi
11: end if
12: end for
13: Determine WVmsc, WVmcc, and WVmlc cutoff scores for each pair of gene
14: Form gene set tree (GSTR) and then generate important gene set by FP-Growth rule mining method
15: Distance-based cutoff (i.e., DbVS, DbVC, DbVL) scores were evaluated for every resultant gene set using WVmsc (:), WVmcc (:), and WVmlc (:) scores, successively. Produce top significant relation-dependent association rules. (See Eqs 2–4)
16: Develop the decision matrix M according to Confidence, Support, Lift, and Average WeSD value of rules
17: Determine the Positive Ideal Solution (PIS+) and Negative Ideal Solution (NIS−) (See Eqs 11 and 12)
18: Calculate the distance (
19: Compute the relative closeness (Si) to the positive ideal solution of each alternative (See Eq. 15)
20: Ranking the preference order according to relative closeness and select the alternative that is close to 1. Thereafter, rank the alternative depending on Si score in descending order
21: end procedure
During the decision-making process, the decision-maker considers the number of criteria which is helpful in reaching the goal. Among those criteria, some conflict with each other, some are maximized, and some are minimized. Those types of problems are solved by different MCDM techniques such as MAXMIN (Shen and Mo, 2009), MAXMAX (Shen and Mo, 2009), AHP (Saaty, 1990), ELECTRE (Roy and Vanderpooten, 1996), and TOPSIS (Hwang and Yoon, 1981). Those methods are considered a decision-making procedure depending on the problem behaviors such as ranking, scoring, selecting, ordering, and surrounding environments such as available data type and size, processing/execution time, internal consistency, and logical relations. The TOPSIS method is the most suitable MCDM method under two cases: first, in case of problems related to the large number of criteria and alternatives; second, in case of availability of objective and quantity data. First, the TOPSIS method identifies the positive ideal alternative which has the extreme performance on each criterion. It also identifies the negative ideal alternative that produced the worst performance on each criterion. The positive ideal solution is the solution that maximizes the benefit criterion and minimizes the cost criterion, whereas the negative ideal solution maximizes the cost criterion and minimizes the benefit criterion. Next, the method finds the alternative, depending on the closest distance from the positive ideal solution and farthest distance from the negative ideal solution. The classical TOPSIS method was based on the information of the criteria that was collected from the expert opinions and quantitative data, whereas the generated solution was concentrated on evaluation, prioritization, and selection (Figure 3).
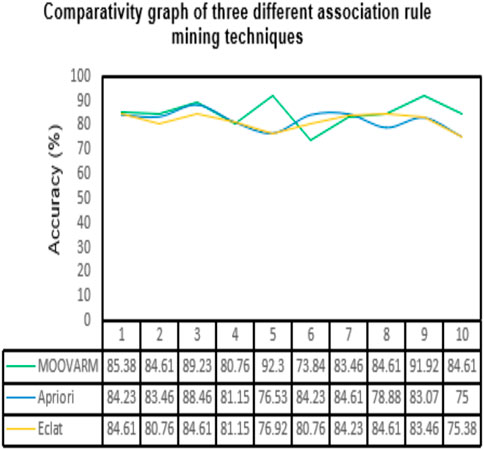
FIGURE 3. Comparative study between our proposed method MOOVARM and other well-known related rule mining methods, Apriori and Eclat, in terms of classification accuracy of the generated top 10 rules obtained by (A) MOOVARM, (B) Apriori, and (C) Eclat.
The TOPSIS method calculates relative closeness and ranking through the following steps.
Step 1: Constructing the decision matrix.Let
Step 2: Determining the positive ideal solution (PIS+) and negative ideal solution (NIS−). The positive ideal solution (PIS+) is denoted as follows:
The negative ideal solution (NIS−) is denoted as follows:
where K is associated with the benefit criteria and L is associated with the cost criteria.
Step 3: Calculating the distance from the positive ideal solution and negative ideal solution. The distance of the ith alternative from the positive ideal solution
while the distance of the ith alternative from the negative ideal solution
Step 4: Calculating the relative closeness to the positive ideal solution Si as follows:
Step 5: Ranking the preference order, and selecting the alternative close to 1. Ranking of the alternatives depending on the Si score was made in descending order.
Notably, see Algorithm 1 for the major steps of the proposed algorithm MOOVARM (Figure 4).
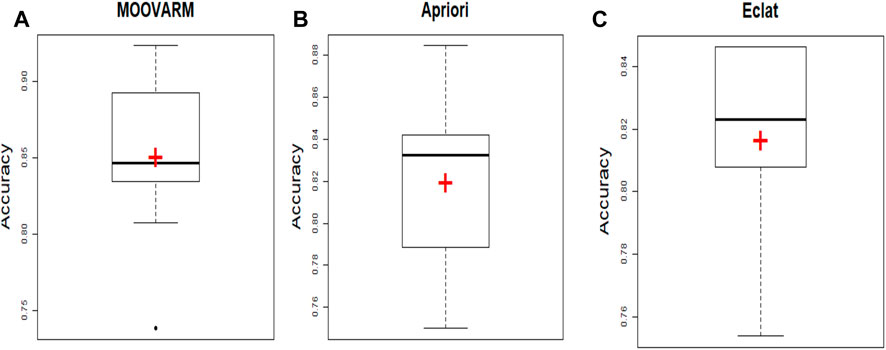
FIGURE 4. Comparative study between our proposed method MOOVARM and other well-known related rule mining methods, Apriori and Eclat, in terms of mean classification accuracy of the generated rules obtained by (A) MOOVARM, (B) Apriori, and (C) Eclat, where “+” (red symbol) denotes the average classification accuracies and the bold line signifies their median.
5 Experimental datasets and results
In the experiment, integrative data consisting of DNA methylation and gene expression high-grade soft tissue sarcoma (HSTS) profiles (NCBI ID: GSE52392) (Renner et al., 2013; Chudasama et al., 2017) were utilized. At the initial stage, the methylation profile had 27,578 methylation probes, whereas the gene expression profile consisted of a total of 48,645 genes. Of note, we selected those samples which contained both the values that consisted of two categories of samples: (i) undifferentiated pleomorphic liposarcoma (UdPLs) (diseased samples) and (ii) normal tumor cell line (nrTCL) (i.e., control samples). The profile had 13 UdPLs samples and 13 nrTCL samples. Thereafter, we chose the matched genes (i.e., 12,438) that consisted of both methylation and expression values.
During the experiment, we first selected the genes that contained both DNA methylation and expression values. Since genes had more than one single probe for methylation and expression profiles, we preliminarily filtered out those probes containing the missing values. The limma R tool (Smyth, 2004) was then applied on each probe to know whether the probe was differentially expressed/methylated or not (Figure 5).
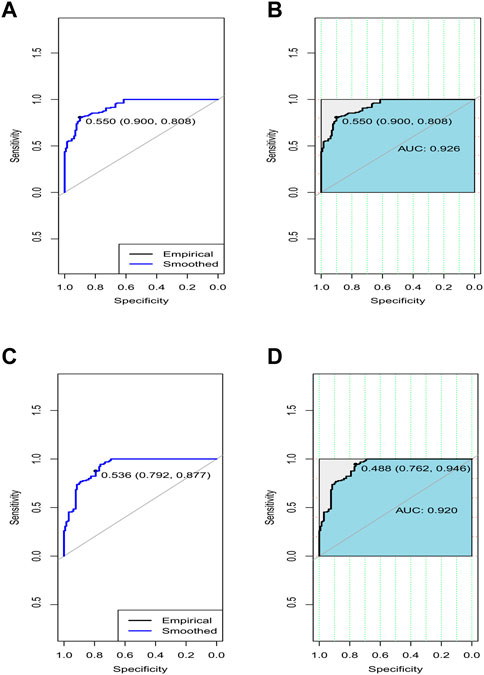
FIGURE 5. ROC curves of average accuracies and AUC in terms of sensitivity vs. specificity to classify the respective disease using the gene sets belonging to the topmost two rules by MOOVARM (of Table 3) from the respective dataset. (A) ROC curve of avg. accuracies to classify the respective disease using the gene sets belonging to the first rule, (B) AUC to classify the respective disease using the gene sets belonging to the first rule, (C) ROC curve of avg. accuracies to classify the respective disease using the gene sets belonging to the second rule, and (D) AUC to classify the respective disease using the gene sets belonging to the second rule. Of note, the blue curve denotes the empirical line, while the light black line indicates the smoothed control (X:Y = 1:1) line. Herein, “0.550 (0.900, 0.808)” denotes the optimal threshold point (=0.550) that is closest to the top left part of the plot (for rule 1), where the respective specificity and sensitivity are 0.900 and 0.808, respectively. Similarly, “0.536 (0.792, 0.877)” signifies the optimal threshold point (=0.536) that is closest to the top left part of the plot (for rule 2), where the respective specificity and sensitivity are 0.792 and 0.877, respectively.
The probe with the best significance (minimal corrected p-value) among all the probes for every gene was selected for the next analysis, whereas all the remaining probes for every gene were simply omitted from the methylation profile and the expression profile. Next, we conducted the intersection between the set of differentially methylated genes, the set of differentially expressed genes, and the set of genes whose respective proteins interacted with one another in the HPRD (Peri et al., 2003). Herein, we identified many such common genes. For each dataset, we constructed a protein–protein interaction (PPI) network where each protein denoted a gene in the respective intersected set of genes. Next, we calculated the degree of each node (gene) in the PPI network and rearranged the genes with respect to the high to low order of their degree values. Thereafter, we conducted the discretization and post-discretization steps, respectively. Then, we used our proposed rule mining method, MOOVARM, and obtained multi-objective optimized variable support-based association rule mining. Table 2 shows the resultant rules. Notably, using the four measures (confidence, support, lift, and WeSD) of each rule, we optimized the rules through computing the relative score in optimization where confidence, support, and lift were used to maximize their values and WeSD was used to minimize their values. Then, we ranked the rules according to the relative score from high to low. For the HSTS dataset, the topmost rule {STAT3+, TP53- → MAPK3+} states that if the gene STAT3 is both upregulated and hypo-methylated and the gene TP53 is both downregulated and hyper-methylated, then it is likely that the gene MAPK3 is upregulated and hypo-methylated. The confidence, support, lift, avg. WeSD, and relative score values of this rule are 0.01, 0.00269, 0.02275, 0.00543, and 0.36, respectively. Its previous rank before optimization was 4, but after optimization, it secured the first rank since it has the highest relative score among all the rules. The next top four ranked optimized rules are {STAT3+ → MAPK3+}, {JUN+, STAT3+, TP53- → MAPK3+}, {ESR1+ → MAPK3+}, and {JUN+, STAT3+ → MAPK3+}, whose relative scores are 0.3596, 0.3588, 0.3565, and 0.355, respectively (in Table 2). All details of the different rule interestingness measures, WeSD, relative scores, and the ranks prior to and after optimization for these top genes generated by MOOVARM are described in Table 2.
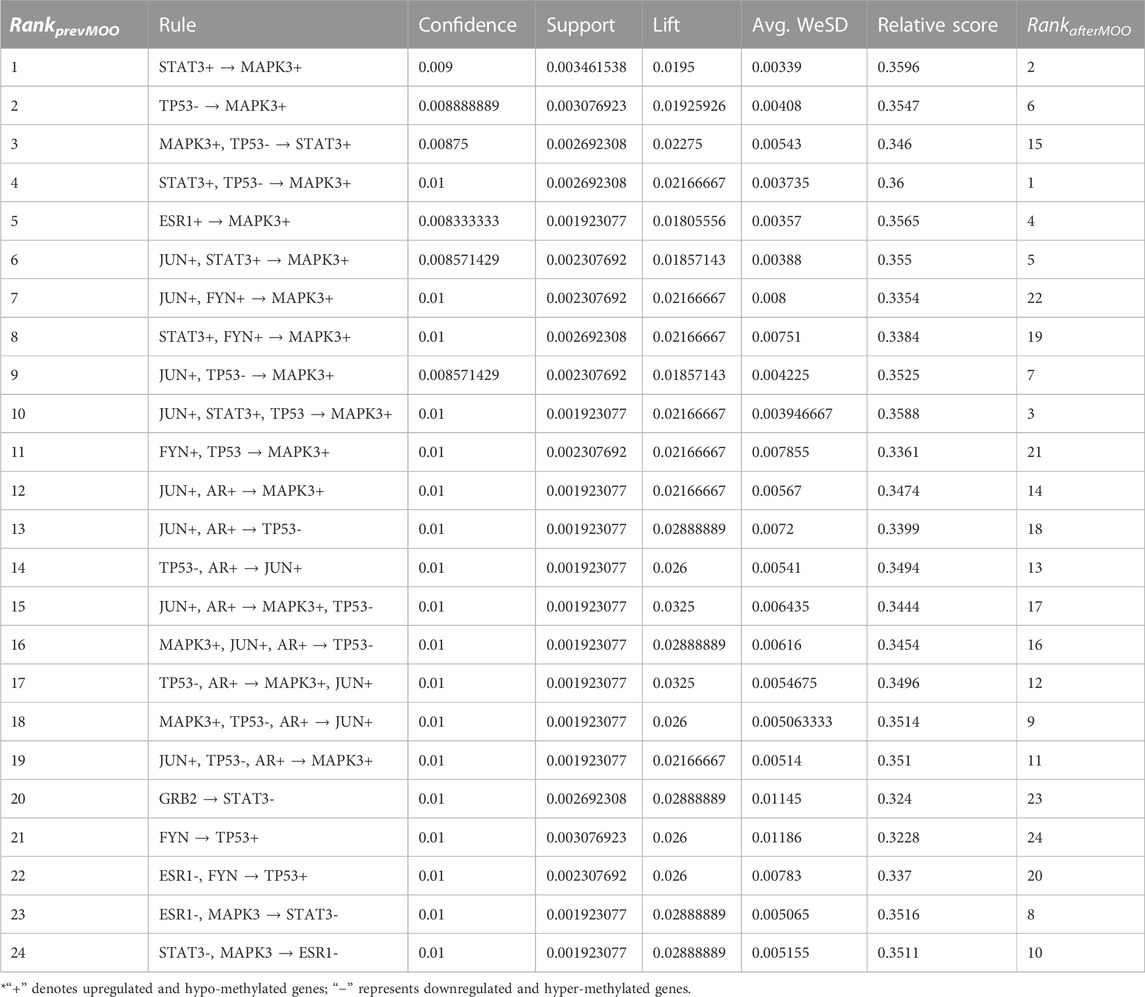
TABLE 2. Ranks of the evolved rules prior to optimization and after optimization in MOOVARM along with several rule interestingness measures, confidence, support, and lift, as well as average WeSD and relative scores.
In order to validate the significance of each of the top 10 rules (in Table 2) generated from DTFP-Growth, we used and executed the PAM classifier for comparing the classification performance of the different rules obtained from MOOVARM, Apriori, and Eclat rule mining methods toward the samples. For this purpose, we considered only the participating features (genes) from both sides of each individual rule of the top 10 rules and then ran 10-fold cross-validation on the data with the help of the PAM classifier with the default parameters to evaluate the importance of the combination of all genes participating in the rule. We repeated the entire procedure 10 times in every occasion. The obtained classification accuracies of the top 10 rules of the HSTS dataset are presented in Table 3. Similarly, accuracy values of the top 10 rules as per the Apriori and Eclat algorithms are displayed in Table 4 and Table 5, respectively. The graphical plot for the top 10 rules classification accuracy measures obtained by three methods, namely, MOOVARM, Apriori, and Eclat is presented in Figure 3. According to the top 10 classification accuracy metrics, it is clear that the overall accuracy of the proposed method MOOVARM is higher than the other two methods. We also computed the average values of the classification accuracies of the top 10 rules which were 85.08% (±0.03), 81.96% (±0.02), and 81.65% (±0.02) for the methods, MOOVARM, Apriori and Eclat, respectively (in Figure 4). In addition, the AUC values in terms of sensitivity vs. specificity for classifying the respective disease using the gene sets belonging to the topmost two rules by MOOVARM (from Table 3) from the respective dataset were found as 0.926 and 0.920, respectively (in Figure 5). Moreover, in summary, the average AUC values of the top 10 rules of the same dataset using those methods (MOOVARM, Apriori, and Eclat) were 0.909, 0.861, and 0.859, respectively. Herein, we used an open-source R package “pROC” (Robin et al., 2011) to illustrate the ROC and AUC curves as depicted in Figure 5.
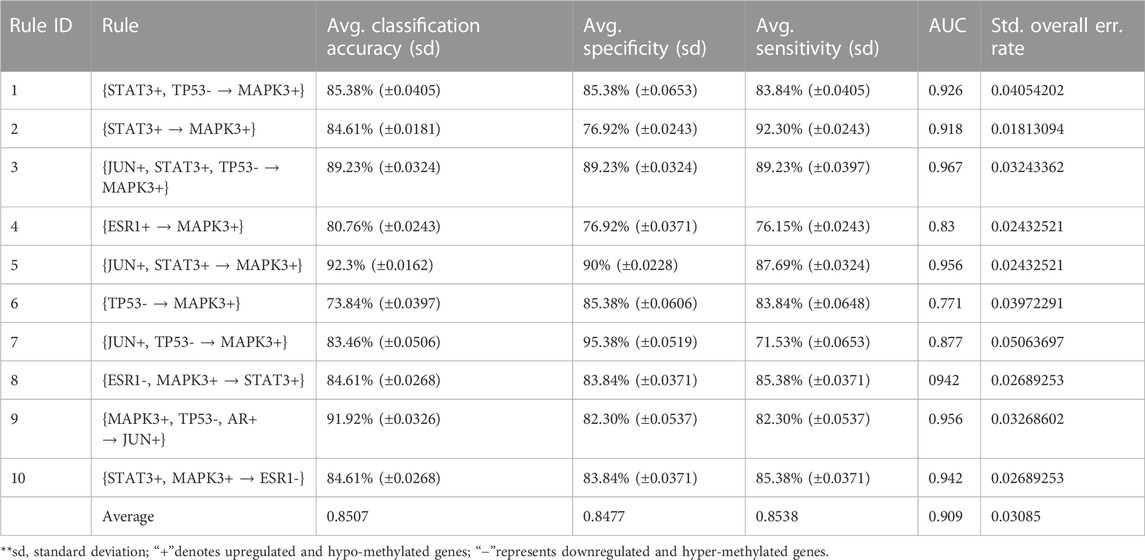
TABLE 3. Top 10 rules of MOOVARM with their classification accuracy, specificity, sensitivity, and AUC values.
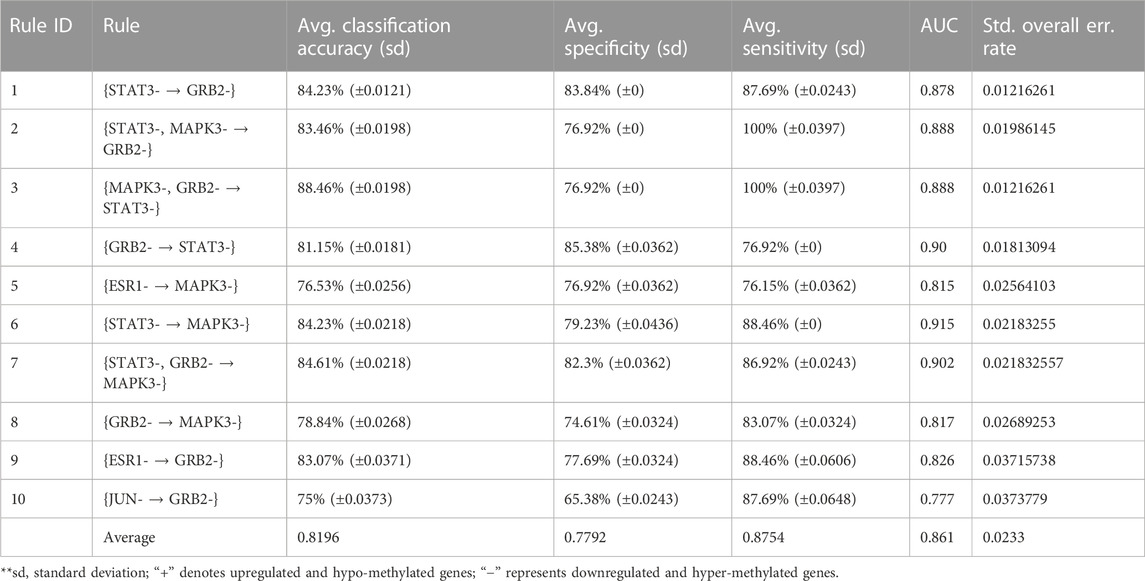
TABLE 4. Top 10 rules of Apriori with their classification accuracy, specificity, sensitivity, and AUC values.
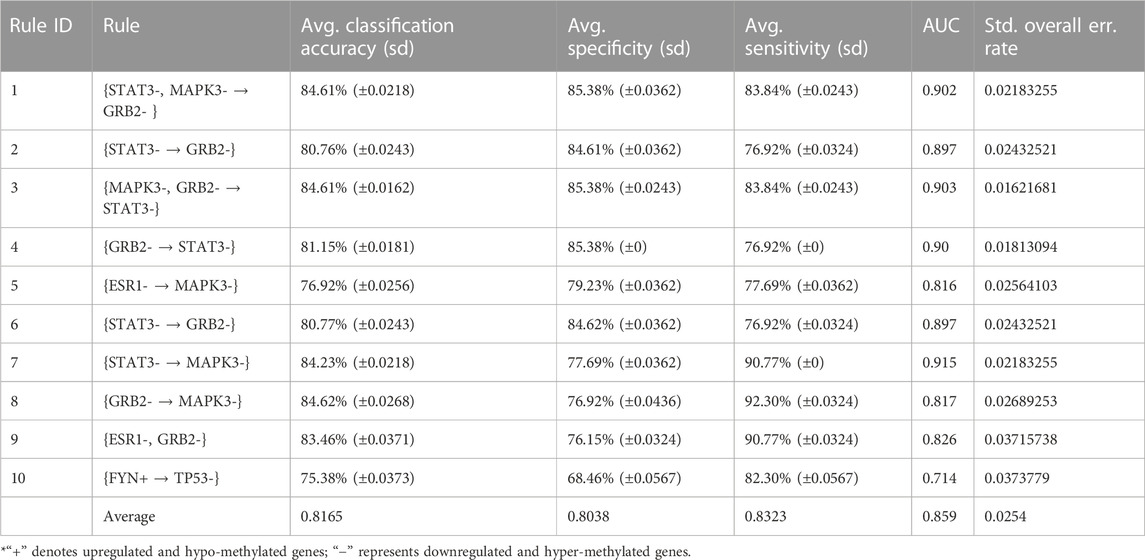
TABLE 5. Top 10 rules of Eclat with their classification accuracy, specificity, sensitivity, and AUC values.
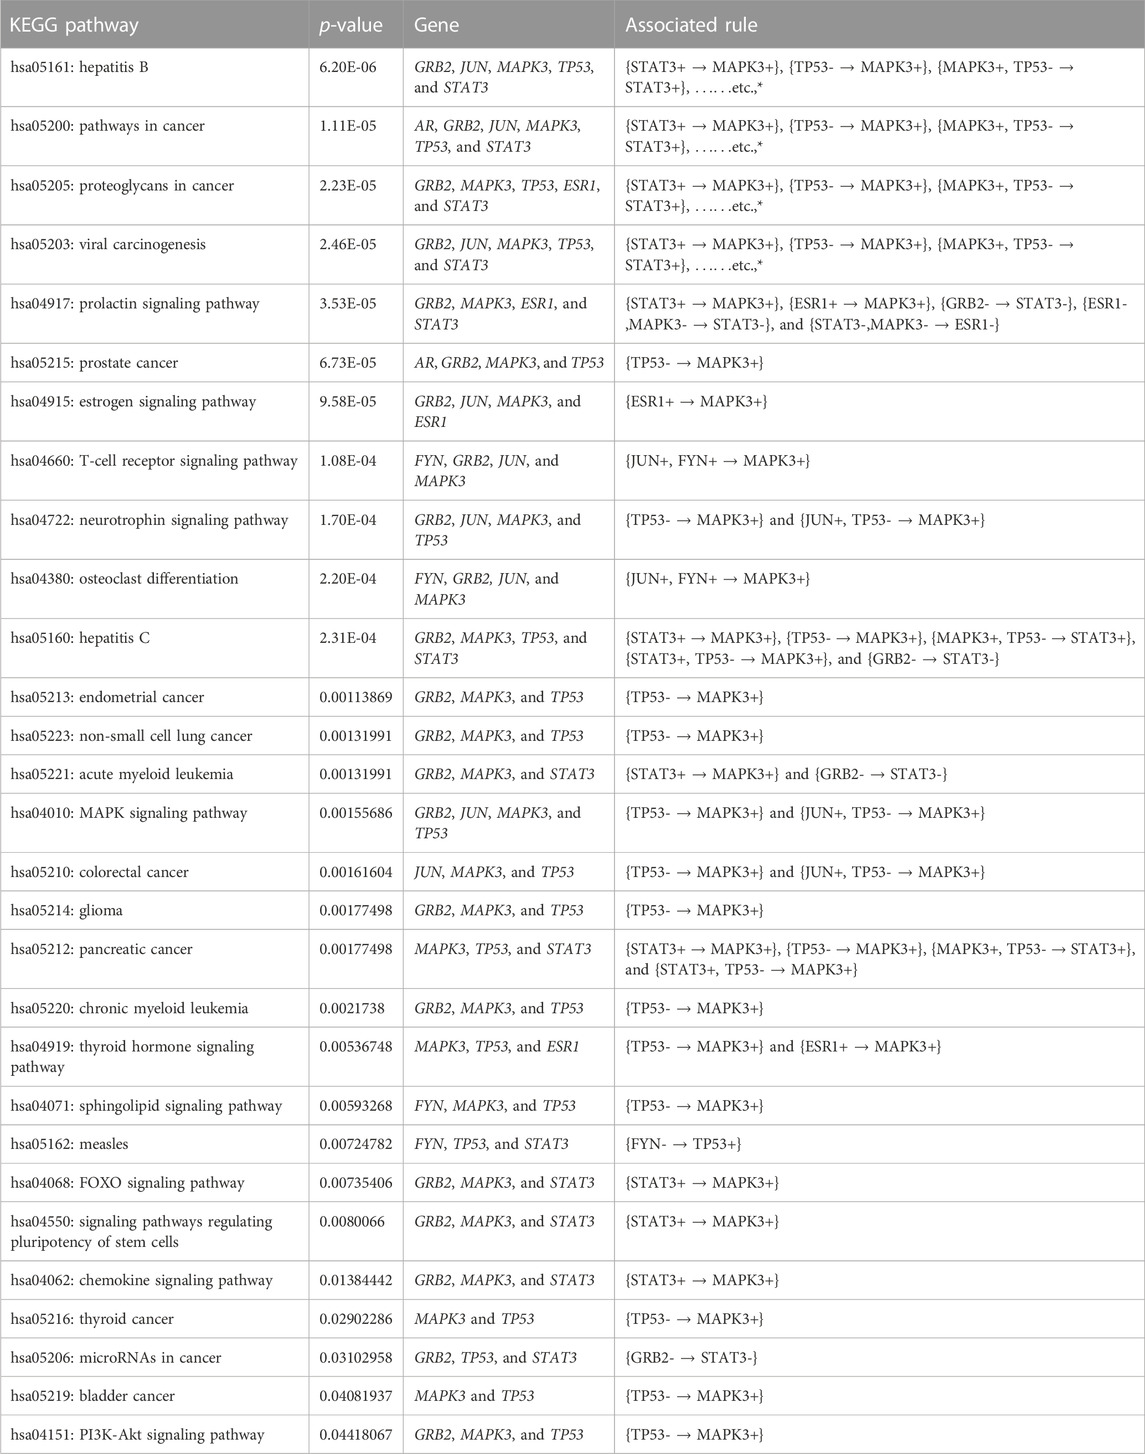
Furthermore, we performed the KEGG pathway and Gene Ontology (GO) analyses using the participating genes belonging to the top rules generated by MOOVARM, and then we identified the GO-terms with significant p-values. Table 6 and Table 7 summarize enrichment results for GO terms: molecular function (GO: MF) and cellular component (GO: CC), respectively, containing the resultant rules of MOOVARM, whereas Table 8 provides the enrichment result for Gene Ontology: biological processing (GO: BP) terms containing the resultant rules of MOOVARM. Table 9 describes the KEGG pathways having the resultant rules of MOOVARM. For example, hsa05161: hepatitis B KEGG pathway (p-value = 6.20E-06) contained five genes and eight rules out of the 24 evolved rules obtained from MOOVARM as shown in Table 2. These five genes are GRB2, JUN, MAPK3, TP53, and STAT3, while these eight rules are {STAT3+ → MAPK3+}, {TP53- → MAPK3+}, {MAPK3+, TP53- → STAT3+}, {STAT3+, TP53- → MAPK3+}, {JUN+, STAT3+ → MAPK3+}, {JUN+, TP53- → MAPK3+}, {JUN+,STAT3+,TP53- → MAPK3+}, and {GRB2- → STAT3-}. Similarly, hsa05200: pathways in cancer (p-value = =1.11E-05) consisted of six genes (AR, GRB2, JUN, MAPK3, TP53, and STAT3) and fifteen evolved rules. In the case of the GO:BP terms, GO:0045893 positive regulation of transcription, DNA-templated (p-value = =5.31E-07) was associated with six genes (AR, JUN, MAPK3, TP53, ESR1, and STAT3) and eighteen evolved rules, while for the GO:CC terms, GO:0005654 nucleoplasm (p-value = =7.70E-05) was associated with seven genes (AR, GRB2, JUN, MAPK3, TP53, ESR1, and STAT3) and nineteen evolved rules. For GO:MF terms, GO:0008134 transcription factor binding (p-value = =2.64E-06) was associated with five genes (AR, JUN, TP53, ESR1, and STAT3) and two generated rules ({JUN+,AR+ → TP53-} and {TP53-,AR+ → JUN+}).
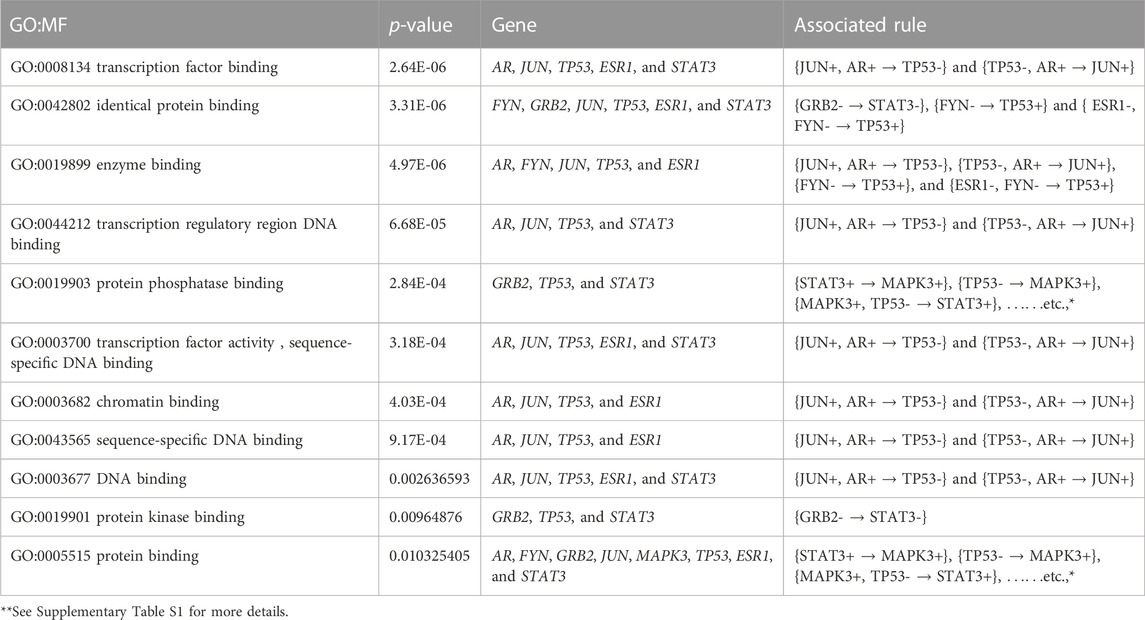
TABLE 6. Gene set enrichment result for Gene Ontology: molecular function (GO: MF) terms containing the resultant rules of MOOVARM.

TABLE 7. Gene set enrichment result for Gene Ontology: cellular component (GO: CC) terms containing the resultant rules of MOOVARM.
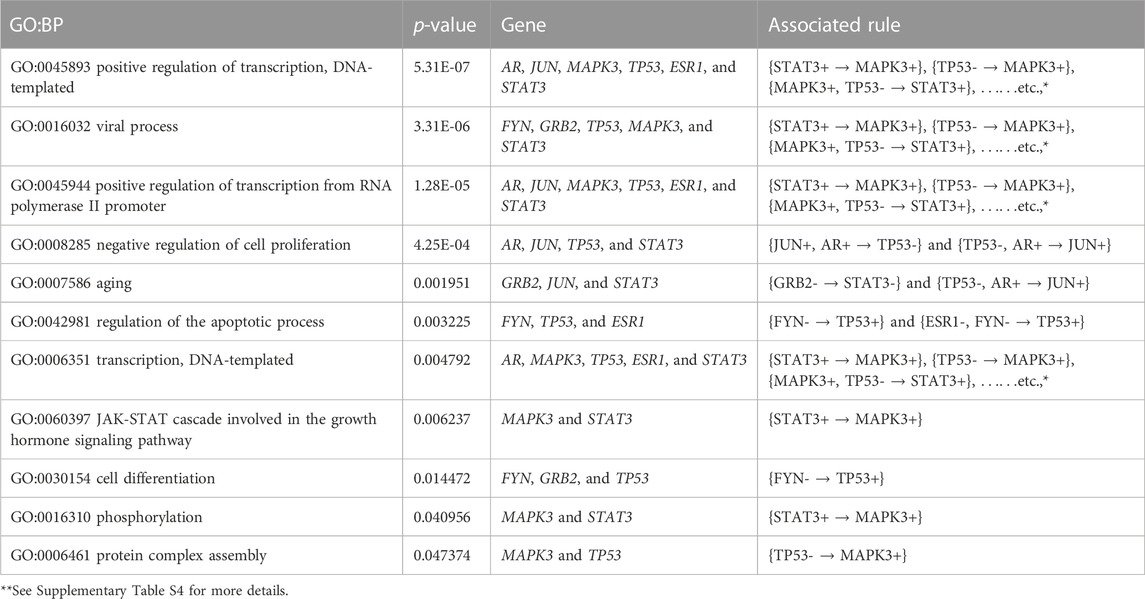
TABLE 8. Gene set enrichment result for Gene Ontology: biological processing (GO: BP) terms containing the resultant rules of MOOVARM.
Association rule mining is related to the directional signature and its effects on disease discovery. The top association rule is STAT3+, TP53- → MAPK3+, where STAT3 and TP53 play opposing roles in cellular pathway regulation. According to the literature survey, the activation function of STAT3 upregulates the survival pathway, whereas p53 activates the apoptotic pathway. STAT3 contributes to cancer cell proliferation and is associated with tumor malignancy. Similarly, TP53 is a well-known tumor suppressor gene. TP53 provides protection against DNA damage by inducing cell cycle arrest, DNA repair, or apoptosis. Mutation of p53 is often observed in cancer, especially in late events in malignant progression (Pham et al., 2020). The rule says where if antecedent genes (STAT3+, TP53-) are expressed/methylated in a specified manner together, then it is likely that consequent genes (MAPK3+) will also be expressed/methylated in a specified manner together. According to the literature survey, MARK3 regulates the proliferation and bone metastasis of human breast cancer cells (Du et al., 2020).
To illustrate the efficiency of our top 10 association rules, we conducted literature mining. Our first association rule {STAT3+, TP53- → MAPK3+} says that if antecedent genes (STAT3+, TP53-) are expressed/methylated in a specified manner together, then it is likely that consequent genes (MAPK3+) will also be expressed/methylated in a specified manner together. According to Yang et al. (2021), Yang et al. (2022), and Liu et al. (2022), we obtained these three genes, namely, STAT3, TP53, and MAPK3 together as core target genes or highest degree hub genes related to several diseases like gastric cancer and type 2 diabetes mellitus. According to Zu et al. (2021), the three genes of the second association rule, JUN, TP53, and MAPK3 together, are related to gastric cancer. According to Santh Rani (2023), the three genes associated with rule 8, ESR1, MAPK3, and STAT3 together, are found as the top hub protein target genes in the PPI network analysis. Therefore, we can conclude that the genes associated with our association rules also jointly played several roles in recent literature studies.
However, in the conceptual prospective, the MOOVARM approach modifies the traditional concept of using the static support threshold and a static confidence threshold which were generally applied to maintain these same thresholds across all item sets (i.e., gene sets) in the traditional algorithms like Apriori and Eclat. In MOOVARM, after post-discretization, the association rule mining algorithm utilizes the weighted shortest distance that depended on multiple minimum support thresholds, multiple minimum confidence thresholds, and multiple minimum lift thresholds instead of the static support threshold and the static confidence threshold. Those multiple/dynamic minimum thresholds were estimated by the integration of gene expression, methylation, and protein–protein interaction profiles and a weighted shortest distance-based scheme. The MOOVARM method works on all three different types of profiles: gene expression, methylation, and protein–protein interaction profiles instead of individual datasets like gene expression or DNA methylation or any other data, and produced multi-objective multi-prolific association rules. We also applied a multi-objective optimization technique, TOPSIS, which is named the multi-criteria decision-making technique. It is the procedure to select the best alternative of the set of finite alternatives with respect to multiple criteria. Herein, we ranked the association rules using multiple criteria (such as weighted support, weighted confidence, and weighted lift) and chose the top-ranked association rules through the multi-objective optimization technique. Thus, in a single word, the traditional rule mining algorithms like Apriori and Eclat use static user-defined threshold values and there is no optimized ranking of the estimated rules, while MOOVARM follows dynamic thresholds and generates optimized association rules using multi-objective optimization on various objectives/criteria/rule interestingness values for each individual rule.
Furthermore, to explain this relationship between association rule mining and directional gene signature and its effects on disease discovery, we took the topmost optimized association rule {STAT3+, TP53- → MAPK3+} estimated by MOOVARM (Table 3) for example, which is a directional gene signature. The rule states that if the antecedent genes express and methylate in a specified manner together (i.e., STAT3 is upregulated and hypo-methylated, and TP53 is downregulated and hyper-methylated, concurrently), then it is likely that consequent genes will be expressed and methylated in a specified manner together (i.e., MAPK3 will be upregulated and hypo-methylated). The combined effects of the rule create a directional three-gene signature since the total number of the participating genes in the associated rule is three here.
6 Conclusion
In this article, we proposed a unique associated rule mining method denoted as MOOVARM to find the most acceptable and appropriate rule for multi-omics profiles. To produce the interesting rules for multi-omics profiles, we used and integrated gene expression, methylation, and protein–protein interaction data based on the idea of multi-objective optimization and weighted shortest distance. For this purpose, we identified PIS and NIS with respect to all gene sets. PIS maximized the profit and minimized the loss. Alternatively, NIS maximized the loss and minimized the profit. Then, we calculated the distances d + and d − from PIS and NIS, respectively, for each gene set. Then, with the help of these two distances, we measured the relative closeness to PIS for ranking the gene sets. In this proposed method, we computed relative closeness scores globally instead of individual genes. Finally, MOOVARM generated the final rank of the extracted (multi-objective optimized) rules of correlated genes which may play a significant role in better disease classification performance than the state-of-the-art algorithms in disease discovery as well as therapeutic value. However, the limitation to this work is that MOOVARM works on the multi-omics RNAseq/microarray dataset consisting of DNA methylation, gene expression dataset for the same set of patients/samples, and protein–protein interaction dataset in this framework. MOOVARM cannot work on the single-omics data. Furthermore, our method might not work on single-cell sequencing data without the usage of the matrix imputation prior to pre-filtering steps.
As a future work, we will include more datasets with the advanced added mechanism. In addition, we are interested to further use our proposed model for determining the directional optimized gene signatures in hub gene findings in the multi-molecular regulation study (i.e., the regulation among the long non-coding RNAs, transcription factors, microRNAs, and target genes). Moreover, we also want to use this method in single-cell RNA sequencing and single-cell ATAC sequencing data to detect directional gene signatures for cancer detection.
Furthermore, we have checked some state-of-the-art works of association rule mining based on the fuzzy or rough set theory, but the outcome rules are not good enough, which means that the outcomes are not always beneficial using fuzzy/rough set-based association rule mining (Sharmila and Vijayarani, 2019; Singh and Ganesh Wayal, 2012). Comparatively, as our proposed method MOOVARM used the multi-objective optimization technique, the outcome rules are optimized and efficient enough. Therefore, only the inclusion of the fuzzy/rough set is not always beneficial. Thus, we assume that to improve the performance of the fuzzy/rough theory-based method, the inclusion of multi-objective optimization technique together with fuzzy/rough set-based rule mining will be an efficient step. Therefore, as our future work, we will extend our proposed framework by including both fuzzy/rough theory and multi-objective optimization to produce better and more effective association rule mining from multi-omics data.
Data availability statement
The original contributions presented in the study are publicly available. This data can be found here: https://www.ncbi.nlm.nih.gov/geo/query/acc.cgi?acc=GSE52392
Author contributions
SM and SS conceptualized the method and design. SM, SS, and AS conducted the experiment and analyzed the results. SM, SS, and TB wrote the manuscript. SM and ZZ reviewed and edited the manuscript. All authors contributed to the article and approved the submitted version.
Funding
ZZ was partially supported by the Cancer Prevention and Research Institute of Texas (CPRIT RP170668 and RP180734) (to ZZ). Publication costs were funded by ZZ’s Professorship Fund. The funder had no role in the study design, data collection and analysis, decision to publish, or preparation of the manuscript.
Acknowledgments
The authors would like to thank all the lab members for their valuable advice and helpful discussion.
Conflict of interest
The authors declare that the research was conducted in the absence of any commercial or financial relationships that could be construed as a potential conflict of interest.
Publisher’s note
All claims expressed in this article are solely those of the authors and do not necessarily represent those of their affiliated organizations, or those of the publisher, the editors, and the reviewers. Any product that may be evaluated in this article, or claim that may be made by its manufacturer, is not guaranteed or endorsed by the publisher.
Supplementary material
The Supplementary Material for this article can be found online at: https://www.frontiersin.org/articles/10.3389/fbinf.2023.1182176/full#supplementary-material
References
Agrawal, R., Imielinski, T., and Swami, A. (1993). “Mining association rules between sets of items in large databases,” in Proc. ACM SIGMOD (New York, NY, USA: ACM).
Alves, R., Rodriguez-Baena, D. S., and Aguilar-Ruiz, J. S. (2010). Gene association analysis: A survey of frequent pattern mining from gene expression data. Brief. Bioinforma. 11, 210–224. doi:10.1093/bib/bbp042
Bandyopadhyay, S., and Bhattacharyya, M. (2011). A biologically inspired measure for coexpression analysis. IEEE/ACM Trans. Comput. Biol. Bioinforma. 8 (4), 929–942. doi:10.1109/tcbb.2010.106
Bandyopadhyay, S., and Mallik, S. (2016). Integrating multiple data sources for combinatorial marker discovery: A study in tumorigenesis. IEEE/ACM Trans. Comput. Biol. Bioinforma. 15, 673–687. doi:10.1109/TCBB.2016.2636207
Bandyopadhyay, S., Mallik, S., and Mukhopadhyay, A. (2014). A survey and comparative study of statistical tests for identifying differential expression from microarray data. IEEE/ACM TCBB 11, 95–115. doi:10.1109/TCBB.2013.147
Bhadra, T., Mallik, S., and Bandyopadhyay, S. (2017). Identification of multi-view gene modules using mutual information based hypograph mining. IEEE Trans. Syst. Man, Cybern. Syst. 49, 1119–1130. doi:10.1109/TSMC.2017.2726553
Bhadra, T., Mallik, S., and Mukherji, A. (2018). “DTFP–Growth: Dynamic threshold based FP–Growth rule mining algorithm through integrating gene expression, methylation and protein-protein interaction profiles,” in IEEE Transactions on Systems, Man, and Cybernetics: Systems (IEEE). doi:10.1109/TSMC.2017.2726553
Bhasin, M., and Raghava, G. P. S. (2004). SVM based method for predicting HLADRB1*0401 binding peptides in an antigen sequence. Bioinformatics 20, 421–423. doi:10.1093/bioinformatics/btg424
Cai, C. H. (1998). “Mining association rules with weighted items,” in Proceedings of the international database engineering and applications symposium (Cardiff, Wales, UK: IEEE Computer Society), 68–77.
Cheng, Y., and Church, G. M. (2000). “Biclustering of expression data,” in Proceedings of the 8th international conference on intelligent systems for molecular biology (Menlo Park, California, USA: AAAI Press), 93–103.
Chudasama, P., Renner, M., Straub, M., Mughal, S. S., Hutter, B., Kosaloglu, Z., et al. (2017). Targeting fibroblast Growth factor receptor 1 for treatment of soft-tissue sarcoma. Clin. Cancer Res. 23 (4), 962–973. doi:10.1158/1078-0432.CCR-16-0860
Creighton, C., and Hanash, S. (2003). Mining gene expression databases for association rules. Bioinformatics 19, 79–86. doi:10.1093/bioinformatics/19.1.79
Das, S., Kar, M. B., and Kar, S. (2013). Group multi-criteria decision making using intuitionistic multi-fuzzy sets. J. Uncertain. Analysis Appl. 10 (1), 10–16. doi:10.1186/2195-5468-1-10
Du, Y., Zhang, J., Meng, Y., Huang, M., Yan, W., and Wu, Z. (2020). MicroRNA-143 targets MAPK3 to regulate the proliferation and bone metastasis of human breast cancer cells. Amb. Expr. 10, 134. doi:10.1186/s13568-020-01072-w
Tao, F. (2003). “Weighted association rule mining using weighted support and significance framework,” in Proc. ACM SIGKDD (Washington D.C, USA: ACM), 661–666.
Ganguly, S., Kumar Shiva, C., and Mukherjee, V. (2018). Frequency stabilization of isolated and grid connected hybrid power system models. J. Energy Storage 19, 145–159. doi:10.1016/j.est.2018.07.014
Ganguly, S., Mahto, T., and Mukherjee, V. (2017). Integrated frequency and power control of an isolated hybrid power system considering scaling factor based fuzzy classical controller. Integr. Freq. power control Isol. hybrid power Syst. considering scaling factor based fuzzy Class. Control. Swarm Evol. Comput. 32, 184–201. doi:10.1016/j.swevo.2016.08.001
Ganguly, S., and Mukherjee, V. (2020). Frequency stabilization of isolated hybrid power system by a novel quasi-oppositional whale optimization algorithm. Iran. J. Sci. Technol. Trans. Electr. Eng. 44, 1467–1486. doi:10.1007/s40998-020-00341-5
Georgii, E., Richter, L., Ruckert, U., and Kramer, S. (2005). Analyzing microarray data using quantitative association rules. Bioinformatics 21, 123–129. doi:10.1093/bioinformatics/bti1121
Han, J., Pei, J., Yin, Y., and Mao, R. (2004). Mining frequent patterns without candidate generation: A frequent-pattern tree approach. Data Min. Knowl. Discov. 8, 53–87. doi:10.1023/b:dami.0000005258.31418.83
Jiang, D., Chun, T., and Aidong, Z. (2004). Cluster analysis for gene expression data: A survey. IEEE Trans. Knowl. Data Eng. 16, 1370–1386. doi:10.1109/tkde.2004.68
Liu, K. H., and Xu, C. G. (2009). A genetic programming-based approach to the classification of multiclass microarray datasets. Bioinformatics 25, 331–337. doi:10.1093/bioinformatics/btn644
Liu, S., Zhao, Y., Duan, R., Wu, Y., Chen, X., and Li, N. (2022). Identification of core genes associated with type 2 diabetes mellitus and gastric cancer by bioinformatics analysis. Ann. Transl. Med. 10 (5), 247. doi:10.21037/atm-21-3635
Liu, Y. C., Cheng, C. P., and Tseng, V. S. (2011). Discovering relational-based association rules with multiple minimum supports on microarray datasets. Bioinformatics 27 (22), 3142–3148. doi:10.1093/bioinformatics/btr526
Liu, Z., Macias, M. J., Bottomley, M. J., Stier, G., Linge, J., Nilges, P. M., et al. (1999). The three-dimensional structure of the HRDC domain and implications for the Werner and Bloom syndrome proteins, Res. Support 7 (12), 1557–1566. doi:10.1016/s0969-2126(00)88346-x
Madeira, S. C., and Oliveira, A. L. (2004). Biclustering algorithms for biological data analysis: A survey. IEEE Trans. Comput. Biol. Bioinforma. 1, 24–45. doi:10.1109/tcbb.2004.2
Mallik, S. (2013). “Integrated analysis of gene expression and genome-wide DNA methylation for tumor prediction: An association rule mining-based approach,” in Proc. IEEE Symposium on Computational Intelligence in Bioinformatics and Computational Biology (CIBCB), Singapore, 16-19 April 2013, 120–127. doi:10.1109/CIBCB.2013.6595397
Mallik, S., Mukhopadhyay, A., and Maulik, U. (2013). Integrated statistical and rule–mining techniques for DNA methylation and gene expression data analysis. J. Artif. Intell. Soft Comput. Res. 3 (2), 101–115. doi:10.2478/jaiscr-2014-0008
Mallik, S., Mukhopadhyay, A., and Maulik, U. (2015). Ranwar: Rank-based weighted association rule mining from gene expression and methylation data. IEEE Trans. Nanobioscience 14 (1), 59–66. doi:10.1109/tnb.2014.2359494
Mallik, S., and Zhao, Z. (2017a). Towards integrated oncogenic marker recognition through mutual information-based statistically significant feature extraction: An association rule mining based study on cancer expression and methylation profiles. Quant. Biol. 5 (4), 302–327. doi:10.1007/s40484-017-0119-0
Mallik, S., and Zhao, Z. (2017b). TrapRM: Transcriptomic and proteomic rule mining using weighted shortest distance based multiple minimum supports for multi-omics dataset. IEEE Int. Conf. Bioinforma. Biomed. (BIBM) 13-16, 2187–2194. doi:10.1109/BIBM.2017.8217997
Martella, F. (2009). Classification of microarray data with factor mixture models. Bioinformatics 22, 202–208. doi:10.1093/bioinformatics/bti779
Martinez, R., Pasquier, N., and Pasquier, C. (2008). GenMiner: Mining non-redundant association rules from integrated gene expression data and annotations. Bioinformatics 24, 2643–2644. doi:10.1093/bioinformatics/btn490
Maulik, U., Mallik, S., Mukhopadhyay, A., and Bandyopadhyay, S. (2015). Analyzing large gene expression and methylation data profiles using StatBicRM: Statistical biclustering-based rule mining. PLoS One 10 (4), 0119448. doi:10.1371/journal.pone.0119448
McIntosh, T., and Chawla, S. (2007). High confidence rule mining for microarray analysis. IEEE/ACM Trans. Comput. Biol. Bioinforma. 4, 611–623. doi:10.1109/tcbb.2007.1050
Mudi, J., Shiva, C. K., and Mukherjee, V. (2021b). An optimal control of integrated hybrid power system with FACTS devices using student psychology-based optimization algorithm. Adv. Theory Simul. 4, 2100147. doi:10.1002/adts.202100147
Mudi, J., Shiva, C. K., and Mukherjee, V. (2019). Multi-verse optimization algorithm for LFC of power system with imposed nonlinearities using three-degree-of-freedom PID controller. Iran. J. Sci. Technol. Trans. Electr. Eng. 43, 837–856. doi:10.1007/s40998-018-0166-1
Mudi, J., Shiva, C. K., and Mukherjee, V. (2022). Quasi-oppositional whale optimization optimized load frequency stabilization of hybrid power systems integrated with electric vehicle. Adv. Theory Simul. 5, 2100510. doi:10.1002/adts.202100510
Mudi, J., Shiva, C. K., Vedik, B., and Mukherjee, V. (2021a). Frequency stabilization of solar thermal-photovoltaic hybrid renewable power generation using energy storage devices. Iran. J. Sci. Technol. Trans. Electr. Eng. 45, 597–617. doi:10.1007/s40998-020-00374-w
Murphy, R. G., Gilmore, A., Senevirathne, S., O’Reilly, P. G., LaBonte Wilson, M., Jain, S., et al. (2022). Particle swarm optimization artificial intelligence technique for gene signature discovery in transcriptomic cohorts, Comput. Struct. Biotechnol. J. 20, 5547–5563. doi:10.1016/j.csbj.2022.09.033
Navarro, A., Yin, P., Monsivais, D., Lin, S. M., Du, P., Wei, J. J., et al. (2012). Genome-Wide DNA methylation indicates silencing of tumor suppressor genes in uterine leiomyoma. PLoS One 7 (3), 33284. doi:10.1371/journal.pone.0033284
Nivedhitha, M., Durai Raj Vincent, P. M., Srinivasan, K., and Chang, C. Y. (2020). Machine learning based computational gene selection models: A survey, performance evaluation, open issues, and future research directions. Front. Genet. 11, 603808. doi:10.3389/fgene.2020.603808
Paziewska, A., Dabrowska, M., Goryca, K., Antoniewicz, A., Dobruch, J., Mikula, M., et al. (2014). DNA methylation status is more reliable than gene expression at detecting cancer in prostate biopsy. Br. J. Cancer 111 (4), 781–789. doi:10.1038/bjc.2014.337
Pei, J. (2003). “MaPle: A fast algorithm for maximal pattern-based clustering,” in Proceedings of the 3rd IEEE international conference on data mining (Melbourne, Florida, USA: IEEE Computer Society), 259–266.
Peri, S., Navarro, J. D., Amanchy, R., Kristiansen, T. Z., Jonnalagadda, C. K., Surendranath, V., et al. (2003). Development of human protein reference database as an initial platform for approaching systems biology in humans. Genome Res. 13 (10), 2363–2371. doi:10.1101/gr.1680803
Pham, T. H., Park, H. M., Kim, J., Hong, J. T., and Yoon, D. Y. (2020). STAT3 and p53: Dual target for cancer therapy. Biomedicines 8 (12), 637. doi:10.3390/biomedicines8120637
Prelic, A., Bleuler, S., Zimmermann, P., Wille, A., Bühlmann, P., Gruissem, W., et al. (2006). A systematic comparison and evaluation of biclustering methods for gene expression data. Bioinformatics 22, 1122–1129. doi:10.1093/bioinformatics/btl060
Ramkumar, G. D., Ranka, S., and Tsur, S. (1998). “Weighted association rules: Model and algorithm,” in Proc. ACM SIGKDD. (New York, NY: ACM), 661–666.
Renner, M., Wolf, T., Meyer, H., Hartmann, W., Penzel, R., Ulrich, A., et al. (2013). Integrative DNA methylation and gene expression analysis in high-grade soft tissue sarcomas. Genome Biol. 14 (12), r137. doi:10.1186/gb-2013-14-12-r137
Robin, X., Turck, N., Alexandre, H., Tiberti, N., Lisacek, F., Sanchez, J. C., et al. (2011). pROC: an open-source package for R and S+ to analyze and compare ROC curves. BMC Bioinforma. 7, 77. doi:10.1186/1471-2105-12-77
Roy, B., and Vanderpooten, D. (1996). The European school of MCDA: Emergence, basic features and current works. J. Multi-Criteria Decis. Analysis 5 (1), 22–38. doi:10.1002/(sici)1099-1360(199603)5:1<22::aid-mcda93>3.0.co;2-f
Saaty, T. L. (1990). How to make a decision: The analytic hierarchy process. Interfaces 24 (6), 19–26. doi:10.1016/0377-2217(90)90057-i
Santh Rani, T. (2023). Network pharmacology and molecular docking study of the active ingredients in Saptasaram kashayam for the treatment of Polycystic ovary syndrome. Indian J. Biochem. Biophysics 60, 108–121. doi:10.56042/ijbb.v60i2.70684
Sharmila, S., and Vijayarani, S. (2019). Comparative analysis of fuzzy association rule mining algorithms. Int. J. Sci. Technol. Res. 8, 2277–8616.
Shen, Y. Y., and Mo, L. F. (2009). The max–min approach to a relativistic equation. Comput. Math. Appl. 58, 2131–2133. doi:10.1016/j.camwa.2009.03.056
Singh, S. K., and Ganesh Wayal, Mr.Mr (2012). Niresh sharma, A review: Data Mining with fuzzy association rule mining. Int. J. Eng. Res. Technol. (IJERT) 1 (5). doi:10.17577/IJERTV1IS5064
Smyth, G. (2004). Linear models and empirical bayes methods for assessing differential expression in microarray experiments. Stat. Appl. Genet. Mol. Biol. 3, 1–25. doi:10.2202/1544-6115.1027
Su, Y., Blake-Palmer, K. G., Sorrell, S., Javid, B., Bowers, K., Zhou, A., et al. (2008). Human H+ATPase a4 subunit mutations causing renal tubular acidosis reveal a role for interaction with phosphofructokinase-1. Am. J. Physiol. Ren. Physiol. 295 (4), F950–F958. doi:10.1152/ajprenal.90258.2008
Thalamuthu, A., Mukhopadhyay, I., Zheng, X., and Tseng, G. C. (2006). Evaluation and comparison of gene clustering methods in microarray analysis. Bioinformatics 22, 2405–2412. doi:10.1093/bioinformatics/btl406
Theilhaber, J., Chiron, M., Dreymann, J., Bergstrom, D., and Pollard, J. (2020). Construction and optimization of gene expression signatures for prediction of survival in two-arm clinical trials. BMC Bioinforma. 21 (1), 333. doi:10.1186/s12859-020-03655-7
Tseng, V. (2010). “UP-growth: An efficient algorithm for high utility itemsets mining,” in Proceedings of the 16th ACM SIGKDD international conference on knowledge discovery and data mining (Washington, DC, USA: ACM), 253–262.
Wang, W. (2000). “Efficient mining of weighted association rules,” in Proceedings of the sixth ACM SIGKDD international conference on Knowledge discovery and data mining (Boston, MA, USA: ACM), 270–274.
Yang, R., Lin, X., and Tao, C. (2021). Based on network pharmacology to explore the molecular mechanism of buzhong yiqi decoction for the treatment of gastric cancer. (Version 1) available at Research Square. doi:10.21203/rs.3.rs-1098024/v1
Yang, Z., Lu, S., Tang, H., Qu, J., Wang, B., Wang, Y., et al. (2022). Molecular targets and mechanisms of hedyotis diffusa-scutellaria barbata herb pair for the treatment of colorectal cancer based on network pharmacology and molecular docking. Evidence-Based Complementary Altern. Med. 2022, 1–15. doi:10.1155/2022/6186662
Yun, U., and Leggett, J. J. (2005). “Wfim: Weighted itemset mining with a weight range and a minimum weight,” in Proceedings of the SIAM international data mining conference (California, USA: Society of Industrial and Applied Mathematics, Newport Beach), 270–274.
Zaki, M. J. (2000). Scalable algorithms for association mining. IEEE Trans. Knowl. Data Eng. 12 (3), 372–390. doi:10.1109/69.846291
Keywords: multi-objective optimization, distance-based dynamic support threshold, multi-objective optimized association rule mining, multi-omics sarcoma data, empirical Bayes test
Citation: Mallik S, Seth S, Si A, Bhadra T and Zhao Z (2023) Optimal ranking and directional signature classification using the integral strategy of multi-objective optimization-based association rule mining of multi-omics data. Front. Bioinform. 3:1182176. doi: 10.3389/fbinf.2023.1182176
Received: 08 March 2023; Accepted: 19 June 2023;
Published: 27 July 2023.
Edited by:
Qi Zhao, University of Science and Technology Liaoning, ChinaReviewed by:
Somnath Ganguly, Bankura Unnayani Institute of Engineering, IndiaTongjun Gu, University of Florida, United States
Copyright © 2023 Mallik, Seth, Si, Bhadra and Zhao. This is an open-access article distributed under the terms of the Creative Commons Attribution License (CC BY). The use, distribution or reproduction in other forums is permitted, provided the original author(s) and the copyright owner(s) are credited and that the original publication in this journal is cited, in accordance with accepted academic practice. No use, distribution or reproduction is permitted which does not comply with these terms.
*Correspondence: Saurav Mallik, c2F1cmF2bXRlY2gyQGdtYWlsLmNvbQ==; Zhongming Zhao, WmhvbmdtaW5nLlpoYW9AdXRoLnRtYy5lZHU=
†These authors have contributed equally to this work
 Saurav Mallik
 Soumita Seth
 Amalendu Si5
 Tapas Bhadra
  Zhongming Zhao
