 Tomislav Baček
 Yufan Xu
 Liuhua Peng2
 Denny Oetomo
 Ying Tan
94% of researchers rate our articles as excellent or good
Learn more about the work of our research integrity team to safeguard the quality of each article we publish.
Find out more
ORIGINAL RESEARCH article
Front. Bioeng. Biotechnol., 28 March 2025
Sec. Biomechanics
Volume 13 - 2025 | https://doi.org/10.3389/fbioe.2025.1550710
This article is part of the Research TopicAssessment of Biomechanical Mechanism in the Context of Sports Injury Prevention or RehabilitationView all 12 articles
Human walking is highly adaptable, allowing individuals to maintain efficiency and stability across diverse conditions. However, how gait adapts to functional asymmetry remains poorly understood. This study addresses this gap by employing a within-subject design to isolate the effect of functional asymmetry using a unilateral knee constraint to emulate hemiparetic gait. This approach eliminates inter-individual variability present in previous studies. A dataset of 19 participants walking across 30 conditions was used to examine these adaptations in step length and push-off force in both absolute terms and symmetry metrics. Results reveal that functional asymmetry disproportionately impacts propulsion, with constrained-leg force decreasing significantly at higher speed, while step length symmetry remains stable. This suggests a prioritisation of spatial over kinetic symmetry, likely to optimise walking energetics and maintain anterior-posterior balance. Statistical models demonstrated good within-dataset performance but limited generalisability across dataset predictions, emphasising the challenges of applying models across studies of different designs. These findings highlight critical limitations in applying statistical models trained on healthy persons to patient populations and provide insights into key biomechanical adaptations that could inform individualised biofeedback strategies for hemiparetic patients. Understanding individual compensations for unilateral deficits could help refine rehabilitation interventions that target propulsion deficits and optimise gait symmetry.
Human walking is remarkably versatile, driven by complex adaptation mechanisms that allow individuals to maintain efficiency, stability, and control in a variety of conditions. Healthy individuals generally prefer to walk at a speed that minimises energy expenditure per unit of distance traveled (Ralston, 1958; Molen et al., 1972). To achieve this, they actively adjust gait variables, including step width (Donelan et al., 2001), step length (Minetti et al., 1995), step time (Ellis et al., 2013), and push-off force (Reimann et al., 2018), while avoiding penalties associated with asymmetries (Ellis et al., 2013). These adjustments vary with walking speed: changes in step width support lateral balance (Orendurff et al., 2004; Bruijn and Dieen, 2018), while changes in step length accommodate the increased demands of push-off (Donelan et al., 2002; Yanez et al., 2023), all while maintaining a sufficient margin of stability (Hak et al., 2013a). This adaptability allows people to seamlessly walk on slopes (Franz and Kram, 2012; Xie and Chien, 2024), in the presence of lateral perturbations (Frame et al., 2020; Bruijn and Dieen, 2018), or with physical changes of aging (Owings and Grabiner, 2004; Dean et al., 2007).
In contrast, hemiparetic individuals walk with slower speeds (Brandstater et al., 1983; Olney and Richards, 1996) and higher energetic cost (Stoquart et al., 2012) while exhibiting spatio-temporal asymmetries. These include the extended stance phase on the non-paretic side, prolonged swing phase on the paretic side (Kim and Eng, 2003), and reduced paretic propulsion (Bowden et al., 2006). The said asymmetries manifest in both spatio-temporal asymmetry (Wall and Turnbull, 1986; Hsu et al., 2003; Patterson et al., 2010) and asymmetries in push-off force and impulse (Lewek et al., 2018; Padmanabhan et al., 2020). Consequently, some patients take longer paretic steps while others take shorter ones (Kim and Eng, 2003). However, despite these differences and additional effort they need to exert to adapt, hemiparetic individuals can still independently adjust gait parameters, relying on strategies that include increased non-paretic propulsion or wider steps (Hak et al., 2013b; Lewek et al., 2014) to maintain stability and forward progression.
While much is known about gait adaptations in both healthy and patients, significant gaps remain. Many studies rely on speed-matching or age-matching healthy and patient groups, which fails to account for intrinsic biomechanical differences (Lim et al., 2022; Booij et al., 2021). Such approaches can mask critical insights by overlooking how baseline differences, such as muscle weakness, pain, or comorbidities, alter gait dynamics independently of age or walking speed. Moreover, walking speed alone is a limited indicator of gait function and recovery, providing an incomplete picture of metrics like step length and forward propulsion (Roelker et al., 2019). These limitations challenge the validity of using matched-group analyses or statistical models trained in healthy populations to explain or predict patient gait, as such models tend to overfit dataset-specific dynamics.
To address this gap, this study investigates how healthy individuals adapt their gait parameters across varying speeds and cadences under imposed functional asymmetry (i.e., a difference in the number of freely moving joints or their available range of motion between the two legs). Specifically, we leverage a within-subject design and a unilateral passive knee constraint—two key methodological features of the dataset described in (Baček et al., 2024). The within-subject design ensures that each participant serves as their own control, isolating the mechanical effects of functional asymmetry on step length and push-off force (forward propulsion) without the influence of neurological deficits common in patient populations. The unilateral knee constraint serves as a model for hemiparetic gait by restricting sagittal-plane knee movement, emulating the reduced knee flexion observed in stroke survivors (Ali et al., 2014). While this approach does not replicate neurological factors found in hemiparetic patients, such as spasticity, proprioceptive deficits, or altered neuromuscular control, it provides a controlled experimental setting for analysing compensatory gait adaptations. By systematically studying these adaptations, this work offers insights into rehabilitation strategies that target propulsion deficits and gait symmetry in stroke patients.
Step length and push-off force are key to understanding anterior-posterior balance (Bruijn and Dieen, 2018) and the metabolic and mechanical costs of walking (Donelan et al., 2002). These parameters are increasingly used as biofeedback targets in hemiparetic rehabilitation (Yanez et al., 2023), making it crucial to understand their interplay and adaptability across conditions. In studying this interplay, this work addresses three key research questions: (i) How does a unilateral knee constraint affect step length and push-off force at different walking speeds? (ii) Do individuals prioritise kinetic (propulsion) or spatial (step length) symmetry when adapting to asymmetry? (iii) To what extent can statistical models trained in free-walking data predict gait adaptations under constrained conditions, and what are the limitations of applying these models to clinical populations? Through this systematic analysis, this study provides new insights into gait compensation mechanisms, with potential applications in individualised biofeedback-based gait rehabilitation for stroke patients.
To address the three research questions, we analysed walking data from a publicly available dataset that includes both free and constrained walking conditions. The following section details the experimental design, data processing and analysis methods, and the definitions of key gait metrics examined.
A publicly available dataset from (Baček et al., 2023) was used to investigate the effects of functional gait asymmetry on step length (SL) and peak push-off force (PO) in this paper. We refer to this dataset as B24. In this context, functional asymmetry refers to a constrained condition in which a knee brace was used to unilaterally restrict knee joint movement. The dataset comprises data from 21 neurotypical young adults (age 30
The trials were conducted on a dual-belt instrumented treadmill, with each lasting 5 min. Participants completed a total of 30 trials: 15 without any constraints (hereafter referred to as Free) and 15 with their left knee joint fully extended via a passive knee brace (hereafter referred to as Constrained). In both conditions, participants walked at three speeds (0.4, 0.8, and 1.1 m/s) and five step frequencies peer speed, guided by a metronome (90%, 95%, 100%, 110%, and 120% of the preferred cadence, presented in random order). The 30 trials took place across two sessions on separate days, with 15 trials per day. The five cadences at each speed were organised into a continuous 25-min walking bout with no breaks between cadences. Bouts were arranged such that no two consecutive bouts involved the same walking conditions (either Free or Constrained) within a session, and all three speeds were included in each session. Marker data were collected at 100 Hz and ground reaction force (GRF) data at 1,000 Hz. Supplementary Figure A9 in Appendix gives an overview of the study design; a detailed description of the study is provided in (Baček et al., 2024).
The knee joint orthosis was designed in-house and consisted of two 3D-printed cuffs–one for the thigh and one for the shank–connected by two metal bars via a double-hinge joint. The cuffs were available in multiple sizes and could slide along the bars, allowing for quick manual adjustments to optimise fit and comfort relative to the participant’s knee joint. Each cuff was secured with two Boa straps, ensuring stability, and the orthosis was always worn on the left leg. To replicate the restricted knee flexion commonly observed in hemiparetic gait, the orthosis was locked in full extension (corresponding to a biological knee joint angle of 0°) using bolts at the hinge joints. However, due to soft tissue compliance, some residual knee flexion was observed across participants. The maximum recorded knee flexion angle during the swing phase at 1.1 m/s reached 15°, compared to the typical unconstrained knee flexion of 75° during swing. Supplementary Figure A10 in Appendix gives an overview of the study design; more detailed description and visualisation of the knee orthosis can be found in (Baček et al., 2024).
For this analysis, we separated the B24 dataset into four groups, corresponding to the left and right legs in each of the two conditions (Free and Constrained). We refer to the data from the left leg during unconstrained walking as Free Left and the data from the right leg as Free Right. Similarly, Constrained Left represents data from the left leg during constrained walking and Constrained Right refers to the data from the right leg during constrained walking. Note that it is always the left leg that is constrained during all Constrained walking in the experiment. Hence, Constrained Right is the data of the unconstrained right leg in the Constrained walking condition. Given the strong correlation of gait parameters between Free Left and Free Right, we use Free Left as the baseline for the Free condition.
All data processing–including filtering, segmenting, and grouping–was performed using custom-written scripts in Matlab 2024a. Raw GRF data were filtered using a low-pass Butterworth filter with a 6 Hz cut-off frequency (Winter 2009). The vertical component of the GRF signal was used to segment data into gait cycles, with a threshold set at 5% of the peak amplitude (e.g., for a 75 kg person, the threshold would be
Statistical modelling was done in Python 3.10.10 using statsmodels, scipy, and numpy packages, with a Linear Mixed Models (LMM) approach (Lindstrom and Bates, 1988). Each participant’s data was treated as a distinct group to account for constant anthropometric variables within each group while allowing variations in their gait metrics. Data from the left and right legs were modelled separately, treating peak push-off force (PO) and step length (SL) as response variables (model outputs), and walking speed, its square, and anthropometric data (sex, age, mass, leg length) as explanatory variables (model inputs). To account for multiple cadences per speed—a characteristic of the used dataset—we added additional model input to each model. In the case of PO model, we added cadence as this is the dataset’s defining feature and the leading difference between conditions at the same walking speed. In the case of SL model, we could not add cadence due to its direct relationship with speed and SL; instead, we added trailing limb angle (TA) due to its direct relationship with push-off force (Lewek et al., 2018). Both PO and SL models include a fixed effect for speed given the known relationship between the speed and the two response variables (Fukuchi et al., 2019a). Models also include a quadratic effect of speed, similar to the models in (Yanez et al., 2023), to account for non-linear relationship between speed and PO and SL, and a fixed intercept. In addition to these fixed effects, both models include a random slope for speed to account for the repeated measures structure of the B24 dataset and variability across participants. We report the best performing PO and SL models with speed variance, reflecting the average individual effect of speed.
Model estimation quality across combinations of independent variables (model inputs) was assessed using the Akaike Information Criterion (AIC), and we report AIC values for all models, along with the parameters for the best model for each model output. From the list of all models produced, we select ones with the lowest AIC values as final prediction models for those are the models of the highest estimation quality. We evaluate the predictive model performance using several complementary metrics, including R-Squared (
Statistical data analyses were conducted in Python 3.10.10 using scipy package. The effects of speed, cadence, and condition (free vs constrained) on gait variables were assessed using two-way repeated measures ANOVA (RMANOVA) at a significance level of
A gait cycle is defined as the time between two successive heel strikes of the same leg. Peak push-off force (PO) represents the maximum amplitude of the fore-aft component of the GRF during the stance phase, which spans from heel strike to toe-off of the same leg. Step length (SL) is the fore-aft distance between the two calcaneous (heel) markers at the time of the leading leg’s heel strike. Symmetry is defined as the percentage ratio between the two legs: left vs right for PO (100% indicating symmetry) and left vs left plus right for SL (50% indicating symmetry).
Trailing limb angle (TA) is defined as the maximum hip extension angle. The hip joint angle trajectory was calculated following the methods outlined in Research Methods in Biomechanics (Robertson et al., 2013) and according to International Society of Biomechanics (ISB) guidelines (Wu et al., 2002). Leg length was measured as the distance from the anterior superior iliac spine (ASIS) to the ipsilateral medial malleolus during static calibration in a standing position.
We trained models for peak push-off force (PO) and step length (SL) using combinations of walking speed and its square (
Table 1 provides Akaike Information Criterion (AIC) values for both model outputs (PO, SL), including all three model levels and four data groups. As the table shows, walking speed and either cadence (for PO model) or TA (for SL model) were the only model inputs that significantly improved model estimation quality (as indicated by low AIC values), while adding anthropometric variables as model inputs had minimal to no impact. For this reason, all further modelling of PO and SL is performed using Model2. Table 2 presents non-standardised weights of each model variable for the best overall model (Model3), specifically for the Free Right condition in the case of PO and the Constrained Left condition for SL. This is useful as it allows real-world interpretability of the effect of each model variable. For example, the speed coefficient (weight) in PO model corresponds to the change in peak push-off force in [N/kg] for a 1 [m/s] increase in speed. To understand the relative importance of each model variable, we also present standardised weights in Table 3. To do this, we calculated z-score for peak push-off force, step length, and continuous predictors to standardise them; sex is a categorical variable, so it does not need to be standardised. A more detailed analysis of model estimation quality can be found in the Appendix.

Table 1. AIC values [−] for PO and SL model estimation (Lower values mean better quality model).
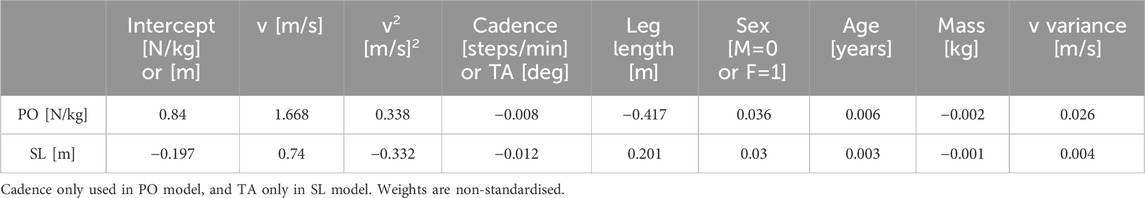
Table 2. Non-standardised weights for the model that best fit PO and SL overall (Model3).
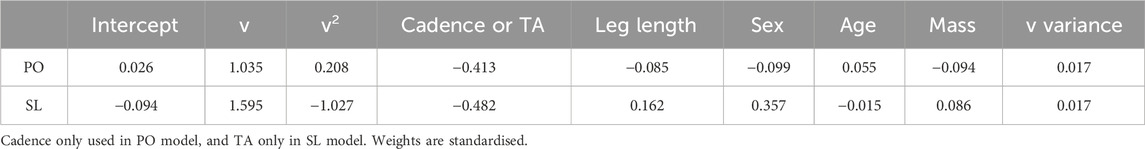
Table 3. Standardised weights for the model that best fit PO and SL overall (Model3).
Figure 1 illustrates the prediction of PO using a model trained on the Free Left data (left leg during free walking). The model accurately predicts PO of the contralateral (right) leg in free walking across all three speeds (Free Right; Figure 1, left), achieving a Mean Absolute Error (MAE) of 0.16 N/kg and a Mean Absolute Percentage Error (MAPE) of 14.3%. However, prediction accuracy decreases when applied to constrained walking (Constrained Right; Figure 1, right), particularly at higher walking speeds, where the model sometimes underestimates the measured force. This is reflected in lower
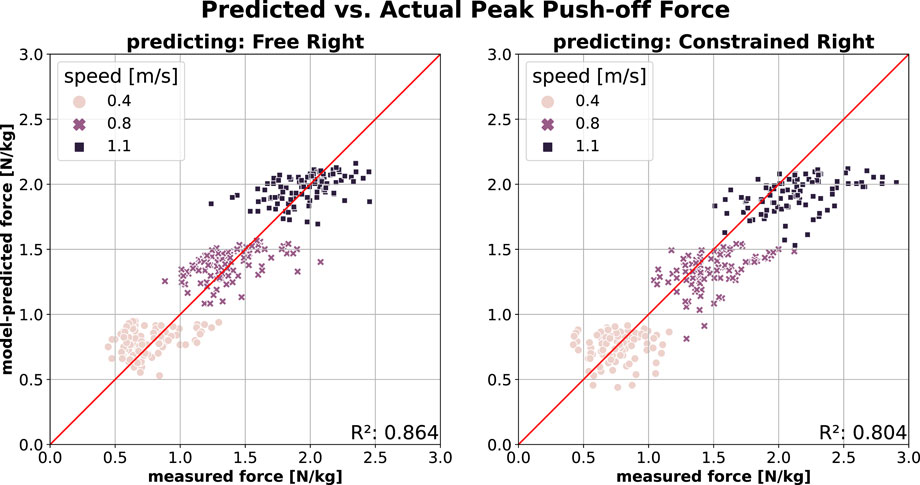
Figure 1. PO prediction of contralateral (i.e., right) leg using model trained on Free Left walking (Model2; model inputs:
Figure 2 shows the PO prediction across the two conditions (from free to constrained and vice versa). A model trained on the free walking data (Free Left) performs well in predicting PO in constrained walking (Constrained Left; Figure 2, left) at slow speed, though its accuracy decreases as speed increases. At higher speeds, the model tends to overestimate measured force, which is reflected in lower
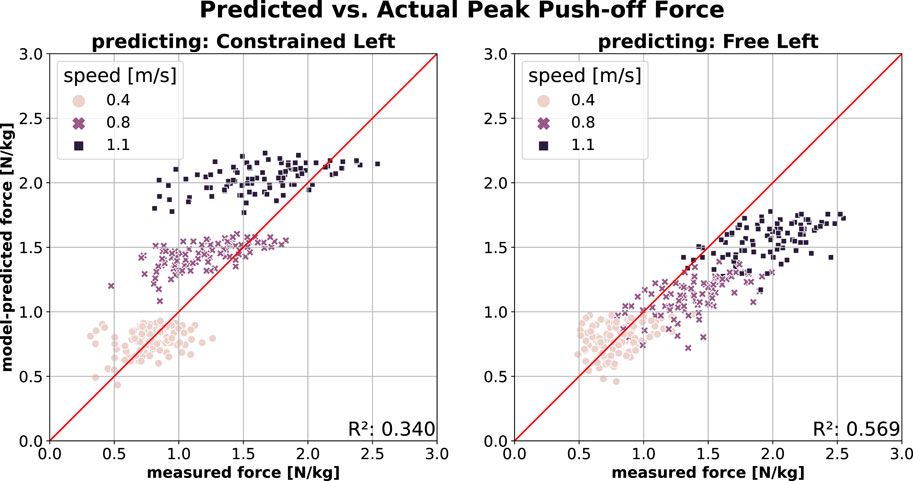
Figure 2. PO prediction across conditions (Free
Prediction of SL on the contralateral leg using a model trained on the free walking data (Free Left) is shown in Figure 3. The model predicts SL with comparable accuracy in both free walking (Free Right; Figure 3, left) and constrained walking (Constrained Right; Figure 3, right), though with slightly reduced accuracy in the latter. The difference is reflected by lower
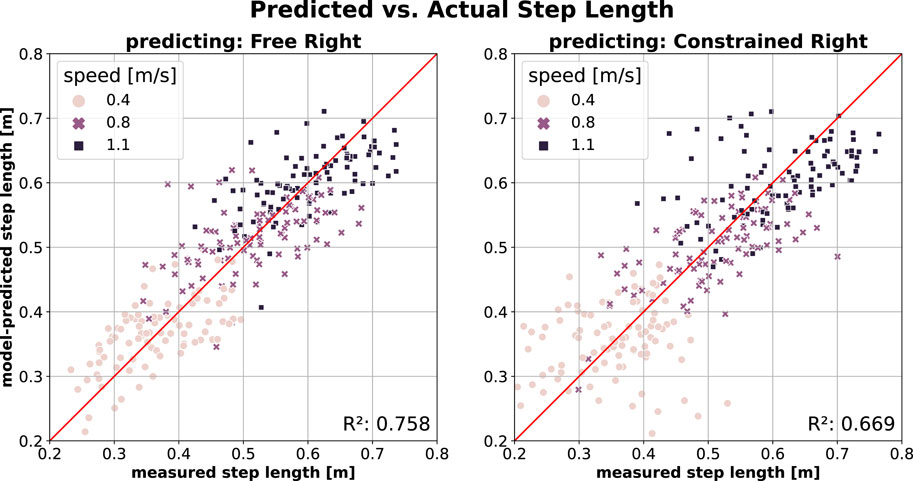
Figure 3. SL prediction of contralateral (i.e., right) leg using model trained on the Free Left walking data (Model2; model inputs:
Figure 4 illustrates SL prediction across conditions. Predicting SL for the constrained leg (Constrained Left) using a model trained on free walking data (Free Left; Figure 4, left) yields the best SL prediction performance, as reflected by the highest
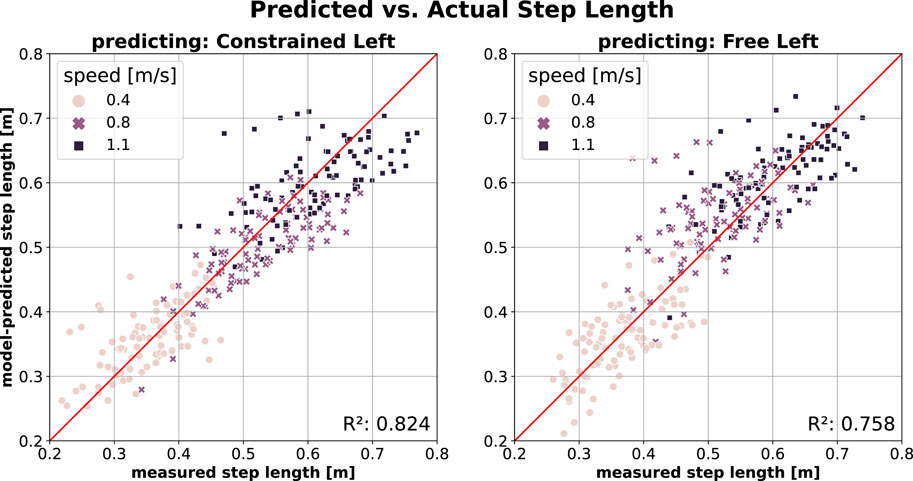
Figure 4. SL prediction across conditions (Free
As shown in Figure 1, the right leg generates peak push-off force (PO) consistent with predictions from a model trained on free walking, even when participants walked with constraints on their contralateral leg. Conversely, Figure 2 shows that this symmetry does not hold for the left leg during constrained walking, where the peak push-off force (PO) is lower than predicted by a model trained on free walking. This discrepancy suggests a change in PO symmetry, particularly at higher walking speeds.
Figure 5 (top) illustrates PO symmetry across conditions, supporting the observations discussed above. During free walking (blue bars), participants on average displayed strong symmetry in their propulsive forces at 0.8 m/s (101.2
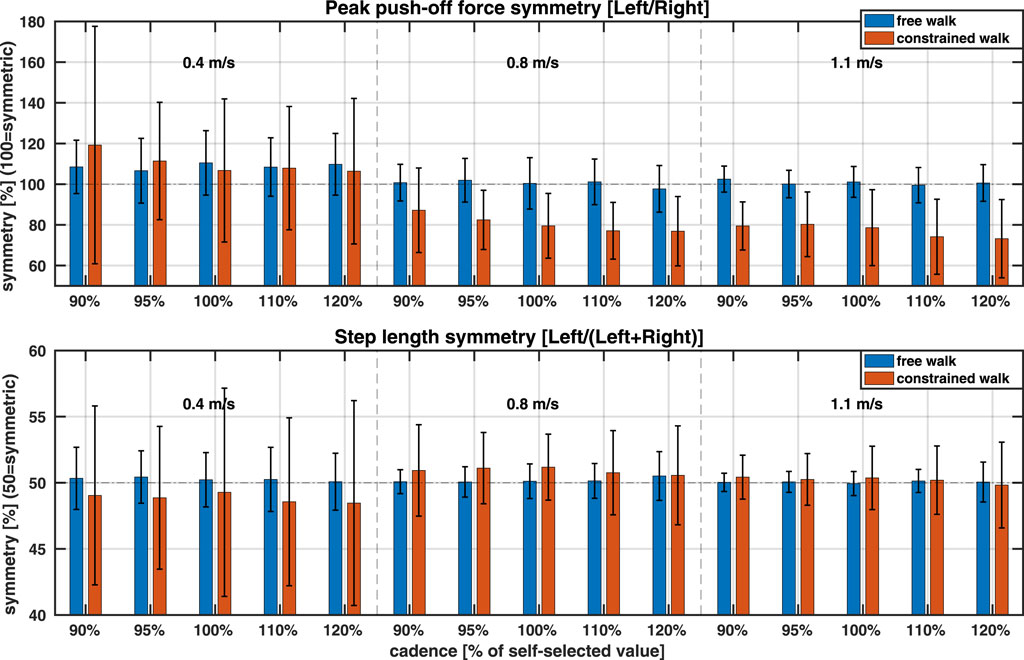
Figure 5. PO and SL symmetry. Data are average across all participants. Three walking speeds are separated by vertical dashed lines, and two conditions (free, constrained) are colour-coded. Horizontal dashed lines indicate perfect symmetry. Note different definitions of the symmetry between PO and SL (Top) Peak push-off force symmetry (values below 100 indicate more force by the right leg) (Bottom) Step length symmetry (values below 50 indicate shorter left step).
Applying a knee brace on the left leg affected PO symmetry, particularly at 0.8 and 1.1 m/s. At the slowest speed (0.4 m/s), the constraint increased PO symmetry variability, although average PO symmetry remained similar to that during free walking (blue vs red bars;
The modelling of SL, depicted in Figures 3, 4, indicated there should be no major asymmetries in SL across speeds in either free or constrained walking. The SL symmetry visualisation in Figure 5 (bottom) confirms this observation. During free walking (blue bars), participants on average walked with strong SL symmetry across all three speeds (50.3
In this study, we investigated how healthy young adults adapt their step length and push-off force across varying speeds and cadences during both unconstrained (free) walking and mechanically constrained (emulated hemiparetic) walking. Using statistical models, we quantified these adaptations in absolute terms and evaluated the predictive capacity of these models using an independent, publicly available dataset. Furthermore, we examined how step length (SL) and peak push-off force (PO) symmetries evolved under different conditions, offering insight into the underlying biomechanical strategies governing gait adjustments.
A key finding of this study is that, despite the imposed asymmetry, participants largely preserved SL symmetry, while PO symmetry was significantly reduced. This suggests that when neural control remains intact, individuals prioritise maintaining a consistent spatial gait pattern at the expense of kinetic symmetry. This contrasts with observations in hemiparetic gait, where step length asymmetries are more pronounced (Hsu et al., 2003; Kim and Eng, 2003), highlighting the distinct biomechanical trade-offs in neurologically intact versus impaired populations. Furthermore, we found that the extent of asymmetry adaptation varied across speeds and cadences, demonstrating that functional asymmetry does not induce uniform compensatory strategies but rather context-dependent adjustments.
Another novel contribution is the evaluation of model generalisability. Models trained on free-walking conditions performed well within their respective datasets but showed reduced predictive accuracy when applied to constrained conditions. This underscores the importance of dataset-specific characteristics in gait prediction and suggests that current statistical models may not fully capture the complexity of functional asymmetry adaptations. Our findings highlight the need for hybrid approaches that refine statistical models through broader training datasets and enhanced parameterisation to improve robustness across diverse walking conditions.
Human gait is often analysed by comparing adaptations between groups, such as speed- or age-matched designs (Dean et al., 2007; Frame et al., 2020). However, these approaches do not account for biomechanical variations independently of speed or age, a limitation that is particularly relevant in patient populations (Ali et al., 2014). The dataset used in this study (Baček et al., 2024) overcomes this by employing a unique within-subject design, isolating gait adaptations due to functional asymmetry from external factors such as muscle weakness. To achieve this, participants walked with a unilateral passive knee brace that restricted left knee flexion, limiting ankle plantarflexion during push-off and prompting compensatory gait adjustments similar to those observed in hemiparetic patients (Baček et al., 2022). Given that higher walking speeds naturally demand greater joint mobility (Mentiplay et al., 2018), we expected increasing speed to pose a greater challenge–an expectation confirmed by our results. While a metronome guided step frequency, participants were allowed small adjustments in step length (SL), step time (ST), and their symmetries, provided their overall stride length and time matched the treadmill-imposed speed.
We developed models to predict the absolute amplitude of peak push-off force (PO; a component of the GRF in the anterior-posterior direction) and step length (SL) using gait speed and anthropometric variables. Additionally, cadence was included in the PO model, and trailing limb angle (TA) in the SL model. Previous studies have developed similar models for SL (Park et al., 2021), SL and PO (Yanez et al., 2023), or alternatively, for joint angles and moments (Lelas et al., 2003; Fukuchi et al., 2019b; Fukuchi and Duarte, 2019). However, these studies primarily focused on free walking, aiming to predict gait variables or develop biofeedback targets for clinical applications as alternatives to normative values based on age and sex (Chao et al., 1983; Oberg et al., 1993). In contrast, our study examined the effects of functional asymmetry on SL and PO and explored whether these variables adapt differently across walking speeds.
During free walking, model accuracy was predominantly influenced by speed and speed squared, with anthropometric variables contributing minimally (see Table 1). This finding was consistent for both SL and PO and aligns with results reported by (Yanez et al., 2023). A comparison to (Park et al., 2021) was not possible, as their modelling was limited to a fixed speed. Due to the dataset’s unique design, which included five cadences per speed, our models also benefited from additional inputs–cadence for PO and trailing limb angle for SL–allowing them to account for enforced variations in SL (and consequently, PO) at the same walking speeds.
Models trained on free walking (Free Left) demonstrated high accuracy in predicting PO (Figure 1, left) and SL (Figure 3, left) for the contralateral leg (Free Right). This suggests that both legs exhibit similar behaviours at a given speed and cadence. Notably, these models also predicted PO (Figure 1, right) and SL (Figure 3, right) for the unconstrained contralateral leg during constrained walking (Constrained Right) with only a slight reduction in accuracy, as measured by
This result is particularly interesting, as it suggests that the unconstrained (right) leg remains largely unaffected by the knee brace applied to the left leg. The most noticeable reduction in prediction accuracy happens at higher speeds in PO, indicating that participants relied more on their unconstrained leg as walking became more challenging. This aligns with findings in hemiparetic patients, where reliance on the unaffected leg increases, albeit independently of speed (Roelker et al., 2019). Conversely, SL prediction accuracy remained stable across speeds, with increased data dispersion across all speeds contributing to minor reductions in prediction quality. Our findings also revealed a lower prediction accuracy for SL compared to PO, consistent with (Yanez et al., 2023), despite their evaluations being based on an independent walking dataset.
We further evaluated model prediction accuracy for PO and SL in the left leg between conditions–transitioning from free to constrained walking and vice versa. As shown in Figure 2 (left), the model trained on free walking (Free Left) accurately predicted PO for the constrained leg (Constrained Left) at slow speeds. However, as speed increased, the model progressively overestimated PO of the constrained (left) leg, indicating that participants produced lower-than-predicted peak push-off forces under constraint. Since the same individuals contributed data for both conditions, this reduction is likely due to the mechanical restriction of the extended knee rather than musculoskeletal limitations such as weakness or impaired neuromuscular control.
This adaptation resembles, though is not identical to, the concept of a propulsive reserve observed in elderly individuals (Franz and Kram, 2012) and hemiparetic patients (Lewek et al., 2018) at their preferred walking speeds. It is plausible that all three groups–hemiparetic patients, elderly individuals, and healthy young adults walking with functional asymmetry (as in this study) – adopt a strategy of generating lower-than-available push-off forces as a preferred compensatory response to impairment, aging, or imposed constraints.
Unlike PO, SL prediction remained unaffected by the addition of the knee constraint (Figure 4). This is unexpected given the critical role that SL modulation plays in maintaining gait stability in the sagittal plane (Hak et al., 2013a; Bruijn and Dieen, 2018); as we’ve shown in (Baček et al., 2025), adaptations in step width are not the source of this. The fact that the knee constraint did not affect absolute SL in the constrained leg compared to the free leg suggests that participants did not rely on SL modulation to adjust stability in the sagittal plane. Instead, they may have prioritised walking energetics over stability. At increasing speeds, humans typically increase both step length and step frequency (Kuo, 2001) to avoid the metabolic penalties associated with disproportionately increasing one over the other (Donelan et al., 2002). If the imposed constraint led to a decrease in stability, participants may have adopted alternative strategies for fore-aft stability modulation (Reimann et al., 2018), or the stability reduction may have remained within tolerable limits, supporting the notion that humans prioritise sufficient rather than maximal gait stability (Hak et al., 2013a).
Healthy young adults typically exhibit kinetic symmetry at walking speeds below 1.5 m/s. This includes symmetry in vertical, braking, and propulsive GRF components (Polk et al., 2017), as well as in propulsive and vertical impulses (Seeley et al., 2008). Our findings align with this: during free walking, participants displayed strong symmetry in peak push-off force at 0.8 and 1.1 m/s, with a slightly higher force on the left leg at 0.4 m/s (Figure 5). Notably, this symmetry persisted across varying step frequencies, even when they walked at non-preferred stride lengths and times (i.e., 90, 95, 110, and 120% of preferred cadence).
Similarly, participants exhibited symmetry in forward (propulsive) and vertical (weight support) impulses, calculated as the ratio of left to right impulses (100% = symmetric). During free walking, weight bearing impulse symmetry showed a slight right-leg dominance (97.65
Young adults also exhibit strong symmetry in spatial and temporal step parameters. As speed increases, step length (SL) and step time (ST) increase concurrently, likely to optimise metabolic efficiency (Donelan et al., 2002). In the absence of musculoskeletal impairments, humans select an optimal combination of stride time and stride length at any given speed to minimise metabolic cost (Ralston, 1958) by maintaining equal SLs and STs across both legs, thus avoiding metabolic penalties associated with step asymmetry (Ellis et al., 2013; Stenum and Choi, 2021). Our results align with these findings: during free walking, participants exhibited strong SL symmetry across all speeds and cadences (Figure 5, bottom). Based on the symmetry criteria from (Allen et al., 2011) – where SL is considered symmetric if it falls within the range of 46.5%–53.5% using the same symmetry definition as in this study–all but one participant (at 0.4 m/s) exhibited symmetric SL (see Supplementary Figure A3 (left) in Appendix). Similarly, participants also exhibited strong ST symmetry across speeds and conditions2, suggesting that metabolic efficiency remained a key gait priority.
During constrained walking, significant changes in peak push-off (PO) symmetry were observed. At 0.4 m/s, PO symmetry varied considerably across individuals. Notably, three participants shifted from a longer left step (PO symmetry
The reduction in left-leg propulsion mirrors findings in stroke patients, where lower paretic propulsion–analogous to the constrained left leg–is compensated by greater non-paretic propulsion, corresponding here to the right leg. With an average PO asymmetry of 80% (Figure 5, top) and a propulsive impulse asymmetry of 72% (see Appendix), our participants resemble mild to moderate stroke patients classified by (Bowden et al., 2006). In their study, mild stroke patients had a propulsive impulse asymmetry of 49%, moderate patients 36%, and severe patients 16% (calculated as the paretic propulsive impulse divided by the total impulse). When converting our symmetry calculation to match (Bowden et al., 2006), PO asymmetry comes to
Functional asymmetry had the least impact on SL symmetry at 1.1 m/s and the highest at 0.4 m/s. At 1.1 m/s, variability in SL symmetry increased slightly. At 0.4 m/s, SL symmetry shifted on average from slightly longer left steps (symmetry
Consistent with patient populations (Balasubramanian et al., 2007; Allen et al., 2011), most participants walked with equal or longer steps on the constrained (left) leg. However, unlike the slow speeds typically preferred by stroke patients with higher paretic SL (Allen et al., 2011), our participants with SL asymmetry above 52.5% predominantly walked at 0.8 and 1.1 m/s (7/11 subjects; Supplementary Figure A3). This suggests that increasing speed tends to amplify SL asymmetry, with participants taking longer steps on the constrained leg. Interestingly, deviations in SL symmetry, while remaining within a few percentage points of perfect symmetry (50%), mirrored changes in PO symmetry: participants with reduced constrained-leg propulsion (PO symmetry
This suggests a mechanical relationship between step length and propulsive forces, achieved through coordinated control of trunk progression via the stance leg and the timing and positioning of the swing leg. For our participants–most of whom took equal or longer left steps despite PO asymmetry–it appears that both mechanisms were engaged. At faster speeds (0.8 and 1.1 m/s), participants took longer steps with their constrained leg. Concurrently, as shown in (Baček et al., 2025), increased right-leg PO in our study facilitated forward CoM progression during the right-leg stance phase, a strategy also employed in patient populations to maintain SL symmetry above 50% despite propulsive deficits.
While propulsive deficits are common in patient populations–regardless of step length asymmetry–forward CoM progression is primarily used when walking with longer paretic steps. Alternative strategies, such as bilateral hip compensation, are often employed to maintain symmetric steps (Allen et al., 2011). Although our study did not analyse joint moments or powers, anecdotal reports of hip fatigue among participants with symmetric SL suggest that they may have adopted similar compensatory mechanisms. Further investigation would be needed to confirm this hypothesis.
Statistical gait models, as argued by (Yanez et al., 2023), can serve as individualised biofeedback targets for patients, offering insights into gait pattern deficits. Unlike machine learning models, statistical models provide transparency by revealing not only if, but how, independent gait variables influence the dependent outcome. However, model performance reflects both model design and underlying gait dynamics, necessitating multiple cross-dataset predictions to disentangle these factors.
Models developed by (Yanez et al., 2023) were trained on the same F18 dataset as used here3. Their model evaluations done using Akaike Information Criterion (AIC) found that gait speed alone is sufficient to predict peak push-off force (PO). Our findings confirm this for both F18 and B24 datasets (Supplementary Table A2). Importantly, we show that including different gait parameters and participant cohorts significantly affects model estimation quality. For example, constrained walking data from B24 and the Elderly cohort from F18 posed significant challenges for model estimation, whereas models trained on B24 free walking performed best. This improvement was most pronounced when accounting for multiple cadences per speed (Model1
Cross-dataset predictions of PO presented herein (B24
Similar to PO models, SL model estimation performed well with speed alone as a model input, with AIC evaluations confirming that anthropometric variables add minimal value (Supplementary Table A4). The inclusion of trailing limb angle (TA) as an additional variable (Model2) improved SL model estimation in B24, where multiple cadences per speed were tested–an improvement analogous to the role of cadence in PO modelling. These findings align with (Yanez et al., 2023), which also found speed to be a primary predictor for SL while identifying modeling challenges for the Elderly cohort. Unlike PO estimation, constraints had less impact on SL estimation quality. Interestingly, the B24 Constrained Right dataset (Model2 and Model3) yielded the most accurate SL models across all conditions, outperforming models trained on F18 data. This suggests that SL dynamics may be less sensitive to constraints than PO, possibly due to compensatory mechanisms that stabilise spatial gait parameters even under altered gait conditions.
SL predictions within the F18 dataset, from Young to Elderly and vice versa, performed similarly to cross-dataset predictions in (Yanez et al., 2023), with
As shown in Supplementary Figure A8, age did not improve predictions between B24 and F18 Young cohorts (or vice versa), as expected due to the similar age distributions. Surprisingly, adding age worsened B24
Overall, these findings demonstrate that while statistical models can effectively predict SL and PO across datasets, their performance depends on the range and characteristics of the training data. Variations in population dynamics (e.g., age, cadence variability) and experimental design (e.g., speed ranges, constraints) highlight the need for diverse and representative datasets to improve model generalisability. Importantly, the findings also caution against over-reliance on anthropometric variables, which may enhance estimation metrics like AIC but often degrade cross-dataset performance, underscoring the need for rigorous model evaluation.
This study provides invaluable insights into human gait adaptations, but it does not come without limitations. First, our cohort comprises only healthy young adults, limiting the generalisability of the presented findings. Although our experimental design intentionally excludes confounding factors common in patient populations, such as reduced strength or neuromuscular control, it is possible that elderly participants or individuals with other impairments would respond differently to imposed functional asymmetry. Second, the passive knee brace used to induce asymmetry and emulate hemiparetic gait does not replicate the biomechanical complexities of pathological conditions, such as stroke, where spasticity and sensory deficits play a significant role in gait adaptations. Third, while the study examines a wide range of walking speeds and cadences, it excludes extreme speeds typically found in clinical populations (e.g., 0.2 m/s and 1.3 m/s), where distinct gait dynamics are known to govern gait patterns. Finally, our focus on short-term gait adaptations within 5 minutes of each condition leaves longer-term compensatory strategies and motor learning unexplored and unknown. Addressing these limitations in future research would enhance the clinical relevance and broader applicability of these findings.
This study explored how healthy young adults adapt their gait in response to functional asymmetry induced by a unilateral knee constraint, focusing on step length (SL) and push-off force (PO) across varying walking speeds and cadences. The findings reveal distinct adaptation strategies, with participants prioritising spatial over kinetic symmetry, particularly at higher speeds. While SL remained relatively stable across conditions, propulsive force on the constrained leg decreased significantly, prompting compensatory increases in the non-constrained leg’s propulsion. These adaptations align with patterns observed in hemiparetic populations, suggesting shared biomechanical strategies for managing asymmetry.
The results underscore the importance of understanding individual gait adaptations to functional asymmetry, offering valuable insights for rehabilitation strategies in clinical populations. By isolating the effects of a constrained joint on walking dynamics, this study provides a framework for future investigations into the mechanisms underlying asymmetrical gait and highlights the role of biomechanical trade-offs in maintaining efficiency and stability during walking.
Future research should explore how these findings translate to clinical populations. As a next step, our upcoming study–recently approved by the ethics board–will replicate the walking conditions from (Baček et al., 2024) in hemiparetic patients to assess the relevance of the observed compensatory mechanisms in real-world rehabilitation settings. Additionally, this study did not examine joint and limb moment or power analysis, which are crucial for refining these insights and broadening their applicability to diverse patient populations. Investigating longer-term adaptations to functional asymmetry and the role of neuromuscular factors could further enhance gait retraining strategies and support individualised interventions.
Publicly available datasets were analyzed in this study. This data can be found here: Bacek, T., Sun, M., Liu, H., Chen, Z., Manzie, C., Burdet, E., et al. (2023). A biomechanics and energetics dataset of healthy young adults walking with and without kinematic constraints. figshare doi: https://figshare.com/s/b625dafe53f4f83e21cd519. Fukuchi, C., Fukuchi, R., Duarte, M. (2018): A public data set of overground and treadmill walking kinematics and kinetics of healthy individuals. figshare. Fileset. 10.6084/m9.figshare.5722711.v2.
This paper uses two publicly available datasets which, when collected, were approved by their corresponding ethics committees: Bacek et al. by the University of Melbourne, Australia (2021-20623-13486-3), and Fukuchi et al. by the Federal University of ABC, Brazil (CAAE: 53063315.7.0000.5594). The studies were conducted in accordance with the local legislation and institutional requirements. In both cases, participants were asked to sign an informed consent form.
TB: Conceptualization, Formal Analysis, Funding acquisition, Investigation, Methodology, Project administration, Supervision, Visualization, Writing–original draft, Writing–review and editing. YX: Formal Analysis, Visualization, Writing–review and editing. LP: Methodology, Supervision, Writing–review and editing. DO: Methodology, Conceptualization, Supervision, Funding Acquisition, Writing–review and editing. YT: Methodology, Conceptualization, Supervision, Funding Acquisition, Writing–review and editing.
The author(s) declare that financial support was received for the research and/or publication of this article. This work was supported by the Australian Research Council’s Discovery Project schemes (DP190100916, DP240100938) and the University of Melbourne’s Early Career Researcher Grant scheme (ECRG143), supporting the corresponding author.
The authors would like to thank Prof. Gavin Williams, PhD FACP, from Epworth Hospital and The University of Melbourne, for his support in the study’s preparation and his expertise in interpreting the results and situating them within a broader context.
The authors declare that the research was conducted in the absence of any commercial or financial relationships that could be construed as a potential conflict of interest.
The author(s) declare that no Generative AI was used in the creation of this manuscript.
All claims expressed in this article are solely those of the authors and do not necessarily represent those of their affiliated organizations, or those of the publisher, the editors and the reviewers. Any product that may be evaluated in this article, or claim that may be made by its manufacturer, is not guaranteed or endorsed by the publisher.
The Supplementary Material for this article can be found online at: https://www.frontiersin.org/articles/10.3389/fbioe.2025.1550710/full#supplementary-material
1R-Squared: represents the proportion of variance in the dependent variable predictable from the independent variables. MAE: provides the average magnitude of prediction errors, disregarding direction. MAPE: measures accuracy as a percentage, offering an intuitive view of model performance.
2Temporal gait aspects, including step time, swing time, and double stance time, as well as their symmetries will be analysed in our future work.
3Note that (Yanez et al., 2023) included the full range of speeds and combined Young and Elderly data in all models.
Ali, S. J., Ansari, A. N., Rahman, A., Imtiyaz, S., and Rashid, B. (2014). Post-stroke hemiplegic gait: a review. Pharma Innov. 3, 36–41.
Allen, J. L., Kautz, S. A., and Neptune, R. R. (2011). Step length asymmetry is representative of compensatory mechanisms used in post-stroke hemiparetic walking. Gait posture 33, 538–543. doi:10.1016/j.gaitpost.2011.01.004
Baček, T., Oetomo, D., and Tan, Y. (2025). “Gait adaptations under functional asymmetry: exploring the role of step width, step length, and com in lateral stability,” in 2025 international Conference on rehabilitation robotics (ICORR).
Baček, T., Sun, M., Liu, H., Chen, Z., Kulić, D., Oetomo, D., et al. (2022). “Varying joint patterns and compensatory strategies can lead to the same functional gait outcomes: a case study,” in 2022 international conference on rehabilitation robotics (ICORR), 1–6.
Baček, T., Sun, M., Liu, H., Chen, Z., Manzie, C., Burdet, E., et al. (2023). A biomechanics and energetics dataset of healthy young adults walking with and without kinematic constraints. figshare. doi:10.26188/c.6887854.v1
Baček, T., Sun, M., Liu, H., Chen, Z., Manzie, C., Burdet, E., et al. (2024). A biomechanics and energetics dataset of neurotypical adults walking with and without kinematic constraints. Sci. Data 11, 646. doi:10.1038/s41597-024-03444-4
Balasubramanian, C. K., Bowden, M. G., Neptune, R. R., and Kautz, S. A. (2007). Relationship between step length asymmetry and walking performance in subjects with chronic hemiparesis. Archives Phys. Med. Rehabilitation 88, 43–49. doi:10.1016/j.apmr.2006.10.004
Booij, M. J., Meinders, E., Sierevelt, I. N., Nolte, P. A., Harlaar, J., and van den Noort, J. C. (2021). Matching walking speed of controls affects identification of gait deviations in patients with a total knee replacement. Clin. Biomech. 82, 105278. doi:10.1016/j.clinbiomech.2021.105278
Bowden, M. G., Balasubramanian, C. K., Neptune, R. R., and Kautz, S. A. (2006). Anterior-posterior ground reaction forces as a measure of paretic leg contribution in hemiparetic walking. Stroke 37, 872–876. doi:10.1161/01.STR.0000204063.75779.8d
Brandstater, M., Debruin, H., Gowland, C., and Clark, B. (1983). Hemiplegic gait: analysis of temporal variables. Archives Phys. Med. rehabilitation 64, 583–587.
Bruijn, S., and Dieen, J. V. (2018). Control of human gait stability through foot placement. J. R. Soc. Interface 15, 20170816. doi:10.1098/rsif.2017.0816
Chao, E. Y., Laughman, R. K., Schneider, E., and Stauffer, R. N. (1983). Normative data of knee joint motion and ground reaction forces in adult level walking. J. Biomechanics 16, 219–233. doi:10.1016/0021-9290(83)90129-x
Dean, J. C., Alexander, N. B., and Kuo, A. D. (2007). The effect of lateral stabilization on walking in young and old adults. IEEE Trans. Biomed. Eng. 54, 1919–1926. doi:10.1109/tbme.2007.901031
Donelan, J. M., Kram, R., and Kuo, A. D. (2001). Mechanical and metabolic determinants of the preferred step width in human walking. Proc. R. Soc. B Biol. Sci. 268, 1985–1992. doi:10.1098/rspb.2001.1761
Donelan, J. M., Kram, R., and Kuo, A. D. (2002). Mechanical work for step-to-step transitions is a major determinant of the metabolic cost of human walking. J. Exp. Biol. 205, 3717–3727. doi:10.1242/jeb.205.23.3717
Ellis, R., Howard, K., and Kram, R. (2013). The metabolic and mechanical costs of step time asymmetry in walking. Proc. Biol. Sci./R. Soc. 280, 20122784. doi:10.1098/rspb.2012.2784
Frame, H. B., Finetto, C., Dean, J. C., and Neptune, R. R. (2020). The influence of lateral stabilization on walking performance and balance control in neurologically-intact and post-stroke individuals. Clin. Biomech. 73, 172–180. doi:10.1016/j.clinbiomech.2020.01.005
Franz, J. R., and Kram, R. (2012). The effects of grade and speed on leg muscle activations during walking. Gait Posture 35, 143–147. doi:10.1016/j.gaitpost.2011.08.025
Fukuchi, C. A., and Duarte, M. (2019). A prediction method of speed-dependent walking patterns for healthy individuals. Gait Posture 68, 280–284. doi:10.1016/j.gaitpost.2018.12.006
Fukuchi, C. A., Fukuchi, R. K., and Duarte, M. (2018a). A public dataset of overground and treadmill walking kinematics and kinetics in healthy individuals. PeerJ 6, e4640. doi:10.7717/peerj.4640
Fukuchi, C. A., Fukuchi, R. K., and Duarte, M. (2018b). A public dataset of overground and treadmill walking kinematics and kinetics in healthy individuals. PeerJ 6, e4640. doi:10.7717/peerj.4640
Fukuchi, C. A., Fukuchi, R. K., and Duarte, M. (2019a). Effects of walking speed on gait biomechanics in healthy participants: a systematic review and meta-analysis. Syst. Rev. 8, 153. doi:10.1186/s13643-019-1063-z
Fukuchi, C. A., Fukuchi, R. K., and Duarte, M. (2019b). Test of two prediction methods for minimum and maximum values of gait kinematics and kinetics data over a range of speeds. Gait Posture 73, 269–272. doi:10.1016/j.gaitpost.2019.07.500
Hak, L., Houdijk, H., Beek, P., and Dieen, J. V. (2013a). Steps to take to enhance gait stability: the effect of stride frequency, stride length, and walking speed on local dynamic stability and margins of stability. PloS one 8, e82842. doi:10.1371/journal.pone.0082842
Hak, L., Houdijk, H., van der Wurff, P., Prins, M. R., Mert, A., Beek, P. J., et al. (2013b). Stepping strategies used by post-stroke individuals to maintain margins of stability during walking. Clin. Biomech. 28, 1041–1048. doi:10.1016/j.clinbiomech.2013.10.010
Hsu, A.-L., Tang, P.-F., and Jan, M.-H. (2003). Analysis of impairments influencing gait velocity and asymmetry of hemiplegic patients after mild to moderate stroke11No commercial party having a direct financial interest in the results of the research supporting this article has or will confer a benefit upon the authors(s) or upon any organization with which the author(s) is/are associated. Archives Phys. Med. Rehabilitation 84, 1185–1193. doi:10.1016/s0003-9993(03)00030-3
Kim, C., and Eng, J. J. (2003). Symmetry in vertical ground reaction force is accompanied by symmetry in temporal but not distance variables of gait in persons with stroke. Gait Posture 18, 23–28. doi:10.1016/s0966-6362(02)00122-4
Kuo, A. D. (2001). A simple model of bipedal walking predicts the preferred speed-step length relationship. J. Biomech. Eng. 123, 264–269. doi:10.1115/1.1372322
Lelas, J. L., Merriman, G. J., Riley, P. O., and Kerrigan, D. (2003). Predicting peak kinematic and kinetic parameters from gait speed. Gait Posture 17, 106–112. doi:10.1016/s0966-6362(02)00060-7
Lewek, M. D., Bradley, C. E., Wutzke, C. J., and Zinder, S. M. (2014). The relationship between spatiotemporal gait asymmetry and balance in individuals with chronic stroke. J. Appl. Biomechanics 30, 31–36. doi:10.1123/jab.2012-0208
Lewek, M. D., Raiti, C., and Doty, A. (2018). The presence of a paretic propulsion reserve during gait in individuals following stroke. Neurorehabilitation Neural Repair 32, 1011–1019. doi:10.1177/1545968318809920
Lim, Y. P., Lin, Y.-C., and Pandy, M. G. (2022). Lower-limb muscle function in healthy young and older adults across a range of walking speeds. Gait Posture 94, 124–130. doi:10.1016/j.gaitpost.2022.03.003
Lindstrom, M. J., and Bates, D. M. (1988). Newton-raphson and em algorithms for linear mixed-effects models for repeated-measures data. J. Am. Stat. Assoc. 83, 1014–1022. doi:10.2307/2290128
Mentiplay, B. F., Banky, M., Clark, R. A., Kahn, M. B., and Williams, G. (2018). Lower limb angular velocity during walking at various speeds. Gait Posture 65, 190–196. doi:10.1016/j.gaitpost.2018.06.162
Minetti, A., Capelli, C., Zamparo, P., Prampero, P., and Saibene, F. (1995). Effects of stride frequency on mechanical power and energy expenditure of walking. Med. Sci. sports Exerc. 27, 1194–1202. doi:10.1249/00005768-199508000-00014
Molen, N. H., Rozendal, R. H., and Boon, W. (1972). Graphic representation of the relationship between oxygen-consumption and characteristics of normal gait of the human male. Proc. K. Ned. Akad. Wet. C 75, 305–314.
Oberg, T., Karsznia, A., and Oberg, K. (1993). Basic gait parameters: reference data for normal subjects, 10–79 years of age. J. rehabilitation Res. Dev. 30, 210–223.
Olney, S. J., and Richards, C. (1996). Hemiparetic gait following stroke. part i: characteristics. Gait Posture 4, 136–148. doi:10.1016/0966-6362(96)01063-6
Orendurff, M., Segal, A. D., Klute, G. K., Berge, J. S., Rohr, E., and Kadel, N. J. (2004). The effect of walking speed on center of mass displacement. J. rehabilitation Res. Dev. 41 (6A), 829–834. doi:10.1682/jrrd.2003.10.0150
Owings, T. M., and Grabiner, M. D. (2004). Step width variability, but not step length variability or step time variability, discriminates gait of healthy young and older adults during treadmill locomotion. J. Biomechanics 37, 935–938. doi:10.1016/j.jbiomech.2003.11.012
Padmanabhan, P., Rao, K. S., Gulhar, S., Cherry-Allen, K. M., Leech, K. A., and Roemmich, R. T. (2020). Persons post-stroke improve step length symmetry by walking asymmetrically. J. NeuroEngineering Rehabilitation 17, 105. doi:10.1186/s12984-020-00732-z
Park, S., Liu, C., Sánchez, N., Tilson, J. K., Mulroy, S. J., and Finley, J. M. (2021). Using biofeedback to reduce step length asymmetry impairs dynamic balance in people poststroke. Neurorehabilitation Neural Repair 35, 738–749. doi:10.1177/15459683211019346
Patterson, K. K., Gage, W. H., Brooks, D., Black, S. E., and McIlroy, W. E. (2010). Evaluation of gait symmetry after stroke: a comparison of current methods and recommendations for standardization. Gait Posture 31, 241–246. doi:10.1016/j.gaitpost.2009.10.014
Polk, J. D., Stumpf, R. M., and Rosengren, K. S. (2017). Limb dominance, foot orientation and functional asymmetry during walking gait. Gait Posture 52, 140–146. doi:10.1016/j.gaitpost.2016.11.028
Ralston, H. J. (1958). Energy-speed relation and optimal speed during level walking. Int. Z. Angew. Physiol. Einschl. Arbeitsphysiol. 17, 277–283. doi:10.1007/bf00698754
Reimann, H., Fettrow, T., and Jeka, J. J. (2018). Strategies for the control of balance during locomotion. Kinesiol. Rev. 7, 18–25. doi:10.1123/kr.2017-0053
Robertson, D., Caldwell, G. E., Hamill, J., Kamen, G., and Whittlesey, S. N. (2013). Research methods in biomechanics. Second edition.
Roelker, S. A., Bowden, M. G., Kautz, S. A., and Neptune, R. R. (2019). Paretic propulsion as a measure of walking performance and functional motor recovery post-stroke: a review. Gait Posture 68, 6–14. doi:10.1016/j.gaitpost.2018.10.027
Seeley, M. K., Umberger, B. R., and Shapiro, R. (2008). A test of the functional asymmetry hypothesis in walking. Gait Posture 28, 24–28. doi:10.1016/j.gaitpost.2007.09.006
Stenum, J., and Choi, J. T. (2021). Disentangling the energetic costs of step time asymmetry and step length asymmetry in human walking. J. Exp. Biol. 224, jeb242258. doi:10.1242/jeb.242258
Stoquart, G., Detrembleur, C., and Lejeune, T. M. (2012). The reasons why stroke patients expend so much energy to walk slowly. Gait Posture 36, 409–413. doi:10.1016/j.gaitpost.2012.03.019
Wall, J. C., and Turnbull, G. I. (1986). Gait asymmetries in residual hemiplegia. Archives Phys. Med. rehabilitation 67 (8), 550–553.
Wu, G., Siegler, S., Allard, P., Kirtley, C., Leardini, A., Rosenbaum, D., et al. (2002). Isb recommendation on definitions of joint coordinate system of various joints for the reporting of human joint motion—part i: ankle, hip, and spine. J. Biomechanics 35, 543–548. doi:10.1016/s0021-9290(01)00222-6
Xie, H., and Chien, J. H. (2024). Walking on different inclines affects gait symmetry differently in the anterior-posterior and vertical directions: implication for future sensorimotor training. PeerJ 12, e18096. doi:10.7717/peerj.18096
Keywords: functional gait asymmetry, statistical gait modelling, step length adaptations, push-off force dynamics, cross-dataset gait predictions
Citation: Baček T, Xu Y, Peng L, Oetomo D and Tan Y (2025) Gait adaptations in step length and push-off force during walking with functional asymmetry. Front. Bioeng. Biotechnol. 13:1550710. doi: 10.3389/fbioe.2025.1550710
Received: 23 December 2024; Accepted: 05 March 2025;
Published: 28 March 2025.
Edited by:
Bernardo Innocenti, Université libre de Bruxelles, BelgiumReviewed by:
Yuqi He, Huaqiao University, ChinaCopyright © 2025 Baček, Xu, Peng, Oetomo and Tan. This is an open-access article distributed under the terms of the Creative Commons Attribution License (CC BY). The use, distribution or reproduction in other forums is permitted, provided the original author(s) and the copyright owner(s) are credited and that the original publication in this journal is cited, in accordance with accepted academic practice. No use, distribution or reproduction is permitted which does not comply with these terms.
*Correspondence: Tomislav Baček, dG9taXNsYXYuYmFjZWtAdW5pbWVsYi5lZHUuYXU=
Disclaimer: All claims expressed in this article are solely those of the authors and do not necessarily represent those of their affiliated organizations, or those of the publisher, the editors and the reviewers. Any product that may be evaluated in this article or claim that may be made by its manufacturer is not guaranteed or endorsed by the publisher.
Research integrity at Frontiers
Learn more about the work of our research integrity team to safeguard the quality of each article we publish.