 Ricardo Caballero
 Miguel Ángel Martínez
 Estefanía Peña
94% of researchers rate our articles as excellent or good
Learn more about the work of our research integrity team to safeguard the quality of each article we publish.
Find out more
ORIGINAL RESEARCH article
Front. Bioeng. Biotechnol., 28 March 2025
Sec. Biomechanics
Volume 13 - 2025 | https://doi.org/10.3389/fbioe.2025.1549104
Introduction: Atherosclerosis is a complex disease influenced by biological and mechanical factors, leading to plaque formation within arterial walls. Understanding the interplay between hemodynamics, cellular interactions, and biochemical transport is crucial for predicting disease progression and evaluating therapeutic strategies.
Methods: We developed a hybrid in-silico model integrating computational fluid dynamics (CFD), mass transport, and agent-based modeling to simulate plaque progression in coronary arteries. The model incorporates key factors such as wall shear stress (WSS), low-density lipoprotein (LDL) filtration, and the interaction between smooth muscle cells (SMCs), cytokines, and extracellular matrix (ECM).
Results: Our simulations demonstrate that the integration of CFD, transport phenomena, and agent-based modeling provides a comprehensive framework for predicting atherosclerotic plaque growth. The model successfully captures the mechanobiological interactions driving plaque development and suggests potential mechanisms underlying lesion progression.
Discussion: The proposed methodology establishes a foundation for developing computational platforms to test therapeutic interventions, such as anti-inflammatory drugs and lipid-lowering agents, under patient-specific conditions. These findings highlight the potential of hybrid multi-scale in-silico models to advance the understanding of atherosclerosis and support the development of personalized treatment strategies.
Atherosclerosis is a pathology resulting from the accumulation of lipids, inflammatory cells, and extracellular matrix in the arterial wall due to damage in the endothelium, which triggers an immune response leading to the growth and remodeling of the arterial wall (Jebari-Benslaiman et al., 2022; Pederiva et al., 2021). This change in the vessel morphology may result in both blood flow obstruction and outward wall growth that silently develops into a dangerous plaque (Schoenhagen et al., 2001). Atherosclerosis is recognized as the leading cause of cardiovascular diseases (CVDs), accounting for approximately 32% of all global deaths according to the World Health Organization (WHO) (Roth et al., 2020; Wilkins et al., 2017; World Health Organization, 2021). The development of atherosclerosis is a multifactorial process influenced by genetic, environmental, and lifestyle factors, including dyslipidemia, hypertension, smoking, diabetes, and obesity (Pederiva et al., 2021; Poznyak et al., 2022; Martin et al., 2014; Hasheminasabgorji and Jha, 2021; Ito et al., 2019). All these risk factors may affect endothelial cells, increasing their tendency to switch to a mesenchymal-like phenotype, altering their shape, and leading to the appearance of pores in the endothelial barrier (Chen et al., 2015; Yoshimatsu and Watabe, 2022; Esper et al., 2006; Malek et al., 1999).
From a mechanical point of view, disturbed blood flow leads to low wall shear stress (WSS), which is mechano-sensed by endothelial cells, also affecting their shape, turning them into a more circular form, and causing the release of soluble factors that initiate an immune response (Hartman et al., 2021; Caro et al., 1971).
Atherosclerosis starts with the infiltration of low-density lipoprotein (LDL) molecules into the intimal layer of the arterial wall. These LDL molecules undergo oxidation, becoming oxidized LDL molecules (oxLDL), which trigger an inflammatory response. Endothelial cells (ECs) express adhesion molecules attracting circulating monocytes, which migrate to the damaged intima and differentiate into macrophages (MCs). These MCs ingest oxLDL and secrete various soluble factors such as pro-inflammatory cytokines. When the excess of oxLDL surpasses MCs’ absorption capacity, MCs lose most of their cellular functions and are reclassified as foam cells (FCs), which are lipid-laden cells that form the core of the atheromatous plaque (Libby et al., 2019; Lusis, 2000).
As part of the immune response, vascular smooth muscle cells (vSMCs) initially located in the media layer in a contractile phenotype (cSMCs)—inactive and out of the cell cycle, with the sole function of contracting and relaxing to provide tone to the vessel—become activated. They change their phenotype to a synthetic phenotype (sSMCs) and acquire the ability to migrate, proliferate, and produce extracellular matrix (ECM). The continuous accumulation of foam cells and the immune response mediated by sSMCs contribute to the growth of the plaque, leading to arterial wall thickening and luminal narrowing (Gomez and Owens, 2012; Sukhovershin et al., 2016; Nakano-Kurimoto et al., 2009; Bennett et al., 2016).
One of the main clinical complications of atherosclerosis is that the fibrous cap of the plaque may rupture, releasing the lipidic content into the bloodstream, and leading to the formation of a thrombus that can eventually cause a heart attack (Finn et al., 2010; Stefanadis et al., 2017). The mechanisms of plaque rupture have been extensively studied over the years, with the mechanical approach being one of the most common, as the rupture is ultimately a mechanical problem (Peña et al., 2021; Libby, 2013; Virmani et al., 2006; Caballero et al., 2023; Latorre et al., 2023). However, incorporating biological rules that model pathophysiology can make a significant difference in predicting plaque initiation and progression, or explaining patient-to-patient variability caused by emergent phenomena from cell-cell and cell-environment interactions.
Computational modeling has emerged as a powerful tool in atherosclerosis research, providing insights into the disease’s progression and aiding in the development of therapeutic interventions (Çap et al., 2023). Traditional experimental methods, while invaluable, are often limited by ethical, technical, and financial constraints. In contrast, computational models offer a flexible and cost-effective approach to simulate various aspects of atherosclerosis, from molecular and cellular interactions to tissue mechanics.
Several types of in silico models have been employed to study atherosclerosis. These include continuous models such as CFD (Ai and Vafai, 2006; Liu et al., 2021; Malvè et al., 2014), FEA (Gu and Bennett, 2022; Tziotziou et al., 2023; Wentzel et al., 2023), transport phenomena (Filipovic et al., 2011; Calvez et al., 2010; Filipović and Kojić, 2004; Olgac et al., 2008; Hernández-López et al., 2021), and discrete models such as agent-based models (ABMs) (Bhui and Hayenga, 2017; Corti et al., 2020).
Continuous models usually solve partial differential equations to describe hemodynamics, the transport of substances within the arterial wall, and the stresses and strains caused by blood pressure. These models are particularly useful for simulating the convection-diffusion-reaction processes that govern the distribution of LDL, oxLDL, and other molecules within the vessel wall.
ABMs, on the other hand, provide a discrete and stochastic framework to simulate the behavior of individual cells. ABMs are well-suited for capturing the heterogeneity and spatial complexity of cellular processes. By representing each cell as an autonomous agent with specific rules of behavior, ABMs can simulate the dynamic and emergent properties of atherosclerotic plaque development due to its bottom-up approach that facilitates the implementation of biological rules inspired by experimental studies.
Recently, the possibility of coupling these two types of models together, combining the strengths of each, has been explored (Corti et al., 2020). These models are known as hybrid models and integrate different multi-scale approaches to capture the main temporal and spatial scales influencing the initiation and progression of atherosclerosis. This merging of continuous and discrete models has shown great potential, providing a more realistic and detailed representation of the plaque.
To the best of our knowledge, there are only a few studies on hybrid models applied to atherosclerosis to date. First, the study developed by Bhui and Hayenga (2017) presented a novel ABM to reproduce the transendothelial migration of leukocytes and the progression of atherosclerosis in coronary arteries, simulating the complex interactions between hemodynamic factors and biological processes. This model used a fixed patch size of
By enhancing the model to include these elements, hybrid models can more accurately simulate the progression of atherosclerosis and its response to treatments. This comprehensive approach will provide better insights into personalized therapeutic strategies, ultimately improving patient outcomes.
In this work, we present a fully coupled framework that begins with an idealized healthy artery and simulates the development of atheroma plaque under pathological conditions driven by WSS and oxLDL concentration. This hybrid model integrates two different approaches: a continuous approach previously developed by our research group (Hernández-López et al., 2021), which computes hemodynamics and substance transport to determine WSS and oxLDL levels, and a discrete approach, where an ABM responds to the continuous model’s inputs to simulate cellular dynamics.
Specifically, the CFD analysis performed on a 3D idealized coronary artery model provides hemodynamic input to multiple 2D ABMs, which simulate the cellular behavior driving plaque progression. The models are coupled through a semi-automated methodology, reconstructing the 3D vessel from the growth data of 2D cross-sections.
This integration enables a more accurate representation of plaque development by dynamically updating the artery’s geometry as the plaque grows, capturing variations in WSS and oxLDL concentration over time.
Furthermore, a sensitivity analysis focused on the most influential variables is carried out to evaluate how changes in input parameters affect the model’s behavior. This analysis tests the model’s robustness in estimating the progression of atherosclerosis in the coronary artery, providing critical insights into its predictive accuracy.
We developed a fully coupled methodology starting from an idealized 3D geometry of a coronary artery, on which we performed a CFD study to obtain the WSS (Figure 1). Using the WSS profile as input, we fed a mass transport model, which predicted the concentration of oxLDL in the wall through convection-diffusion-reaction equations. In areas under higher risk for atherosclerosis due to its oxLDL concentration, we selected five cross-sectional slices where we calculated wall growth using an agent-based model.
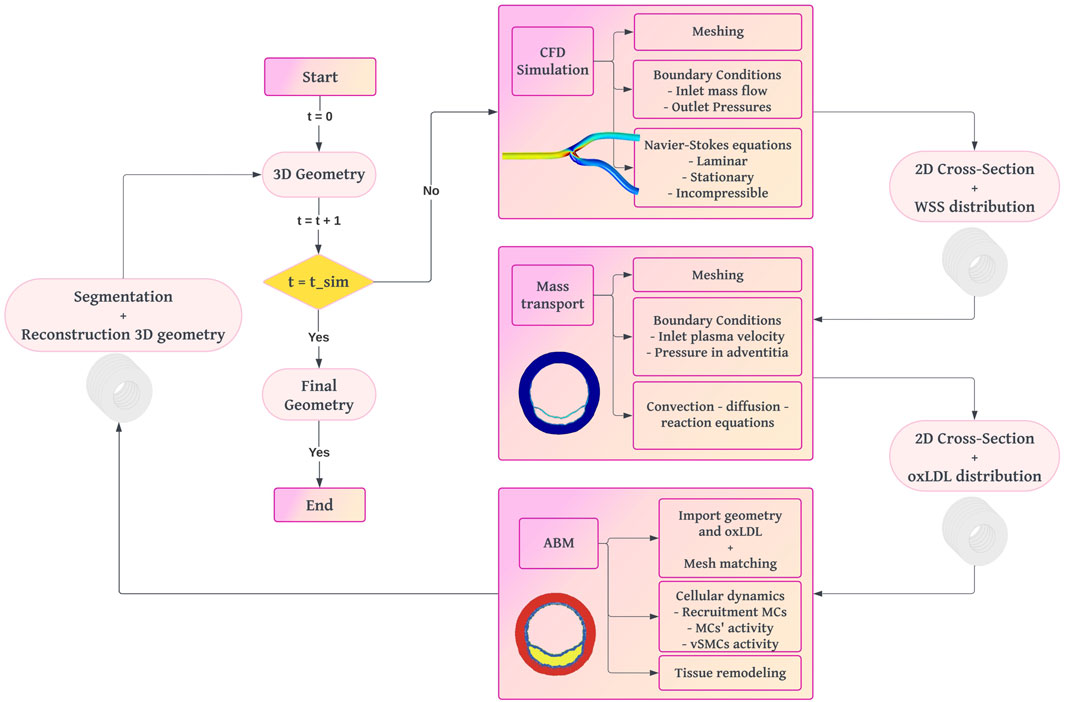
Figure 1. Workflow diagram of the fully coupled multi-scale framework for plaque growth reproduction. The process begins with a 3D geometry of a healthy artery. CFD simulations calculate WSS. Mass transport simulations determine oxLDL distribution. An ABM simulates cellular dynamics to compute plaque growth and vessel remodeling. The iterative process updates the 3D geometry until the final simulation time is reached.
We built an idealized 3D geometry of the lumen of a healthy coronary artery. The artery diameter was assigned based on data from the literature for different types of coronary arteries (MacAlpin et al., 1973; Dodge Jr et al., 1992; Ohayon et al., 2008). Based on these data, we selected representative constant diameter values of
Due to the substantial evidence supporting the role of WSS as a critical factor in the initiation and progression of atherosclerosis (Caro et al., 1971; Liu and Tang, 2010; Filipovic et al., 2013; Olgac et al., 2008; Hartman et al., 2021), which correlates regions of low WSS with areas prone to lipid accumulation, endothelial dysfunction, and subsequent plaque formation, we utilized the WSS as the main trigger of plaque growth in our predictive model. For this purpose, we conducted a CFD study on a 3D idealized geometry of the lumen of a coronary artery using COMSOL Multiphysics 5.6 (COMSOL AB, 2020), solving the Navier-Stokes equations (Equations 1, 2) under the assumptions of laminar, Newtonian, incompressible, and stationary flow. The mesh resolution was carefully chosen based on a mesh sensitivity analysis conducted by our group (Hernández-López et al., 2021), ensuring that the grid resolution was appropriate for accurately capturing the flow dynamics and WSS values.
Boundary conditions included a no-slip condition of blood flow along the endothelium, a specified mass flow rate at the inlet, and pressure conditions at the outlet, following Murray’s law (Murray, 1926). Table 1 summarizes the parameters used in this model.
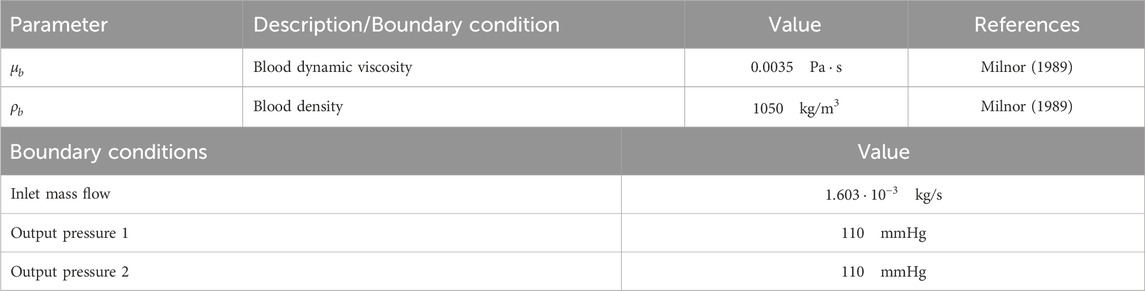
Table 1. Blood flow parameters and boundary conditions for CFD study.
We extracted several cross-sections along with their corresponding WSS data from the 3D idealized geometry used in the CFD model. For each cross-section, we defined the different layers of the vessel wall, incorporating the internal elastic lamina (IEL) as a
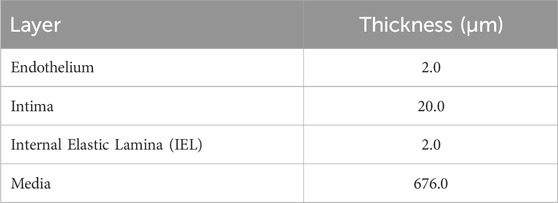
Table 2. Properties of coronary artery layers.
In this model, WSS is utilized to compute the concentration of oxLDL along the arterial wall. The mass transport process initiates with the filtration of plasma through the endothelium. This filtration is driven by changes in endothelial porosity, which are directly correlated with the magnitude of WSS. Decreased WSS leads to altered permeability, facilitating the translocation of plasma and substances such as LDL, into the intima (Hartman et al., 2021; Caro et al., 1971). Once LDL molecules penetrate the arterial wall, they undergo oxidation, transforming into oxLDL (Libby et al., 2019; Lusis, 2000). Inside the arterial wall, oxLDL molecules continue to move due to both convective effects, caused by plasma filtration, and diffusive effects, driven by concentration gradients within the wall. This establishes the concentration gradient of oxLDL across the intima layer, setting the stage for further biological interactions within the arterial wall. Our research group previously developed this model (Hernández-López et al., 2021) and it has been adapted for this work. All the parameters needed for the computation of the mass transport model are summarized in Table 3.
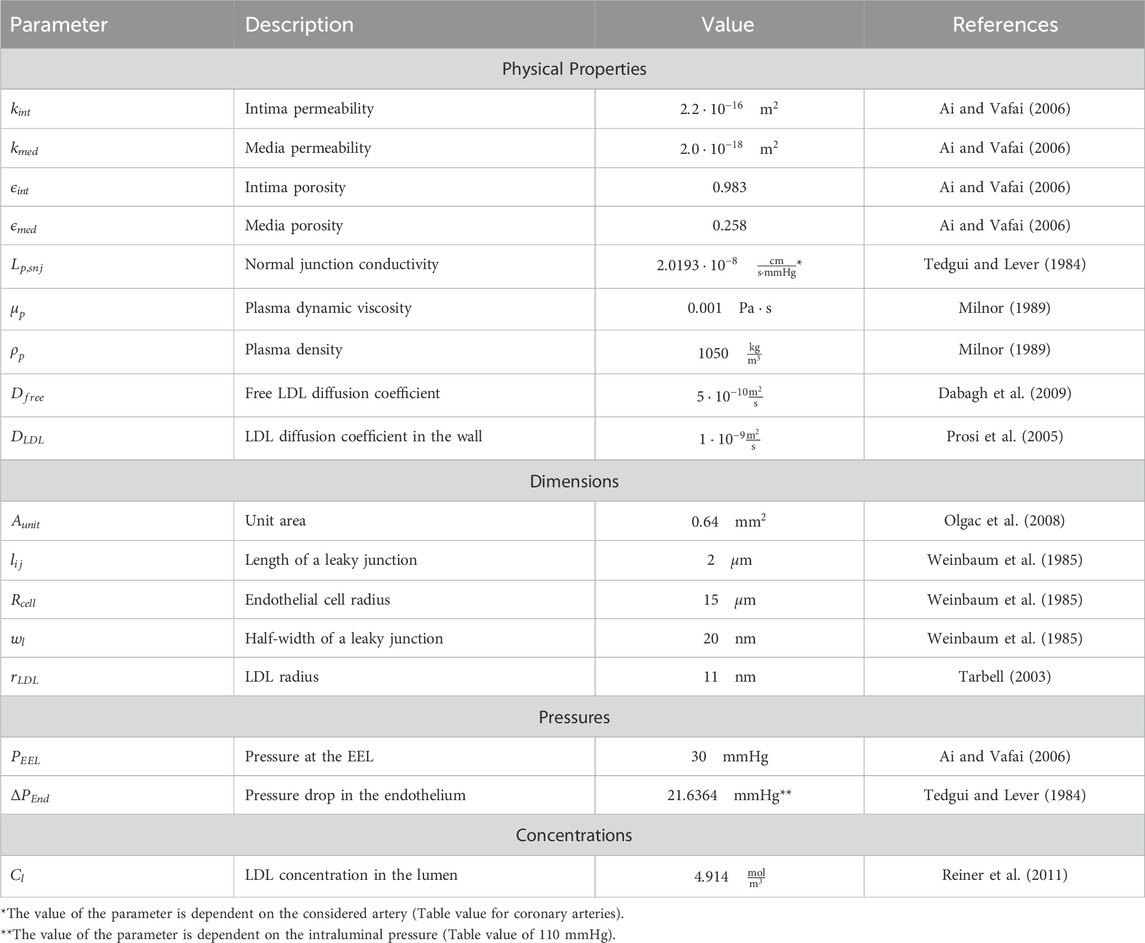
Table 3. Parameters for plasma and LDL flow through the wall.
Plasma filtration along the wall was modeled using Darcy’s law (Equation 3), which computes the filtration velocity
We set the plasma velocity filtrating across the endothelium and the pressure at the EEL as boundary conditions.
The flow of plasma across the endothelium was calculated using a modified version of Starling’s law (Equation 28, Supplementray Appendix SA1.), which neglects osmotic pressure (Tedgui and Lever, 1984) (Equation 4).
We determined the plasma filtration flow across the endothelium based on the three-pore theory (Michel and Curry, 1999). This theory considers different pathways for substances such as plasma or LDL to cross the endothelium: normal junctions
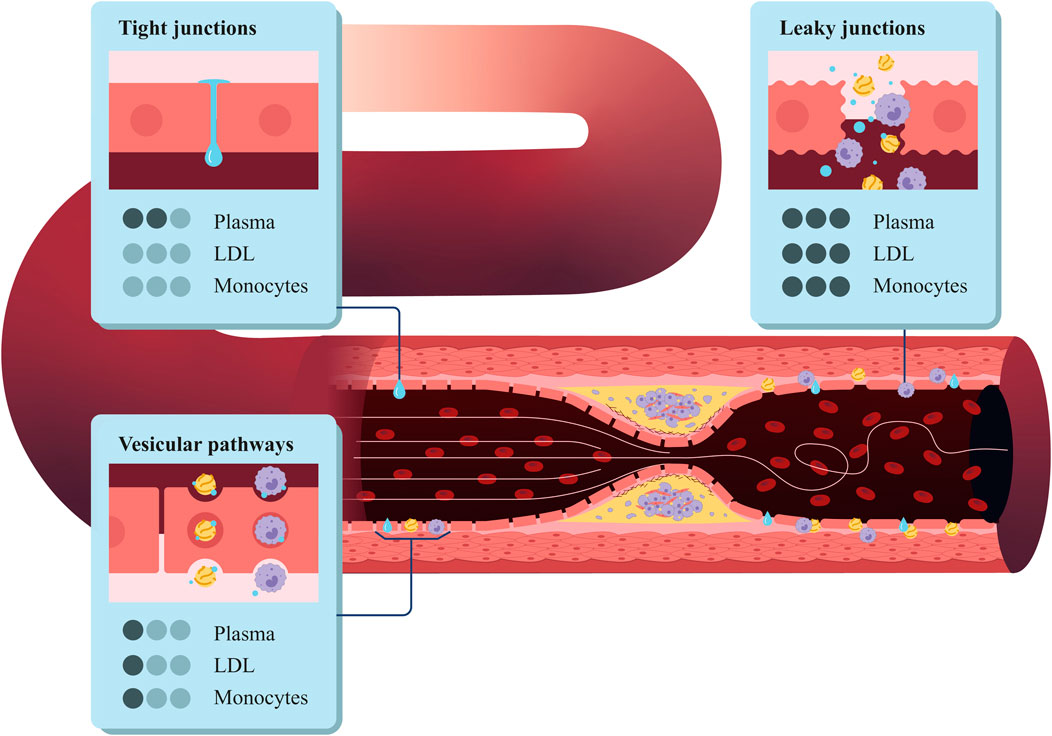
Figure 2. Structure of the coronary artery wall, highlighting the three types of pores in the endothelium: vesicular pathways, tight junctions, and leaky junctions.
Then, we can apply the three-pore model to Equation 4 and compute the total flow across the endothelium as the sum of the flow across each pore type (Equation 5):
We considered the plasma flow across the vesicular pathways to be negligible (Olgac et al., 2008), so the equation to compute the plasma flow across the endothelium can be expressed as follows (Equation 6):
where
The flux of LDL in the wall
In this equation, the first term represents the diffusion of LDL, and the second term accounts for LDL convection. Here,
where
As boundary conditions for the filtration process of the LDL we defined a specific flux at the endothelium based on the three-pore theory combined with the Kedem-Katchalsky equations (Kedem and Katchalsky, 1958), and a determined LDL concentration at the EEL.
To compute the LDL flux across the endothelium, we used an expression proposed by Kedem and Katchalsky (1958), which highlights that the total solute flux is the combination of a diffusive and a convective flow (Equation 9):
where
where the Peclet number is a dimensionless number expressing the ratio of convective to diffusive transport. It is defined as (Equation 11):
Due to the size of LDL molecules (20 nm), the transport across normal junctions is zero. In addition, some studies have shown that the transport of LDL across the vesicular pathways is approximately 10% of the transport across the leaky junctions (Cancel et al., 2007) (Equations 12–14).
Further explanation for the computation of the flix of LDL can be seen in Supplementray Appendix SA1.
Taking all this into account, we computed the oxLDL concentration solving in 2D Equations 7, 8 for the arterial wall using a time-dependent simulation.
The ABM was developed in NetLogo 6.1 (Wilensky, 2019) to simulate the cellular processes involved in atherosclerosis and to compute the growth of the arterial wall. The workflow of the ABM (Figure 3) begins by importing the geometry and oxLDL concentration from the 2D mass transport model (Figure 1). The domain consists of a regular grid measuring
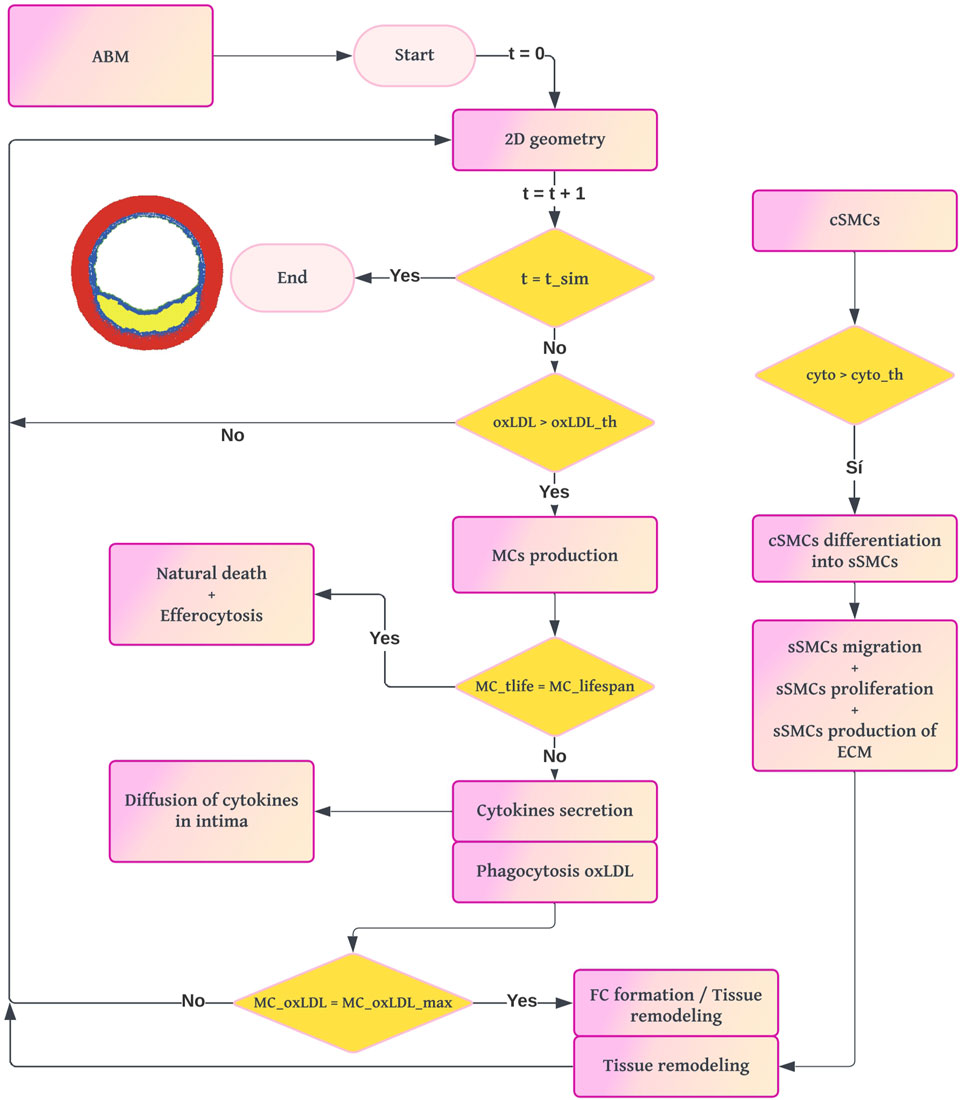
Figure 3. Workflow diagram of the ABM. The process begins with the 2D cross-section from the mass transport model. For each loop until the simulation time of the ABM is reached, if there is a pathological concentration of oxLDL, the model computes the probability of production of MCs and their dynamics. The formation of FCs leads to the appearance of a necrotic-lipidic core, and the secretion of cytokines triggers the vSMC activity.
The cellular agents considered are ECs, MCs, FCs, and vSMCs. Both agents and lattice sites have predefined settings and behaviors depending on their type. For example, MCs can phagocytize and move, whereas FCs cannot. From now on, we will refer to the lattice sites as patches, following Netlogo’s nomenclature. Additionally, we will distinguish between simulated time (the time representing pathology in our model) and real simulation time (the actual computation time required by our machine).
The amount of oxLDL in the arterial wall is crucial for sustaining the immune response, so oxLDL is updated at each coupling interval. The models are coupled every 2 years of simulated time to balance accuracy and computational cost. After each 2-year interval, the current geometry is segmented and used to reconstruct the 3D geometry.
The ABM operates in a temporal loop where each iteration represents 1 day of simulated time. At the end of each day, the probabilities of various cellular events and the concentrations of all substances are recalculated. This process repeats until the total simulated time reaches 10 years, which is sufficient to observe both tissue growth and remodeling.
Regarding computational efficiency, simulating 10 years of pathology required 135 h of real simulation time on an Intel(R) Core(TM) i7-10700K CPU @ 3.80 GHz.
Due to the stochastic nature of most expressions describing the biological processes in the ABM (e.g., probabilities of SMC proliferation and migration), all output values were averaged over multiple simulations. The number of simulations (N) was selected to balance variability among ABM runs and computational cost. Specifically, 10 simulations were performed to minimize the standard deviation while efficiently managing computational resources.
The geometric features of the ABM were derived from the 2D geometry of the mass transport model, representing a healthy cross-section of the coronary artery. In the mass transport model membranes like endothelium, IEL, and EEL were represented by lines, whereas in the ABM they were considered monolayers due to the nature of a discrete model. Thus, the first row of cells in the lumen adjacent to the intima was designated as the endothelium, and the first row of vSMCs in the media layer adjacent to the intima was designated as the IEL. The oxLDL concentration, imported from the mass transport model, remains constant until the next coupling event. During this interval, it does not undergo diffusion or elimination from the system. To align the continuous and discrete models, a mesh-matching process was applied, averaging patch values where multiple values from the continuous model overlapped.
Based on the resolution limit of the OCT imaging technique (10–20
Therefore, we determined the membrane (endothelium, IEL, EEL) or layer (intima or media) to which each set of patches belongs. Patches belonging to the endothelium were seeded with ECs. Patches in the intima layer initially contained no cells, only oxLDL and ECM concentrations. The media layer was filled with vSMCs in their contractile phenotype (cSMCs).
For substances not imported from the mass transport model, such as collagen density and cytokine concentration, initial values were set based on literature (Hernández-López et al., 2021) (
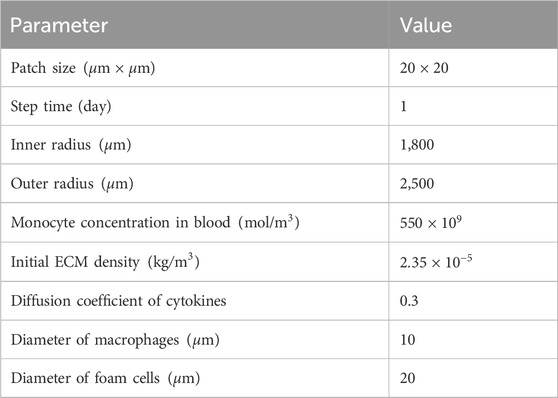
Table 4. Initial ABM parameters.
The modeled cellular events included the recruitment of monocytes and their differentiation into MCs, the phagocytosis of oxLDL by MCs, the secretion of cytokines by MCs, the differentiation of MCs into FCs and their subsequent death, the activation and phenotype change of vSMCs, their migration, proliferation and apoptosis, and the generation and degradation of ECM. Each cellular event was governed by specific rules, which were categorized into deterministic and stochastic.
Deterministic rules calculate the amount of a specific substance at a given patch and time point, based on generation or degradation ratios. Stochastic rules, on the other hand, determine the probability of a cellular event occurring. The different probabilities were calculated using sigmoid functions, which outputted a value between 0 and 1 (Allen, 2010; Banks, 2013; Albano et al., 2022). These rules were often modulated by ratios derived from experimental studies. For instance, if the differentiation rate of cSMCs into synthetic sSMCs under atheroprone conditions was 0.4, the sigmoid function was adjusted to reflect a maximum probability of 0.4, incorporating the differentiation ratio in the numerator. In the sigmoid function, the slope
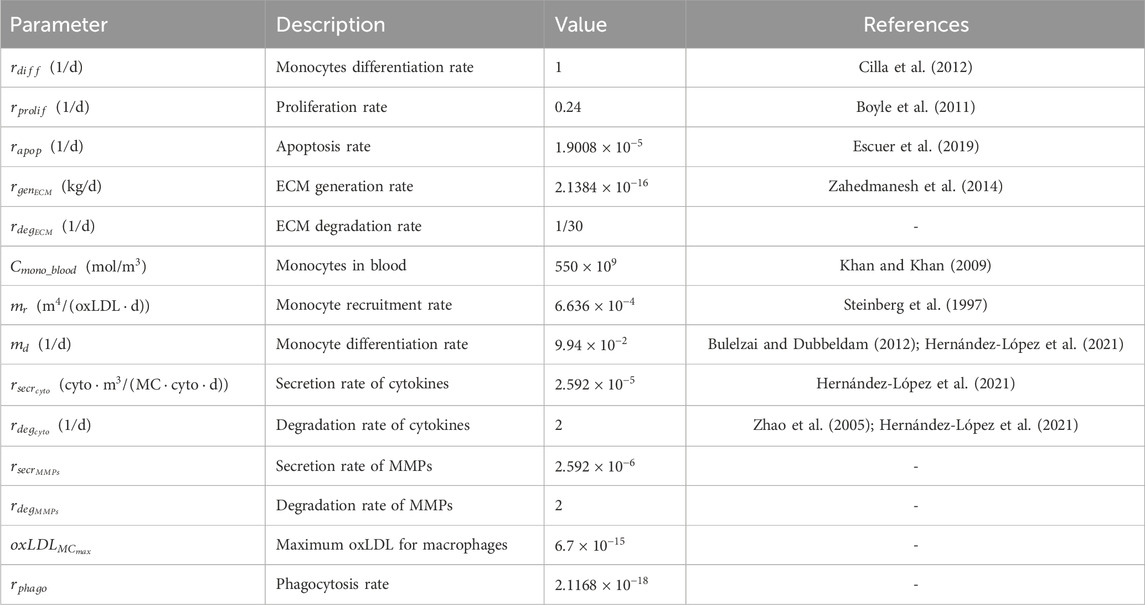
Table 5. Global ABM parameters.
Monocytes are recruited to areas with high oxLDL concentrations and differentiate into MCs as an immune response. This process was modeled using the probability of an MC appearance in the pathological area, represented by a sigmoid function (Equation 16).
Here,
Macrophages updated their lifetime 1 day every step-time. While they were alive, they engulfed oxLDL and produced cytokines according to deterministic rules (Equation 17) based on a phagocytosis ratio
where
In addition, MCs eventually died through two possible mechanisms. The first mechanism was natural death, which occurred when an MC reached its lifespan of 100 days (Equation 18). The second mechanism occurred when MCs reached the maximum amount of oxLDL they could handle, becoming foam cells, losing their cellular functions, and releasing metalloproteases (MMPs) to the environment (Equation 19).
Cytokines produced by MCs were able to diffuse according to a chemical gradient, so this discrete diffusion of cytokines was implemented in the ABM.
cSMCs were initially located only in the media layer. These cells were in a senescent phenotype, inactive, and out of the cell cycle, with their main function being to contract and stretch, providing tone to the vessel and assisting in vasoconstriction and vasodilation. However, in regions with a pathological concentration of pro-inflammatory cytokines, cSMCs could become activated and re-enter the cell cycle. This activation enabled them to proliferate, migrate, and generate extracellular matrix by transitioning to a synthetic phenotype.
To model the probability of phenotype switching
The proliferation probability
Similarly, the rule to compute the probability of migration
Since sSMCs were now in the cell cycle, they could eventually undergo apoptosis. The rule for this cellular event was uniquely based on an experimental ratio
Lastly, the generation of ECM was based on a production ratio
Following the principle of minimum energy (Garbey et al., 2015), both migration and tissue remodeling when new cells were born, were based on an algorithm to find the shortest path to an objective. The shortest path algorithm used in our model was a modified version of the A* algorithm (Hart et al., 1968), designed to avoid obstacles in the path.
The A* algorithm is a pathfinding and graph transversal algorithm widely used to find the shortest path between nodes in a graph (Hart et al., 1968). In our model, A* was adapted to facilitate the migration of sSMCs and tissue remodeling. The key features of the A* algorithm in our context are explained below.
A* uses a heuristic function to estimate the cost from a given site to the target site. In our model, we used this within the sSMC migration rule and the remodeling module, where the heuristic function was designed to minimize the energy required for a cell to migrate avoiding obstacles in the path or to find an empty site that met specific characteristics.
The cost function in our adaptation of A* includes several factors.
1. Initialization: Start with an initial site (current position of the sSMC) and add it to the open list, which contains sites to be evaluated.
2. Evaluation: For each site in the open list, calculate the total cost
3. Selection: Select the site with the lowest total cost from the open list and move it to the closed list, indicating it has been evaluated.
4. Expansion: Expand the selected site by evaluating its neighboring sites. For each neighbor:
5. Termination: Repeat the evaluation and selection steps until the target site is reached or the open list is empty.
The simulation was run iteratively updating the model every 2 years with a total simulation time of 10 years. Each iteration involved the segmentation of the ABM outputs to identify the different layers in the arterial wall after growth, reconstruction of the 3D geometry, and re-running the CFD and mass transport simulations with the updated geometry. This process captured the continuous interaction between wall remodeling, hemodynamics, and oxLDL filtration.
Given that both mechanical and chemical stimulus conditions can vary along the blood vessel, we analyzed two distinct regions (Figure 4). The first was located far from the bifurcation, an area where a parabolic flow, similar to the inlet boundary condition, was expected, representing a region less prone to atherosclerosis. To examine this region, we focused on a single cross-sectional plane (CS0). In contrast, to analyze the atherogenic region, we studied the evolution of five cross-sectional planes downstream of the bifurcation (CS1 to CS5).
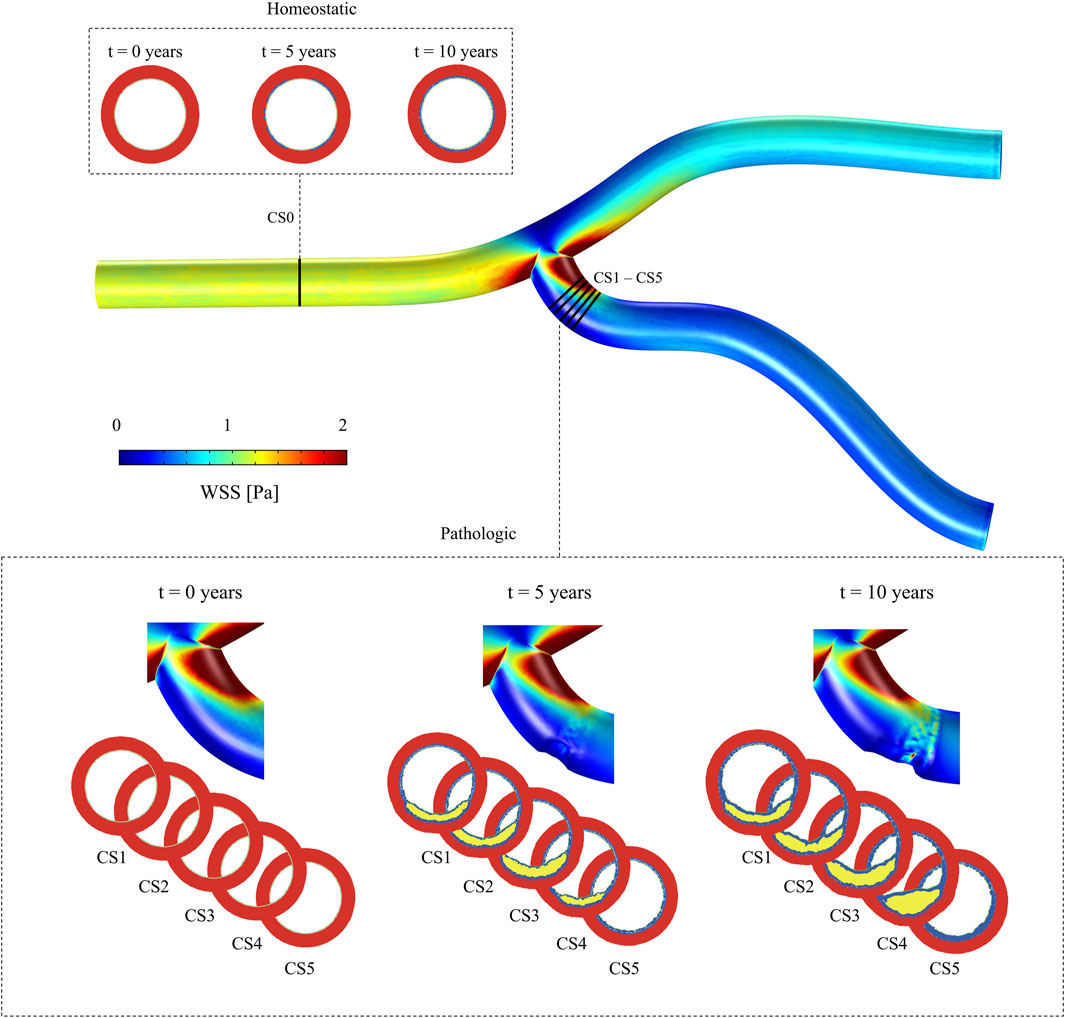
Figure 4. Idealized geometry of a coronary artery, illustrating the WSS distribution. Multiple cross-sectional planes are shown: CS0, located in a healthy region, to evaluate the model under homeostatic conditions, and CS1 to CS5, positioned in regions of pathological growth, to analyze behavior under disease conditions.
As CS0 is located upstream of the vessel bifurcation and due to CFD boundary conditions, the minimum WSS on this plane was
Cross-sectional planes CS1 to CS5, located downstream of the bifurcation, showed the lowest WSS, with minimum values of
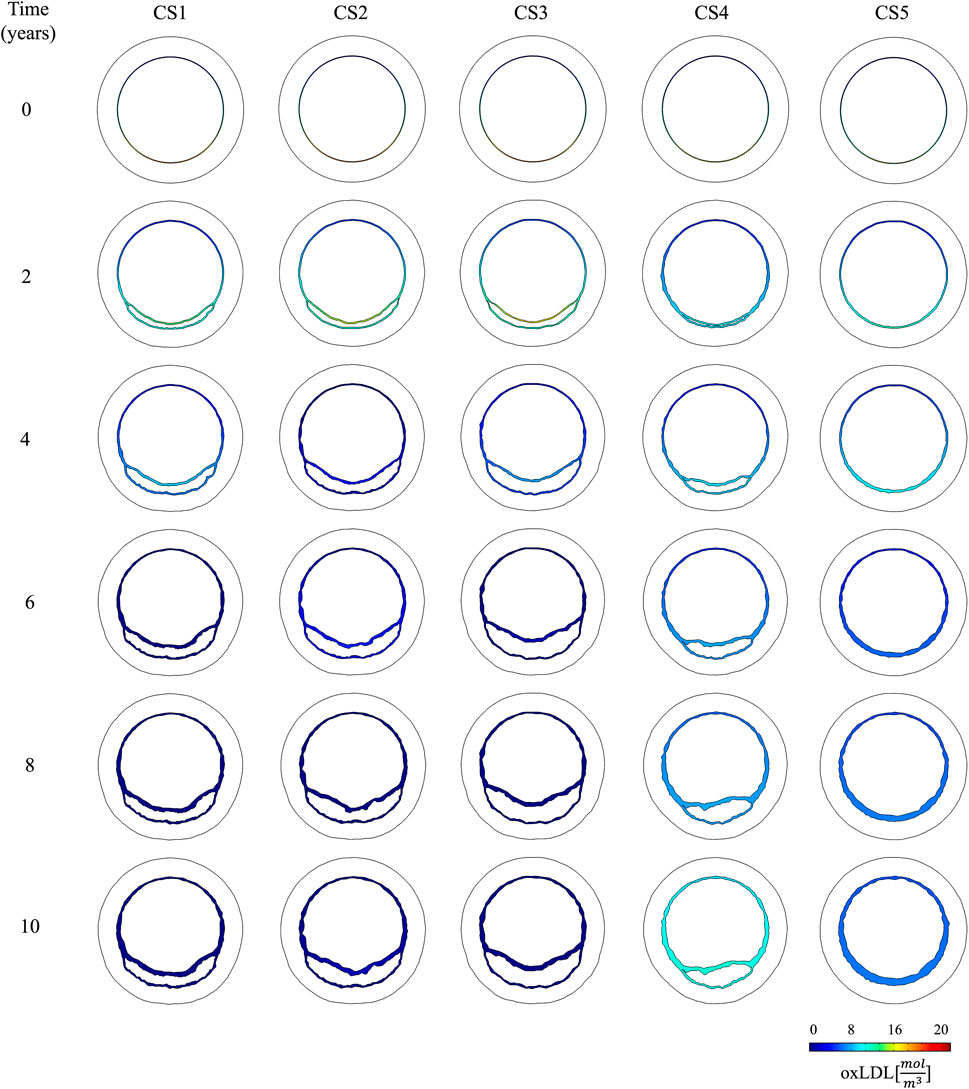
Figure 5. Temporal evolution of oxLDL distribution in the cross-sectional planes located in the pathological region (CS1 to CS5).
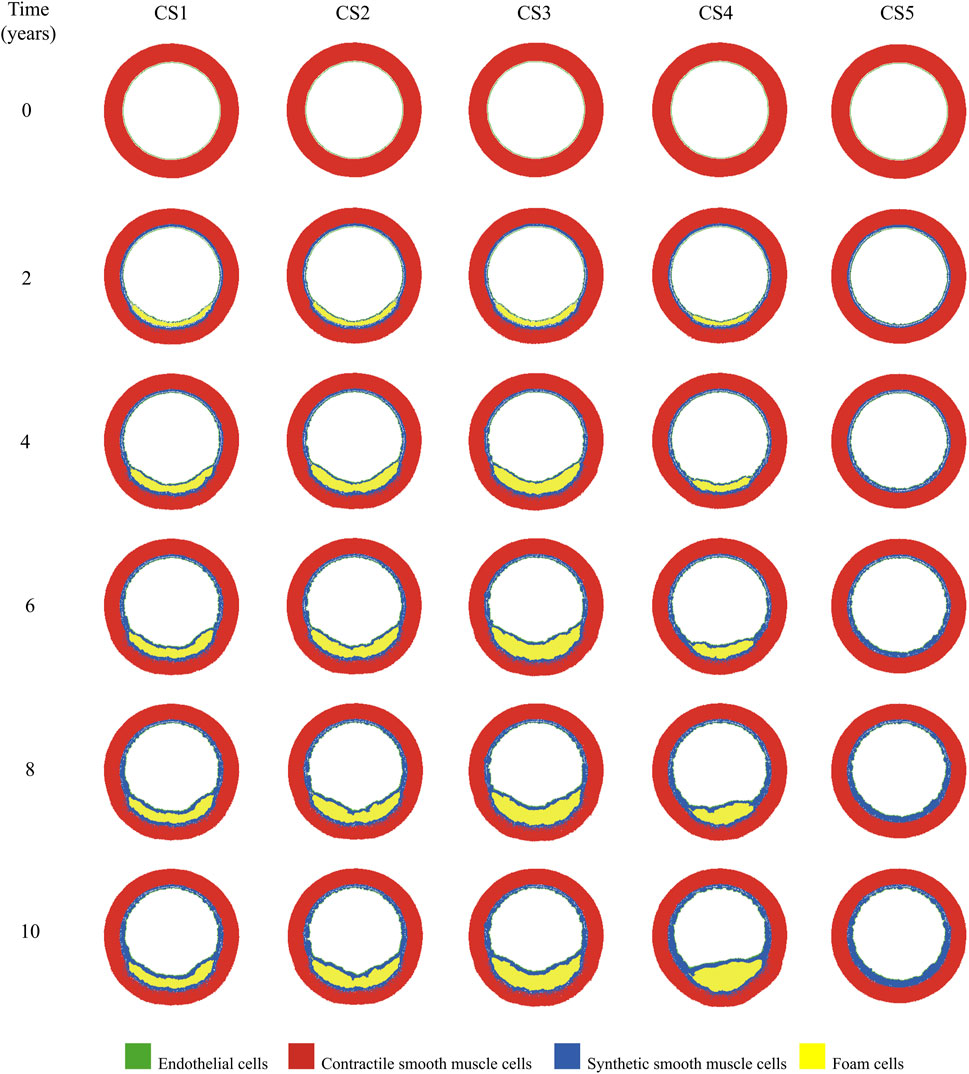
Figure 6. Temporal evolution of growth in the cross-sectional planes located in the pathological region (CS1 to CS5).
The change of phenotype of SMCs from contractile to synthetic, migration, and proliferation of sSMCs, combined with the eccentric growth of the necrotic lipid core, resulted in an outward expansion. Additionally, cellular activity in the inner region of the necrotic lipid core, considering its impermeability, led to a higher concentration of oxLDL in this area, driving a faster inward progression of the plaque. As depicted in Figure 6, CS3 was the cross-section with the highest growth, reaching a stenosis ratio (SR) of 20% after 10 years, whereas CS5 was the cross-section with the lowest SR, reaching a maximum of 8% after 10 years. Within cross-sections CS1 to CS5, a circumferential gradient of oxLDL was observed, attributed to differences in endothelial permeability driven by mechano-sensed WSS (Figure 5). Focusing on CS3, 50% of the cross-section experienced WSS below 0.5 Pa at t = 0 years (sectors 5–8) (Figure 7). This pathological scenario was further highlighted by circumferential gradients in pressure and oxLDL. Sectors with pathological WSS showed a strong correlation with higher oxLDL concentrations.
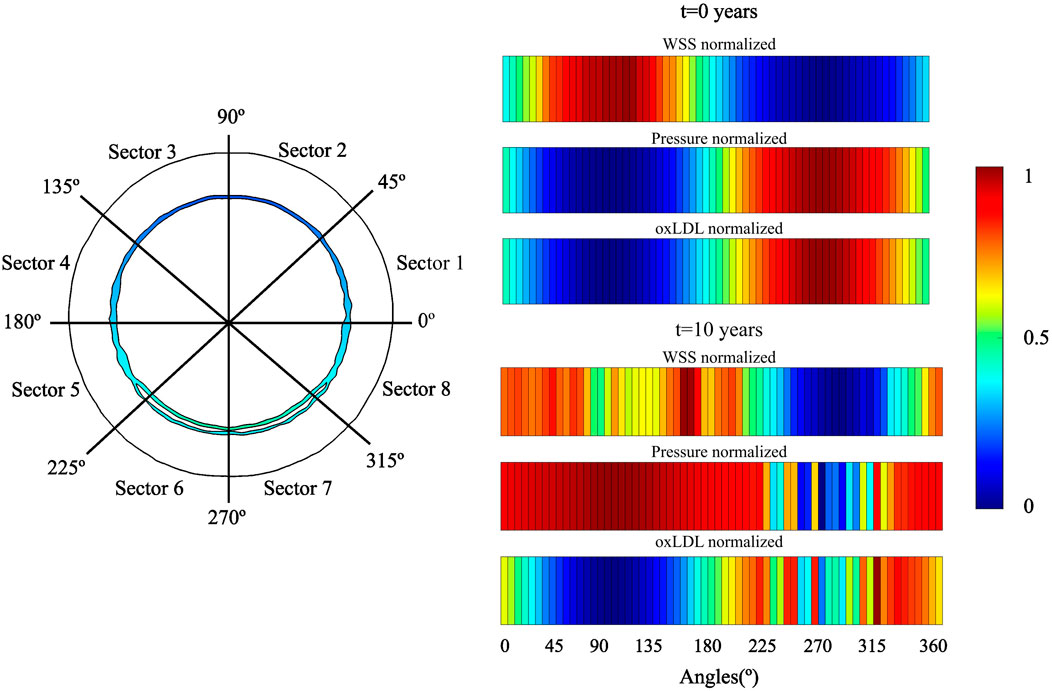
Figure 7. Temporal evolution of WSS, pressure and oxLDL in CS3. A two-dimensional map of distribution of these variables. For analysis, the cross-section was divided in eight sectors.
Figure 8 shows the temporal evolution of several output variables for each cross-section. These include the stenosis ratio (SR), defined as the ratio of the current lumen area
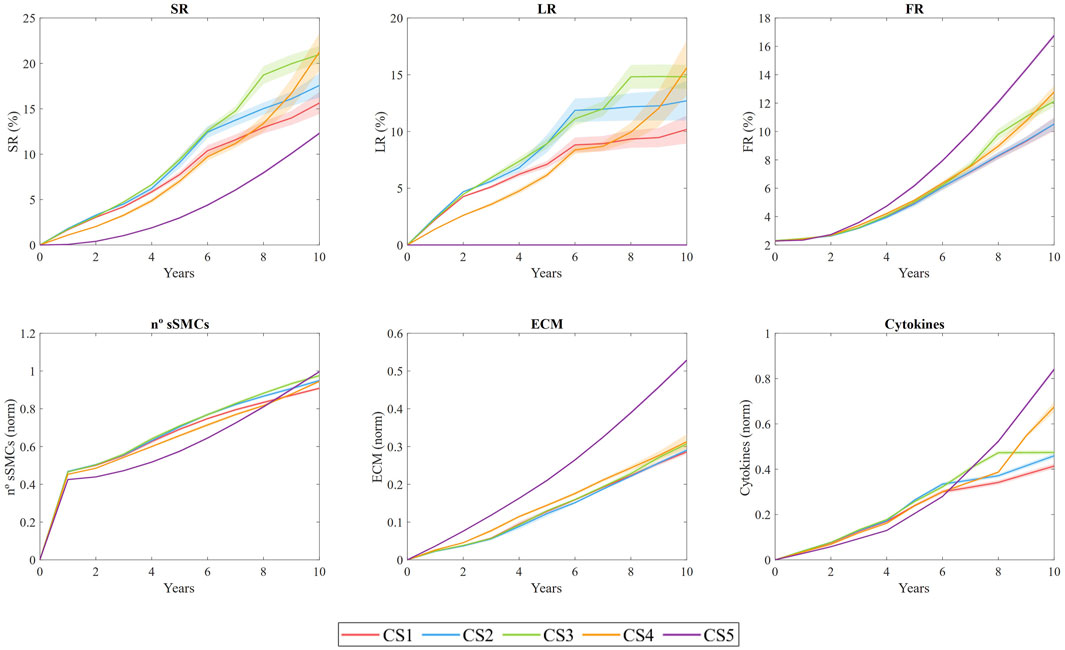
Figure 8. Temporal evolution of stenosis ratio (SR), lipid ratio (LR), fibrous cap ratio (FR), number of smooth muscle cells (sSMCs), extracellular matrix (ECM) density, and cytokine concentration for cross-sections CS1 to CS5. The results are obtained from N = 10 simulations, showing the mean and standard deviation.
SR shows an overall increasing trend across all sections, with a pronounced steepening of the curve in CS4. This steep increase is driven by plaque displacement resulting from the growth of sections CS1, CS2, and CS3. Specifically, CS3 underwent rapid growth during the first 6 years, primarily due to lipid-core expansion and sSMC proliferation, ultimately reaching an SR of 19% after 10 years. In CS1, CS2, and CS3, LR increased quickly during the first 6 years, with values reaching 10%, 12%, and 17%, respectively, before stabilizing, while both SR and FR continued to rise. This trend suggests a correlation between sSMC proliferation and SR, driven by cytokine-induced proliferation in the vessel. CS4 exhibited prolonged growth, with the highest rate of expansion occurring after year 8. In contrast, CS5 did not develop a necrotic core, as expected. Regarding FR, all sections showed an upward trend, with CS3 and CS5 demonstrating the most significant fibrotic tissue development relative to the intima area.
The
ECM density also increases throughout the study, indicating that the system has not yet reached equilibrium. Since ECM is produced by sSMCs and degraded by MMPs (generated by FCs), the increasing
Cytokine concentrations are closely linked to oxLDL levels, as macrophages release cytokines in response to elevated oxLDL. As the concentration of pro-inflammatory cytokines rises, sSMCs become activated and begin producing ECM. However, the increased death of MCs results in higher MMP concentrations, which degrade ECM. In regions lacking sSMCs, this degradation weakens the fibrous cap. Cross-sections CS1 to CS5 developed higher levels of pro-inflammatory cytokines than CS0, with the maximum cytokine concentration observed in the most damaged area of CS3 after 10 years.
This fully coupled methodology enables the dynamic updating of WSS and oxLDL as the geometry evolves. Vessel narrowing leads to flow acceleration, which increases WSS and subsequently decreases LDL filtration into the wall. However, the emergence of a protrusion in the lumen due to growth alters the downstream flow distribution, translating the plaque downstream as WSS decreases significantly. This phenomenon is evident in CS4, which initially experienced lower oxLDL levels compared to CS3, but, as CS3 continued to grow, CS4 increased its oxLDL concentration, leading to accelerated growth and ultimately achieving SR and LR values comparable to those of CS3, demonstrating the importance of coupling these three models.
In addition, sections with faster growth during the initial years, such as CS1 and CS2, exhibited a decrease in growth rate over time. For instance, for CS1 the rate decreased from
In this analysis, we compared the impact of coupling time in the results. To do so, we examined three different coupling intervals in CS3: 3 months, 2 years, and 5 years. As shown in Figure 9A), both the 3-month and 2-year coupling intervals exhibited comparable performance in estimating growth. In contrast, the 5-year coupling interval predicted faster growth during the initial 5 years, followed by controlled growth in subsequent years after coupling. This behavior may be attributed to the variation of stenosis ratio
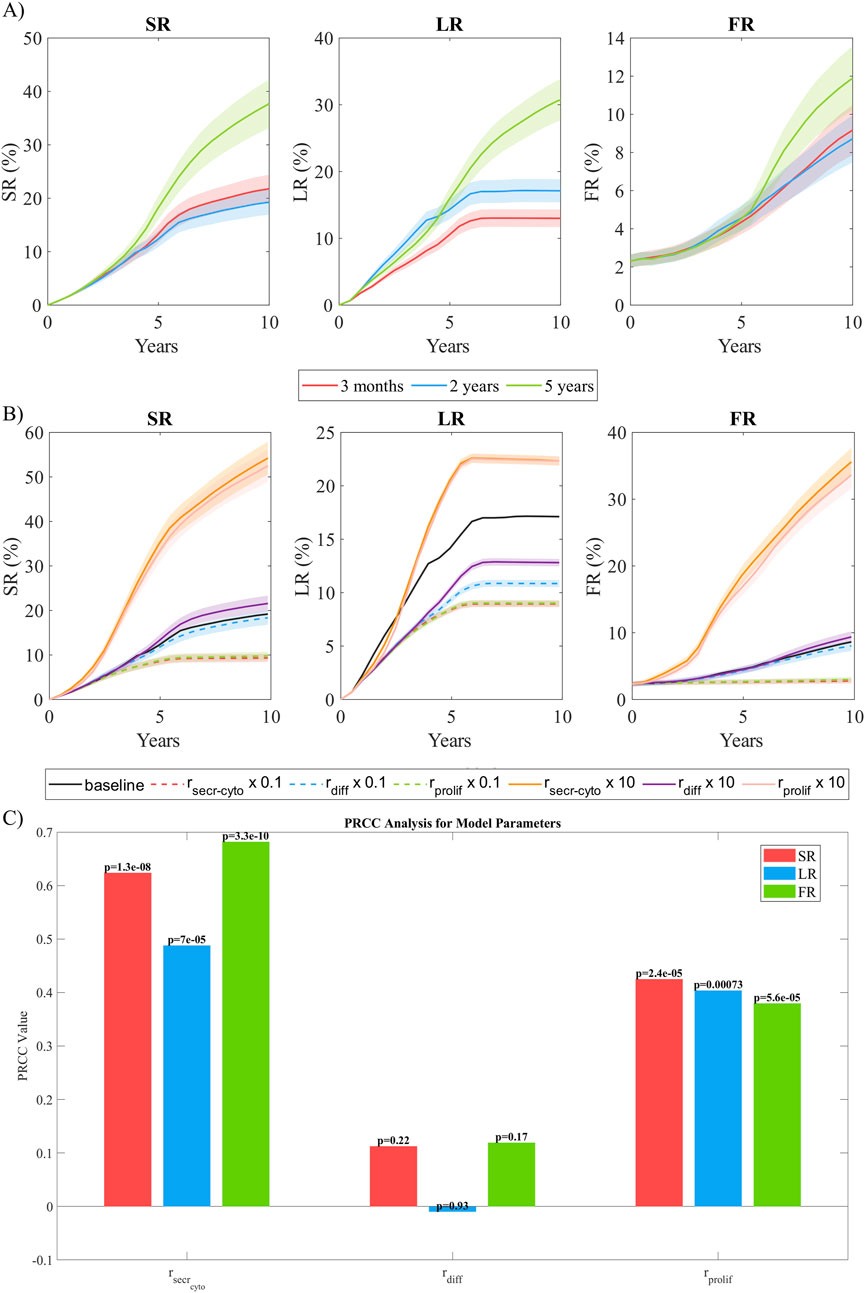
Figure 9. Sensitivity analysis. (A) Temporal evolution of SR, LR, and FR as a function of the coupling frequency between the continuous and discrete models. Coupling intervals of 3 months, 2 years, and 5 years were analyzed. (B) Temporal evolution of SR, LR, and FR as a function of the order of magnitude of the parameters studied (
To assess the model’s sensitivity to parameter variations, we selected
Figure 9B shows the temporal evolution of SR, LR and FR for every variation in the selected parameters. A reduction of cytokine secretion rate by one order of magnitude resulted in a total stenosis ratio after 10 years that was halved. This was primarily due to a 50% reduction in lipid growth and an almost complete absence of fibrous cap formation. The main reason for this behavior was the lack of cytokines in the system producing a pro-inflammatory response, leading to a significantly reduced
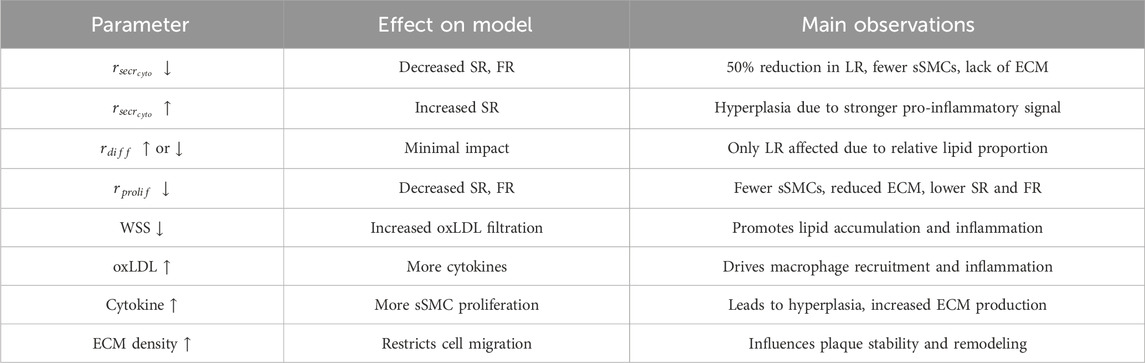
Table 6. Summary of the sensitivity analysis results and parameter influence on cellular behavior.
To assess the global influence of key model parameters—
To quantify the correlation between the model parameters and the target outputs (i.e., SR, LR, FR), Partial Rank Correlation Coefficients (PRCC) were computed. PRCC was chosen because it accounts for nonlinear but monotonic relationships while controlling for the influence of other parameters, providing a robust measure of sensitivity in complex biological models (Marino et al., 2008).
Figure 9C shows the PRCC analysis, revealing that
This methodology, integrating CFD, mass transport, and ABM to simulate plaque growth in coronary arteries under atherosclerosis, was validated against an experimental study involving individuals at high risk for atherosclerosis (Insull Jr 2009). The study focused on the population of New Orleans, a region with one of the highest cardiovascular disease (CVD) risk rates worldwide. Plaque progression data across different age groups were averaged to represent mean progression over time, allowing direct comparison with our model’s predictions. To be able to compare our model prediction against the results from the experimental study, we performed the computation until 30 years with the same coupling time.
Figure 10 compares our predictions on SR, LR and FR with the experimental data. The results demonstrate that the model performs well, showing robust predictive capabilities. In terms of LR, the model closely matches experimental trends, achieving similar lipid-core stabilization over time. For SR and FR, the model predicts a comparable trend, accurately reflecting the proportionally lower growth of FR relative to SR. However, the model underestimates overall growth compared to the experimental study. This discrepancy may stem from differences in the pathological stimuli considered. In our model, pathological conditions are induced by performing CFD on an idealized coronary artery, with a bifurcation and initial conditions triggering a pathological scenario. In contrast, the experimental study accounts for pathological stimuli from the high-fat diet prevalent in the New Orleans population.
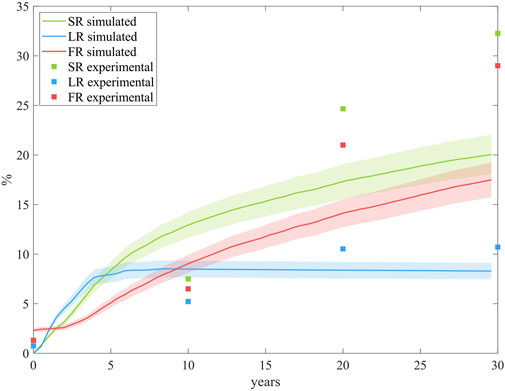
Figure 10. Comparison of the growth predictions from the model with the experimental data from the study conducted by Insull Jr (2009). The results are obtained from N = 10 simulations, showing the mean and standard deviation.
The study of hemodynamics using CFD was performed to calculate the WSS. Our CFD model identified the area of lowest WSS located near the bifurcation (Figure 4). This observation is linked to the idealized geometry and symmetric boundary conditions. Despite its limitations, the purpose of this geometry was to replicate the flow conditions of a healthy coronary artery subjected to a pathological stimulus. This was achieved by simulating flow in a bifurcation, creating sufficient flow disturbances to induce a low WSS capable of damaging the endothelium, thereby allowing substances like LDL to penetrate. Furthermore, over the years simulated within the model, we observed a phenomenon commonly found in patients with atherosclerosis: the presence of small plaques often leads to additional flow disturbances, promoting the growth of new plaques downstream. This behavior is particularly evident in the temporal evolution of CS4. Although the reasons for plaque growth near bifurcations in patient-specific arteries may vary, such as differences in artery caliber or pressure, our model consistently predicts the area of lowest WSS in a coherent region. However, it is important to consider not only the location of the WSS region but also its magnitude. And, as can be observed in Figure 4, the areas of lowest WSS show values much lower than 1 Pa, which implies a severe risk factor for plaque development.
Transport phenomena are strongly linked to endothelial damage. Disturbances in WSS alter the shape of endothelial cells, increasing their permeability and allowing both plasma and LDL molecules to infiltrate the vessel wall. The oxLDL concentration obtained under homeostatic conditions in our model (2.47
As illustrated in Figure 7, regions with lower WSS exhibit higher pressure, indicating a reduced pressure drop across the endothelium. Consequently, increased permeability correlates with greater pressure drops. These damaged regions also provide easier pathways for LDL molecules to transmigrate across the endothelium, leading to localized areas with elevated concentrations of oxLDL within the vessel wall.
None of the figures display oxLDL concentrations in the media layer. This choice was made to enhance the clarity of the figures, given the small thickness of the intima. However, it is important to emphasize the sharp decrease in oxLDL concentration from the intima to the media layer, which underscores the significant barrier posed by the IEL to oxLDL molecule transport. These findings are consistent with the fact that the intima layer is more permeable than the IEL, causing LDL molecules to primarily move circumferentially rather than radially once they reach the IEL.
With the proposed rules about MCs’ dynamics, the model successfully mimicked the process of oxLDL phagocytosis in the damaged area, leading to the formation of FCs. In contrast, in healthy areas, MCs underwent natural cell death, preventing the formation of FCs. During the phagocytosis process, MCs secreted pro-inflammatory cytokines, which play a crucial role in the activation of sSMCs, as well as in their migration and proliferation.
Once these cells switch phenotype to sSMCs, they migrate, proliferate, and produce ECM. However, as the lipid core grows due to the formation of FCs, MMPs are released, leading to ECM degradation. The transformation of MCs into FCs and the presence of MMPs prevent the formation of a significant fibrous cap until the growth of the lipid core stabilizes. Across all the cross-sections analyzed, once the lipid core stabilizes, the fibrous cap begins to thicken. This phenomenon also occurred in the model developed by Corti et al. (2020).
During their migration process, sSMCs utilized a shortest path-finding algorithm to identify and move toward the damaged patch in need of repair. The adaptation of the A* algorithm to successfully find the shortest path allowed the effective implementation of the minimum-energy principle, intrinsically present in cell remodeling (Garbey et al., 2015). According to the minimum-energy principle, the immune response exerted by sSMCs should be influenced by distance, as closer cells are more likely to sense the damage signals from the damaged area. Consequently, incorporating distance into the computation of the probabilities for different cellular events is crucial for accurately simulating this response. For instance, in the proliferation process, the proximity to the damaged area plays a critical role, with cells nearer to the damage exhibiting a higher probability of hyperplasia. This dynamic underscores the significant impact of localized damage on promoting cellular proliferation in the surrounding tissue, contributing to the overall progression of the wall growth.
The remodeling algorithm revealed a natural and organic appearance of Glagov’s remodeling (Glagov et al., 1987). To the best of our understanding, this is the first in silico framework where Glagov’s remodeling is observed without being hard-coded.
According to the temporal evolution of SR, the
The collagen increment was most pronounced in the areas immediately surrounding the necrotic core and the fibrous cap. This localized increase in collagen concentration contributed to the mechanical stability of the plaque, reducing the likelihood of rupture in regions with higher collagen deposition.
As a consequence of the stochastic rules developed in this model, it predicts the formation of an irregular fibrous cap, with significant variability in its thickness, which aligns with clinical observations of real atheromatous plaques. This irregularity in the fibrous cap is critical, as it can influence plaque stability and the risk of rupture.
To balance accuracy and computational cost, performing a sensitivity analysis on the coupling interval is essential. The highest accuracy would be achieved by coupling the models daily, updating the geometry, WSS, and oxLDL at the end of each simulation step of the ABM. However, this approach is computationally impractical. Therefore, it is necessary to find a trade-off between accuracy and computational efficiency. To address this, we analyzed coupling intervals of 3 months, 2 years, and 5 years. The results demonstrated the robustness of the model when coupling every 2 years, achieving performance comparable to 3-month coupling while significantly reducing computational costs. We suggest that, since WSS changes with vessel growth, a coupling interval triggered by at least a
In a model, it is common to find that certain parameters have a greater influence on the final outcome. Since our model was designed to replicate plaque growth, parameters directly affecting growth are expected to have the highest impact. To assess this, we analyzed the model’s sensitivity to variations of one order of magnitude in the cytokine secretion rate, vSMC differentiation rate, and sSMC proliferation rate. This analysis highlighted that
Overall, this analysis highlights the critical role of cytokine dynamics and ECM-related processes in driving the observed growth patterns, emphasizing the need for accurate calibration of these parameters to achieve realistic predictions.
Nevertheless, several important limitations remain. First, while most current atherosclerosis studies utilize patient-specific geometries, our model relies on an idealized geometry, which was necessary for the initial development of the framework. It is well recognized that results derived from idealized geometries may differ when applied to realistic ones. For instance, a notable feature of our model’s predictions is that most plaques grow symmetrically, a consequence of the absence of tortuosity in the geometry used. As such, employing an idealized coronary artery geometry may limit the model’s applicability to patient-specific conditions. Future work should focus on integrating patient-specific geometries to enhance the model’s clinical relevance.
Additionally, assumptions such as steady-state flow and Newtonian fluid behavior may not fully capture the complexities of in-vivo blood flow. Incorporating the cardiac cycle into the CFD model and more complex rheological properties could enhance accuracy. This could be further improved by utilizing atheroprone markers such as time-averaged wall shear stress or the oscillatory shear index. Nonetheless, these simplifications are widely used by most authors in the development of atherosclerosis models.
The iterative nature of the model, particularly the coupling between the CFD and ABM components, and the computation of the short-path finding algorithm, requires significant computational resources, which may limit its accessibility for widespread use.
Currently, many researchers are investigating additional factors that may influence plaque growth apart from the magnitude of WSS. Although the most widely accepted biomechanical marker by the scientific community has been the magnitude of WSS, other markers such as the Oscillatory Shear Index (OSI), transverse WSS (transWSS), WSS direction, and gradient are being proposed. In this study, we assumed the widely accepted hypothesis that endothelial cells change shape, making the endothelial barrier more porous. This shape change follows a model based on experimental data provided by Levesque et al. (1986), considering WSS as the main driver of endothelial damage. Future work could involve adjusting this model to include other variables such as OSI, but this remains a topic for further research.
We established a constant concentration of monocytes in the lumen of
This study enhances the level of detail in modeling atheroma plaque progression. A key innovation compared to other works in the field is the inclusion of greater specificity in the types of cells and cellular events modeled. This feature could provide a foundation for future research to evaluate the effectiveness of different therapies in slowing plaque progression.
Despite its limitations, the model serves as a powerful tool for predicting initiation and progression of the plaque, detecting high-risk regions and investigating potential therapeutic strategies. Future research should focus on refining the model and validating its predictions with clinical data to pave the way for its use in personalized medicine.
In this study, we developed a fully coupled model that serves as an innovative tool for investigating the underlying mechanisms of atherosclerosis, offering valuable insights for developing therapeutic and preventive strategies. This model simulates complex interactions between hemodynamics, mass transport, and cellular responses, providing a holistic understanding of disease progression. Although not yet validated against experimental or clinical data, it establishes a detailed framework for understanding atherosclerosis mechanisms and exploring potential therapeutic strategies. The findings serve as a foundation for future work, including model validation and refinement based on experimental data. Additionally, the integration and adaptation of the A* algorithm effectively modeled the complex migration and remodeling behavior of sSMCs in response to injury and cytokine signaling, providing a robust framework for understanding cellular dynamics in vascular pathology.
The original contributions presented in the study are included in the article/Supplementary Material. Further inquiries can be directed to the corresponding author.
RC: Conceptualization, Formal Analysis, Investigation, Methodology, Validation, Visualization, Writing–original draft, Writing–review and editing. MM: Methodology, Supervision, Validation, Writing–review and editing. EP: Conceptualization, Funding acquisition, Investigation, Methodology, Project administration, Resources, Supervision, Validation, Writing–review and editing.
The author(s) declare that financial support was received for the research, authorship, and/or publication of this article. Support was obtained from the Spanish Ministry of Science and Technology through research project PID 2022-140219OB-I00 funded by MICIU/AEI/10.13039/501100011033 and, by the ”European Union NextGenerationEU/PRTR”, as well as financial support to RC through grant PRE 2020-095671.
The authors thank the research support from the CIBER initiative. CIBER actions are financed by the Instituto de Salud Carlos III with assistance from the European Regional Development Fund.
The authors declare that the research was conducted in the absence of any commercial or financial relationships that could be construed as a potential conflict of interest.
The author(s) declare that no Generative AI was used in the creation of this manuscript.
All claims expressed in this article are solely those of the authors and do not necessarily represent those of their affiliated organizations, or those of the publisher, the editors and the reviewers. Any product that may be evaluated in this article, or claim that may be made by its manufacturer, is not guaranteed or endorsed by the publisher.
The Supplementary Material for this article can be found online at: https://www.frontiersin.org/articles/10.3389/fbioe.2025.1549104/full#supplementary-material
Ai, L., and Vafai, K. (2006). A coupling model for macromolecule transport in a stenosed arterial wall. Int. J. Heat Mass Transf. 49, 1568–1591. doi:10.1016/j.ijheatmasstransfer.2005.10.041
Albano, G., Giorno, V., Román-Román, P., and Torres-Ruiz, F. (2022). Study of a general growth model. Commun. Nonlinear Sci. Numer. Simul. 107, 106100. doi:10.1016/j.cnsns.2021.106100
Allen, L. J. (2010). An introduction to stochastic processes with applications to biology. Boca Raton, FL: CRC Press.
Banks, R. B. (2013). Growth and diffusion phenomena: mathematical frameworks and applications, 14. Springer Science and Business Media.
Bennett, M. R., Virmani, R., and Owens, G. K. (2016). Vascular smooth muscle cells in atherosclerosis. Circulation Res. 118, 692–702. doi:10.1161/circresaha.115.306361
Bhui, R., and Hayenga, H. N. (2017). An agent-based model of leukocyte transendothelial migration during atherogenesis. PLoS Comput. Biol. 13, e1005523. doi:10.1371/journal.pcbi.1005523
Boyle, C. J., Lennon, A. B., and Prendergast, P. J. (2011). In silico prediction of the mechanobiological response of arterial tissue: application to angioplasty and stenting. J. Biomechanical Eng. 133, 081001. doi:10.1115/1.4004492
Bulelzai, M. A., and Dubbeldam, J. L. (2012). Long time evolution of atherosclerotic plaques. J. Theor. Biol. 297, 1–10. doi:10.1016/j.jtbi.2011.11.023
Caballero, R., Martínez, M. Á., and Peña, E. (2023). Coronary artery properties in atherosclerosis: a deep learning predictive model. Front. Physiology 14, 1162436. doi:10.3389/fphys.2023.1162436
Calvez, V., Houot, J. G., Meunier, N., Raoult, A., and Rusnakova, G. (2010). Mathematical and numerical modeling of early atherosclerotic lesions. ESAIM Proc. EDP Sci. 30, 1–14. doi:10.1051/proc/2010002
Cancel, L. M., Fitting, A., and Tarbell, J. M. (2007). In vitro study of ldl transport under pressurized (convective) conditions. Am. J. Physiology-Heart Circulatory Physiology 293, H126–H132. doi:10.1152/ajpheart.01188.2006
Çap, M., Torii, R., Onuma, Y., Krams, R., Bennett, M. R., Stone, P. H., et al. (2023). Editorial: computational modeling for assessing coronary artery pathophysiology. Front. Cardiovasc. Med. 10, 1113835. doi:10.3389/fcvm.2023.1113835
Caro, C., Fitz-Gerald, J., and Schroter, R. (1971). Atheroma and arterial wall shear-observation, correlation and proposal of a shear dependent mass transfer mechanism for atherogenesis. Proc. R. Soc. Lond. Ser. B. Biol. Sci. 177, 109–159. doi:10.1098/rspb.1971.0019
Chen, P.-Y., Qin, L., Baeyens, N., Li, G., Afolabi, T., Budatha, M., et al. (2015). Endothelial-to-mesenchymal transition drives atherosclerosis progression. J. Clin. Investigation 125, 4514–4528. doi:10.1172/jci82719
Chien, S. (2008). Effects of disturbed flow on endothelial cells. Ann. Biomed. Eng. 36, 554–562. doi:10.1007/s10439-007-9426-3
Cilla, M., Martinez, J., Pena, E., and Martínez, M. Á. (2012). Machine learning techniques as a helpful tool toward determination of plaque vulnerability. IEEE Trans. Biomed. Eng. 59, 1155–1161. doi:10.1109/tbme.2012.2185495
Corti, A., Chiastra, C., Colombo, M., Garbey, M., Migliavacca, F., and Casarin, S. (2020). A fully coupled computational fluid dynamics–agent-based model of atherosclerotic plaque development: multiscale modeling framework and parameter sensitivity analysis. Comput. Biol. Med. 118, 103623. doi:10.1016/j.compbiomed.2020.103623
Curry, F. (1983). Mechanics and thermodynamics of transcapillary exchange. Handb. Physiology. Cardiovasc. Syst. Microcirc. Sect. 2, 309–374.
Dabagh, M., Jalali, P., and Tarbell, J. M. (2009). The transport of ldl across the deformable arterial wall: the effect of endothelial cell turnover and intimal deformation under hypertension. Am. J. Physiology-Heart Circulatory Physiology 297, H983–H996. doi:10.1152/ajpheart.00324.2009
Dodge Jr, J. T., Brown, B. G., Bolson, E. L., and Dodge, H. T. (1992). Lumen diameter of normal human coronary arteries. influence of age, sex, anatomic variation, and left ventricular hypertrophy or dilation. Circulation 86, 232–246. doi:10.1161/01.cir.86.1.232
Escuer, J., Martínez, M. A., McGinty, S., and Peña, E. (2019). Mathematical modelling of the restenosis process after stent implantation. J. R. Soc. Interface 16, 20190313. doi:10.1098/rsif.2019.0313
Esper, R. J., Nordaby, R. A., Vilariño, J. O., Paragano, A., Cacharrón, J. L., and Machado, R. A. (2006). Endothelial dysfunction: a comprehensive appraisal. Cardiovasc. Diabetol. 5, 4–18. doi:10.1186/1475-2840-5-4
Filipovic, N., Rosic, M., Tanaskovic, I., Milosevic, Z., Nikolic, D., Zdravkovic, N., et al. (2011). Artreat project: three-dimensional numerical simulation of plaque formation and development in the arteries. IEEE Trans. Inf. Technol. Biomed. 16, 272–278. doi:10.1109/titb.2011.2168418
Filipovic, N., Teng, Z., Radovic, M., Saveljic, I., Fotiadis, D., and Parodi, O. (2013). Computer simulation of three-dimensional plaque formation and progression in the carotid artery. Med. and Biol. Eng. and Comput. 51, 607–616. doi:10.1007/s11517-012-1031-4
Filipović, N. D., and Kojić, M. (2004). Computer simulations of blood flow with mass transport through the carotid artery bifurcation. Theor. Appl. Mech. 31, 1–33. doi:10.2298/tam0401001f
Finn, A. V., Nakano, M., Narula, J., Kolodgie, F. D., and Virmani, R. (2010). Concept of vulnerable/unstable plaque. Arteriosclerosis, Thrombosis, Vasc. Biol. 30, 1282–1292. doi:10.1161/atvbaha.108.179739
Garbey, M., Rahman, M., and Berceli, S. (2015). A multiscale computational framework to understand vascular adaptation. J. Comput. Sci. 8, 32–47. doi:10.1016/j.jocs.2015.02.002
Glagov, S., Weisenberg, E., Zarins, C. K., Stankunavicius, R., and Kolettis, G. J. (1987). Compensatory enlargement of human atherosclerotic coronary arteries. N. Engl. J. Med. 316, 1371–1375. doi:10.1056/nejm198705283162204
Gomez, D., and Owens, G. K. (2012). Smooth muscle cell phenotypic switching in atherosclerosis. Cardiovasc. Res. 95, 156–164. doi:10.1093/cvr/cvs115
Gu, Q., Yang, X., Lv, J., Zhang, J., Xia, B., Kim, J.-d., et al. (2019). Aibp-mediated cholesterol efflux instructs hematopoietic stem and progenitor cell fate. Science 363, 1085–1088. doi:10.1126/science.aav1749
Gu, S. Z., and Bennett, M. R. (2022). Plaque structural stress: detection, determinants and role in atherosclerotic plaque rupture and progression. Front. Cardiovasc. Med. 9, 875413. doi:10.3389/fcvm.2022.875413
Hart, P. E., Nilsson, N. J., and Raphael, B. (1968). A formal basis for the heuristic determination of minimum cost paths. IEEE Trans. Syst. Sci. Cybern. 4, 100–107. doi:10.1109/tssc.1968.300136
Hartman, E. M., De Nisco, G., Gijsen, F. J., Korteland, S.-A., van der Steen, A. F., Daemen, J., et al. (2021). The definition of low wall shear stress and its effect on plaque progression estimation in human coronary arteries. Sci. Rep. 11, 22086. doi:10.1038/s41598-021-01232-3
Hasheminasabgorji, E., and Jha, J. C. (2021). Dyslipidemia, diabetes and atherosclerosis: role of inflammation and ros-redox-sensitive factors. Biomedicines 9, 1602. doi:10.3390/biomedicines9111602
Hernández-López, P. (2023). In silico analysis of the process of atheroma plaque formation and growth in arteries. Zaragoza, Spain: Universidad de Zaragoza. PhD thesis.
Hernández-López, P., Cilla, M., Martínez, M., and Peña, E. (2021). Effects of the haemodynamic stimulus on the location of carotid plaques based on a patient-specific mechanobiological plaque atheroma formation model. Front. Bioeng. Biotechnol. 9, 690685. doi:10.3389/fbioe.2021.690685
Insull, J. W. (2009). The pathology of atherosclerosis: plaque development and plaque responses to medical treatment. Am. J. Med. 122, S3–S14. doi:10.1016/j.amjmed.2008.10.013
Ito, F., Sono, Y., and Ito, T. (2019). Measurement and clinical significance of lipid peroxidation as a biomarker of oxidative stress: oxidative stress in diabetes, atherosclerosis, and chronic inflammation. Antioxidants 8, 72. doi:10.3390/antiox8030072
Jebari-Benslaiman, S., Galicia-García, U., Larrea-Sebal, A., Olaetxea, J. R., Alloza, I., Vandenbroeck, K., et al. (2022). Pathophysiology of atherosclerosis. Int. J. Mol. Sci. 23, 3346. doi:10.3390/ijms23063346
Karner, G., Perktold, K., and Zehentner, H. P. (2001). Computational modeling of macromolecule transport in the arterial wall. Comput. Methods Biomechanics Biomed. Eng. 4, 491–504. doi:10.1080/10255840108908022
Kedem, O., and Katchalsky, A. (1958). Thermodynamic analysis of the permeability of biological membranes to non-electrolytes. Biochimica Biophysica Acta 27, 229–246. doi:10.1016/0006-3002(58)90330-5
Khan, F. H., and Khan, F. (2009). The elements of immunology. New Delhi, India: Pearson Education India.
Latorre, Á. T., Martínez, M. A., and Peña, E. (2023). Characterizing atherosclerotic tissues: in silico analysis of mechanical properties using intravascular ultrasound and inverse finite element methods. Front. Bioeng. Biotechnol. 11, 1304278. doi:10.3389/fbioe.2023.1304278
Levesque, M. J., Liepsch, D., Moravec, S., and Nerem, R. M. (1986). Correlation of endothelial cell shape and wall shear stress in a stenosed dog aorta. Arteriosclerosis 6, 220–229. doi:10.1161/01.atv.6.2.220
Libby, P. (2013). Mechanisms of acute coronary syndromes and their implications for therapy. N. Engl. J. Med. 368, 2004–2013. doi:10.1056/nejmra1216063
Libby, P., Buring, J. E., Badimon, L., Hansson, G. K., Deanfield, J., Bittencourt, M. S., et al. (2019). Atherosclerosis. Nat. Rev. Dis. Prim. 5, 56. doi:10.1038/s41572-019-0106-z
Liu, B., and Tang, D. (2010). Computer simulations of atherosclerotic plaque growth in coronary arteries. Mol. and Cell. Biomechanics 7, 193–202.
Liu, H., Lan, L., Abrigo, J., Ip, H. L., Soo, Y., Zheng, D., et al. (2021). Comparison of Newtonian and non-Newtonian fluid models in blood flow simulation in patients with intracranial arterial stenosis. Front. Physiology 12, 718540. doi:10.3389/fphys.2021.718540
MacAlpin, R. N., Abbasi, A. S., Grollman Jr, J. H., and Eber, L. (1973). Human coronary artery size during life: a cinearteriographic study. Radiology 108, 567–576. doi:10.1148/108.3.567
Malek, A. M., Alper, S. L., and Izumo, S. (1999). Hemodynamic shear stress and its role in atherosclerosis. Jama 282, 2035–2042. doi:10.1001/jama.282.21.2035
Malvè, M., Chandra, S., García, A., Mena, A., Martínez, M., Finol, E., et al. (2014). Impedance-based outflow boundary conditions for human carotid haemodynamics. Comput. Methods Biomechanics Biomed. Eng. 17, 1248–1260. doi:10.1080/10255842.2012.744396
Marino, S., Hogue, I. B., Ray, C. J., and Kirschner, D. E. (2008). A methodology for performing global uncertainty and sensitivity analysis in systems biology. J. Theor. Biol. 254, 178–196. doi:10.1016/j.jtbi.2008.04.011
Martin, S. S., Blaha, M. J., Blankstein, R., Agatston, A., Rivera, J. J., Virani, S. S., et al. (2014). Dyslipidemia, coronary artery calcium, and incident atherosclerotic cardiovascular disease: implications for statin therapy from the multi-ethnic study of atherosclerosis. Circulation 129, 77–86. doi:10.1161/circulationaha.113.003625
Michel, C., and Curry, F. (1999). Microvascular permeability. Physiol. Rev. 79, 703–761. doi:10.1152/physrev.1999.79.3.703
Murray, C. D. (1926). The physiological principle of minimum work: I. the vascular system and the cost of blood volume. Bryn Mawr, PA: Proceedings of the National Academy of Sciences, 207–214.
Nakano-Kurimoto, R., Ikeda, K., Uraoka, M., Nakagawa, Y., Yutaka, K., Koide, M., et al. (2009). Replicative senescence of vascular smooth muscle cells enhances the calcification through initiating the osteoblastic transition. Am. J. Physiology-Heart Circulatory Physiology 297, H1673–H1684. doi:10.1152/ajpheart.00455.2009
Ohayon, J., Finet, G., Gharib, A. M., Herzka, D. A., Tracqui, P., Heroux, J., et al. (2008). Necrotic core thickness and positive arterial remodeling index: emergent biomechanical factors for evaluating the risk of plaque rupture. Am. J. Physiology-heart Circulatory Physiology 295, H717–H727. doi:10.1152/ajpheart.00005.2008
Olgac, U., Kurtcuoglu, V., and Poulikakos, D. (2008). Computational modeling of coupled blood-wall mass transport of ldl: effects of local wall shear stress. Am. J. Physiology-Heart Circulatory Physiology 294, H909–H919. doi:10.1152/ajpheart.01082.2007
Patlak, C., Goldstein, D., and Hoffman, J. (1963). The flow of solute and solvent across a two-membrane system. J. Theor. Biol. 5, 426–442. doi:10.1016/0022-5193(63)90088-2
Pederiva, C., Capra, M. E., Viggiano, C., Rovelli, V., Banderali, G., and Biasucci, G. (2021). Early prevention of atherosclerosis: detection and management of hypercholesterolaemia in children and adolescents. Life 11, 345. doi:10.3390/life11040345
Peña, E., Cilla, M., Latorre, Á. T., Martínez, M. A., Gómez, A., Pettigrew, R. I., et al. (2021). “Emergent biomechanical factors predicting vulnerable coronary atherosclerotic plaque rupture,” in Biomechanics of coronary atherosclerotic plaque (Elsevier), 361–380.
Poznyak, A. V., Sadykhov, N. K., Kartuesov, A. G., Borisov, E. E., Melnichenko, A. A., Grechko, A. V., et al. (2022). Hypertension as a risk factor for atherosclerosis: cardiovascular risk assessment. Front. Cardiovasc. Med. 9, 959285. doi:10.3389/fcvm.2022.959285
Prati, F., Regar, E., Mintz, G. S., Arbustini, E., Di Mario, C., Jang, I.-K., et al. (2010). Expert review document on methodology, terminology, and clinical applications of optical coherence tomography: physical principles, methodology of image acquisition, and clinical application for assessment of coronary arteries and atherosclerosis. Eur. Heart J. 31, 401–415. doi:10.1093/eurheartj/ehp433
Prosi, M., Zunino, P., Perktold, K., and Quarteroni, A. (2005). Mathematical and numerical models for transfer of low-density lipoproteins through the arterial walls: a new methodology for the model set up with applications to the study of disturbed lumenal flow. J. Biomechanics 38, 903–917. doi:10.1016/j.jbiomech.2004.04.024
Reiner, Ž., Catapano, A. L., De Backer, G., Graham, I., Taskinen, M.-R., Wiklund, O., et al. (2011). Esc/eas guidelines for the management of dyslipidaemias: the task force for the management of dyslipidaemias of the european society of cardiology (esc) and the european atherosclerosis society (eas). Eur. Heart J. 32, 1769–1818. doi:10.1093/eurheartj/ehr158
Roth, G. A., Mensah, G. A., Johnson, C. O., Addolorato, G., Ammirati, E., Baddour, L. M., et al. (2020). Global burden of cardiovascular diseases and risk factors, 1990–2019: update from the gbd 2019 study. J. Am. Coll. Cardiol. 76, 2982–3021. doi:10.1016/j.jacc.2020.11.010
Sakamoto, N., Ohashi, T., and Sato, M. (2004). Effect of shear stress on permeability of vascular endothelial monolayer cocultured with smooth muscle cells. JSME Int. J. Ser. C Mech. Syst. Mach. Elem. Manuf. 47, 992–999. doi:10.1299/jsmec.47.992
Schoenhagen, P., Ziada, K. M., Vince, D. G., Nissen, S. E., and Tuzcu, E. M. (2001). Arterial remodeling and coronary artery disease: the concept of “dilated” versus “obstructive” coronary atherosclerosis. J. Am. Coll. Cardiol. 38, 297–306. doi:10.1016/s0735-1097(01)01374-2
Stefanadis, C., Antoniou, C.-K., Tsiachris, D., and Pietri, P. (2017). Coronary atherosclerotic vulnerable plaque: current perspectives. J. Am. Heart Assoc. 6, e005543. doi:10.1161/jaha.117.005543
Steinberg, D., Khoo, J. C., Glass, C. K., Palinski, W., and Almazan, F. (1997). A new approach to determining the rates of recruitment of circulating leukocytes into tissues: application to the measurement of leukocyte recruitment into atherosclerotic lesions. Proc. Natl. Acad. Sci. 94, 4040–4044. doi:10.1073/pnas.94.8.4040
Suciu, A. (1997). Effects of external forces on endothelial cells. Lausanne, Switzerland: EPFL. Tech. rep.
Sukhovershin, R. A., Furman, N. E. T., Tasciotti, E., and Trachtenberg, B. H. (2016). Local inhibition of macrophage and smooth muscle cell proliferation to suppress plaque progression. Methodist DeBakey Cardiovasc. J. 12, 141–145. doi:10.14797/mdcj-12-3-141
Sun, N., Wood, N. B., Hughes, A. D., Thom, S. A., and Xu, X. Y. (2006). Fluid-wall modelling of mass transfer in an axisymmetric stenosis: effects of shear-dependent transport properties. Ann. Biomed. Eng. 34, 1119–1128. doi:10.1007/s10439-006-9144-2
Tarbell, J. M. (2003). Mass transport in arteries and the localization of atherosclerosis. Annu. Rev. Biomed. Eng. 5, 79–118. doi:10.1146/annurev.bioeng.5.040202.121529
Tedgui, A., and Lever, M. (1984). Filtration through damaged and undamaged rabbit thoracic aorta. Am. J. Physiology-Heart Circulatory Physiology 247, H784–H791. doi:10.1152/ajpheart.1984.247.5.h784
Tziotziou, A., Hartman, E., Korteland, S.-A., van der Lugt, A., van der Steen, A. F., Daemen, J., et al. (2023). Mechanical wall stress and wall shear stress are associated with atherosclerosis development in non-calcified coronary segments. Atherosclerosis 387, 117387. doi:10.1016/j.atherosclerosis.2023.117387
Virmani, R., Burke, A. P., Farb, A., and Kolodgie, F. D. (2006). Pathology of the vulnerable plaque. J. Am. Coll. Cardiol. 47, C13–C18. doi:10.1016/j.jacc.2005.10.065
Weinbaum, S., Tzeghai, G., Ganatos, P., Pfeffer, R., and Chien, S. (1985). Effect of cell turnover and leaky junctions on arterial macromolecular transport. Am. J. Physiology-Heart Circulatory Physiology 248, H945–H960. doi:10.1152/ajpheart.1985.248.6.h945
Wentzel, J., Tziotziou, A., Hartman, E., Korteland, S., Van Der Steen, A., Daemen, J., et al. (2023). Influence of wall shear and structural stress on plaque progression of different phenotype in human coronary arteries. Eur. Heart J. 44, ehad655–1388. doi:10.1093/eurheartj/ehad655.1388
Wilkins, E., Wilson, L., Wickramasinghe, K., Bhatnagar, P., Leal, J., Luengo-Fernandez, R., et al. (2017). European cardiovascular disease statistics 2017. Belgium, Brussels: European Heart Network.
Yoshimatsu, Y., and Watabe, T. (2022). Emerging roles of inflammation-mediated endothelial-mesenchymal transition in health and disease. Inflamm. Regen. 42 (9), 9. doi:10.1186/s41232-021-00186-3
Zahedmanesh, H., Van Oosterwyck, H., and Lally, C. (2014). A multi-scale mechanobiological model of in-stent restenosis: deciphering the role of matrix metalloproteinase and extracellular matrix changes. Comput. Methods Biomechanics Biomed. Eng. 17, 813–828. doi:10.1080/10255842.2012.716830
Keywords: atherosclerosis, agent-based model (ABM), cfd-computational fluid dynamics, transport phenomena, hybrid model
Citation: Caballero R, Martínez MÁ and Peña E (2025) Fully coupled hybrid in-silico modeling of atherosclerosis: A multi-scale framework integrating CFD, transport phenomena and agent-based modeling. Front. Bioeng. Biotechnol. 13:1549104. doi: 10.3389/fbioe.2025.1549104
Received: 20 December 2024; Accepted: 24 February 2025;
Published: 28 March 2025.
Edited by:
Seungik Baek, Michigan State University, United StatesReviewed by:
Monika Colombo, Aarhus University, DenmarkCopyright © 2025 Caballero, Martínez and Peña. This is an open-access article distributed under the terms of the Creative Commons Attribution License (CC BY). The use, distribution or reproduction in other forums is permitted, provided the original author(s) and the copyright owner(s) are credited and that the original publication in this journal is cited, in accordance with accepted academic practice. No use, distribution or reproduction is permitted which does not comply with these terms.
*Correspondence: Ricardo Caballero, cmNhYmFsbGVyb0B1bml6YXIuZXM=
Disclaimer: All claims expressed in this article are solely those of the authors and do not necessarily represent those of their affiliated organizations, or those of the publisher, the editors and the reviewers. Any product that may be evaluated in this article or claim that may be made by its manufacturer is not guaranteed or endorsed by the publisher.
Research integrity at Frontiers
Learn more about the work of our research integrity team to safeguard the quality of each article we publish.