- 1School of Intelligent Manufacturing Engineering, Chongqing University of Arts and Sciences, Chongqing, China
- 2Department of Physiology, Army Medical University, Chongqing, China
- 3School of Mechanical Engineering, Sichuan University of Science & Engineering, Yibin, Sichuan, China
Introduction: Assessing the olfactory preferences of drivers can help improve the odor environment and enhance comfort during driving. However, the current evaluation methods have limited availability, including subjective evaluation, electroencephalogram, and behavioral action methods. Therefore, this study explores the potential of autonomic response signals for assessing the olfactory preferences.
Methods: This paper develops a machine learning model that classifies the olfactory preferences of drivers based on physiological signals. The dataset used for training in this study comprises 132 olfactory preference samples collected from 33 drivers in real driving environments. The dataset includes features related to heart rate variability, electrodermal activity, and respiratory signals which are baseline processed to eliminate the effects of environmental and individual differences. Six types of machine learning models (Logistic Regression, Support Vector Machine, Decision Tree, Random Forest, K-Nearest Neighbors, and Naive Bayes) are trained and evaluated on this dataset.
Results: The results demonstrate that all models can effectively classify driver olfactory preferences, and the decision tree model achieves the highest classification accuracy (88%) and F1-score (0.87). Additionally, compared with the dataset without baseline processing, the model’s accuracy increases by 3.50%, and the F1-score increases by 6.33% on the dataset after baseline processing.
Conclusions: The combination of physiological signals and machine learning models can effectively classify drivers' olfactory preferences. Results of this study can provide a comprehensive understanding on the olfactory preferences of drivers, ultimately enhancing driving comfort.
1 Introduction
Driving comfort was a critical consideration in automotive design, prompting automakers to enhance driving comfort by using in-vehicle fragrances to improve the odor environment (Mustafa et al., 2016; Gentner et al., 2021). However, the current evaluation methods were unable to effectively assess the olfactory preferences of drivers, leading to a lack of sufficient consideration for driver olfactory preferences in the design process of in-vehicle fragrances. This resulted in existing in-vehicle fragrances struggling to achieve the expected effects of improving the odor environment and enhancing driving comfort. Therefore, it was crucial to find an effective olfactory preferences evaluation method to provide an important reference for in-vehicle fragrance designers and significantly enhance the driver’s comfort during driving.
The previously available evaluation methods could not effectively assess drivers’ olfactory preferences, indicating that the adopted approaches were not suitable for assessing olfactory preferences (Seok et al., 2017; Williams et al., 2023; Schacht et al., 2009). For example, in subjective evaluation methods, a large number of studies used rating scales to assess olfactory perception preferences (Yang W. et al., 2024; Martínez-Pascual et al., 2023), including evaluating the pleasantness of odors (Sorokowska et al., 2022; Farahani et al., 2023; Klyuchnikova et al., 2022) and the intensity of odors (Fjaeldstad et al., 2019; Lesur et al., 2023). However, these evaluation methods were highly subjective, and it often led to evaluation results being contrary to reality since drivers lacked the professional olfactory training (Hakyemez et al., 2013; Han et al., 2021; Seok et al., 2017). The use of electroencephalogram (EEG) methods could accurately determine the brain activity associated with drivers’ olfactory preferences (Nakahara et al., 2020; Islam et al., 2018). However, this method was difficult to apply (Abenna et al., 2023), demanding significant time and economic resources (Williams et al., 2023), which was the primary reason why electroencephalogram methods had not been widely adopted. Additionally, olfactory perception preferences could also be better evaluated through collecting behavioral data (Naudon et al., 2020; Ryan et al., 2008), but behavioral data could only reflect a part of physical indicators and could not fully reflect olfactory feelings. Actually, there was a correlation between physiological signals (such as electrodermal activity, heart rate, and respiratory signal) and olfactory preferences in the human body (Laureanti et al., 2022; Aurup, 2011). In the field of emotion research, physiological signals could characterize feelings of pleasure and disgust (Khare et al., 2023; Cai et al., 2023; Singh et al., 2023). Therefore, this provided a potential approach for assessing olfactory perceptual preferences. However, this finding had not yet been incorporated into olfactory preference evaluation methods.
The physiological signals of the human body were spontaneous responses used to assess physiological and psychological states (Li et al., 2023; Saha et al., 2024). Research had shown that the autonomic nervous system of the human body underwent changes after olfactory training, allowing for the identification of individual preferences for specific odors by observing different autonomic responses (Parreira et al., 2023). In addition, researchers had also found that experiencing different fragrances could alter skin-related physiological signals (Jiao et al., 2023). These results had potential practical value. However, single-modal physiological signals cannot comprehensively reflect an individual’s physiological changes and are easily influenced by external factors. Therefore, multimodal signals offer greater advantages in physiological monitoring (Garcia-Ceja et al., 2018; Debie et al., 2019).
To achieve a better recognition accuracy and a more stable recognition model, researchers explored physiological state recognition methods that integrated multimodal physiological signals. Chen et al. (2022) integrated electroencephalogram, heart rate variability, and electromyography signals into a convolutional neural network model, achieving alertness detection of drivers. Gong et al. (2024) designed a multimodal fusion method that simultaneously considered heterogeneity and correlation and explored the optimal combination of various physiological signals. Kose et al. (2021) used a fusion of horizontal eye movement, vertical eye movement, zygomatic muscle electrical activity, and trapezius muscle electrical activity to improve existing emotion recognition methods. Jia et al. (2022) proposed a domain adversarial learning squeeze and excitation network based on multimodal physiological signals to capture the characteristics of electroencephalogram (EEG) and electrooculogram (EOG) during sleep staging. The results showed that multimodal signals were effective for sleep staging tasks. For further research and convenience. This study chose to integrate electrodermal activity (EDA) (Shehu et al., 2023), heart rate variability (HRV) (Martis et al., 2014), and respiration (RESP) (Shin et al., 2022) features as indicators to assess drivers’ olfactory preferences.
This study aims to develop a machine learning model that using multiple physiological signals to evaluate drivers’ olfactory preferences. The ultimate goal is to assist automotive designers in creating in-vehicle fragrances that aligned with drivers’ olfactory preferences, enhancing driver comfort during driving. The contribution of this study could be summarized as the following:
(1) The experimental setting of this study is conducted in a real road environment, which allows the physiological response of drivers when experiencing in-vehicle fragrances to be closer to the real situation. To eliminate the influence of driving on physiological signals, a calm driving phase is implemented.
(2) To eliminate the influence of individual physiological differences, baseline processing is applied to collect physiological signal features. Additionally, to maxim-ize the retention of information from the original features, feature concatenation is employed for feature fusion.
(3) Six machine learning models are evaluated in this study. Results show that the decision tree model performed a better accuracy than the other models. In addition, the predicted results also show that models used in the work performed better in predicting the “disgust” preferences than that of the “like” preferences.
2 Materials and methods
The dataset used for training in this study comprises 132 olfactory preference samples collected from 33 drivers. To assess olfactory preferences, the participating drivers (Section 2.1) are strictly screened. This paper uses the ErgoLAB multichannel physiological instrument to collect physiological signals from these candidates and uses a 9-point hedonic scale to collect olfactory preference data from drivers (Section 2.2). In addition, the time domain and frequency domain analysis on the collected physiological data are conducted to obtain a feature set (Section 2.3). Finally, this study uses the driver’s olfactory preference data and the driver’s physiological signal feature set as the target label and the input feature, respectively. The performance of six machine learning models is trained (Section 2.4) and evaluated (Section 2.5) to predict the driver’s olfactory preference. The identification framework of drivers’ olfactory preferences is shown in Figure 1.
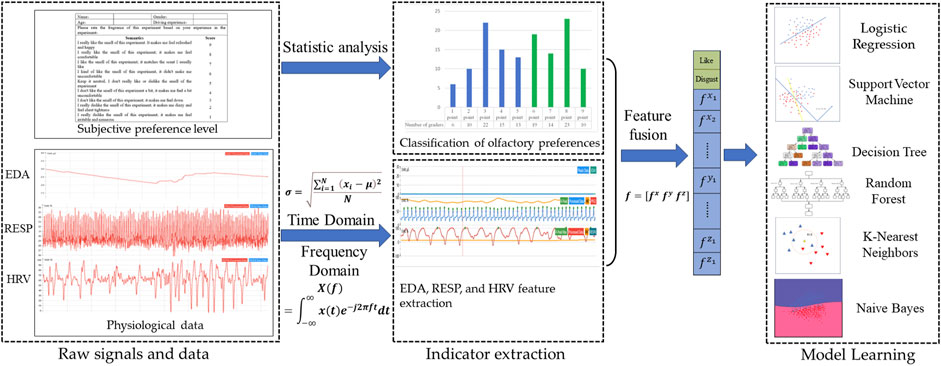
Figure 1. A framework for identifying driver olfactory preferences based on multiple physiological signals.”
2.1 Participant
This study selects 33 drivers (16 males and 17 females) as participants through three rounds of screening. All participants are between 21 and 32 years of age (mean = 26.7 years; standard deviation = 2.6 years), with an average driving experience of 3.7 years (standard deviation = 2.1; range = 8–1 years). The experimental content and procedures of this experiment are approved by the Ethics Committee of Chongqing University of Arts and Sciences (approval no. CQWL202403). Firstly, the first round of screening eliminates drivers with central nervous system diseases and rhinitis. Secondly, subjective judgment tests are conducted in the second round of screening to ensure that participants can accurately judge their preferences. Finally, the third round of screening eliminates participants whose vital signs such as heart rate and breathing are not within the normal range before the experiment, as well as participants who have eaten heavy flavored foods before the experiment. After obtaining the participant’s consent, an informed consent form is signed with the participants, and they are informed on the experiment content and tasks to be completed during the experiment.
2.2 Equipment and procedure
In this study, peppermint essential oil, jasmine essential oil, sweet orange essential oil, and lavender essential oil are used as odor sources (the essential oil reagents are obtained from Refined Aroma and are non-toxic and harmless to humans). These odors are widely used in experiments and life (El Hachlafi et al., 2023; Karimi et al., 2024; Diass et al., 2021). The generation of odors is achieved through olfactory testing experience instruments (Tang et al., 2019; Tang et al., 2022). The ErgoLAB signal acquisition module is used to collect and record the physiological signals of participants (Zheng et al., 2021; Qu and Xie, 2023). The program for the experimental process is written through the ErgoLAB human-computer interaction platform (Liu et al., 2019). Specifications of the physiological signal data acquisition equipment are as follows:
(1) ErgoLAB EDA wireless electrodermal sensor (sampling rate: 64 Hz, acquisition range: 0–30 μS). The two electrodes of the EDA sensor are fixed at the fingertips of the index finger and middle finger (as shown in Figure 2A).
(2) ErgoLAB RESP wireless respiratory sensor (sampling rate: 64 Hz; acquisition range: 0–140 rpm). The belt of the RESP sensor is fixed between the chest and abdomen of the subject (as shown in Figure 2B).
(3) ErgoLAB PPG wireless blood volume pulse sensor (sampling rate: 64 Hz; acquisition range: 0–240 bpm). The ear clip electrodes of the PPG sensor are fixed on the earlobe (as shown in Figure 2C).
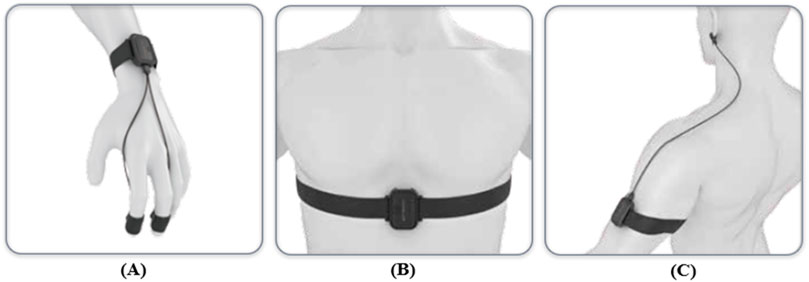
Figure 2. The wearing diagram of physiological signal sensor. (A) The wearing Diagram of EDA sensor; (B) The wearing Diagram of RESP sensor; (C) The wearing Diagram of PPG sensor.
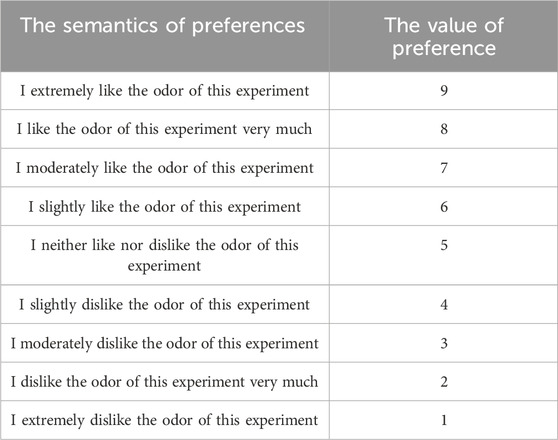
In addition, this paper obtains the olfactory preference data of drivers through a 9-point hedonic scale (Xia et al., 2020). The 9-point hedonic scale is used to evaluate “like”, but it is often used to measure preferences (Barnett et al., 2019; English et al., 2019). It consists of nine different categories of semantic components, ranging from ‘extreme dislike’ to ‘extreme like’.
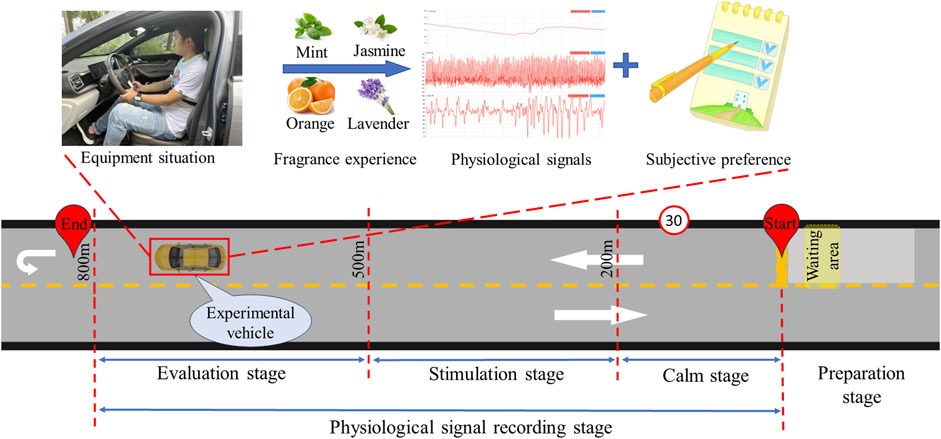
The experimental scenario is a closed two-lane highway, which is a straight road (speed limit of 30 km/h). The starting point and ending point of the experiment are about 800 m apart. The experimental vehicle is an automatic transmission vehicle without any odor. The experimental road is divided into four areas (preparation stage, calm stage, stimulation stage, and evaluation stage). The area 200 m forward from the starting point is the calm stage, the area 300 m forward from the end of the calm stage is the fragrance stimulation stage, and the area 300 m forward from the end of the stimulation stage is the olfactory preference collection stage. This experimental scenario is diagramed in Figure 3.
Each driver needs to complete four rounds of driving tasks, which means completing the experiments in the mint group, jasmine group, sweet orange group, and lavender group. The four groups of experiments are conducted randomly. The driving task for each lap includes four stages (preparation stage, calm stage, stimulation stage, and evaluation stage). Before each round of the experiment, the participants need to complete the preparation stage tasks in the waiting area. During the preparation stage, the experimenter needs to deodorize the car to ensure that there is no odor affecting the subsequent experiment. The participant needs to drive the vehicle and maintain a stable state of mind in the calm stage. When the vehicle enters the stimulating stage area, the fragrance begins to be released. After completing all the experimental tasks, the vehicle turns around and return to the waiting area to repeat the above experimental tasks. The scoring table was completed during the evaluation stage (as shown in Table 1).
2.3 Feature extraction
Feature extraction refers to extracting representative and distinguishable features from raw data to describe the attributes and characteristics of the data. Feature extraction plays a crucial role in machine learning (Escobar-Linero et al., 2022). This study extracts electrodermal activity (EDA), heart rate variability (HRV), and respiratory signal-related features from 132 olfactory preference samples as the basis for evaluating olfactory preference. Table 2 shows the features extracted from three physiological signals.

Table 2. The physiological signal features extracted from heart rate variability (HRV), electrodermal activity (EDA), and respiratory signals (RESP), along with their corresponding symbols.
In addition, this paper uses changes in physiological signals as the input features of the model, meaning that all the input features of the model undergo baseline processing (Maithri et al., 2022). Specifically, the final feature is the difference of the physiological signal feature values extracted during the stimulation phase and the calm phase (Feature = FeatureStimulation − FeatureCalm).
2.3.1 Time domain feature extraction
In time domain analysis, this paper calculates the mean (M), standard deviation (SD), and range-related features of three physiological signals. Due to the importance of R-wave detection in the time domain analysis of HRV (Gupta et al., 2020), the following extracting features are focused: standard deviation of normal and normal intervals (SDNN), root mean square of successive differences in adjacent intervals (RMSSD), standard deviation of successive differences in adjacent intervals (SDSD), standard deviation of instantaneous heartbeat interval R-R variability (SD1), standard deviation of continuous long-term R-R variability (SD2), and heart rate (HR).
By taking the first-order difference of the R-wave time point, all R-R intervals of the HRV signal are obtained and thus the SDNNs are calculated (Yang et al., 2024b). The calculation process of SDNN is as follows (as shown in Equation 1).
where N is the total number of R-R intervals,
where
where
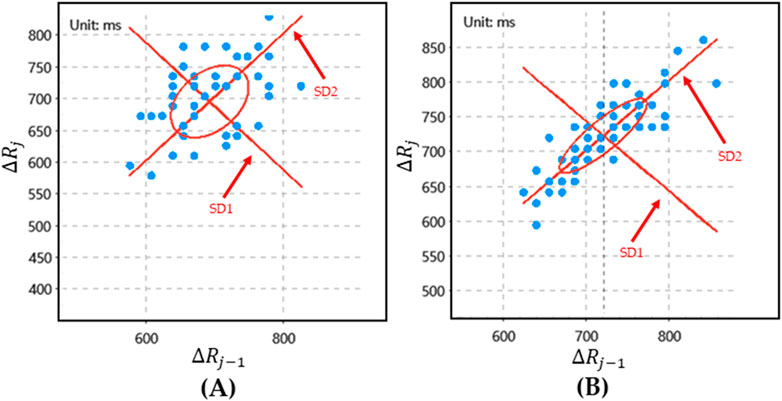
Figure 4. The Poincare plot of HRV. (A) The poincare plot of “like” preferences; (B) The Poincare plot of “disgust” preference.
2.3.2 Frequency domain feature extraction
The frequency domain analysis of physiological signals refers to converting physiological signals into the frequency domain for analysis to understand the frequency components and frequency characteristics in the signals (Chudasama et al., 2022). This study uses Fourier transform and power spectral density analysis methods for frequency domain analysis. For a continuous physiological signal
where
This study focuses on extracting frequency domain features of HRV and RESP signals. For HRV signals, high-frequency (HF) and low-frequency (LF) features are extracted. For RESP signals, the average power frequency is extracted. The discrete versions of Equations 6 and 7 were used.
2.3.3 Feature fusion
Principal Component Analysis (PCA) was employed to reduce the dimensionality of the features. The feature connection to perform feature fusion is utilized. The method of feature connection retains the information of the original features to the greatest extent while combining the characteristics of different physiological signals, providing us with more comprehensive information for subsequent processing and analysis. Specifically, it splices physiological signal features of different types and sources according to feature dimensions to obtain a new feature vector (as shown in Equation 8).
where
2.4 Model development
This study divides the nine levels of preferences into two categories, where those with a preference level greater than 5-point are referred to as the ‘like’ group, and those with a preference level less than or equal to 5-point are referred to as the ‘disgust' group (as shown in Figure 5).
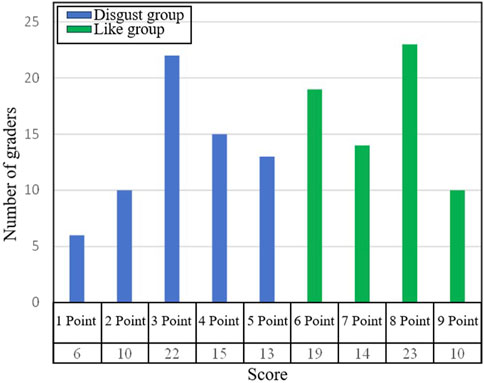
Figure 5. The statistics chart of preference sample. The first row of abscissa is the preference level, and the second row of abscissa is the number of samples under that preference level.
The machine learning models we select include Logistic Regression (LR), Support Vector Machine (SVM), Decision Tree (DT), Random Forest (RF), K-Nearest Neighbor (KNN), and Naive Bayes (NB). This paper uses 6-fold cross-validation and evaluate a wide range of machine learning models and hyperparameters.
2.5 Model evaluation
This study evaluates the performance of the olfactory preference prediction model, and the model with the highest overall score is set as the final model. 70% of the samples were used as the training set for the model, while 30% were used as the test set. Four indicators of the evaluation metrics are considered, including accuracy, precision, recall, and F1-score. The process of calculating these indicators is as follows (as shown in Equations 9–12):
where TP is the number of true positives, TN is the number of true negatives, FP is the number of false positives, and FN is the number of false negatives. The calculation process of the true positive rates TPR%, false negative rates FNR%, true negative rates TNR%, and false positive rates FPR% are calculated as follows (as shown in Equations 13–16):
Furthermore, this study calculates the confusion matrix of the model and the area under the ROC curve (AUC).
3 Results
Using Principal Component Analysis (PCA), the dimensionality of the features was reduced from 15 to 6, resulting in the model achieving optimal accuracy. Under 6-fold cross-validation and hyperparameter tuning, the model did not exhibit significant overfitting. Results of the accuracy, precision, recall, and F1-score of all models are summarized in Table 3. Among them, the decision tree model shows the highest prediction accuracy and achieves the highest scores in precision and F1-score. Although the decision tree model performs worse than the support vector machine model in terms of recall, the gap between them is very small. Therefore, the decision tree model is chosen as the final model after a comprehensive consideration.

Table 3. The prediction results of six models. The accuracy of the training set is the average value from 6-fold cross-validation.
The confusion matrix of all models is shown in Figure 6. The highlighted red part indicates the number of samples that the model incorrectly classifies in the “disgust” class as the “like” class. This is the worst error scenario, meaning that the predicted in-vehicle fragrance preference will increase. Among all models, the Naive Bayes model has the largest proportion of FP, reaching 27.8%. In contrast, the decision tree model has the lowest FP rate, with only one sample being incorrectly predicted out of 20 “disgust” samples. The highlighted green part indicates the number of samples that the model incorrectly classifies in the “like” class as the “disgust” class. Among them, the KNN model accounts for the largest proportion of FN, reaching 29.4%, while the decision tree model still performs the best.
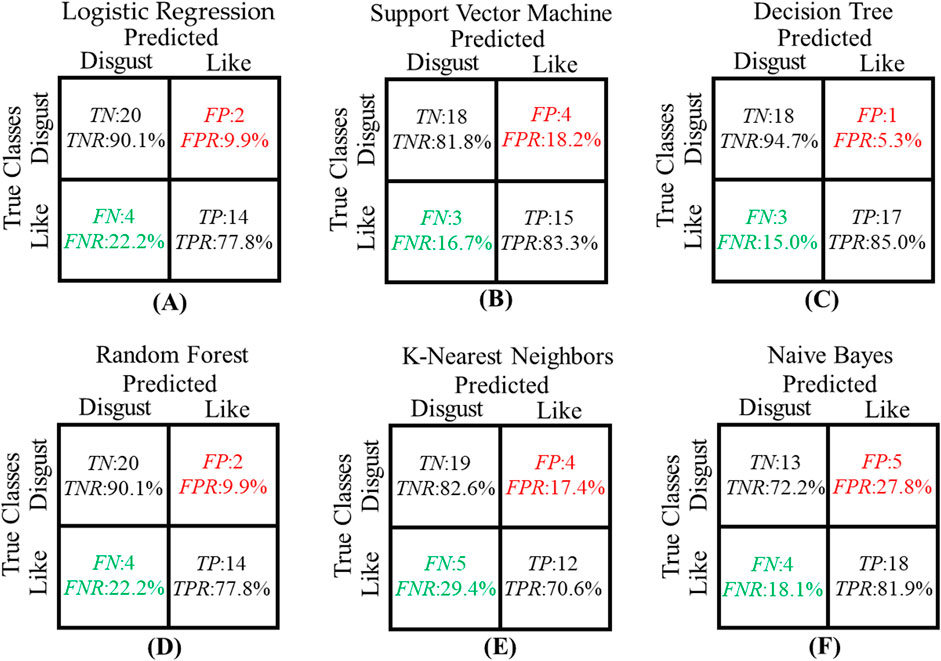
Figure 6. The confusion matrix of six models. (A) The confusion matrix of LR; (B) The confusion matrix of SVM; (C) The confusion matrix of DT; (D) The confusion matrix of RF; (E) The confusion matrix of KNN; (F) The confusion matrix of NB; The red highlighted part is the FP and FPR of the model. The green highlighted part is the FN and FNR of the model.
Figure 7 shows the ROC curve and statistical AUC area of the model. SVM shows the highest AUC value (0.86), while KNN has the lowest AUC value (0.77). However, the observed values show little difference between the several models.
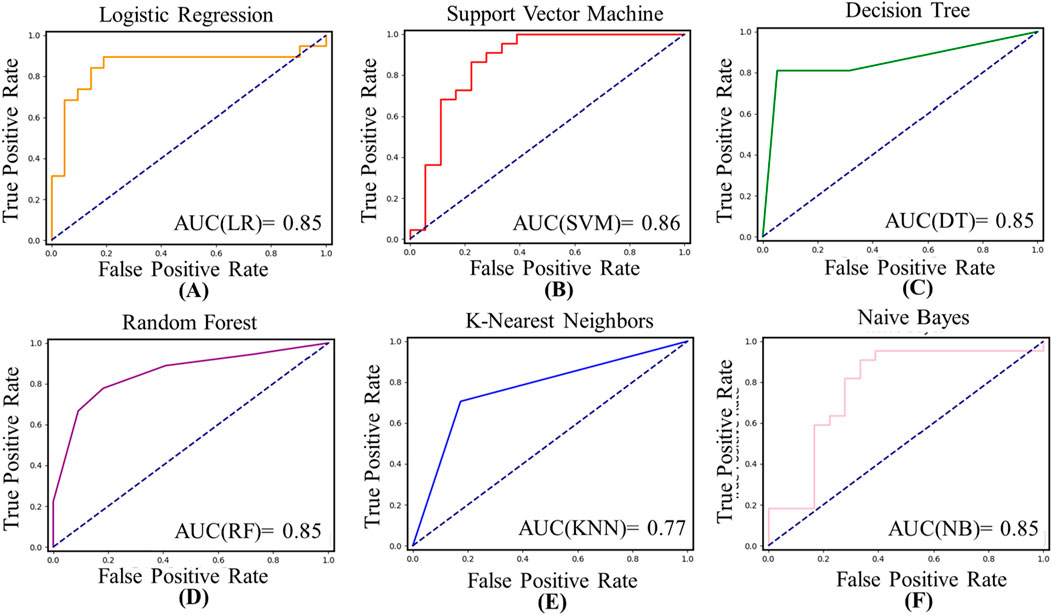
Figure 7. The ROC curves and AUC values of the six models. (A) The ROC curves and AUC values of LR; (B) The ROC curves and AUC values of SVM; (C) The ROC curves and AUC values of DT; (D) The ROC curves and AUC values of RF; (E) The ROC curves and AUC values of KNN; (F) The ROC curves and AUC values of NB.
4 Discussion
In this study, a machine learning model effectively classifying olfactory preferences based on physiological signals of drivers during in-vehicle fragrance experience is developed. Three physiological signals are adopted as inputs for the model, including heart rate variability, electrodermal activity, and respiratory. In addition, six machine learning models are compared. Finally, the decision tree model is selected as the final model. Therefore, the results of this study are summarized as follows.
4.1 Acquisition and processing of physiological signals
It is crucial to consider the physiological state of drivers during driving. In real driving environments, drivers may encounter various situations and pressures, all of which can affect their physiological signals. Through this real driving process, the physiological response of the driver during the experience of in-vehicle fragrance is more closely aligned with the real situation, allowing for more realistic and accurate olfactory preference data to be obtained. Therefore, we set up four experimental stages in the experiment, including the preparation stage, the calm stage, the stimulation stage, and the evaluation stage. Through the driving task in the calm stage, the drivers can maintain a stable state of mind, and their physiological signals show a relatively stable state, with various indicators being controlled within the normal range.
Methods for preference assessment based on physiological signals have been gradually implemented. However, the current lack of standardized evaluation protocols and application guidelines has resulted in assessment outcomes being easily influenced by confounding factors. Ohira and Hirao (2015) selects preferred products by pressing a button, which results in physiological signals being affected. To mitigate the impact of physical movements on physiological signals, a separate stimulation stage was incorporated into our study. Additionally, the implementation of a calm period and baseline processing can effectively mitigate the impact of the placebo effect (Laureanti et al., 2020). However, the duration of the calm period varies across individuals. In this study, the end of the calm period is marked by the participants being fully prepared and the stabilization of their physiological signals, which to some extent reduces the impact of the placebo effect.
In addition, the baseline processing on physiological signal features is performed, which can eliminate the impact of driving. Moreover, the interference of individual physiological differences can be eliminated by calculating the difference between the physiological signal feature values during the stimulation and calm stages. Through the feature difference, the prediction results of the model are more comparable and accurate. Figure 8 shows the accuracy and F1-score of six models with two different feature sets as inputs (the feature sets without and with baseline processing).
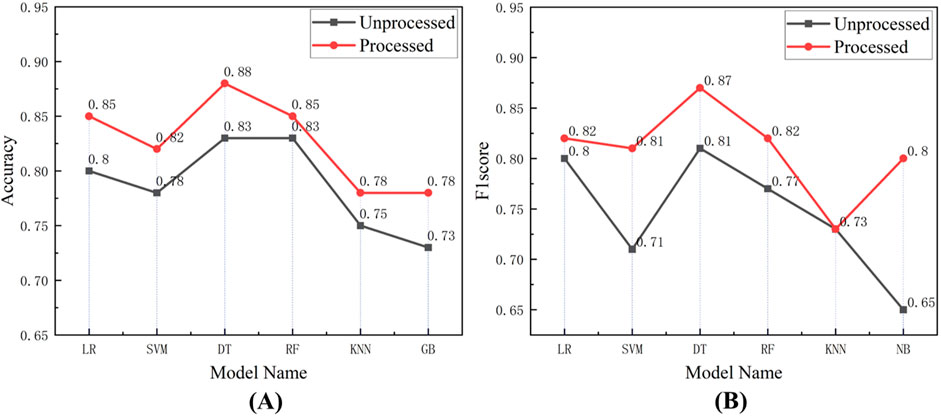
Figure 8. The accuracy and F1-score of six models with two different feature sets as inputs. (A) The comparison of accuracy between feature sets with baseline processing and without baseline processing. (B) The comparison of F1-score between feature sets with baseline processing and without baseline processing.
As expected, the performance of the model on the dataset with baseline processing increases, and the F1-score also increases. The average accuracy and the average F1-score of the models on the feature set after baseline processing respectively increases by 3.50% and 6.33% compared to the feature set without baseline processing.
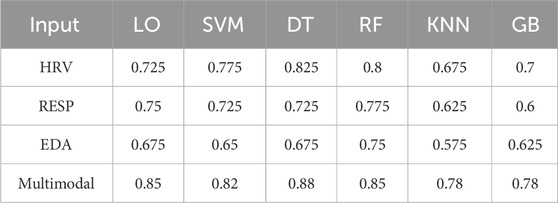
The comparison of accuracy rates between single-signal and multi-signal approaches is presented in Table 4. The single-signal models were trained with the same parameter controls as the multi-signal models. The multimodal approach achieved an average accuracy of 82% across the six models, which represents an improvement of 7.7% compared to the HRV signal, 12.7% compared to the RESP signal, and 16.8% compared to the EDA signal. The comparison results indicate that the multimodal approach outperforms the single-signal approach in terms of prediction accuracy.
4.2 Discussion of prediction results
Artificial intelligence has the potential to significantly enhance the utilization of physiological signals (Autthasan et al., 2023). In this study, a high-accuracy model was developed, enhancing the potential applications of our method. In terms of prediction accuracy, the decision tree model (88%) shows the highest prediction accuracy compared to the other five models (LR: 85%, SVM: 82%, RF: 85%, KNN: 78%, GB: 78%). It is attributed to the following reasons. Firstly, the decision tree models can capture nonlinear relationships between features and can handle features with complex correlations. Therefore, the decision tree models may be more effective than linear models when processing datasets of physiological signals. Secondly, there may be more noise data in the physiological signal dataset due to individual differences and experimental environmental factors. However, decision tree models are insensitive to outliers and can handle imbalanced datasets (Campbell et al., 2022).
Compared to the prediction accuracy, other noteworthy factors are the TP and TPR. For the application scenario of this research, the model with low TPR is closely concerned. The purpose of this study is to help designers design in-vehicle fragrances that meet the olfactory preferences of drivers. The high TPR means that in-vehicle fragrances with low preference are used by drivers, which seriously affects their comfort level. In addition, FN and FNR also have an impact on the practical application of the model. The high FNR is disadvantageous for fragrance designers, reduces the preference level of in-vehicle fragrances, challenging to market such products to consumers and resulting in wastage of resources. Setting a classification threshold can effectively reduce TPR. However, it should be noted that while reducing TPR, FNR will increase accordingly. Therefore, it is necessary to adjust the balance between TP and FN in practical situations to obtain the best classification model.
In addition, an interesting phenomenon is observed. The average TPR of the six models is 14.75%, while the average FNR is 20.60%. Only the TPR of SVM and NB is higher than the FNR. This indicates that the performance of the six models in predicting “disgust” samples is better than that of “like” samples. The reason for the above results may be that emotions dominate the olfactory preferences of drivers without considering external factors (such as the brand and color of the fragrance) (Kim et al., 2020; Liu et al., 2021). In the field of emotion research, negative emotions usually have a more significant impact on physiological signals. Bad emotions are accompanied by more pronounced and sustained physiological changes, which are easier to detect and quantify, while the physiological responses to pleasant emotions are more diverse (Domínguez-Jiménez et al., 2020), which can also affect the accuracy of predictions.
4.3 Limitations and future work
Some limitations of this study should be acknowledged. Firstly, the age range of the drivers and the sample size in this study may limit the generalizability of the model. However, it is important to note that the current study serves as a preliminary investigation into the field. In future research, collecting data from a more diverse range of drivers to enhance the accuracy and robustness of our prediction model is planned. Secondly, a limited set of physiological signals, including heart rate variability is collected, electrodermal signals, and respiratory signals, to evaluate driver olfactory preferences. While these signals yield promising results, it is essential to consider individual differences and environmental factors to enhance the generalization and stability of the model. In future studies, it aims to incorporate additional peripheral physiological signals to further evaluate driver olfactory preferences and explore the predictive power of different signal combinations. Finally, improving the model is a feasible method to improve the accuracy of prediction. In our future work, the better pattern frameworks and model optimization methods will be explored to improve the prediction accuracy.
5 Conclusion
In summary, this study develops a machine learning model that uses the physiological signals (heart rate variability, electrodermal activity, and respiratory signals) of drivers to predict their olfactory preferences. The results of this study have significant practical implications for the design of vehicle comfort, especially for those who are engaged in designing in-vehicle fragrances. Using an olfactory preference prediction model can help manufacturers better understand the needs and preferences of drivers in the early design of in-vehicle fragrances and save more time and costs. In addition, personalized olfactory experiences can be provided for different types of drivers through customized design of in-vehicle fragrances, enhancing the competitiveness and attractiveness of the product. Ultimately, this will widely improve the comfort of drivers during driving.
Data availability statement
The raw data supporting the conclusions of this article will be made available by the authors, without undue reservation.
Ethics statement
The studies involving humans were approved by Ethics Committee of Chongqing University of Arts and Sciences. The studies were conducted in accordance with the local legislation and institutional requirements. The participants provided their written informed consent to participate in this study. Written informed consent was obtained from the individual(s) for the publication of any potentially identifiable images or data included in this article.
Author contributions
BT: Conceptualization, Data curation, Funding acquisition, Methodology, Writing–original draft, Writing–review and editing. MZ: Data curation, Investigation, Methodology, Visualization, Writing–original draft, Writing–review and editing. ZH: Conceptualization, Funding acquisition, Project administration, Supervision, Writing–review and editing. YD: Visualization, Writing–review and editing. SC: Investigation, Writing–review and editing. YL: Investigation, Writing–original draft.
Funding
The author(s) declare that financial support was received for the research, authorship, and/or publication of this article. This research was funded by the following: National Natural Science Foundation of China (52402444), Special Funding for Postdoctoral Research Projects in Chongqing (2023CQBSHTB3133) and the Science, Technology Research Project of Chongqing Municipal Education Commission (KJQN202201345) and Technology Innovation and Application Development Project of Chongqing Yongchuan District Science and Technology Bureau (2024yc-cxfz30079).
Conflict of interest
The authors declare that the research was conducted in the absence of any commercial or financial relationships that could be construed as a potential conflict of interest.
Publisher’s note
All claims expressed in this article are solely those of the authors and do not necessarily represent those of their affiliated organizations, or those of the publisher, the editors and the reviewers. Any product that may be evaluated in this article, or claim that may be made by its manufacturer, is not guaranteed or endorsed by the publisher.
References
Abenna, S., Nahid, M., Bouyghf, H., and Ouacha, B. (2023). An enhanced motor imagery EEG signals prediction system in real-time based on delta rhythm. Biomed. Signal Process. Control 79, 104210. doi:10.1016/j.bspc.2022.104210
Aurup, G. M. M. (2011). User preference extraction from bio-signals: an experimental study. MS dissertation. Montreal, Canada: Concordia University.
Autthasan, P., Sukontaman, P., Wilaiprasitporn, T., and Sangnark, S. (2023). “HeartRhythm: ECG-based music preference classification in popular music,” in 2023 IEEE sensors, Vienna, Austria, October 29–November 1, 2023 (Piscataway, NJ, USA: IEEE), 1–4.
Barnett, S. M., Diako, C., and Ross, C. F. (2019). Identification of a salt blend: application of the electronic tongue, consumer evaluation, and mixture design methodology. J. Food Sci. 84, 327–338. doi:10.1111/1750-3841.14440
Cai, Y., Li, X., and Li, J. (2023). Emotion recognition using different sensors, emotion models, methods and datasets: a comprehensive review. Sensors (Basel) 23, 2455. doi:10.3390/s23052455
Campbell, T. W., Roder, H., Georgantas III, R. W., and Roder, J. (2022). Exact Shapley values for local and model-true explanations of decision tree ensembles. Mach. Learn. Appl. 9, 100345. doi:10.1016/j.mlwa.2022.100345
Chen, J., Li, H., Han, L., Wu, J., Azam, A., and Zhang, Z. (2022). Driver vigilance detection for high-speed rail using fusion of multiple physiological signals and deep learning. Appl. Soft Comput. 123, 108982. doi:10.1016/j.asoc.2022.108982
Chudasama, V., Kar, P., Gudmalwar, A., Shah, N., Wasnik, P., and Onoe, N. (2022). “M2fnet: multi-modal fusion network for emotion recognition in conversation,” in Proceedings of the IEEE/CVF conference on computer vision and pattern recognition, New Orleans, Louisiana, USA, June 19–20, 2022. (Piscataway, NJ, USA: IEEE), 4652–4661.
Debie, E., Rojas, R. F., Fidock, J., Barlow, M., Kasmarik, K., Anavatti, S., et al. (2019). Multimodal fusion for objective assessment of cognitive workload: a review. IEEE Trans. Cybern. 51, 1542–1555. doi:10.1109/TCYB.2019.2939399
Diass, K., Brahmi, F., Mokhtari, O., Abdellaoui, S., and Hammouti, B. (2021). Biological and pharmaceutical properties of essential oils of Rosmarinus officinalis L. and Lavandula officinalis L. Mater. Today Proc. 45, 7768–7773. doi:10.1016/j.matpr.2021.03.495
Domínguez-Jiménez, J. A., Campo-Landines, K. C., Martínez-Santos, J. C., Delahoz, E. J., and Contreras-Ortiz, S. H. (2020). A machine learning model for emotion recognition from physiological signals. Biomed. Signal Process. Control 55, 101646. doi:10.1016/j.bspc.2019.101646
El Hachlafi, N., Benkhaira, N., Al-Mijalli, S. H., Mrabti, H. N., Abdnim, R., Abdallah, E. M., et al. (2023). Phytochemical analysis and evaluation of antimicrobial, antioxidant, and antidiabetic activities of essential oils from Moroccan medicinal plants: Mentha suaveolens, Lavandula stoechas, and Ammi visnaga. Biomed. Pharmacother. 164, 114937. doi:10.1016/j.biopha.2023.114937
English, M. M., Viana, L., and McSweeney, M. B. (2019). Effects of soaking on the functional properties of yellow-eyed bean flour and the acceptability of chocolate brownies. J. Food Sci. 84, 623–628. doi:10.1111/1750-3841.14485
Escobar-Linero, E., Luna-Perejón, F., Muñoz-Saavedra, L., Sevillano, J. L., and Domínguez-Morales, M. (2022). On the feature extraction process in machine learning. An experimental study about guided versus non-guided process in falling detection systems. Eng. Appl. Artif. Intell. 114, 105170. doi:10.1016/j.engappai.2022.105170
Farahani, M., Razavi-Termeh, S. V., Sadeghi-Niaraki, A., and Choi, S.-M. (2023). People’s olfactory perception potential mapping using a machine learning algorithm: a spatio-temporal approach. Sustain. Cities Soc. 93, 104472. doi:10.1016/j.scs.2023.104472
Fjaeldstad, A. W., Nørgaard, H. J., and Fernandes, H. M. (2019). The impact of acoustic fMRI-noise on olfactory sensitivity and perception. Neuroscience 406, 262–267. doi:10.1016/j.neuroscience.2019.03.028
Garcia-Ceja, E., Riegler, M., Nordgreen, T., Jakobsen, P., Oedegaard, K. J., and Tørresen, J. (2018). Mental health monitoring with multimodal sensing and machine learning: a survey. Pervasive Mob. Comput. 51, 1–26. doi:10.1016/j.pmcj.2018.09.003
Gentner, A., Gradinati, G., Favart, C., Gyamfi, K. S., and Brusey, J. (2021). Investigating the effects of two fragrances on cabin comfort in an automotive environment. Work 68, S101–S110. doi:10.3233/wor-208009
Gong, L., Chen, W., Li, M., and Zhang, T. (2024). Emotion recognition from multiple physiological signals using intra-and inter-modality attention fusion network. Digit. Signal Process. 144, 104278. doi:10.1016/j.dsp.2023.104278
Gupta, V., Mittal, M., and Mittal, V. (2020). R-peak detection based chaos analysis of ECG signal. Analog Integr. Circuits Signal Process. 102, 479–490. doi:10.1007/s10470-019-01556-1
Hakyemez, H. A., Veyseller, B., Ozer, F., Ozben, S., Bayraktar, G. I., Gurbuz, D., et al. (2013). Relationship of olfactory function with olfactory bulbus volume, disease duration and Unified Parkinson’s disease rating scale scores in patients with early stage of idiopathic Parkinson’s disease. J. Clin. Neurosci. 20, 1469–1470. doi:10.1016/j.jocn.2012.11.017
Han, P., Su, T., Qin, M., Chen, H., and Hummel, T. (2021). A systematic review of olfactory related questionnaires and scales. Rhinology 59, 133–143. doi:10.4193/Rhin20.291
Islam, S., Ueda, M., Nishida, E., Wang, M.-x., Osawa, M., Lee, D., et al. (2018). Odor preference and olfactory memory are impaired in Olfaxin-deficient mice. Brain Res. 1688, 81–90. doi:10.1016/j.brainres.2018.03.025
Jia, Z., Cai, X., and Jiao, Z. (2022). Multi-modal physiological signals based squeeze-and-excitation network with domain adversarial learning for sleep staging. IEEE Sensors J. 22, 3464–3471. doi:10.1109/jsen.2022.3140383
Jiao, Y., Wang, X., Kang, Y., Zhong, Z., and Chen, W. (2023). A quick identification model for assessing human anxiety and thermal comfort based on physiological signals in a hot and humid working environment. Int. Int. J. Ind. Ergon. 94, 103423. doi:10.1016/j.ergon.2023.103423
Karimi, N., Hasanvand, S., Beiranvand, A., Gholami, M., and Birjandi, M. (2024). The effect of Aromatherapy with Pelargonium graveolens (P. graveolens) on the fatigue and sleep quality of critical care nurses during the COVID-19 pandemic: a randomized controlled trial. Explore 20, 82–88. doi:10.1016/j.explore.2023.06.006
Khare, S. K., Blanes-Vidal, V., Nadimi, E. S., and Acharya, U. R. (2023). Emotion recognition and artificial intelligence: a systematic review (2014–2023) and research recommendations. Inf. Fusion 102, 102019. doi:10.1016/j.inffus.2023.102019
Kim, D., Hyun, H., and Park, J. (2020). The effect of interior color on customers’ aesthetic perception, emotion, and behavior in the luxury service. J. Retail. Consum. Serv. 57, 102252. doi:10.1016/j.jretconser.2020.102252
Klyuchnikova, M. A., Kvasha, I. G., Laktionova, T. K., and Voznessenskaya, V. V. (2022). Olfactory perception of 5α-androst-16-en-3-one: data obtained in the residents of central Russia. Data Brief 45, 108704. doi:10.1016/j.dib.2022.108704
Kose, M. R., Ahirwal, M. K., and Kumar, A. (2021). A new approach for emotions recognition through EOG and EMG signals. Signal Image Video Process. 15, 1863–1871. doi:10.1007/s11760-021-01942-1
Laureanti, R., Barbieri, R., Cerina, L., and Mainardi, L. (2022). Analysis of physiological and non-contact signals to evaluate the emotional component in consumer preferences. PLos One 17, e0267429. doi:10.1371/journal.pone.0267429
Laureanti, R., Barbieri, R., Cerina, L., and Mainardi, L. T. (2020). “Analysis of physiological and non-contact signals for the assessment of emotional components in consumer preference,” in 2020 11th conference of the European study group on cardiovascular oscillations (ESGCO), Pisa, Italy, July 15, 2020 (Piscataway, NJ, USA: IEEE), 1–2.
Lesur, M. R., Stussi, Y., Bertrand, P., Delplanque, S., and Lenggenhager, B. (2023). Different armpits under my new nose: olfactory sex but not gender affects implicit measures of embodiment. Biol. Psychol. 176, 108477. doi:10.1016/j.biopsycho.2022.108477
Li, Q., Liu, Y., Yan, F., Zhang, Q., and Liu, C. (2023). Emotion recognition based on multiple physiological signals. Biomed. Signal Process. Control 85, 104989. doi:10.1016/j.bspc.2023.104989
Liu, B., Lian, Z., and Brown, R. D. (2019). Effect of landscape microclimates on thermal comfort and physiological wellbeing. Sustainability 11, 5387. doi:10.3390/su11195387
Liu, H., Jayawardhena, C., Osburg, V.-S., Yoganathan, V., and Cartwright, S. (2021). Social sharing of consumption emotion in electronic word of mouth (eWOM): a cross-media perspective. J. Bus. Res. 132, 208–220. doi:10.1016/j.jbusres.2021.04.030
Maithri, M., Raghavendra, U., Gudigar, A., Samanth, J., Barua, P. D., Murugappan, M., et al. (2022). Automated emotion recognition: current trends and future perspectives. Comput. Methods Programs Biomed. 215, 106646. doi:10.1016/j.cmpb.2022.106646
Martínez-Pascual, D., Catalán, J. M., Blanco-Ivorra, A., Sanchís, M., Arán-Ais, F., and García-Aracil, N. (2023). Estimating vertical ground reaction forces during gait from lower limb kinematics and vertical acceleration using wearable inertial sensors. Front. Bioeng. Biotechnol. 11, 1199459. doi:10.3389/fbioe.2023.1199459
Martis, R. J., Acharya, U. R., and Adeli, H. (2014). Current methods in electrocardiogram characterization. Comput. Biol. Med. 48, 133–149. doi:10.1016/j.compbiomed.2014.02.012
Mustafa, M., Rustam, N., and Siran, R. (2016). The impact of vehicle fragrance on driving performance: what do we know? Procedia-Social Behav. Sci. 222, 807–815. doi:10.1016/j.sbspro.2016.05.173
Nakahara, T. S., Carvalho, V. M., and Papes, F. (2020). From synapse to supper: a food preference recipe with olfactory synaptic ingredients. Neuron 107, 8–11. doi:10.1016/j.neuron.2020.06.016
Naudon, L., François, A., Mariadassou, M., Monnoye, M., Philippe, C., Bruneau, A., et al. (2020). First step of odorant detection in the olfactory epithelium and olfactory preferences differ according to the microbiota profile in mice. Behav. Brain Res. 384, 112549. doi:10.1016/j.bbr.2020.112549
Ohira, H., and Hirao, N. (2015). Analysis of skin conductance response during evaluation of preferences for cosmetic products. Front. Psychol. 6, 103. doi:10.3389/fpsyg.2015.00103
Parreira, J. D., Chalumuri, Y. R., Mousavi, A. S., Modak, M., Zhou, Y., Sanchez-Perez, J. A., et al. (2023). A proof-of-concept investigation of multi-modal physiological signal responses to acute mental stress. Biomed. Signal Process. Control 85, 105001. doi:10.1016/j.bspc.2023.105001
Qu, F., and Xie, Q. (2023). “Effects of aircraft noise on psychophysiological feedback in under-route open spaces,” in INTER-NOISE and NOISE-CON congress and conference proceedings, Jinzhou, China, August 18–20, 2023 (Piscataway, NJ, USA: Institute of Noise Control Engineering), 5089–5094.
Ryan, B. C., Young, N. B., Moy, S. S., and Crawley, J. N. (2008). Olfactory cues are sufficient to elicit social approach behaviors but not social transmission of food preference in C57BL/6J mice. Behav. Brain Res. 193, 235–242. doi:10.1016/j.bbr.2008.06.002
Saha, P., Kunju, A. K. A., Majid, M. E., Kashem, S. B. A., Nashbat, M., Ashraf, A., et al. (2024). Novel multimodal emotion detection method using Electroencephalogram and Electrocardiogram signals. Biomed. Signal Process. Control 92, 106002. doi:10.1016/j.bspc.2024.106002
Schacht, A., Nigbur, R., and Sommer, W. (2009). Emotions in go/nogo conflicts. Psychol. Res. PRPF 73, 843–856. doi:10.1007/s00426-008-0192-0
Seok, J., Shim, Y. J., Rhee, C.-S., and Kim, J.-W. (2017). Correlation between olfactory severity ratings based on olfactory function test scores and self-reported severity rating of olfactory loss. Acta Otolaryngol. 137, 750–754. doi:10.1080/00016489.2016.1277782
Shehu, H. A., Oxner, M., Browne, W. N., and Eisenbarth, H. (2023). Prediction of moment-by-moment heart rate and skin conductance changes in the context of varying emotional arousal. Psychophysiology 60, e14303. doi:10.1111/psyp.14303
Shin, W., Koenig, K. A., and Lowe, M. J. (2022). A comprehensive investigation of physiologic noise modeling in resting state fMRI; time shifted cardiac noise in EPI and its removal without external physiologic signal measures. NeuroImage 254, 119136. doi:10.1016/j.neuroimage.2022.119136
Singh, K., Ahirwal, M. K., and Pandey, M. (2023). Quaternary classification of emotions based on electroencephalogram signals using hybrid deep learning model. J. Ambient Intell. Humaniz. Comput. 14, 2429–2441. doi:10.1007/s12652-022-04495-4
Sorokowska, A., Chabin, D., Hummel, T., and Karwowski, M. (2022). Olfactory perception relates to food neophobia in adolescence. Nutrition 98, 111618. doi:10.1016/j.nut.2022.111618
Tang, B., Cai, W., Deng, L., Zhu, M., Chen, B., Lei, Q., et al. (2022). “Research on the effect of olfactory stimulus parameters on awakening effect of driving fatigue,” in 2022 6th CAA international conference on vehicular control and intelligence (CVCI). IEEE, 1–6.
Tang, B.-b., Wei, X., Guo, G., Yu, F., Ji, M., Lang, H., et al. (2019). The effect of odor exposure time on olfactory cognitive processing: an ERP study. J. Integr. Neurosci. 18, 87–93. doi:10.31083/j.jin.2019.01.103
Williams, N. S., King, W., Mackellar, G., Randeniya, R., McCormick, A., and Badcock, N. A. (2023). Crowdsourced EEG Experiments: a proof of concept for remote EEG acquisition using EmotivPRO Builder and EmotivLABS. Heliyon 9, e18433. doi:10.1016/j.heliyon.2023.e18433
Xia, Y., Song, J., Zhong, F., Halim, J., and O’Mahony, M. (2020). The 9-point hedonic scale: using R-index preference measurement to compute effect size and eliminate artifactual ties. Food Res. Int. 133, 109140. doi:10.1016/j.foodres.2020.109140
Yang, W., Chen, T., He, R., Goossens, R., and Huysmans, T. (2024a). Autonomic responses to pressure sensitivity of head, face and neck: heart rate and skin conductance. Appl. Ergon. 114, 104126. doi:10.1016/j.apergo.2023.104126
Yang, X., Yan, H., Zhang, A., Xu, P., Pan, S. H., Vai, M. I., et al. (2024b). Emotion recognition based on multimodal physiological signals using spiking feed-forward neural networks. Biomed. Signal Process. Control 91, 105921. doi:10.1016/j.bspc.2023.105921
Keywords: driving comfort, in-vehicle fragrance, olfactory preference, physiological signal, machine learning
Citation: Tang B, Zhu M, Hu Z, Ding Y, Chen S and Li Y (2024) Evaluation method of Driver’s olfactory preferences: a machine learning model based on multimodal physiological signals. Front. Bioeng. Biotechnol. 12:1433861. doi: 10.3389/fbioe.2024.1433861
Received: 16 May 2024; Accepted: 02 December 2024;
Published: 18 December 2024.
Edited by:
Yu-Feng Yu, Guangzhou University, ChinaReviewed by:
Hao Zhuang, University of California, Berkeley, United StatesHatice Kose, Istanbul Technical University, Türkiye
José Antonio De La O Serna, Autonomous University of Nuevo León, Mexico
Copyright © 2024 Tang, Zhu, Hu, Ding, Chen and Li. This is an open-access article distributed under the terms of the Creative Commons Attribution License (CC BY). The use, distribution or reproduction in other forums is permitted, provided the original author(s) and the copyright owner(s) are credited and that the original publication in this journal is cited, in accordance with accepted academic practice. No use, distribution or reproduction is permitted which does not comply with these terms.
*Correspondence: Zhian Hu, emhpYW5odUBhbGl5dW4uY29t
 Bangbei Tang1,2
 Mingxin Zhu
 Zhian Hu