
94% of researchers rate our articles as excellent or good
Learn more about the work of our research integrity team to safeguard the quality of each article we publish.
Find out more
ORIGINAL RESEARCH article
Front. Bioeng. Biotechnol., 18 January 2024
Sec. Industrial Biotechnology
Volume 11 - 2023 | https://doi.org/10.3389/fbioe.2023.1332185
This article is part of the Research TopicUnlocking Biomass-to-Bioenergy Potential in the Biorefining Framework: Emerging Trends and OpportunitiesView all articles
 Kritsadaporn Porninta1,2Julaluk Khemacheewakul2,3Charin Techapun2,3
 Yuthana Phimolsiripol2,3
 Kittisak Jantanasakulwong2,3Sumeth Sommanee2,3Chatchadaporn Mahakuntha2,3
 Juan Feng2,3
 Su Lwin Htike2,3Churairat Moukamnerd3
 Xinshu Zhuang4
 Wen Wang4
 Wei Qi4
 Fu-Li Li5
 Tianzhong Liu5Anbarasu Kumar2,6Rojarej Nunta2,7*
 Noppol Leksawasdi2,3*
Cellulosic bioethanol production generally has a higher operating cost due to relatively expensive pretreatment strategies and low efficiency of enzymatic hydrolysis. The production of other high-value chemicals such as xylitol and phenylacetylcarbinol (PAC) is, thus, necessary to offset the cost and promote economic viability. The optimal conditions of diluted sulfuric acid pretreatment under boiling water at 95°C and subsequent enzymatic hydrolysis steps for sugarcane bagasse (SCB), rice straw (RS), and corn cob (CC) were optimized using the response surface methodology via a central composite design to simplify the process on the large-scale production. The optimal pretreatment conditions (diluted sulfuric acid concentration (% w/v), treatment time (min)) for SCB (3.36, 113), RS (3.77, 109), and CC (3.89, 112) and the optimal enzymatic hydrolysis conditions (pretreated solid concentration (% w/v), hydrolysis time (h)) for SCB (12.1, 93), RS (10.9, 61), and CC (12.0, 90) were achieved. CC xylose-rich and CC glucose-rich hydrolysates obtained from the respective optimal condition of pretreatment and enzymatic hydrolysis steps were used for xylitol and ethanol production. The statistically significant highest (p ≤ 0.05) xylitol and ethanol yields were 65% ± 1% and 86% ± 2% using Candida magnoliae TISTR 5664. C. magnoliae could statistically significantly degrade (p ≤ 0.05) the inhibitors previously formed during the pretreatment step, including up to 97% w/w hydroxymethylfurfural, 76% w/w furfural, and completely degraded acetic acid during the xylitol production. This study was the first report using the mixed whole cells harvested from xylitol and ethanol production as a biocatalyst in PAC biotransformation under a two-phase emulsion system (vegetable oil/1 M phosphate (Pi) buffer). PAC concentration could be improved by 2-fold compared to a single-phase emulsion system using only 1 M Pi buffer.

An abundant quantity of agricultural waste biomass is being produced and used globally. The three crucial agricultural biomass in terms of availability are corn cob (CC), rice straw (RS), and sugarcane bagasse (SCB) with an overall worldwide production of 1.05 and 1.07 billion tons in 2019 and 2022, respectively. These could be compared with 50.9 million tons (4.85% of worldwide) and 30.6 million tons (2.87% of worldwide) in Thailand as of 2019 and 2022, respectively (OAE, 2023; Ritchie et al., 2023; USDA, 2023). These materials are commonly utilized for organic fertilizer, soil enrichment, and animal feed. Alternative usages of these wastes are also possible in biorefineries for renewable biochemical and bioenergy production (Galbe and Wallberg, 2019; Wang et al., 2022).
Lignocellulosic biomass is composed of carbohydrate polymers such as cellulose (38%–50%), hemicellulose (23%–32%), lignin (10%–25%), and a small amount of pectin, proteins, and extractives (chlorophyll, waxes, and non-structural sugars) (Bhatia et al., 2020; Bukhari et al., 2022). Cellulose is a homopolymer of glucose (6-carbon sugar or hexose sugar) monomers which are joined by β-1,4 linkages. Hemicellulose is a heteropolymer of 5-carbon sugar or pentose sugar (β-d-xylose, α-l-arabinose) and hexose sugar (β-d-mannose, β-d-glucose, α-d-galactose, and/or uronic acids) monomers by β-1,4 and β-1,3 linkages. Examples of relevant hemicellulose include xylan and glucomannan, with xylan being the most abundant (Kumar et al., 2020). Lignin is an amorphous irregular polymer with a complex three-dimensional network structure. Phenylpropanoid monomers comprised of phenylpropane units are generally found in this type of polymer. The three basic phenylpropane monomers of lignin structure are coniferyl alcohol (G type), sinapyl alcohol (S type), and p-coumaryl alcohol (H type) (Wang et al., 2023). Lignin severely limits the efficiency of enzymatic hydrolysis (Vermaas et al., 2015).
Pretreatment and enzymatic hydrolysis steps are two primary unit operations for several high-value biochemical production processes including bioethanol (Du et al., 2020), xylitol (Kim, 2019; Du et al., 2020), aldehydes, cellulose acetate, phenols, acids, and saccharides (Chen et al., 2017) from lignocellulosic materials. Diluted acid pretreatment appears to be a more favorable method for industrial applications as acid recovery step is not required (Refaat, 2012). The most common acid being used is sulfuric acid (H2SO4) which serves as catalyzer and dehydrating agent. Evidently, a higher monosaccharide conversion yield was also obtained when compared to another acids such as hydrochloric, phosphoric, and nitric acid (Chen et al., 2017; Khattab and Watanabe, 2019). It is generally utilized by bioethanol industrial plants in the United States (Nguyen et al., 2003), Brazil (Laranjeira et al., 2013), Russia (Lomovsky et al., 2009), and China (Rongjie et al., 2006). Under acidic conditions, the hemicellulose mass fraction could be hydrolyzed into monosaccharides rapidly with less than 10% w/w of remaining non-hydrolyzed solid. In fact, the cellulose and lignin fractions are relatively more stable and less susceptible to similar acidic conditions, possibly due to the absence of pentosan and xylan. The crystalline and amorphous without branched structures of cellulose may offer some resistance to diluted acid conditions (Chen, 2015; Galbe and Wallberg, 2019) while phenylpropanoid monomers in lignin can help facilitate protection against chemical and biological attacks (Lu et al., 2017). The accessibility of cellulose and hemicellulose to enzymatic hydrolysis can be enhanced through pretreatment processes with a relatively high yield of monosaccharides conversion (Kobkam et al., 2018). Under the 4%–8% w/v diluted sulfuric acid pretreatment step, a number of various inhibitors were formed in hydrolysate with relatively large quantities such as furfural, 5-hydroxymethylfurfural (HMF), and acetic acid at high temperature (Wang et al., 2019a). Furfural and HMF are the end products through the dehydration process of xylose or glucose, respectively, while acetic acid is formed primarily after the deacetylation step of xylan side chains (Davies et al., 2011). These inhibitors could slow down the microbial growth and, thus, decrease the overall fermentation performance (Wang et al., 2016). A detoxification strategy could be applied to mitigate the toxicity of these compounds using activated charcoal, ion-exchange resins, and over-liming with the side effect of sugars losses (Kaur et al., 2023). There existed several reports that implemented the intrinsic tolerance yeast strain such as Candida tropicalis with the capability of degrading inhibitors being formed in the pretreatment step (Cheng et al., 2014; Wang et al., 2016). The enzymatic hydrolysis step employs two principal enzymes, namely, cellulase and hemicellulase, which are commonly produced by various microorganisms. Cellulases hydrolyze β-1,4 linkages in cellulose chains, releasing oligosaccharides, cellobioses, and glucose molecules as the final product. This enzyme generally comprises three main units, namely, endoglucanase (EC 3.2.1.4), exoglucanase (EC 3.2.1.91), and β-glucosidase or cellobiase (EC 3.2.1.21). Xylanase is another primary hemicellulase capable of degrading the linear polysaccharide xylan into xylose by catalyzing the hydrolysis of the glycosidic linkage (β-1,4) of xylosides. The xylanase enzyme group comprises the xylanolytic enzyme system including endoxylanase (EC 3.2.1.8), β-xylosidase (EC 3.2.1.37), α-glucuronidase (EC 3.2.1.139), α-arabinofuranosidase (EC 3.2.1.55), and acetylxylan esterase (EC 3.1.1.72) (Liu and Kokare, 2017).
The hemicellulosic (xylose-rich) and cellulosic (glucose-rich) hydrolysates obtained from respective acid pretreatment and enzymatic hydrolysis steps could be utilized as carbon sources for xylitol and bioethanol production. Xylitol is a low-calorie sweetener, which is formed by the reduction of xylose through the activity of xylose reductase with either NADH + H+ or NADPH + H+ as co-factors. An NAD+-dependent xylitol dehydrogenase could then catalyze the subsequent conversion of xylitol into xylulose. After a further phosphorylation step, xylulose can enter the pentose phosphate pathway to produce ethanol (Mareczky et al., 2016; Baptista et al., 2018). Bioethanol is produced from acetaldehyde via the decarboxylation process of pyruvate from glucose with a subsequent reduction step together with NADH + H+ as a co-substrate under anaerobic conditions. This can be compared with the aerobic condition in which pyruvate is completely oxidized to CO2 through the Krebs cycle. Additional ATPs were obtained through oxidative phosphorylation in the mitochondria of several microorganisms (Pfeiffer and Morley, 2014). Candida spp. are well known for their ability to consume xylose for a relatively efficient production of xylitol and ethanol. C. tropicalis generally provides high production yields with resistance to non-detoxified hydrolysates as carbon sources (Cheng et al., 2014; Wang et al., 2016). C. magnoliae, an osmotolerant strain (Wannawilai and Sirisansaneeyakul, 2015), could be another interesting xylitol- and ethanol-producing yeast strain, as the statistically significantly similar (p > 0.05) xylitol and ethanol yields compared to the C. tropicalis strain were observed in our group.
The problem of relatively high cost of cellulosic bioethanol (USD 1.93–4.07/L) (Moonsamy et al., 2022) production stemmed from relatively expensive pretreatment and low-efficiency enzymatic hydrolysis steps is generally encountered. Although the ethanol production from the first-generation counterpart (molasses, sugarcane juice, and cassava hydrolysate) (USD 0.68–0.91/L) (Moonsamy et al., 2022) could be much cheaper, the disruption of food security in the supply chain is inevitable. The co-production of cellulosic bioethanol, xylitol (USD 8.66/kg) (IndiaMart, 2023b), and phenylacetylcarbinol (PAC) (USD 120/kg) (IndiaMart, 2023a)—a precursor of anti-asthmatic and nasal decongestant compounds, produced from pyruvate decarboxylase (PDC) (EC 4.1.1.1), a biocatalyst found in several ethanol-producing microorganisms (Leksawasdi et al., 2003; Leksawasdi et al., 2005)—was extensively studied to ensure economic viability and preserve PDC stability in a high-concentration phosphate (Pi) buffer (Khemacheewakul et al., 2018). Even though, there were studies which described high production of xylitol (>200 g/L) and/or ethanol (>100 g/L) such as the study by Meyrial et al. (1991) (221 g/L xylitol from C. guilliermondii), Ikeuchi et al. (1999) (256 g/L xylitol from Candida sp. 559-9), Cheng et al. (2010) (218.7 g/L xylitol from C. tropicalis in fed-batch fermentation), and Chang et al. (2018) (115 g/L ethanol from S. cerevisiae). These only reported the sole production of either xylitol or ethanol and were quite dissimilar from the current study, of which one yeast strain could be utilized for the subsequent production of three valuable compounds utilizing agricultural and agro-industrial wastes. Thus, the integrated high-value chemical production processes such as xylitol and PAC to the second-generation bioethanol production from the agricultural and agro-industrial wastes could have potential in offsetting the relatively high operating cost by fully utilizing the efficient yeast strain capable of producing these chemicals. In fact, yeast whole cells are usually considered a readily available by-product of the bioethanol production process at no cost that have not been utilized fully on the PAC production capability.
Therefore, this study aims to optimize and validate the diluted [sulfuric acid] pretreatment in boiling water and enzymatic hydrolysis steps for pulverized powder of SCB, RS, and CC based on the response surface methodology (RSM) in the xylose-rich and glucose-rich hydrolysate production for the selected lignocellulosic material. The xylitol and ethanol production by C. magnoliae TISTR 5664 were then compared in the absence of a detoxification step. The concentrations of important inhibitors were also monitored throughout the pretreatment and cultivation stages. Furthermore, the collected frozen–thawed whole cells from both xylitol and ethanol production steps were also subjected to PAC biotransformation in a two-phase emulsion system. The non-equivalent vegetable oil:1 M [Pi] buffer volume ratio of 0.43:1 was implemented. The novelty in co-produced processes of these chemicals in which the frozen–thawed whole cells from xylitol production was elucidated and applied for the first time in PAC biotransformation with significant improvement based on the two-phase emulsion system.
Lignocellulosic biomass, namely, SCB from Kaset Thai International Sugar Corporation and RS and CC from Chiang Mai Provincial Livestock Office, was used as substrates in this study. SCB was preliminarily prepared based on a method described by Nunta et al. (2023). RS was chopped into small pieces (about 2–5 cm). CC was ground in the first stage using a hammer mill machine (Champ AMCI Product, Thailand) with an 8 mm screen size. All materials were then subsequently attrited by using the hammer mill equipped with a 2 mm screen size (Ramaiah et al., 2020) before drying in a hot-air oven (LDO-100E, Lab tech, Korea) at 60°C for 24 h (Manorach et al., 2015). The pulverized powders of each lignocellulosic material were stored in sealed 50.8 × 76.2 cm2 polypropylene bags and kept in a dry place at room temperature until use. The proximate compositions of these powders (Table 1) were analyzed by Central Laboratory (Thailand) Co., Ltd., as elucidated in Analytical methods.
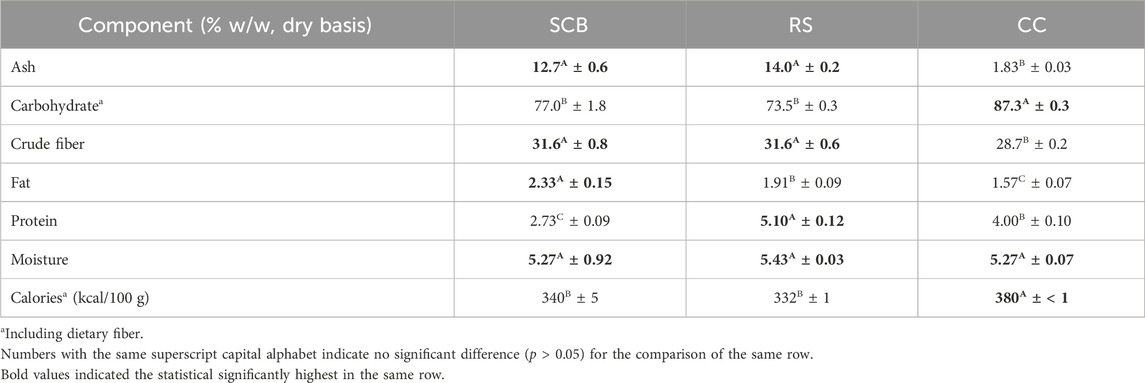
TABLE 1. Proximate analysis components of SCB, RS, and CC.
The commercial enzyme mixtures (Qingdao Vland Biotech Group Co., Ltd., Qingdao, China) were used to optimize the enzymatic hydrolysis of pretreated lignocellulosic biomass as described previously (Wattanapanom et al., 2019). The enzyme activity as the filter paper unit (FPU) and its specific activity were 103 ± 0.3 FPU/mL (Nunta et al., 2023) and 2.24 ± 0.06 FPU/mg protein, respectively. Additionally, the cellobiase activity unit (CBU) was also determined to be 2.568 ± 12 CBU/mL, with a specific activity of 55.7 ± 0.3 CBU/mg protein. All chemicals used in this study were analytical grade, excluding calcium hydroxide for pH adjustment of hydrolysates, which was commercial grade.
The microbial strain, C. magnoliae TISTR 5664 procured from the Thailand Institute of Scientific and Technological Research (TISTR), was propagated and stored at −20°C in the presence of 40% v/v glycerol stock (modified from the work of Nunta et al. (2019)).
The mixture of pulverized powder of lignocellulosic materials in the optimized concentration of diluted sulfuric acid was prepared. The diluted sulfuric acid (liquid)-to-powder (solid) ratio (LSR) was 10: 1 (v/w) (da Silva et al., 2015). The mixtures were then boiled at 95°C ± 1°C (Skiba et al., 2017) for an optimized time period suitable to the production scale. The liquid and solid portions of these hydrolysates were separated by the filtration technique using a two-layer muslin cloth (adapted from the work of Nunta et al. (2019)). The liquid portion could be used for xylitol production, while the solid was washed with running tap water until the pH level reached 4–5 (Lee et al., 2015) and then dried at 60°C to attain a constant weight (Manorach et al., 2015). The obtained solid was subsequently used in the further enzymatic hydrolysis step with an enzyme loading of 45 FPU/g dried solid (Dávila et al., 2016) in 50 mM Na-citrate buffer at pH 4.8 under 50°C under good mixing conditions (Manorach et al., 2015; Koti et al., 2016; Li J. et al., 2019). After the enzymatic hydrolysis step, the enzymatic denaturation was achieved by subjecting the mixture to a boiling condition of 95°C ± 1°C. After boiling, the mixture was cooled down to 10°C and the residual solid was removed with the appropriate separation technique (modified from the work of Qi et al. (2009)).
A yeast-malt medium supplemented with 5 g/L xylose (YMX) (Stoklosa et al., 2019) was used as a pre-seed and seed cultivation medium for microbial propagation. The glycerol stock of C. magnoliae TISTR 5664 was cultivated in the YMX medium at 30°C and 200 rpm for 24 h (Nunta et al., 2018) before using it as seed inoculum. The initial cell concentration was 1.58–1.67 × 10⁸ CFU/mL with cell viability above 99%. Xylose-rich and glucose-rich hydrolysates for xylitol and ethanol production were prepared based on optimal conditions for the pretreatment and enzymatic hydrolysis of the best lignocellulosic material. Xylose-rich hydrolysate was the liquid portion obtained after the pretreatment step using 1.5 L diluted sulfuric acid in 2 L laboratory glass bottles under boiling conditions in an autoclave (LAC-5100SD, Lab tech, Korea). Glucose-rich hydrolysate was the remnant liquid portion obtained after the enzymatic hydrolysis step. The preparation was conducted with a working volume of 25 L in a 50 L temperature-controlled mixing tank (MT001, FENIX International, Thailand) with a three-bladed propeller. The boiling time was 15 min, while centrifugation at 3,580 × g for 15 min was used as a separation technique. A further concentration step by vacuum evaporation using a rotary evaporator (R-1010, Greatwall, China) at 70°C (Unrean and Ketsub, 2018) was then applied for both hydrolysates to achieve the optimal xylose (50 g/L) and glucose (100 g/L) concentration for xylitol and ethanol production based on the previous literature (King and Hossain, 1982; Sirisansaneeyakul et al., 1995; Nurhayati et al., 2014; Chavan et al., 2015; Tangri and Singh, 2017; Saha and Kennedy, 2020). An antifoaming agent mixture of olive oil (0.1% v/v) and polysorbate (Tween 20) (0.01% v/v) was added to both hydrolysates before the evaporation step based on the final concentrated hydrolysate volume (adapted from the work of Ishwaryaa and Nisha (2021)). All hydrolysates were supplemented with ammonium sulfate at 8.52 g/L as a defined nitrogen source (Nunta et al., 2018) with pH adjustment to 6.0 using calcium hydroxide powder (Unrean and Ketsub, 2018). After pH adjustment, the centrifugation process was then followed at a similar condition once more to remove the calcium sulfate precipitate being formed during the pH adjustment step. The supernatants from both hydrolysates were subsequently kept at −20°C in 1.5 L polyethylene terephthalate bottles until use. All cultivation media were sterilized at 110°C for 20 min in the autoclave before cultivation (Kumar et al., 2018).
A central composite design (CCD) with two variables, three levels, and five replicates at the center point was used for fitting a second-order response surface in the optimization of pretreatment and enzymatic hydrolysis. The variable ranges from the center point of the design space to a factorial point are ±1 unit for each variable. The axial points are at a distance of ± α from the center point (α = ± 1). Eq. 1 represents the quadratic model for predicting the responses.
where Y is the predicted response; β0 is a constant; βi is the linear coefficient; βii is the squared coefficient; βij is the interaction coefficient; Xi is variable i; and Xj is variable j.
To correlate the response variable to the independent factors, the former was projected to experimental data using a predictive polynomial quadratic equation (Eq. 1). Design-Expert 6.0.2 (Stat-Ease, United States) was the statistical software employed for the regression procedure, graphical analyses, and computation of Fisher (F) test, analysis of variance (ANOVA), correlation coefficient (R2), adjusted (Adj) R2, and coefficient of variation (CV) values (Chaiyaso et al., 2011).
The CCD with two variables of diluted sulfuric acid concentration and reaction time was used for this pretreatment optimization. The variable ranges were adapted from the work of Ren et al. (2015) and were assigned as (0.5, 2.75, and 5.0% w/v) and (30, 135, and 240 min), respectively. Table 2 shows both variables and the corresponding three levels with five replications of these variables being investigated. The experiments were carried out using the condition described in Preparation of solid and liquid portions in pretreatment and enzymatic hydrolysis steps with 100 mL diluted sulfuric acid in 250 mL non-baffled Erlenmeyer flasks. The dried pretreated solids of SCB, RS, and CC were measured for mass basis compositions of cellulose and lignin in solid residue (% w/w) responses after pretreatment.
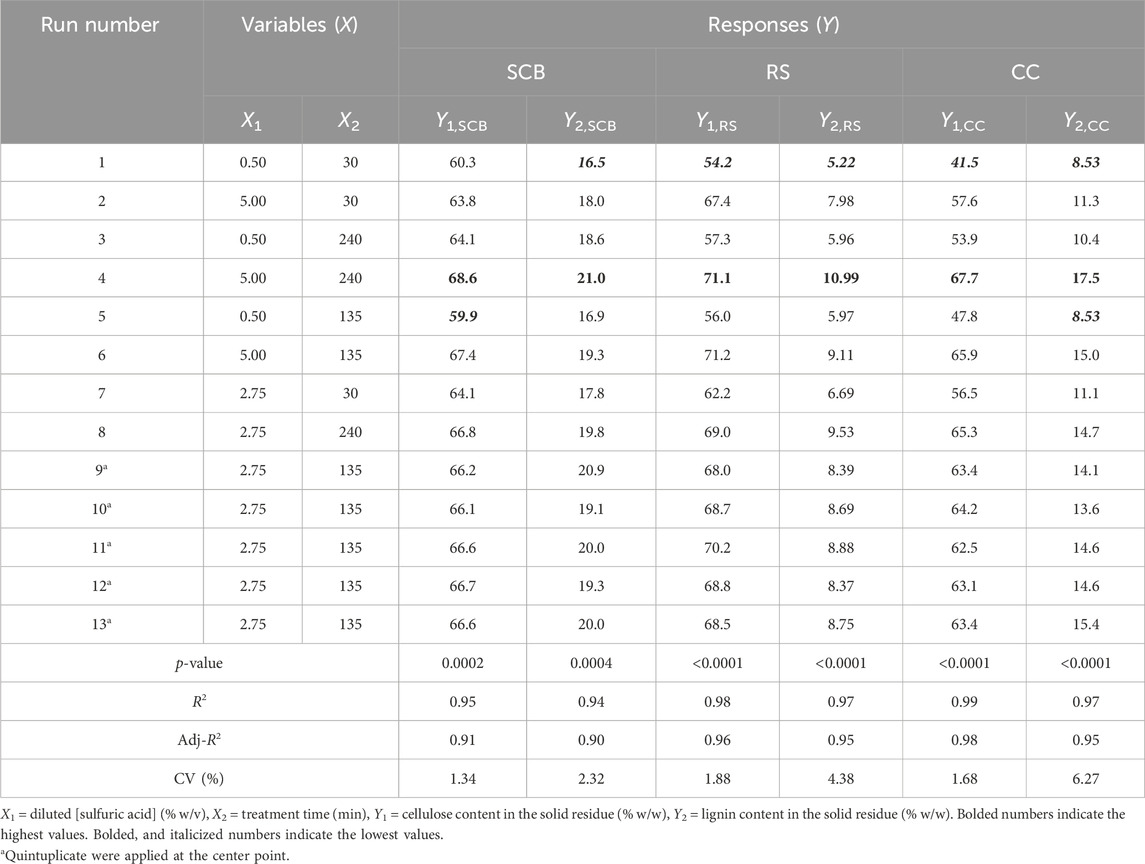
TABLE 2. Experimental design and CCD responses for the optimization of the pretreatment step.
Similar CCD optimization was also used in this process with three levels of [pretreated solid] (5, 12.5, and 20% w/v) and hydrolysis time (48, 144, and 240 h). The variable ranges were adapted from the work of Assabjeu et al. (2020), Phummala et al. (2015), and Qi et al. (2009) as tabulated in Table 3. The experiments were performed using the condition described in Preparation of solid and liquid portions in pretreatment and enzymatic hydrolysis steps with 25 mL working volume in 125 mL non-baffled Erlenmeyer flasks with a shaking speed of 200 rpm in a shaking incubator (LSI-3016R, Lab tech, Korea) and 3 min boiling time. Residual solids were obtained by the filtration technique using a two-layer muslin cloth (modified from the work of Nunta et al. (2019) and Qi et al. (2009)). The liquid portion was analyzed for sugar concentration to measure the response of glucose yield (% w/w) as estimated by Eq. 2 (adapted from the work of Qi et al. (2009) and Wang et al. (2019b)).
where 0.9 is the theoretical dehydration coefficient from glucose to cellulose as stated by Wang et al. (2019b).
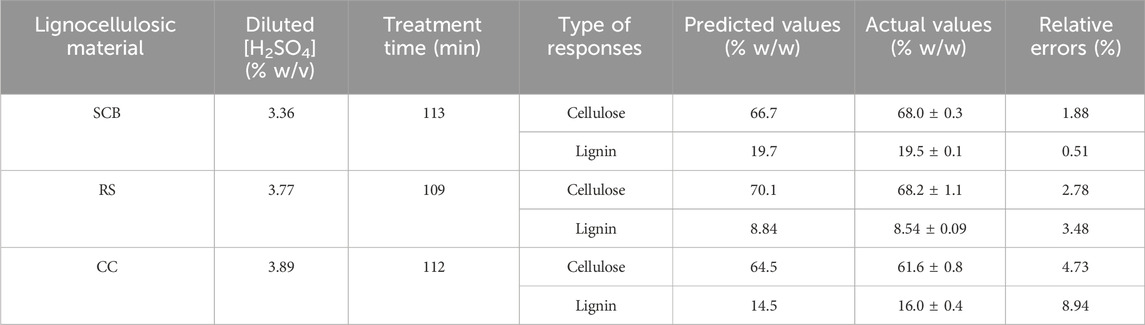
TABLE 3. Model validation of the optimal pretreatment conditions with the corresponding predicted responses, actual responses, and relative errors of cellulose and lignin contents for SCB, RS, and CC.
The quadratic model (Eq. 1) for predicting three responses on mass bases (% w/w), namely, mass basis compositions of 1) cellulose and 2) lignin in solid residue after pretreatment, as well as 3) glucose yield, was confirmed for its validity by the assessment of relative error percentage (% RE) lower than 10% (Maupin et al., 2017). The optimal conditions suggested by the models were evaluated experimentally in triplicate.
Shake-flask cultivations were performed with 100 mL working volumes in 250 mL non-baffled Erlenmeyer flasks with 10% v/v inoculation from the seed culture of C. magnoliae TISTR 5664. For xylitol production, xylose-rich hydrolysate prepared in gauze plug Erlenmeyer flasks was incubated at 30°C and 200 rpm in a shaking incubator without a pH controller under microaerobic conditions (adapted from the work of Antunes et al. (2021); Cheng et al. (2014); Zhao et al. (2013)). For ethanol production, glucose-rich hydrolysate in screw cap Erlenmeyer flasks was incubated under partially anaerobic conditions at 30°C with a rotation speed of 100 rpm (adapted from Cheng et al. (2014); Zhao et al. (2013)) without a pH controller. A total of 4 mL samples were collected from triplicate flasks at regular intervals from the beginning at every 24 h until 240 h. The related kinetic parameters were computed as indicated in Analytical methods.
The two-phase emulsion system using organic and aqueous phases with the optimal volume ratio of 0.43:1 (Gunawan et al., 2008) was carried out using the total combined volume of 25 mL in a 125 mL Erlenmeyer flask at 10°C (Tangtua et al., 2013). The frozen–thawed whole cells of C. magnoliae with an initial volumetric PDC activity of 1.53 ± 0.04 U/mL were used in the biotransformation. This system comprised vegetable oil as an organic phase with 200 mM benzaldehyde (Bz) and 1 M Pi buffer (pH 6.5/10 M KOH) as an aqueous phase with 240 mM sodium pyruvate (Pyr). These prescribed [Bz] and [Pyr] were as appeared in the total combined volume of both organic and aqueous phases. The concentration of co-factors, namely, thiamine pyrophosphate and magnesium sulfate heptahydrate, was 1 mM (Nunta et al., 2018).
The proximate analyses of SCB, RS, and CC pulverized powder were conducted by Central Laboratory (Thailand) Co., Ltd., based on the method of analysis for nutrition labeling for carbohydrates and calories (Sullivan and Carpenter, 1993). The contents of fat (954.02), crude fiber (978.10), protein (981.10), ash (942.05), and moisture (930.15) were determined using AOAC methods (AOAC, 2019). The cellulase and cellobiase activities were evaluated as described by Ghose (1987) with similar definitions of respective enzyme activities. The protein concentration of commercial enzyme mixtures, cultivation media, and the aqueous buffer of the biotransformation system were analyzed by Bradford assay (Bradford, 1976). The compositions of cellulose, hemicellulose, and lignin in lignocellulosic biomass and the solid portion after the pretreatment step were determined by the sequential method of Van Soest et al. (1991). Sugar (glucose, xylose, and arabinose), xylitol, and ethanol concentrations were determined by high-performance liquid chromatography (HPLC) (Agilent Technologies, HP1260, United States) using a Hi-Plex H column (Agilent Technologies, United States) and refractive index detector (RID) with similar mobile phase and running conditions as in the work of Tangtua et al. (2013). The concentrations of inhibitors, namely, furfural, HMF, and acetic acid were analyzed by HPLC with a 250 × 4.6 mm 5 μm ZORBAX Eclipse XDB-C18 column at 30°C and a diode array detector (DAD) at 210 nm (acetic acid) as well as 263 nm (HMF and furfural) with 5 μL injection volume. A gradient of acetonitrile:5 mM sulfuric acid was used as an eluent starting with 0:100 at 0 min, 10:90 at 6 min, 30:70 at 12 min, 70:30 at 18 min, 98:2 at 24 min, and 100:0 at 30 min and held until 35 min with a flow of 0.8 mL/min (modified from the work of Ohra-aho et al. (2021), and Dhanani et al. (2014), and Pereira et al. (2010)). Dried biomass concentration was determined as previously described by Leksawasdi et al. (2004). The morphological structures of SCB, RS, and CC in different stages, namely, original pulverized powder, solid portion after the pretreatment step, and residual solid portion after the enzymatic hydrolysis step, were compared using a scanning electron microscope (SEM) (JSM-IT300, JEOL, Japan) with photomicrographs taken at ×200 magnification. Kinetic parameters of yields (Y), specific growth rate (μ), specific substrate consumption or product formation rates (q), and productivity (Q) such as YXy/Xyl, YEt/TotS, YX/TotS, μmax, qTotS,max, qXy,max, qEt,max, QXy,max, and QEt,max were calculated based on methods described previously (Mahakuntha et al., 2021; Nunta et al., 2023). The theoretical mass yields of xylitol and ethanol of 0.912 g xylitol/g xylose (Tamburini et al., 2013) and 0.511 g ethanol/g xylose or glucose (Okamoto et al., 2014; Li Y. et al., 2019) were used for comparison with experimental values and expressed in relative percentages. The full names of subscript abbreviations are given in Nomenclature. Bz, Pyr, PAC, and by-products (acetaldehyde, acetoin, benzyl alcohol, and benzoic acid) were quantified by HPLC at 283 nm using the AltimaTM C8 column and DAD (Khemacheewakul et al., 2018). Volumetric PDC carboligase activity and the respective definition of activity were also determined with a similar procedure and definition as mentioned previously (Rosche et al., 2002) for collected frozen–thawed whole cells at 240 h for subsequent biotransformation experiment. The specific PDC activity per gram of frozen–thawed whole cells was also calculated based on wet whole cells being weighed and solubilized in a known volume of carboligase buffer. PAC molarity yields and assessment of close molarity balances with respect to Pyr and Bz were based on the well-established methods published elsewhere (Kumar et al., 2023). Costing analyses relevant to PAC production in both single-phase and two-phase emulsion systems utilizing frozen–thawed whole cells were performed with the well-established strategy published previously by our group (Leksawasdi et al., 2021; Kumar et al., 2023).
Mean values (MVs) and respective standard errors (SEs) were evaluated from experimental data using at least three replicates and represented as MV ± SE. The statistically significant difference (p ≤ 0.05) of results was analyzed using SPSS for Windows 22.0 (SPSS, United States). ANOVA in this case was carried out using Duncan’s multiple-range test with the similar p-value probability. Two adjacent mean values (MV1 and MV2) between subsequent time courses which were not statistically significant different (p ≤ 0.05) were shown in the range with the highest SE among the two or (MV1–MV2) ± SEmax.
A total of 13 experiments designed by the CCD for SCB, RS, and CC with diluted [sulfuric acid] (0.5%–5.0% w/v) and treatment time (30–240 min) as well as the results of the remaining cellulose and lignin after pretreatment are tabulated in Table 2. The effect of increasing [sulfuric acid] and treatment time was directly proportional to remnant cellulose and lignin contents in solid residue reaching the highest responses as indicated in Run number 4 with the highest diluted [sulfuric acid] and treatment time. This was compared to the lowest lignin content in Run number 1 with the lowest diluted [sulfuric acid] and treatment time. A series of regressed quadratic equations for SCB, RS, and CC which correlated diluted [sulfuric acid] and treatment time to the remaining cellulose (Eqs 3.1–3.3) and lignin (Eqs 4.1–4.3) contents in the solid residue were generated by the CCD based on actual factors. The assessment of each term in the regressed equation by the F-test and ANOVA revealed that the combined equation or model term significant for predicting responses for SCB, RS, and CC were all statistically significant (p ≤ 0.05) with the response surface plot as shown in Figure 1. In fact, R2 and Adj-R2, which are also included in Table 2, implied high correlation (≥0.9) of diluted [sulfuric acid] and treatment time to the remaining cellulose and lignin contents in the solid residue. Furthermore, CV values (Table 2) which were all lower than 10% also indicated better precision and reliability of the regressed equations in predicting experimental data. Supplementary Tables S1–S3 list other relevant statistical parameters for SCB, RS, and CC pretreatment optimization. The models were then used to predict the optimal cellulose and lignin contents in the solid residue after the pretreatment step. The targeted responses would be the optimum balanced values between relatively high cellulose with sufficiently low lignin contents. These optimal pretreatment conditions (diluted [sulfuric acid], treatment time) as suggested by the models were (3.36% w/v, 113 min), (3.77% w/v, 109 min), and (3.89% w/v, 112 min), for SCB, RS, and CC, respectively. The corresponding predicted responses (cellulose content, lignin content) in the solid residue were (66.7, 19.7% w/w), (70.1, 8.84% w/w), and (64.5, 14.5% w/w), for SCB, RS, and CC, respectively. Table 3 shows the validation results of these models by independent verification experiments producing the actual responses (cellulose content, lignin content) in the solid residue of (68.0 ± 0.3, 19.5% ± 0.1% w/w), (68.2 ± 1.1, 8.54% ± 0.09% w/w), and (61.6 ± 0.8, 16.0% ± 0.4% w/w), for SCB, RS, and CC, respectively. The paired comparison of predicted and actual responses clearly elucidated the acceptable relative errors of less than 10%.
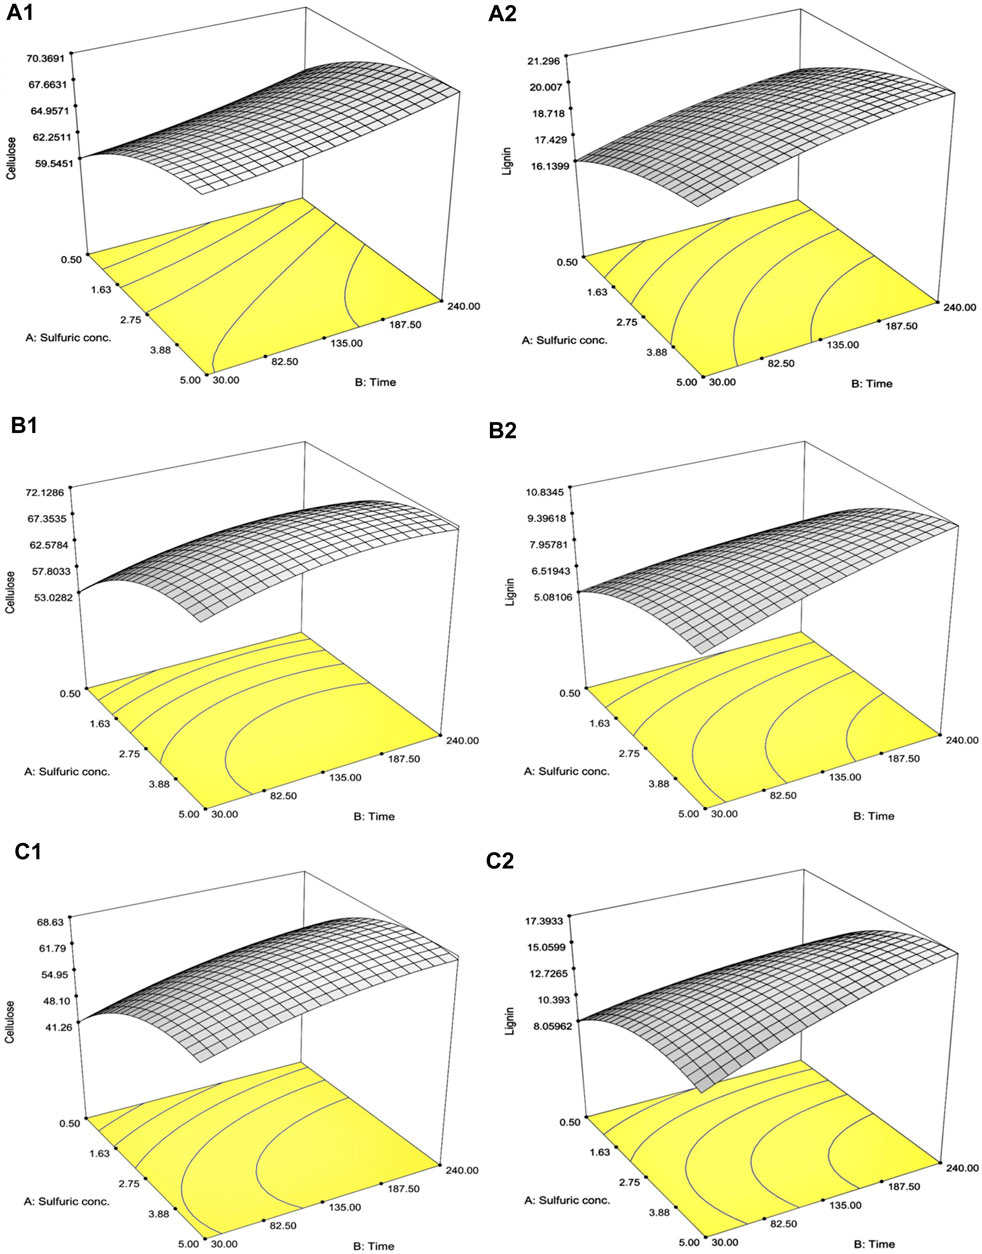
FIGURE 1. Response surface plot of the interaction effects between diluted [sulfuric acid] and treatment time on (A) SCB, (B) RS, and (C) CC on the optimization of the remaining (1) cellulose and (2) lignin contents in the solid portion.
The employed optimized conditions resulted in compositions of cellulose, hemicellulose, and lignin in the solid portion and concentrations of xylose, arabinose, and glucose in the liquid portion after the pretreatment step of SCB, RS, and CC, as shown in Figure 2. The comparison of solid compositions was also being made to each untreated lignocellulosic biomass. Under these optimal conditions, the composition of cellulose was increased by 13.2 ± 0.6, 22.8 ± 1.1, and 26.7% ± 0.8% w/w in SCB, RS, and CC, respectively. Lignin compositions were also enhanced by 2.41 ± 0.41, 4.17 ± 0.17, and 8.17% ± 0.38% w/w for SCB, RS, and CC, respectively. There appeared a correlation of hemicellulose solubilization in the solid portion with the presence of xylose, arabinose, and glucose in the liquid portion after the pretreatment step. Some hemicellulose composition in the untreated lignocellulosic biomass might have disintegrated and resulted in the decrease in hemicellulose by 6.74 ± 0.30, 21.3 ± 0.3, and 32.3% ± 0.4% w/w in SCB, RS, and CC, respectively. The soluble pentose and hexose monosaccharides in the liquid portion could be detected as evident in Figure 2. The mass balance of disappearing hemicellulose in the solid portion after the pretreatment step suggested that the degraded hemicellulose might also exist in a more complex form of saccharides rather than solely monosaccharides such as disaccharides or oligosaccharides (de Jong and Gosselink, 2014). The remnant liquid portion for SCB, RS, and CC was 74, 81, and 80 mL, respectively. The overall monosaccharide concentration in the liquid portion as shown in Figure 2 could be calculated back to hemicellulosic compositions in the untreated SCB, RS, and CC of 6.66 ± 0.13, 10.7 ± 0.1, and 19.2% ± 0.1% w/w, respectively. The initial hemicellulosic compositions in SCB, RS, and CC were converted to monosaccharides in the liquid portion by 67.9% ± 2.1%, 41.1% ± 0.3%, and 50.2% ± 0.5%, respectively. The highest sugar conversions were obtained from CC with 144 ± 1, 32.7 ± 0.1, 18.3 ± 0.8, and 195 ± 1 mg/g pulverized powder for xylose, arabinose, glucose, and total sugars, respectively, followed by the conversion of RS and SCB with (xylose, arabinose, glucose, and total sugars) as (81.1 ± 1.0, 19.2 ± 0.2, 7.32 ± 0.39, and 108 ± 1 mg/g pulverized powder) and (67.3 ± 0.8, 5.07 ± 0.17, 0.90 ± 0.16 mg/g pulverized powder), respectively.
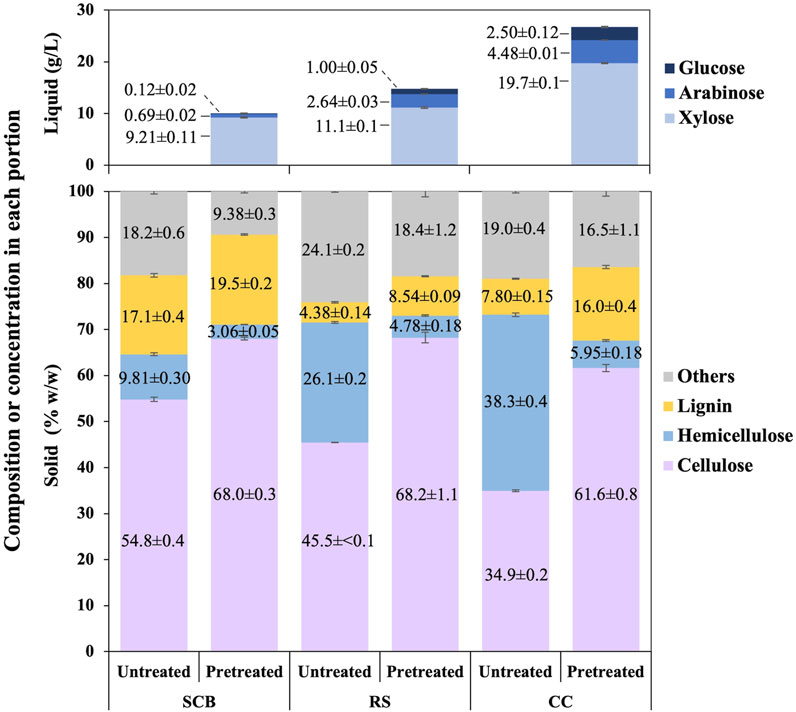
FIGURE 2. Composition of cellulose, hemicellulose, lignin, and others in the solid portion as well as [xylose], [arabinose], and [glucose] in the liquid portion after the pretreatment step of SCB, RS, and CC.
Table 4 indicates the 13 experimental designs by the CCD for the pretreated SCB, RS, and CC solids obtained from the prior optimization with [pretreated solids] (5%–20% w/v) and hydrolysis time (48–240 h) as well as the result of glucose yield. The maxima glucose yields for SCB and CC were obtained at Run number 3, of which the lowest [pretreated solids] and the highest hydrolysis time were used. This was in contrast to Run number 5 where the maximum glucose yield of RS was attained with the lowest [pretreated RS] and hydrolysis time of 144 h. Further increase in hydrolysis time for RS did not result in the improved glucose yield, possibly due to the relatively low lignin content for this lignocellulosic biomass compared to the others. As lignin is a well-known compound which exerts some degree of enzymatic inhibitory effect, the extended enzymatic hydrolysis times are, thus, required for the digestion of pretreated SCB and CC to achieve the maximum glucose yield as RS. A similar form of regressed quadratic equations described previously for pretreatment step optimization was, thus, employed for the correlation of [pretreated solids] and enzymatic hydrolysis time to glucose yield (Eqs 5.1–5.3) in the enzymatic hydrolysis step based on actual factors. The F-test and ANOVA clearly showed a statistically significant (p ≤ 0.05) response surface plot (Figure 3) with relatively high correlation (>0.9) of [pretreated solids] and enzymatic hydrolysis time to glucose yield as evident from R2 and Adj-R2 (Table 4). CV values were in the range of 6.81%–8.82% which was lower than 10%, indicating improved precision and reliability of the regressed equations in predicting experimental data. Supplementary Tables S6–S8 tabulate other relevant statistical parameters for SCB, RS, and CC enzymatic hydrolysis optimization. The regressed quadratic equations obtained previously were used to optimize glucose yield after the enzymatic hydrolysis step with relatively high [pretreated solids] as much as possible to increase substrate loading and minimize hydrolysis time for productivity enhancement. The elucidated optimal enzymatic hydrolysis conditions ([pretreated solids], hydrolysis time) from the model were (12.1% w/v, 93 h), (10.9% w/v, 61 h), and (12.0% w/v, 90 h) for SCB, RS, and CC, respectively. The predicted glucose yields in liquid portion after the enzymatic hydrolysis step for SCB, RS, and CC were 11.2% w/w, 21.6% w/w, and 30.1% w/w, respectively. The validated glucose yields obtained from the specified optimal enzymatic hydrolysis conditions were 11.7% ± 0.2% w/w, 23.5 ± < 0.1% w/w, and 32.7% ± 0.4% w/w, respectively. The subsequent determination of relative errors between these predicted and validated values showed that they were all lower than 10% (Table 5). Further analyses of the liquid portion after the enzymatic hydrolysis step of SCB, RS, and CC for [monosaccharides] indicated [glucose] of 21.3 ± 0.3 g/L, 34.6 ± 0.1 g/L, and 51.5 ± 0.6 g/L with the slight [xylose] of 5.92 ± 0.09 g/L, 7.34 ± 0.28 g/L, and 10.6 ± 0.3 g/L, respectively. The highest sugar conversions were obtained from CC at which glucose, xylose, and total sugars of 149 ± 3, 33.5 ± 1.4, and 182 ± 4 mg/g pretreated solid were recorded, respectively. The glucose, xylose, and total sugar conversion of RS and SCB were (118 ± <1, 29.7 ± 1.5, and 148 ± 1 mg/g pretreated solid) and (88.3 ± 1.2, 24.5 ± 0.4, and 113 ± 2 mg/g pretreated solid), respectively.
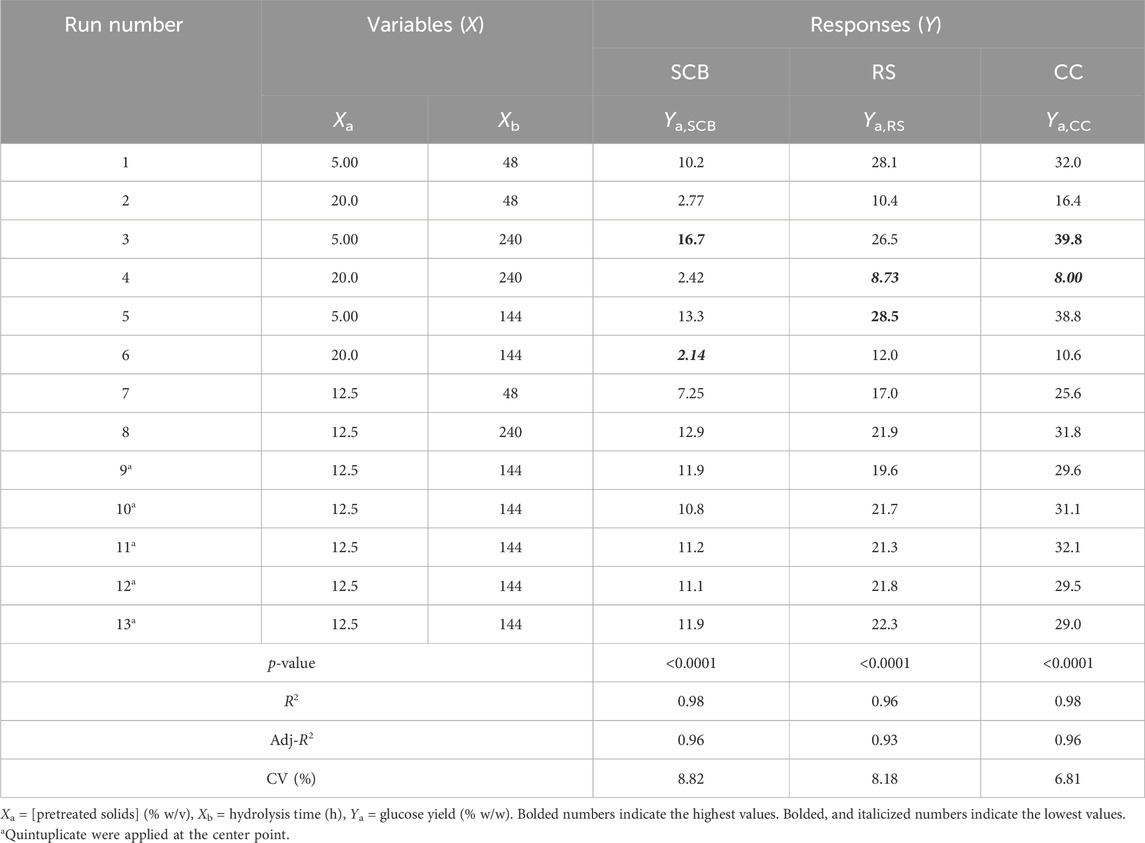
TABLE 4. Experimental design and CCD responses for the optimization of the enzymatic hydrolysis step.
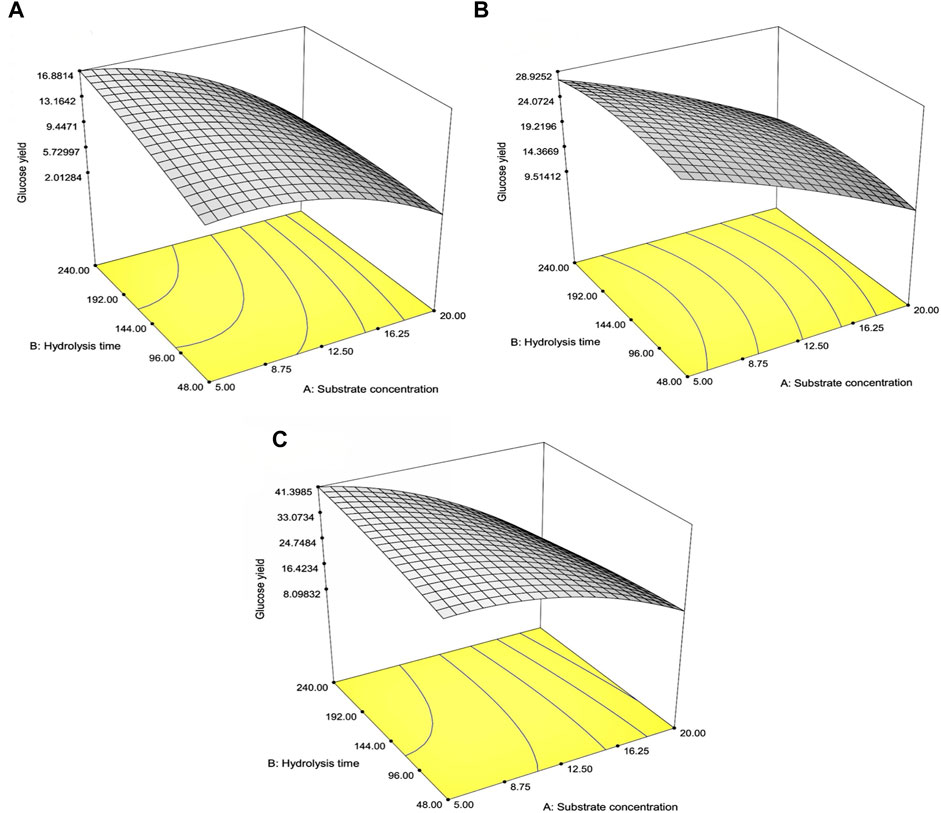
FIGURE 3. Response surface plot of the interaction effects between substrate concentration and hydrolysis time on the glucose percentage yields for (A) SCB, (B) RS, and (C) CC in the optimization of the enzymatic hydrolysis step.
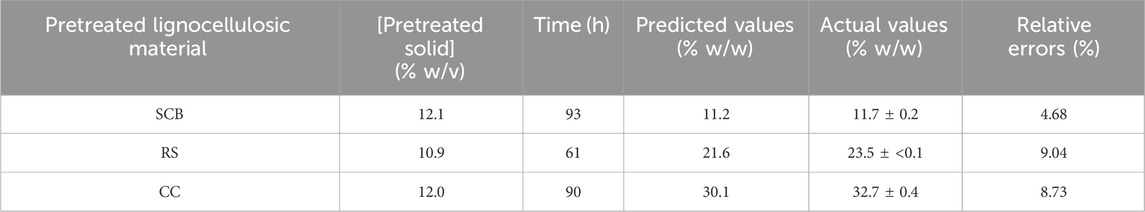
TABLE 5. Model validation of the optimal enzymatic hydrolysis conditions with the corresponding predicted, actual, and relative errors of glucose percentage yields for SCB, RS, and CC.
The SEM images of the original pulverized powder, solid portion after the pretreatment step, and residual solid portion after the enzyme hydrolysis step were taken at ×200 magnification (Figure 4). The micrographs of untreated SCB, RS, and CC (Figures 4A1–C1) indicated the even and smooth flat surfaces of cell walls. After diluted sulfuric acid pretreatment, the effect of acidic breakage at the susceptible glycosidic linkages between hemicellulose and cellulose could be clearly seen on the surfaces. As the hemicellulose was dissolved, the microfibril structures appeared to open up with increased porosity and the presence of more crystalline cellulose structures (Figures 4A2–C2). Some of the lignin structures also appeared in the pretreated RS as shown in Figure 4B2. The enhanced crystalline structure of cellulose fibrils was also evident after the enzymatic hydrolysis step.
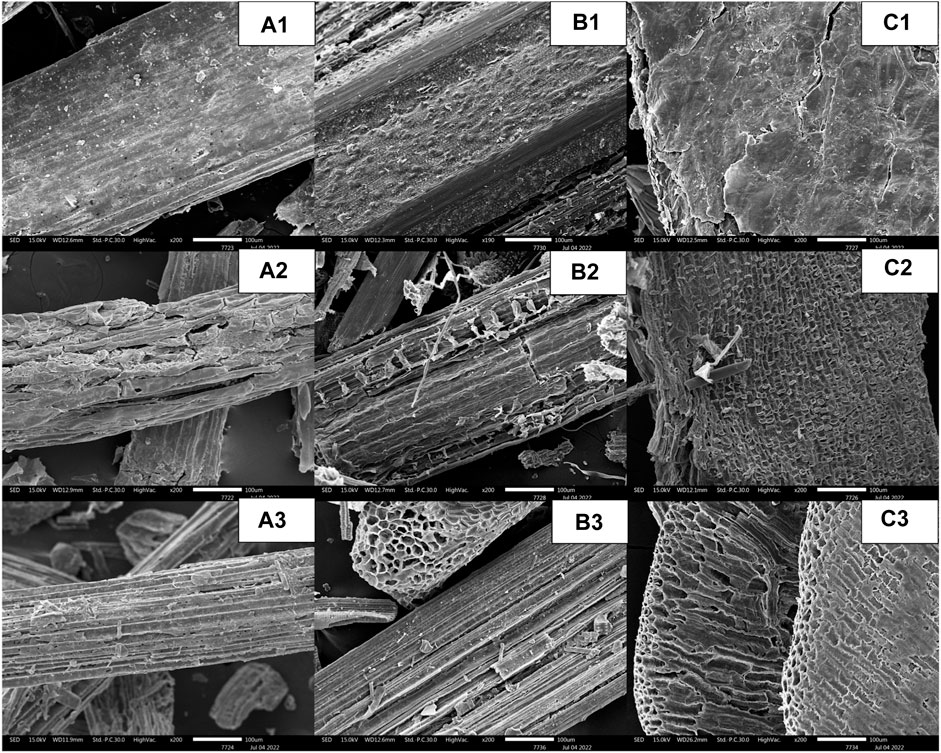
FIGURE 4. SEM images at ×200 magnification of (A) SCB, (B) RS, and (C) CC in three stages, namely, (1) original pulverized powder, (2) the solid portion after the pretreatment step, and (3) the residual solid portion after the enzyme hydrolysis step.
CC was the lignocellulosic material of choice for xylitol and ethanol production, as evident from prior optimization experiments for pretreatment and enzymatic hydrolysis steps. The [xylose] of 19.7 ± 0.1 g/L in the solid portion of the pretreatment step and glucose yield (32.7% ± 0.4% w/w) as well as [glucose] (51.5 ± 0.6 g/L) in the liquid portion enzymatic hydrolysis step of CC were all statistically significantly highest (p ≤ 0.05) among other lignocellulosic materials.
Initially, for xylitol production, [glucose], [xylose], [arabinose], and [total sugars] were evident at 8.52 ± 0.13, 53.0 ± 1.2, 16.3 ± 0.6, and 77.8 ± 1.8 g/L, respectively. From Table 6, the statistically significant maximum (p ≤ 0.05) [xylitol] was (28.4–29.1) ± 0.3 g/L with a YXy/Xyl of (0.58–0.60) ± 0.01 gXy/gXyl which corresponded to (64–66) ± 1% of the xylitol theoretical yield obtained at 72–96 h after cultivation. At the same time interval, a relatively low [ethanol] of (3.89–5.98) ± 0.30 g/L was also attained with the YEt/TotS of (0.056–0.093) ± 0.003 gEt/gTotS or (11–18) ± 1% of the ethanol theoretical yield. A [dried biomass] of (6.67–10.8) ± 0.32 g/L which corresponded to a YX/TotS of (0.10–0.16) ± 0.01 gX/gTotS was obtained. In the current system, the statistically significant highest (p ≤ 0.05) level of [ethanol] being produced was (5.87–5.98) ± 0.30 g/L with the corresponding YEt/TotS of (0.093–0.10) ± 0.003 gEt/gTotS observed at 48–72 h. This was compared to the statistically significant highest (p ≤ 0.05) level of [dried biomass] generated at (17.7–18.4) ± 0.5 g/L and a YX/TotS of (0.25–0.26) ± 0.01 gX/gTotS at 192–240 h.
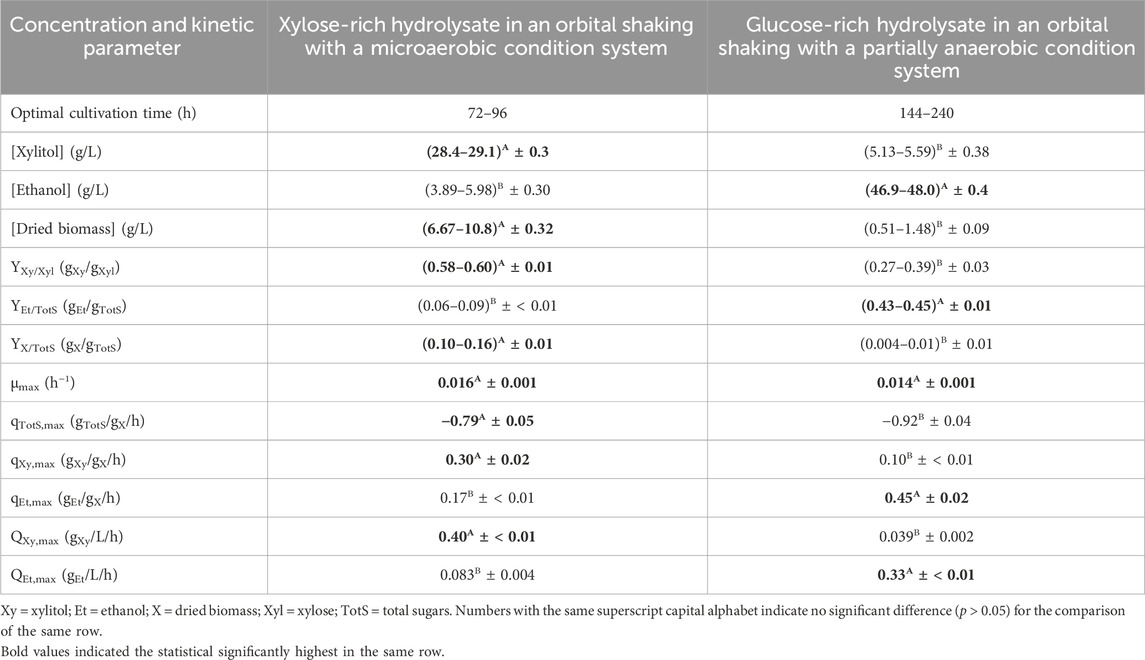
TABLE 6. Xylitol and ethanol and dried biomass production with the relative kinetic parameters using xylose- and glucose-rich hydrolysates without the detoxification step as carbon sources.
The initial [glucose], [xylose], and [total sugars] were 105 ± 2, 29.3 ± 0.8, and 135 ± 3 g/L, respectively, for ethanol production. The statistically significant maximum (p ≤ 0.05) [ethanol] was (46.9–48.0) ± 0.4 g/L with a YEt/TotS of (0.43–0.45) ± 0.01 gEt/gTotS which corresponded to (84–88) ± 2% of the ethanol theoretical yield based on total sugar utilization achieved at 144–240 h. At this time duration, the [xylitol] was also produced with the statistically significant highest (p ≤ 0.05) values of (5.17–5.59) ± 0.38 g/L with the corresponding YXy/Xyl of (0.31–0.39) ± 0.04 gXy/gXyl or (37–42) ± 3% of the xylitol theoretical yield. [Dried biomass] of (0.51–1.48) ± 0.12 g/L and the corresponding YX/TotS of less than 0.015 gX/gTotS were detected. The statistically significant highest (p ≤ 0.05) level of [dried biomass] generated at 4.39 ± 0.18 g/L and YX/TotS of 0.05 ± < 0.01 gX/gTotS was observed at 96 h.
The sugar mixture was both xylose-rich and glucose-rich from the respective pretreatment, and enzymatic hydrolysis could also be used for simultaneous xylitol and ethanol co-production with Candida spp. Evidently, the relatively high ethanol yield was observed with lower YXy/Xyl (around 0.2 gXy/gXyl) which may indicate that suitable conditions for xylitol and ethanol production are dissimilar. Xylitol should be produced under limited-aerobic conditions while ethanol should be produced under anaerobic conditions. Such findings were also observed in various studies (Du et al., 2020; Raj and Krishnan, 2020; Hor et al., 2023).
The formation and degradation of three possible inhibitors, namely, HMF, furfural, and acetic acid, were observed in all steps of pretreatment, evaporation, and cultivation. Table 7 reveals that CC possessed the statistically significant highest (p ≤ 0.05) concentration of all three inhibitors (319 ± 15 mg/L for HMF, 122 ± < 1 mg/L for furfural, 3.11 ± 0.14 g/L for acetic acid). This was strongly correlated to the relatively high monosaccharide conversion (Sajid et al., 2021) when compared with SCB (1.21 ± 0.26 mg/L, 43.1 ± 2.0 mg/L, and 1.07 ± 0.02 g/L) and RS (50.5 ± 1.0 mg/L, 58.5 ± 1.4 mg/L, and 1.11 ± 0.04 g/L) during the pretreatment step.
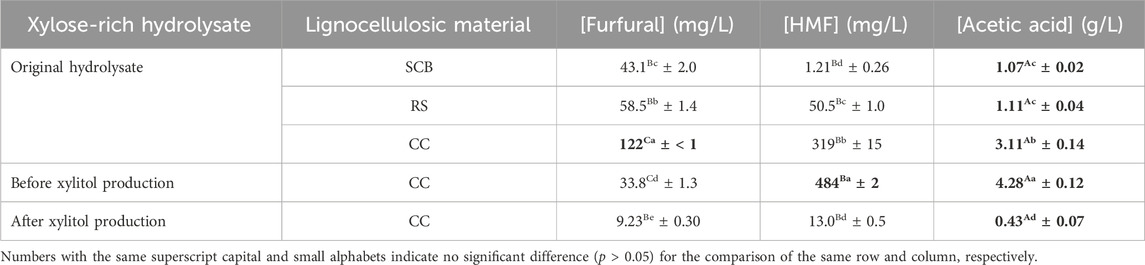
TABLE 7. Furfural, HMF, and acetic acid concentrations in original acid hydrolysate, before xylitol production, and after xylitol production.
[HMF] and [acetic acid] after vacuum evaporation and pH adjustment steps prior to cultivation were 484 ± 2 mg/L and 4.28 ± 0.12 g/L, respectively, which corresponded to the statistically significant increase (p ≤ 0.05) by 51.7% ± 4.7% and 37.6% ± 5.9% of those in the original hydrolysate, whereas [furfural] was statistically significantly decreased (p ≤ 0.05) by 72.3% ± 1.1% to only 33.8 ± 1.3 mg/L.
After 72 h cultivation during xylitol production, the wild type of C. magnoliae TISTR 5664 could statistically significantly degrade (p ≤ 0.05) these inhibitors (HMF, acetic acid, and furfural) by 97.3% ± 0.4% (final value of 13.0 ± 0.5 mg/L), 90.0% ± 3.2% (final value of 0.43 ± 0.07 g/L), and 76.2% ± 3.4% (final value of 9.23 ± 0.30 mg/L), respectively. In fact, acetic acid was totally consumed after 96 h.
The specific PDC activity of 4.75 ± 0.10 and 2.50 ± 0.05 U/g frozen–thawed whole cells from xylitol and ethanol production systems, respectively, was elucidated before use. The [PAC] of 44.0 ± 1.7, 96.2 ± 3.2, and 59.7 ± 0.2 mM were achieved in aqueous, organic, and overall phases, respectively, at 8 h reaction time. The overall [PAC] was improved by 2-fold compared to the value previously reported by Khemacheewakul et al. (2018) who utilized Pi buffer as a single-phase emulsion system. The comparison of PAC production without pH control between single-phase and two-phase emulsion systems is tabulated in Table 8. This result showed a similar magnitude of [PAC] production in overall phases when compared with 62.3 mM from the latest published report using C. tropicalis whole cells obtained from ethanol production (Nunta et al., 2023). The PAC molar yields on Pyr and Bz were 0.71 ± 0.03 mol PAC/mol Pyr and 0.95 ± 0.04 mol PAC/mol Bz, respectively. The Pyr and Bz molarity balances were 99% ± 6% and 88% ± 2%, respectively.
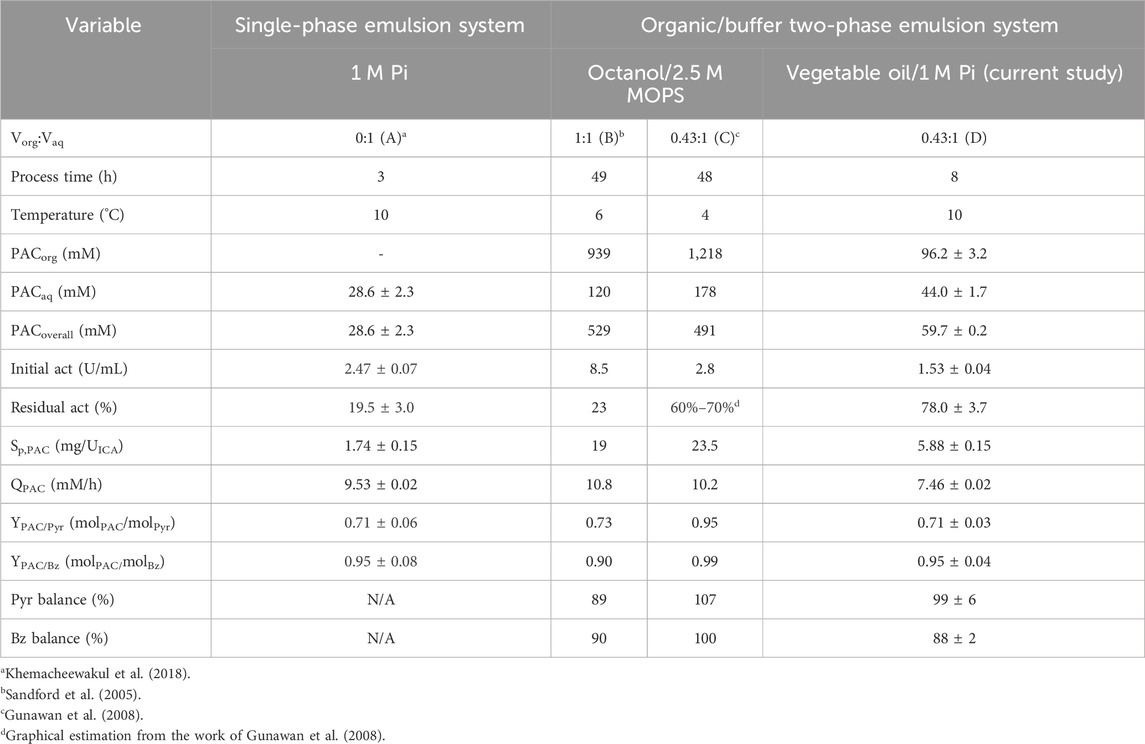
TABLE 8. Comparison of PAC production without pH control in (A) the single-phase emulsion system and organic/buffer two-phase emulsion system, (B–C) octanol/2.5 M MOPS, and (D) vegetable oil/1 M Pi.
There was no acetaldehyde and acetoin being formed during the 8 h reaction time course as evident from the final Pyr molarity balance which was almost 100%. Benzyl alcohol was also not detected, possibly due to the inactivity of alcohol dehydrogenase (ADH) in the frozen–thawed whole cells (Khemacheewakul et al., 2021). Benzoic acid was the sole by-product being generated in a minute amount of 1.75 ± 0.09 mM. The relatively low Bz molarity balance might reflect some losses (12%), which confirms the higher Bz volatility compared to Pyr (Kumar et al., 2023).
The implementation of high temperature and high pressure could affect the sugar conversion yields in the pretreatment step. These results indicated slightly low sugar conversions when compared to the values previously reported by Sumphanwanich et al. (2008) who employed 121°C with diluted sulfuric acid and an LSR of 10:1 (v/w) for 1 h reaction time in pretreatment. The optimal diluted [sulfuric acid] of 188 mM (1.84% w/v) was achieved for SCB and CC and 282 mM (2.77% w/v) for RS. The reducing sugar conversion showed a higher release up to 402 ± 1.2, 255 ± 4.9, and 473 ± 2.5 mg/g dried solid for CC, SCB, and RS, respectively, with the statistically significant highest (p ≤ 0.05) xylose released of 206 ± 6.1 mg/g dried solid obtained from CC, followed by SCB (120 ± 0.5 mg/g dried solid) and RS (119 ± 0.4 mg/g dried solid), respectively. The diluted sulfuric acid pretreatment step with less than 100°C might seem to be more suitable for industrial applications due to lower energy cost. The reported glucose yields were slightly lower when compared to high temperature ranges (100°C–250°C) (Baruah et al., 2018). Sumphanwanich et al. (2008) reported the highest reducing sugars released after diluted sulfuric acid pretreatment at 121°C followed by enzymatic hydrolysis at 50°C and pH 4.5 for 48 h using 5% w/v of pretreated solid. The corresponding values for CC, SCB, and RS were 694 ± 2.6 mg/g, 520 ± 1.6 mg/g, and 466 ± 4.2 mg/g, respectively. The appending of the alkaline pretreatment step could also be applied to remove the remaining lignin content after hemicellulose was solubilized in acid hydrolysate (Tan et al., 2021; Antunes et al., 2023) which, in turn, resulted in the enhanced glucose conversion yield in the enzymatic hydrolysis step.
Evidently, the remaining lignin content in the pretreated solids could inhibit enzyme accessibility, resulting in low glucose yield. It is possible that the abundant S-type lignin of up to 60% w/w in the pretreated SCB with a relatively high molecular weight of 210.23 g/mol and predominant β-ether linkage bestows upon this type of lignocellulosic biomass with high degree of resistivity when subjected to breakdown by various acids and alkaline solutions at physiological temperature. On the other hand, RS contains a rather rich G type (68% w/w) with a molecular weight of 180.20 g/mol, while the CC structure is mainly associated with the H type (55% w/w) with the lowest molecular weight of 150.17 g/mol (del Río et al., 2015; Rabemanolontsoa and Saka, 2013; Smith et al., 2022; Takada et al., 2018). Thus, the pretreated SCB with the highest lignin content (19.5% ± 0.2% w/w) and highly resistant structure had the lowest glucose conversion yield after passing through the enzymatic hydrolysis step when compared with the other two counterparts.
The results of xylitol and ethanol production using the hydrolysates obtained from the optimal pretreatment and enzymatic hydrolysis steps showed that C. magnoliae TISTR 5664 in this study could consume up to 97% of available xylose resulting in the similar reported YXy/Xyl of 0.57 ± 0.05 gXy/gXyl using the same strain in 25 g/L xylose medium (Hor et al., 2023). Nevertheless, the xylitol yield in the current study was higher compared to 0.452 gXy/gXyl obtained from C. magnoliae TISTR 5663 in a non-detoxified SCB hydrolysate (Wannawilai and Sirisansaneeyakul, 2015). Another study of C. magnoliae by Arrizon et al. (2012) reported a relatively lower xylitol yield of 0.24 ± 0.01 gXy/gXyl using SCB xylose-rich hydrolysate. In fact, the xylitol yield could be improved by optimizing the agitation intensity and/or air flow rate as well as employing a two-stage aeration rate using high aeration in the first stage and a subsequent decrease in in the second stage in a fermenter system (Raj and Krishnan, 2020; Hor et al., 2023). The YXy/Xyl of 0.83 ± 0.08 gXy/gXyl was achieved from this two-stage aeration fermentation (Hor et al., 2023). In commercial ethanol production, S. cerevisiae was the obvious choice for the most favorable yeast employed. The ethanol production reported by Arrizon et al. (2012) showed a similarly high ethanol production yield of 0.44 ± 0.02 gEt/gGlu, which corresponded to 85.4% ± 2.4% of the theoretical yield using non-detoxified SBC hydrolysate. Cheng et al. (2014) also reported a YEt/TotS of 0.42 gEt/gGlu from non-detoxified CC hydrolysate with C. tropicalis W103 as a fermenting microbe. C. magnoliae TISTR 5664 in this study could significantly degrade inhibitors formed during the pretreatment step. Evidently, this strain indicated the similar tolerant ability as C. tropicalis W103 which could totally degrade HMF and furfural after 60 h while acetic acid was consumed by 89.4% after xylitol production. This resulted in a relatively lower YXy/Xyl of 0.32 gXy/gXyl using non-detoxified CC hydrolysate (Cheng et al., 2014). Seemingly, the detoxification step was, thus, unnecessary for cost-saving purposes, as demonstrated by the current study and Cheng et al. (2014).
The report published by Nunta et al. (2023) indicated that C. tropicalis was the statistically significant highest (p ≤ 0.05) ethanol producer with a lower YEt/TotS of 0.38 gEt/gTotS (15.3 g/L). In fact, C. tropicalis and C. magnoliae could produce the highest xylitol and ethanol concentrations as evident from previous studies by our group while the ability to produce xylitol was lacking in S. cerevisiae (Cunha et al., 2019). To improve the xylitol and ethanol yields, the corresponding production processes were carried out under microaerobic and partially anaerobic conditions, respectively, using C. magnoliae. The [PAC] in the overall phases were achieved at a similar level between the mixture of C. magnoliae whole cells derived from xylitol and ethanol production steps and C. tropicalis whole cells from the ethanol production step. In term of PAC activity, C. magnoliae whole cells obtained from the xylitol production step had the twice induced PDC activity level than those derived from the ethanol production step.
Even though a two-phase emulsion system could improve PAC production due to its compatibility with the hydrophobic structure of organic phase (Sandford et al., 2005), the associated cost per unit of PAC production could be higher if the produced PAC was not sufficiently high enough to offset the cost of employed organic phase. This was in agreement with the work of Kumar et al. (2023) where the total production cost between a two-phase emulsion system with a volume ratio of 1:1 (vegetable oil:1 M Pi buffer) was increased by 135% in comparison with a single-phase emulsion system (USD 1.93/kg PAC compared with USD 0.82/kg PAC). This was nearly equivalent to 146% increase to the PAC being formed which might not be worthwhile to the investment cost. In fact, the total cost of two-phase emulsion system with vegetable oil and 1 M Pi buffer in this study was much lower (USD 0.42/kg PAC) when the optimal volume ratio of 0.43:1 was employed (Gunawan et al., 2008). The cost effectiveness of this system was significantly pronounced (p ≤ 0.05) when compared to the work of Kumar et al. (2023) with a cost mitigation of 78.4% and 49.1% for similar two-phase emulsion and single-phase emulsion systems. The potential of the multi-pass recycling system of vegetable oil as predicted by Kumar et al. (2023) was quite attractive to further the lowering in production cost while facilitating PAC accumulation. The expected cost reduction in this system could be up to 30% in the third-pass biotransformation with relatively higher [PAC].
The optimal conditions of pretreatment strategy utilizing diluted [sulfuric acid] in boiling water and the subsequent enzymatic hydrolysis step of SCB, RS, and CC were elucidated and could be adopted as the conditions of choice for the industrial-scale production. The relatively high-valued chemicals such as xylitol, ethanol, and PAC could be produced to assure an overall economically competitive process with the wild-type C. magnoliae TISTR 5664. The ability of this yeast to degrade a statistically significant amount of HMF, acetic acid, and furfural during xylitol production from CC xylose-rich hydrolysate was noted in our study without the necessity of adding the detoxification step. In future study, the production of xylitol and ethanol with the implementation of cell recycling will be investigated in both CC xylose-rich and CC glucose-rich hydrolysates. The multi-pass recycling procedure of organic phase in the two-phase emulsion biotransformation system for PAC biotransformation will also be evaluated.
The raw data supporting the conclusion of this article will be made available by the authors, without undue reservation.
KP: Conceptualization, Data curation, Formal Analysis, Funding acquisition, Investigation, Methodology, Validation, Writing–original draft, Writing–review and editing. JK: Data curation, Writing–review and editing. CT: Writing–review and editing. YP: Data curation, Writing–review and editing. KJ: Writing–review and editing. SS: Formal Analysis, Resources, Writing–review and editing. CaM: Methodology, Resources, Writing–review and editing. JF: Writing–review and editing. SLH: Writing–review and editing. CuM: Writing–review and editing. XZ: Writing–review and editing. WW: Data curation, Writing–review and editing. WQ: Writing–review and editing. FL: Writing–review and editing. TL: Data curation, Writing–review and editing. AK: Visualization, Writing–review and editing. RN: Conceptualization, Investigation, Resources, Validation, Writing–review and editing. NL: Conceptualization, Funding acquisition, Investigation, Resources, Validation, Writing–review and editing.
The author(s) declare financial support was received for the research, authorship, and/or publication of this article. This work was supported by the NRCT in the framework of the RGJ Ph.D. Programme (Grant Number PHD/0111/2560) and Fundamental Fund 2023, CMU (Grant Number FF66/042).
The authors gratefully acknowledge financial support from the National Research Council of Thailand (NRCT) in the framework of the Royal Golden Jubilee (RGJ) Ph.D. Programme (Grant Number PHD/0111/2560) to KP and NL; Fundamental Fund 2023, Chiang Mai University (CMU) (Grant Number FF66/042); Multidisciplinary and Interdisciplinary School, CMU; School of Agro-Industry; Faculty of Agro-Industry, CMU; Center of Excellence—Agro Bio-Circular-Green Industry (Agro-BCG) (CoE66-P001); Bioprocess Research Cluster (BRC); and Office of Research Administration (ORA). TISTR is also thanked for microbial strain support.
The authors declare that the research was conducted in the absence of any commercial or financial relationships that could be construed as a potential conflict of interest.
The author(s) declared that they were an editorial board member of Frontiers, at the time of submission. This had no impact on the peer review process and the final decision.
All claims expressed in this article are solely those of the authors and do not necessarily represent those of their affiliated organizations, or those of the publisher, the editors, and the reviewers. Any product that may be evaluated in this article, or claim that may be made by its manufacturer, is not guaranteed or endorsed by the publisher.
The Supplementary Material for this article can be found online at: https://www.frontiersin.org/articles/10.3389/fbioe.2023.1332185/full#supplementary-material
Antunes, F. A. F., Freitas, J. B. F., Prado, C. A., Castro-Alonso, M. J., Diaz-Ruiz, E., Mera, A. E., et al. (2023). Valorization of corn cobs for xylitol and bioethanol production through column reactor process. Energies 16 (13), 4841. doi:10.3390/en16134841
Antunes, F. A. F., Thomé, L. C., Santos, J. C., Ingle, A. P., Costa, C. B., Anjos, V. D., et al. (2021). Multi-scale study of the integrated use of the carbohydrate fractions of sugarcane bagasse for ethanol and xylitol production. Renew. Energy 163, 1343–1355. doi:10.1016/j.renene.2020.08.020
Aoac, (2019). Official methods of analysis of AOAC international. Washington, DC: AOAC International.
Arrizon, J., Mateos-Díaz, J., Sandoval, G., Aguilar Uscanga, B., Solis, J., and Aguilar-Uscanga, M. (2012). Bioethanol and xylitol production from different lignocellulosic hydrolysates by sequential fermentation. J. Food Process Eng. 35 (3), 437–454. doi:10.1111/j.1745-4530.2010.00599.x
Assabjeu, A. C., Noubissié, E., Desobgo, S. C. Z., and Ali, A. (2020). Optimization of the enzymatic hydrolysis of cellulose of Triplochiton scleroxylon sawdust in view of the production of bioethanol. Sci. Afr. 8, e00438. doi:10.1016/j.sciaf.2020.e00438
Baptista, S. L., Cunha, J. T., Romaní, A., and Domingues, L. (2018). Xylitol production from lignocellulosic whole slurry corn cob by engineered industrial Saccharomyces cerevisiae PE-2. Bioresour. Technol. 267, 481–491. doi:10.1016/j.biortech.2018.07.068
Baruah, J., Nath, B. K., Sharma, R., Kumar, S., Deka, R. C., Baruah, D. C., et al. (2018). Recent trends in the pretreatment of lignocellulosic biomass for value-added products. Front. Energy Res. 6, 141. doi:10.3389/fenrg.2018.00141
Bhatia, S. K., Jagtap, S. S., Bedekar, A. A., Bhatia, R. K., Patel, A. K., Pant, D., et al. (2020). Recent developments in pretreatment technologies on lignocellulosic biomass: effect of key parameters, technological improvements, and challenges. Bioresour. Technol. 300, 122724. doi:10.1016/j.biortech.2019.122724
Bradford, M. M. (1976). A rapid and sensitive method for the quantitation of microgram quantities of protein utilizing the principle of protein-dye binding. Anal. Biochem. 72, 248–254. doi:10.1016/0003-2697(76)90527-3
Bukhari, N. A., Loh, S. K., Luthfi, A. A. I., Abdul, P. M., and Jahim, J. M. (2022). Low cost nutrient-rich oil palm trunk bagasse hydrolysate for bio-succinic acid production by Actinobacillus succinogenes. Prep. Biochem. Biotechnol. 52 (8), 950–960. doi:10.1080/10826068.2021.2015692
Chaiyaso, T., Kuntiya, A., Techapun, C., Leksawasdi, N., Seesuriyachan, P., and Hanmoungjai, P. (2011). Optimization of cellulase-free xylanase production by thermophilic Streptomyces thermovulgaris TISTR1948 through Plackett-Burman and response surface methodological approaches. Biosci. Biotechnol. Biochem. 75 (3), 531–537. doi:10.1271/bbb.100756
Chang, Y.-H., Chang, K.-S., Chen, C.-Y., Hsu, C.-L., Chang, T.-C., and Jang, H.-D. (2018). Efficiency of bioethanol production by Saccharomyces cerevisiae via gradually batch-wise and fed-batch increasing the glucose concentration. Fermentation 4, 45. doi:10.3390/fermentation4020045
Chavan, R., Saxena, K., Kumar, M., and Gangawane, S. (2015). Optimization of initial pH and initial glucose concentration for maximum ethanol to different fermentation kinetic parameters by using S. cerevisae and chemically defined medium. Int. J. Recent Sci. Res. 2 (2), 15–21.
Chen, H., Liu, J., Chang, X., Chen, D., Xue, Y., Liu, P., et al. (2017). A review on the pretreatment of lignocellulose for high-value chemicals. Fuel Process. Technol. 160, 196–206. doi:10.1016/j.fuproc.2016.12.007
Cheng, K., Wu, J., Lin, Z., and Zhang, J. (2014). Aerobic and sequential anaerobic fermentation to produce xylitol and ethanol using non-detoxified acid pretreated corncob. Biotechnol. Biofuels. 7, 166. doi:10.1186/s13068-014-0166-y
Cheng, K.-K., Ling, H.-Z., Zhang, J.-A., Ping, W.-X., Huang, W., Ge, J.-P., et al. (2010). Strain isolation and study on process parameters for xylose-to-xylitol bioconversion. Biotechnol. Biotechnol. Equip. 24, 1606–1611. doi:10.2478/V10133-010-0013-7
Cunha, J. T., Soares, P. O., Romaní, A., Thevelein, J. M., and Domingues, L. (2019). Xylose fermentation efficiency of industrial Saccharomyces cerevisiae yeast with separate or combined xylose reductase/xylitol dehydrogenase and xylose isomerase pathways. Biotechnol. Biofuels 12, 20. doi:10.1186/s13068-019-1360-8
da Silva, D. D. V., de Arruda, P. V., Vicente, F. M. C. F., Sene, L., da Silva, S. S., and de Almeida Felipe, M. d. G. (2015). Evaluation of fermentative potential of Kluyveromyces marxianus ATCC 36907 in cellulosic and hemicellulosic sugarcane bagasse hydrolysates on xylitol and ethanol production. Ann. Microbiol. 65, 687–694. doi:10.1007/s13213-014-0907-y
Davies, S. M., Linforth, R. S., Wilkinson, S. J., Smart, K. A., and Cook, D. J. (2011). Rapid analysis of formic acid, acetic acid, and furfural in pretreated wheat straw hydrolysates and ethanol in a bioethanol fermentation using atmospheric pressure chemical ionisation mass spectrometry. Biotechnol. Biofuels. 4, 28. doi:10.1186/1754-6834-4-28
Dávila, J. A., Rosenberg, M., and Cardona, C. A. (2016). A biorefinery approach for the production of xylitol, ethanol and polyhydroxybutyrate from brewer’s spent grain. AIMS Agric. Food. 1 (1), 52–66. doi:10.3934/agrfood.2016.1.52
de Jong, E., and Gosselink, R. J. A. (2014). “Lignocellulose-based chemical products,” in Bioenergy research: advances and applications. Editors V. K. Gupta, M. G. Tuohy, C. P. Kubicek, J. Saddler, and F. Xu (New York: Elsevier), 277–313.
del Río, J. C., Lino, A. G., Colodette, J. L., Lima, C. F., Gutiérrez, A., Martínez, Á. T., et al. (2015). Differences in the chemical structure of the lignins from sugarcane bagasse and straw. Biomass Bioenergy 81, 322–338. doi:10.1016/j.biombioe.2015.07.006
Dhanani, T., Shah, S., and Kumar, S. (2014). A validated High-performance liquid chromatography method for determination of tannin-related marker constituents gallic acid, corilagin, chebulagic acid, ellagic acid and chebulinic acid in four Terminalia species from India. J. Chromatogr. Sci. 53 (4), 625–632. doi:10.1093/chromsci/bmu096
Du, C., Li, Y., Zong, H., Yuan, T., Yuan, W., and Jiang, Y. (2020). Production of bioethanol and xylitol from non-detoxified corn cob via a two-stage fermentation strategy. Bioresour. Technol. 310, 123427. doi:10.1016/j.biortech.2020.123427
Galbe, M., and Wallberg, O. (2019). Pretreatment for biorefineries: a review of common methods for efficient utilisation of lignocellulosic materials. Biotechnol. Biofuels. 12, 294. doi:10.1186/s13068-019-1634-1
Ghose, T. K. (1987). Measurement of cellulase activities. Pure Appl. Chem. 59 (2), 257–268. doi:10.1351/pac198759020257
Gunawan, C., Breuer, M., Hauer, B., Rogers, P., and Rosche, B. (2008). Improved (R)-phenylacetylcarbinol production with Candida utilis pyruvate decarboxylase at decreased organic to aqueous phase volume ratios. Biotechnol. Lett. 30 (2), 281–286. doi:10.1007/s10529-007-9525-0
Hor, S., Kongkeitkajorn, M. B., and Reungsang, A. (2023). Evaluation of xylose-utilising yeasts for xylitol production from second-generation ethanol vinasse and effect of agitation intensity in flask-scale xylitol production. Sains Malays 52 (1), 175–185. doi:10.17576/jsm-2023-5201-14
Ikeuchi, T., Azuma, M., Kato, J., and Ooshima, H. (1999). Screening of microorganisms for xylitol production and fermentation behavior in high concentrations of xylose. Biomass Bioenergy 16, 333–339. doi:10.1016/S0961-9534(99)00005-7
IndiaMart (2023a). Solid L phenylacetylcarbinol. Available at: https://www.indiamart.com/(Accessed September 21, 2023).
IndiaMart (2023b). Xylitol. Available at: https://www.indiamart.com/(Accessed September 21, 2023).
Ishwaryaa, S. P., and Nisha, P. (2021). Foaming agents from spent coffee grounds: a mechanistic understanding of the modes of foaming and the role of coffee oil as antifoam. Food Hydrocoll. 112, 106354. doi:10.1016/j.foodhyd.2020.106354
Kaur, S., Guleria, P., and Yadav, S. K. (2023). Evaluation of fermentative xylitol production potential of adapted strains of Meyerozyma caribbica and Candida tropicalis from rice straw hemicellulosic hydrolysate. Fermentation 9, 181. doi:10.3390/fermentation9020181
Khattab, S. M. R., and Watanabe, T. (2019). “Bioethanol from sugarcane bagasse: status and perspectives,” in Bioethanol production from food crops. Editors R. C. Ray, and S. Ramachandran (Cambridge: Academic Press), 187–212.
Khemacheewakul, J., Taesuwan, S., Nunta, R., Techapun, C., Phimolsiripol, Y., Rachtanapun, P., et al. (2021). Validation of mathematical model with phosphate activation effect by batch (R)-phenylacetylcarbinol biotransformation process utilizing Candida tropicalis pyruvate decarboxylase in phosphate buffer. Sci. Rep. 11, 11813. doi:10.1038/s41598-021-91294-0
Khemacheewakul, J., Techapun, C., Kuntiya, A., Sanguanchaipaiwong, V., Chaiyaso, T., Hanmoungjai, P., et al. (2018). Development of mathematical model for pyruvate decarboxylase deactivation kinetics by benzaldehyde with inorganic phosphate activation effect. Chiang Mai J. Sci. 45 (3), 1426–1438. doi:10.1038/s41598-021-91294-0
Kim, S. (2019). Xylitol production from byproducts generated during sequential acid-/alkali-pretreatment of empty palm fruit bunch fiber by an adapted Candida tropicalis. Front. Energy Res. 7, 72. doi:10.3389/fenrg.2019.00072
King, F. G., and Hossain, M. A. (1982). The effect of temperature, pH, and initial glucose concentration on the kinetics of ethanol production by Zymomonas mobilis in batch fermentation. Biotechnol. Lett. 4, 531–536. doi:10.1007/BF00131577
Kobkam, C., Tinoi, J., and Kittiwachana, S. (2018). Alkali pretreatment and enzyme hydrolysis to enhance the digestibility of rice straw cellulose for microbial oil production. KMUTNB Int. J. Appl. Sci. Technol. 11 (4), 247–256. doi:10.14416/j.ijast.2018.07.003
Koti, S., Govumoni, S. P., Gentela, J., and Venkateswar Rao, L. (2016). Enhanced bioethanol production from wheat straw hemicellulose by mutant strains of pentose fermenting organisms Pichia stipitis and Candida shehatae. Springerplus 5 (1), 1545. doi:10.1186/s40064-016-3222-1
Kumar, A., Anushree, J. K., and Bhaskar, T. (2020). Utilization of lignin: a sustainable and eco-friendly approach. J. Energy Inst. 93 (1), 235–271. doi:10.1016/j.joei.2019.03.005
Kumar, A., Techapun, C., Sommanee, S., Mahakuntha, C., Feng, J., Htike, S. L., et al. (2023). Production of phenylacetylcarbinol via biotransformation using the co-culture of Candida tropicalis TISTR 5306 and Saccharomyces cerevisiae TISTR 5606 as the biocatalyst. J. Fungi 9 (9), 928. doi:10.3390/jof9090928
Kumar, V., Krishania, M., Sandhu, P. P., Ahluwalia, V., Gnansounou, E., and Sangwan, R. S. (2018). Efficient detoxification of corn cob hydrolysate with ion-exchange resins for enhanced xylitol production by Candida tropicalis MTCC 6192. Bioresour. Technol. 251, 416–419. doi:10.1016/j.biortech.2017.11.039
Laranjeira, M. C. M., Pilissão, C., and Martini, M. (2013). Method for producing bioethanol from banana pseudostem by enzymatic hydrolysis. Rio de Janeiro: WIPO Brazil Office. Brazil Patent No WO 2013/131162 A1.
Lee, C., Zheng, Y., and VanderGheynst, J. S. (2015). Effects of pretreatment conditions and post-pretreatment washing on ethanol production from dilute acid pretreated rice straw. Biosys. Eng. 137, 36–42. doi:10.1016/j.biosystemseng.2015.07.001
Leksawasdi, N., Breuer, M., Hauer, B., Rosche, B., and Rogers, P. L. (2003). Kinetics of pyruvate decarboxylase deactivation by benzaldehyde. Biocatal. Biotransformation 21 (6), 315–320. doi:10.1080/10242420310001630164
Leksawasdi, N., Chow, Y. Y. S., Breuer, M., Hauer, B., Rosche, B., and Rogers, P. L. (2004). Kinetic analysis and modelling of enzymatic (R)-phenylacetylcarbinol batch biotransformation process. J. Biotechnol. 111, 179–189. doi:10.1016/j.jbiotec.2004.04.001
Leksawasdi, N., Porninta, K., Khemacheewakul, J., Techapun, C., Phimolsiripol, Y., Nunta, R., et al. (2021). “Longan syrup and related products: processing technology and new product developments,” in Asian berries: health benefits. Editors G. Xiao, Y. Xu, and Y. Yu (London: CRC Press), 123–148.
Leksawasdi, N., Rogers, P. L., and Rosche, B. (2005). Improved enzymatic two-phase biotransformation for (R)-phenylacetylcarbinol: effect of dipropylene glycol and modes of pH control. Biocatal. Biotransformation 23 (6), 445–451. doi:10.1080/10242420500444135
Li, J., Liu, D., Zhang, M., Huang, H., and Wang, D. (2019a). Enzymatic hydrolysis and fermentation of corn stover liquor from magnesium oxide pretreatment without detoxification. Ind. Crops Prod. 140, 111728. doi:10.1016/j.indcrop.2019.111728
Li, Y., Zhai, R., Jiang, X., Chen, X., Yuan, X., Liu, Z., et al. (2019b). Boosting ethanol productivity of Zymomonas mobilis 8b in enzymatic hydrolysate of dilute acid and ammonia pretreated corn stover through medium optimization, high cell density fermentation and cell recycling. Front. Microbiol. 10, 2316. doi:10.3389/fmicb.2019.02316
Liu, X., and Kokare, C. (2017). “Microbial enzymes of use in industry,” in Biotechnology of microbial enzymes. Editor G. Brahmachari (Cambridge: Academic Press), 267–298.
Lomovsky, O. I., Korolev, K. G., Politov, A. A., Bershak, O. V., and Lomovskaya, T. F. (2009). Method of producing bioethanol from lignocellulose. Moscow: WIPO Office in the Russian Federation. Russia Patent No WO 2009/005390 A1.
Lu, Y., Lu, Y.-C., Hu, H.-Q., Xie, F.-J., Wei, X.-Y., and Fan, X. (2017). Structural characterization of lignin and its degradation products with spectroscopic methods. J. Spectrosc. 2017, 1–15. doi:10.1155/2017/8951658
Mahakuntha, C., Reungsang, A., Nunta, R., and Leksawasdi, N. (2021). Kinetics of whole cells and ethanol production from Candida tropicalis TISTR 5306 cultivation in batch and fed-batch modes using assorted grade fresh longan juice. An. Acad. Bras. Cienc. 93, e20200220. doi:10.1590/0001-3765202120200220
Manorach, K., Poonsrisawat, A., Viriya-empikul, N., and Laosiripojana, N. (2015). Optimization of sub-critical water pretreatment for enzymatic hydrolysis of sugarcane bagasse. Energy Procedia 79, 937–942. doi:10.1016/j.egypro.2015.11.590
Mareczky, Z., Anikó, F., Anikó, F., Fehér, C., and Réczey, K. (2016). Effects of pH and aeration conditionson xylitol production by Candida and Hansenula yeasts. Period. Polytech. Chem. Eng. 60 (1), 54–59. doi:10.3311/PPch.8116
Maupin, K. A., Swiler, L. P., and Porter, N. W. (2017). Validation metrics for deterministic and probabilistic data. J. Verif. Valid. Uncert. 3 (3), 031002. doi:10.1115/1.4042443
Meyrial, V., Delgenes, J. P., Moletta, R., and Navarro, J. M. (1991). Xylitol production from D-xylose by Candida guillermondii: fermentation behaviour. Biotechnol. Lett. 13, 281–286. doi:10.1007/BF01041485
Moonsamy, T. A., Mandegari, M., Farzad, S., and Görgens, J. F. (2022). A new insight into integrated first and second-generation bioethanol production from sugarcane. Ind. Crops Prod. 188, 115675. doi:10.1016/j.indcrop.2022.115675
Nguyen, Q. A., Keller, F. A., and Tucker, M. P. (2003). Ethanol production with dilute acid hydrolysis using partially dried lignocellulosics. Washington, DC: U.S. Patent and Trademark Office. U.S. Patent No US 6,660,506 B2.
Nunta, R., Techapun, C., Jantanasakulwong, K., Chaiyaso, T., Seesuriyachan, P., Khemacheewakul, J., et al. (2019). Batch and continuous cultivation processes of Candida tropicalis TISTR 5306 for ethanol and pyruvate decarboxylase production in fresh longan juice with optimal carbon to nitrogen molar ratio. J. Food Process Eng. 42 (2). doi:10.1111/jfpe.13227
Nunta, R., Techapun, C., Kuntiya, A., Hanmuangjai, P., Moukamnerd, C., Khemacheewakul, J., et al. (2018). Ethanol and phenylacetylcarbinol production processes of Candida tropicalis TISTR 5306 and Saccharomyces cerevisiae TISTR 5606 in fresh juices from longan fruit of various sizes. J. Food Process. Preserv. 42 (6), e13815. doi:10.1111/jfpp.13815
Nunta, R., Techapun, C., Sommanee, S., Mahakuntha, C., Porninta, K., Punyodom, W., et al. (2023). Valorization of rice straw, sugarcane bagasse and sweet sorghum bagasse for the production of bioethanol and phenylacetylcarbinol. Sci. Rep. 13, 727. doi:10.1038/s41598-023-27451-4
Nurhayati, N., Cheng, C.-L., and Chang, J.-S. (2014). Development of high-productivity continuous ethanol production using PVA-Immobilized Zymomonas mobilis in an immobilized-cells fermenter. J. Rekayasa Kim. Lingkung. 10 (2), 70–77. doi:10.23955/rkl.v10i2.2422
Office of Agricultural Economics (OAE) (2023). Agricultural statistics of Thailand 2022. Available at: http://www.oae.go.th/(Accessed September 20, 2023).
Ohra-aho, T., Rohrbach, L., Winkelman, J. G. M., Heeres, H. J., Mikkelson, A., Oasmaa, A., et al. (2021). Evaluation of analysis methods for formaldehyde, acetaldehyde, and furfural from fast pyrolysis bio-oil. Energy fuels. 35 (22), 18583–18591. doi:10.1021/acs.energyfuels.1c02208
Okamoto, K., Uchii, A., Kanawaku, R., and Yanase, H. (2014). Bioconversion of xylose, hexoses and biomass to ethanol by a new isolate of the white rot basidiomycete Trametes versicolor. Springerplus 3, 121. doi:10.1186/2193-1801-3-121
Pereira, V., Caˆmara, J. S., Cacho, J., and Marques, J. C. (2010). HPLC-DAD methodology for the quantification of organic acids, furans and polyphenols by direct injection of wine samples. J. Sep. Sci. 33, 1204–1215. doi:10.1002/jssc.200900784
Pfeiffer, T., and Morley, A. (2014). An evolutionary perspective on the Crabtree effect. Front. Mol. Biosci. 1, 17. doi:10.3389/fmolb.2014.00017
Phummala, K., Imai, T., Reungsang, A., Higuchi, T., Sekine, M., Yamamoto, K., et al. (2015). Optimization of enzymatic hydrolysis for pretreated wood waste by response surface methodology in fermentative hydrogen production. J. Water Environ. Technol. 13 (2), 153–166. doi:10.2965/jwet.2015.153
Qi, B., Chen, X., Shen, F., Su, Y., and Wan, Y. (2009). Optimization of enzymatic hydrolysis of wheat straw pretreated by alkaline peroxide using response surface methodology. Ind. Eng. Chem. Res. 48 (15), 7346–7353. doi:10.1021/ie8016863
Rabemanolontsoa, H., and Saka, S. (2013). Comparative study on chemical composition of various biomass species. RSC Adv. 3 (12), 3946–3956. doi:10.1039/C3RA22958K
Raj, K., and Krishnan, C. (2020). Improved co-production of ethanol and xylitol from low-temperature aqueous ammonia pretreated sugarcane bagasse using two-stage high solids enzymatic hydrolysis and Candida tropicalis. Renew. Energy 153, 392–403. doi:10.1016/j.renene.2020.02.042
Ramaiah, S. K., Thimappa, G. S., Nataraj, L. K., and Dasgupta, P. (2020). Optimization of oxalic acid pre-treatment and enzymatic saccharification in Typha latifolia for production of reducing sugar. J. Genet. Eng. Biotechnol. 18 (1), 28. doi:10.1186/s43141-020-00042-w
Refaat, A. A. (2012). “Biofuels from waste materials,” in Comprehensive renewable energy. Editors A. Sayigh, W. G. J. H. M. v. Sark, J. K. Kaldellis, S. A. Kalogirou, A. J. Cruden, D. J. Roddyet al. (New York: Elsevier), 217–261.
Ren, J., Tao, L., and Ni, T. R. (2015). Effects of liquid-to-solid ratio and reaction time on dilute sulfuric acid pretreatment of Achnatherum splendens. Asian J. Chem. 27 (6), 2133–2136. doi:10.14233/ajchem.2015.17803
Ritchie, H., Rosado, P., and Roser, M. (2023). Agricultural production. Available at: https://ourworldindata.org/agricultural-production (Accessed September 21, 2023).
Rongjie, L., Peijian, X., Jialin, S., Yuande, D., Hui, Z., Xiaoling, M., et al. (2006). Method for producing ethanol from crop straw. Beijing: China National Intellectual Property Administration (CNIPA) Trademark Office. China Patent No CN 101186943 A.
Rosche, B., Leksawasdi, N., Sandford, V., Breuer, M., Hauer, B., and Rogers, P. (2002). Enzymatic (R)-phenylacetylcarbinol production in benzaldehyde emulsions. Appl. Microbiol. Biotechnol. 60, 94–100. doi:10.1007/s00253-002-1084-7
Saha, B., and Kennedy, G. J. (2020). Optimization of xylitol production from xylose by a novel arabitol limited co-producing Barnettozyma populi NRRL Y-12728. Prep. Biochem. Biotechnol. 51 (8), 761–768. doi:10.1080/10826068.2020.1855443
Sajid, M., Dilshad, M. R., Rehman, M. S. U., Liu, D., and Zhao, X. (2021). Catalytic conversion of xylose to furfural by p-toluenesulfonic acid (pTSA) and chlorides: process optimization and kinetic modeling. Molecules 26 (8), 2208. doi:10.3390/molecules26082208
Sandford, V., Breuer, M., Hauer, B., Rogers, P., and Rosche, B. (2005). (R)-phenylacetylcarbinol production in aqueous/organic two-phase systems using partially purified pyruvate decarboxylase from Candida utilis. Biotechnol. Bioeng. 92 (2), 190–198. doi:10.1002/bit.20513
Sirisansaneeyakul, S., Staniszewski, M., and Rizziz, M. (1995). Screening of yeasts for production of xylitol from d-xylose. J. Ferment. Bioeng. 80 (6), 565–570. doi:10.1016/0922-338X(96)87732-4
Skiba, E. A., Budaeva, V. V., Baibakova, O. V., Zolotukhin, V. N., and Sakovich, G. V. (2017). Dilute nitric-acid pretreatment of oat hulls for ethanol production. Biochem. Eng. J. 126, 118–125. doi:10.1016/j.bej.2016.09.003
Smith, R. A., Lu, F., Muro-Villanueva, F., Cusumano, J. C., Chapple, C., and Ralph, J. (2022). Manipulation of lignin monomer composition combined with the introduction of monolignol conjugate biosynthesis leads to synergistic changes in lignin structure. Plant Cell Physiol. 63 (6), 744–754. doi:10.1093/pcp/pcac031
Stoklosa, R. J., Nghiem, N. P., and Latona, R. J. (2019). Xylose-enriched ethanol fermentation stillage from sweet sorghum for xylitol and astaxanthin production. Fermentation 5 (4), 84. doi:10.3390/fermentation5040084
Sullivan, D. M., and Carpenter, D. E. (1993). Methods of analysis for nutrition labeling. Arlington: AOAC International.
Sumphanwanich, J., Leepipatpiboon, N., Srinorakutara, T., and Akaracharanya, A. (2008). Evaluation of dilute-acid pretreated bagasse, corn cob and rice straw for ethanol fermentation by Saccharomyces cerevisiae. Ann. Microbiol. 58, 219–225. doi:10.1007/BF03175320
Takada, M., Rabemanolontsoa, H., Minami, E., and Saka, S. (2018). Characterization of lignin-derived products from various lignocellulosics as treated by semi-flow hot-compressed water. J. Wood Sci. 64, 802–809. doi:10.1007/s10086-018-1752-6
Tamburini, E., Costa, S., Marchetti, M. G., and Pedrini, P. (2013). Optimized production of xylitol from xylose using a hyper-acidophilic Candida tropicalis. Biomolecules 5 (3), 1979–1989. doi:10.3390/biom5031979
Tan, N. T. L., Dam, Q. P., Mai, T. P., and Nguyen, D. Q. (2021). The combination of acidic and alkaline pretreatment for a lignocellulose material in simultaneous saccharification and fermentation (SSF) process. Chem. Eng. Trans. 89, 43–48. doi:10.3303/CET2189008
Tangri, A., and Singh, R. (2017). Xylitol: production and applications. Int. J. Sci. Eng. Res. 5 (9), 17–50.
Tangtua, J., Techapun, C., Pratanaphon, R., Kuntiya, A., Chaiyaso, T., Hanmoungjai, P., et al. (2013). Screening of 50 microbial strains for production of ethanol and (R)-phenylacetylcarbinol. Chiang Mai J. Sci. 40 (2), 299–304.
United States Department of Agriculture (USDA) (2023). World agricultural production. Available at: https://apps.fas.usda.gov/psdonline/circulars/production.pdf (Accessed September 21, 2023).
Unrean, P., and Ketsub, N. (2018). Integrated lignocellulosic bioprocess for co-production of ethanol and xylitol from sugarcane bagasse. Ind. Crops Prod. 123, 238–246. doi:10.1016/j.indcrop.2018.06.071
Van Soest, P. J., Robertson, J. B., and Lewis, B. A. (1991). Methods for dietary fiber, neutral detergent fiber, and nonstarch polysaccharides in relation to animal nutrition. J. Dairy Sci. 74 (10), 3583–3597. doi:10.3168/jds.S0022-0302(91)78551-2
Vermaas, J. V., Petridis, L., Qi, X., Schulz, R., Lindner, B., and Smith, J. C. (2015). Mechanism of lignin inhibition of enzymatic biomass deconstruction. Biotechnol. Biofuels. 8, 217. doi:10.1186/s13068-015-0379-8
Wang, J., Ren, K., Zhu, Y., Huang, J., and Liu, S. (2022). Advanced fermentation techniques for lactic acid production from agricultural waste. Fermentation 9 (8), 765. doi:10.3390/fermentation9080765
Wang, Q., Qi, W., Wang, W., Zhang, Y., Leksawasdi, N., Zhuang, X., et al. (2019a). Production of furfural with high yields from corncob under extremely low water/solid ratios. Renew. Energy 144, 139–146. doi:10.1016/j.renene.2018.07.095
Wang, Q., Wang, W., Tan, X., Zahoor, X. C., Guo, Y., Yu, Q., et al. (2019b). Low-temperature sodium hydroxide pretreatment for ethanol production from sugarcane bagasse without washing process. Bioresour. Technol. 291, 121844. doi:10.1016/j.biortech.2019.121844
Wang, S., Cheng, G., Joshua, C., He, Z., Sun, X., Li, R., et al. (2016). Furfural tolerance and detoxification mechanism in Candida tropicalis. Biotechnol. Biofuels. 9, 250. doi:10.1186/s13068-016-0668-x
Wang, Y., Chen, M., Yang, Y., Ralph, J., and Pan, X. (2023). Efficient O-demethylation of lignin-derived aromatic compounds under moderate conditions. RSC Adv. 13, 5925–5932. doi:10.1039/d3ra00245d
Wannawilai, S., and Sirisansaneeyakul, S. (2015). Economical production of xylitol from Candida magnoliae TISTR 5663 using sugarcane bagasse hydrolysate. Agr. Nat. Resour. 49 (4), 583–596.
Wattanapanom, S., Muenseema, J., Techapun, C., Jantanasakulwong, K., Sanguanchaipaiwong, V., Chaiyaso, T., et al. (2019). Kinetic parameters of Candida tropicalis TISTR 5306 for ethanol production process using an optimal enzymatic digestion strategy of assorted grade longan solid waste powder. Chiang Mai J. Sci. 46 (6), 1036–1054.
Zhao, N., Bai, Y., Liu, C.-G., Zhao, X.-Q., Xu, J.-F., and Bai, F.-W. (2013). Flocculating Zymomonas mobilis is a promising host to be engineered for fuel ethanol production from lignocellulosic biomass. Biotechnol. J. 9, 362–371. doi:10.1002/biot.201300367
Keywords: sustainability, ethanol, xylitol, phenylacetylcarbinol, optimization, response surface methodology
Citation: Porninta K, Khemacheewakul J, Techapun C, Phimolsiripol Y, Jantanasakulwong K, Sommanee S, Mahakuntha C, Feng J, Htike SL, Moukamnerd C, Zhuang X, Wang W, Qi W, Li F-L, Liu T, Kumar A, Nunta R and Leksawasdi N (2024) Pretreatment and enzymatic hydrolysis optimization of lignocellulosic biomass for ethanol, xylitol, and phenylacetylcarbinol co-production using Candida magnoliae. Front. Bioeng. Biotechnol. 11:1332185. doi: 10.3389/fbioe.2023.1332185
Received: 02 November 2023; Accepted: 18 December 2023;
Published: 18 January 2024.
Edited by:
Abdul-Sattar Nizami, Government College University, Lahore, PakistanReviewed by:
Narisetty Vivek, Cranfield School of Engineering, United KingdomCopyright © 2024 Porninta, Khemacheewakul, Techapun, Phimolsiripol, Jantanasakulwong, Sommanee, Mahakuntha, Feng, Htike, Moukamnerd, Zhuang, Wang, Qi, Li, Liu, Kumar, Nunta and Leksawasdi. This is an open-access article distributed under the terms of the Creative Commons Attribution License (CC BY). The use, distribution or reproduction in other forums is permitted, provided the original author(s) and the copyright owner(s) are credited and that the original publication in this journal is cited, in accordance with accepted academic practice. No use, distribution or reproduction is permitted which does not comply with these terms.
*Correspondence: Noppol Leksawasdi, bm9wcG9sLmxAY211LmFjLnRo; Rojarej Nunta, cm9qYXJlai5ybkBnbWFpbC5jb20=
Disclaimer: All claims expressed in this article are solely those of the authors and do not necessarily represent those of their affiliated organizations, or those of the publisher, the editors and the reviewers. Any product that may be evaluated in this article or claim that may be made by its manufacturer is not guaranteed or endorsed by the publisher.
Research integrity at Frontiers
Learn more about the work of our research integrity team to safeguard the quality of each article we publish.