- 1College of Technological Innovation, Zayed University, Abu Dhabi, United Arab Emirates
- 2Internal Medicine Department, Medical Research and Clinical Studies Institute, The National Research Centre, Cairo, Egypt
- 3NMC Royal Hospital, Abu Dhabi, United Arab Emirates
- 4Department of Clinical Sciences, College of Medicine, Gulf Medical University, Ajman, United Arab Emirates
- 5Department of Allergy and Immunology, Universidad Espiritu Santo, Samborondon, Ecuador
- 6Respiralab Research Group, Guayaquil, Ecuador
- 7Centro de Investigación de Salud Pública y Epidemiología Clínica (CISPEC), Universidad UTE, Quito, Ecuador
Background: Leukemia is the 11th most prevalent type of cancer worldwide, with acute myeloid leukemia (AML) being the most frequent malignant blood malignancy in adults. Microscopic blood tests are the most common methods for identifying leukemia subtypes. An automated optical image-processing system using artificial intelligence (AI) has recently been applied to facilitate clinical decision-making.
Aim: To evaluate the performance of all AI-based approaches for the detection and diagnosis of acute myeloid leukemia (AML).
Methods: Medical databases including PubMed, Web of Science, and Scopus were searched until December 2023. We used the “metafor” and “metagen” libraries in R to analyze the different models used in the studies. Accuracy and sensitivity were the primary outcome measures.
Results: Ten studies were included in our review and meta-analysis, conducted between 2016 and 2023. Most deep-learning models have been utilized, including convolutional neural networks (CNNs). The common- and random-effects models had accuracies of 1.0000 [0.9999; 1.0001] and 0.9557 [0.9312, and 0.9802], respectively. The common and random effects models had high sensitivity values of 1.0000 and 0.8581, respectively, indicating that the machine learning models in this study can accurately detect true-positive leukemia cases. Studies have shown substantial variations in accuracy and sensitivity, as shown by the Q values and I2 statistics.
Conclusion: Our systematic review and meta-analysis found an overall high accuracy and sensitivity of AI models in correctly identifying true-positive AML cases. Future research should focus on unifying reporting methods and performance assessment metrics of AI-based diagnostics.
Systematic review registration: https://www.crd.york.ac.uk/prospero/#recordDetails, CRD42024501980.
1 Introduction
Leukemia is a form of blood cancer that has several unique features. It is the 11th most prevalent type of cancer worldwide, accounting for approximately 2.5% and 3.1% of all new cancer incidences and mortality in 2020, respectively (Bray et al., 2018; Sung et al., 2021). Acute leukemia can be classified into two types: myeloid and lymphoid. Acute lymphocytic leukemia (ALL) is the most prevalent leukemia in children, whereas acute myeloid leukemia (AML) is the most common malignant blood malignancy in adults (Okikiolu et al., 2021). Hematologists use numerous laboratory techniques to detect and diagnose leukemia. The diagnostic methods begin with a microscopic morphological inspection of the peripheral blood smear (PBS) and bone marrow (BM) slides, followed by immunophenotyping and cytogenetic analysis to further confirm the diagnosis of leukemia (Hegde et al., 2018; Bain, 2005). Other methods include molecular cytogenetics, long-distance inverse polymerase chain reaction (LDI-PCR), and Array-based Comparative Genomic Hybridization (aCGH). However, owing to the time and cost requirements of these complicated techniques, microscopic blood tests are the most common method for identifying leukemia subtypes (Ahmed et al., 2019).
Traditional blood disorder detection based on visual inspection of blood smears under a microscope is time-consuming, error-prone, and restricted by the hematologist's physical acuity (Amin et al., 2015). Therefore, an automated optical image processing system is necessary to facilitate clinical decision-making. Medical image analysis has gained popularity in the biomedical world owing to its potential to enhance disease detection, diagnosis, and decision-making accuracy (Ben-Suliman and Krzyżak, 2018; Elsayed et al., 2023; Chaurasia et al., 2024; Li et al., 2023). Several medical image-based and machine-learning algorithms have been proposed to identify leukemia, reduce the need for human intervention, and ensure accurate clinical diagnosis (Hegde et al., 2019; Baig et al., 2022; Bibi et al., 2020; Karar et al., 2022).
Artificial Intelligence (AI) is a broad term for devices that imitate human intellect. Machine learning (ML), a subset of AI, refers to teaching computer algorithms to generate predictions based on experience (Hunter et al., 2022). It includes k-nearest neighbors (KNN), support vector machine (SVM), random forest, Extreme Gradient Boosting (XGBoost), and artificial neural network (ANN) (Yue et al., 2022). Deep learning (DL) is a subset of ML in which complex architectures similar to the linked neurons of the human brain are created (Hunter et al., 2022). Deep neural networks (DNNs), autoencoder networks (AEs), generative adversarial networks (GANs), recurrent neural networks (RNNs), and convolutional neural networks (CNNs) are examples of deep learning methodologies (Patterson and Gibson, 2017). CNN is among the most widely used deep learning (DL) networks. The key advantage of CNN over its predecessors is that it automatically recognizes significant traits without human intervention, making them the most widely used (Alzubaidi et al., 2021). CNN-based computerized deep learning algorithms have demonstrated outstanding performance in the detection, segmentation, and classification processes involved in medical imaging (Nasr-Esfahani et al., 2016). These include multiple predefined architectures with varying degrees of complexity, such as AlexNet (Krizhevsky et al., 2017), EfficientNet (Tan and Le, 2019), InceptionNet (Szegedy et al., 2015), ResNet (He et al., 2016), and DenseNet (Huang et al., 2017).
Our systematic review and meta-analysis aimed to analyze and cover all AI-based approaches for the detection and diagnosis of AML. We reviewed multiple recent studies, including DL techniques, intending to identify the overall accuracy and sensitivity of these methods using microscopic PBS images.
2 Methods
This systematic review and meta-analysis was conducted according to The Preferred Reporting Items for Systematic Reviews and Meta-Analyses (PRISMA) statement guidelines and all steps were performed with strict adherence to the Cochrane Handbook of Systematic Reviews and Meta-analysis. It was registered with PROSPERO under registration number CRD42024501980.
2.1 Search strategy
We conducted a thorough search using relevant keywords, such as “acute myeloid leukemia,” “artificial intelligence,” “deep learning,” “machine learning, ” and other related terms. The medical databases searched included PubMed, Web of Science, and Scopus from inception until December 2023. No timeframe or language restrictions were applied.
The detailed search strategy can be found in Supplementary material 1.
2.2 Study selection
Screening was conducted by two independent authors in two steps: Title/Abstract screening, followed by full-text screening. Any conflicts were resolved through consensus or group discussion.
Our inclusion criteria were as follows: (1) utilization of human AML peripheral blood smear samples, (2) employment of AI techniques for diagnosing/classifying AML, (3) reporting of performance metrics, recall (sensitivity), and accuracy, which served as our main outcome measures; and (4) separate metrics were provided for AML diagnosis, not an overall model accuracy.
Studies that did not meet these criteria were excluded to ensure a focused and relevant analysis. The exclusion criteria were as follows: (1) studies that discussed irrelevant topics or diagnostic methods, such as acute promyelocytic leukemia (APL), myelodysplastic syndrome (MDS), flow cytometry, protein detection, or microarray gene algorithms; (2) studies investigating the accuracy of image segmentation into blasts or leukocyte images rather than whole images for disease classification; (3) studies with the outcome of disease prognosis or identifying disease subtypes (M1, M2, etc.); and (4) studies with incomplete data, case reports, review articles, editorials, conference/meeting abstracts, guidelines, and letters.
2.3 Methodological quality assessment
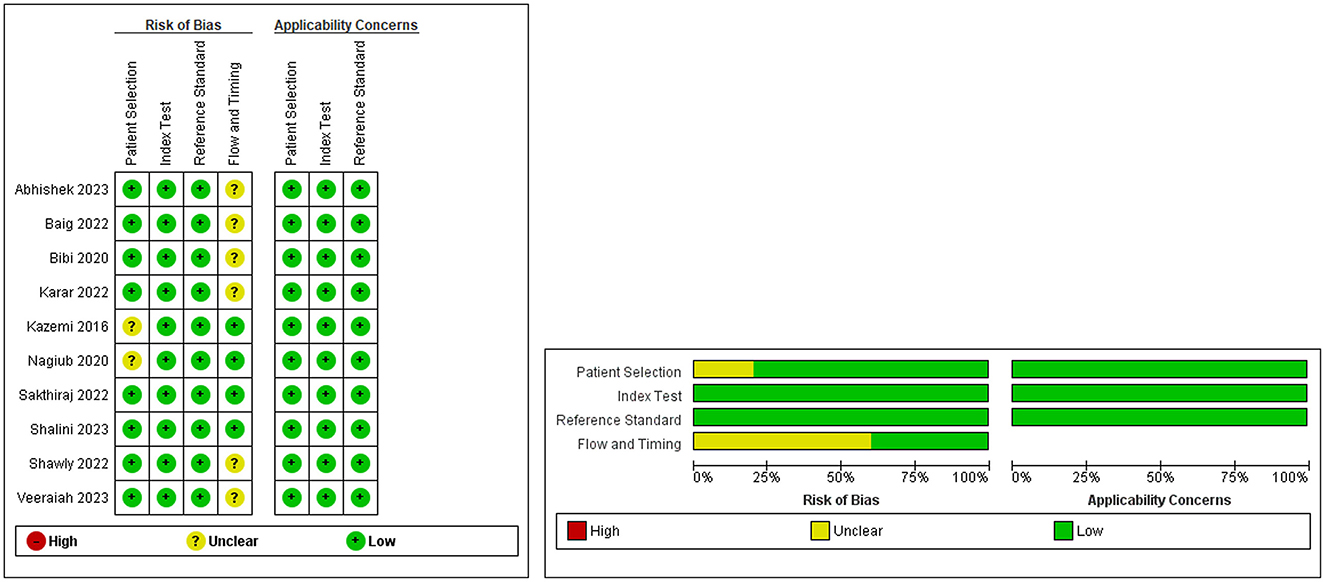
The degree of bias was assessed using Quality Assessment of Diagnostic Studies 2 (QUADAS-2). Comprehensively, we identified four domains: patient selection, index test, reference standard, flow, and timing. The first three domains were assessed for applicability. The risk of bias was judged to be “low,” “high,” or “unclear.” Signaling questions were included to help reach a judgment regarding the risk of bias.
2.4 Data extraction
Data were extracted independently by two authors using Microsoft Excel. Any disagreements were resolved by consensus between the authors. The following data were extracted for each study: number of patients/samples, total number of images used in the validation sets after augmentation, classification task (binary or multiclass), databases used with their reference standards, use of classifiers, application of transfer learning, and type of validation used.
In addition, the name of each author, publication year, country where the study was conducted, type of study (prospective or retrospective), and the design and algorithm architecture names of AI systems were also retrieved.
3 Strategy for data synthesis and statistical analysis
For the meta-analysis, we used the “metafor” and “metagen” libraries in R to analyze the accuracy of the different models used in the studies. The dataset for this analysis consisted of 24 models across 10 studies, each employing a variety of classifiers including CNNs and SVMs. We used both common- and random-effects models for data analysis and forest plots to improve data visualization. The random-effects model allowed for the testing of variability in effect sizes between the studies. The Z-value was used to determine the statistical significance of the findings along with the p-value. A larger z-value (in absolute terms) corresponds to a smaller p-value, indicating that the observed effect is less likely to occur by chance. The threshold for statistical significance was set at P < 0.05.
To assess heterogeneity, the I2 statistic was calculated to quantify the percentage of total variation across studies; values above 60% indicated high heterogeneity. The H2 statistic, an estimate of the ratio of total variability to sampling variability, was additionally quantified alongside the “Q-value” which measures the degree of variability in the results of different studies where a high H∧2 value (>1.5) and large Q-value with a low p-value (p < 0.05) suggests the presence of significant heterogeneity. The Restricted Maximum Likelihood (REML) method was used to further evaluate the estimated amount of total heterogeneity (tau∧2). The standard error (SE) and the square root of Tau∧2 (tau) were used to quantify the uncertainty or variability in the estimate of the heterogeneity, where a smaller SE and tau indicate more precise estimates. Heterogeneity was considered statistically significant when the two-tailed p-value was < 0.05.
To evaluate the performance of the AI models, we conducted a meta-analysis of studies that provided sufficient information on accuracy and sensitivity. If a study provided several tables or values for the different algorithms used, each model was treated as an independent variable.
Funnel plots were generated and visually inspected to check for publication bias.
4 Results
4.1 Study selection
A total of 2,565 records were recovered, 655 of which were removed as duplicates. Following title and abstract screening, only 75 articles were deemed acceptable for full-text screening. Finally, 10 studies were eligible and included in our systematic review and meta-analysis. A detailed PRISMA diagram illustrating the study selection steps and the full PRISMA checklist are presented in Figure 1 and Supplementary material 2, respectively.
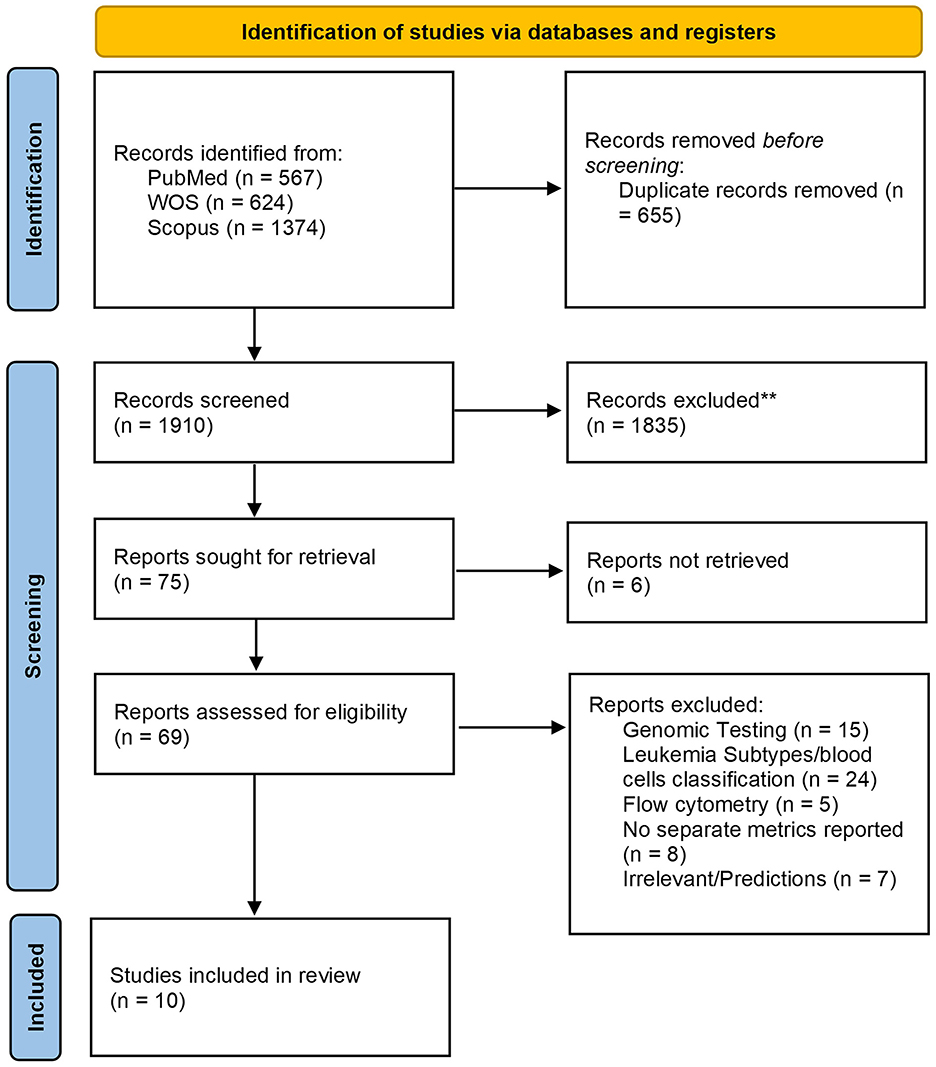
Figure 1. The Preferred reporting items for systematic reviews and meta-analyses (PRISMA) 2020 flow chart depicting the screening process for included studies.
4.2 Baseline characteristics of included studies
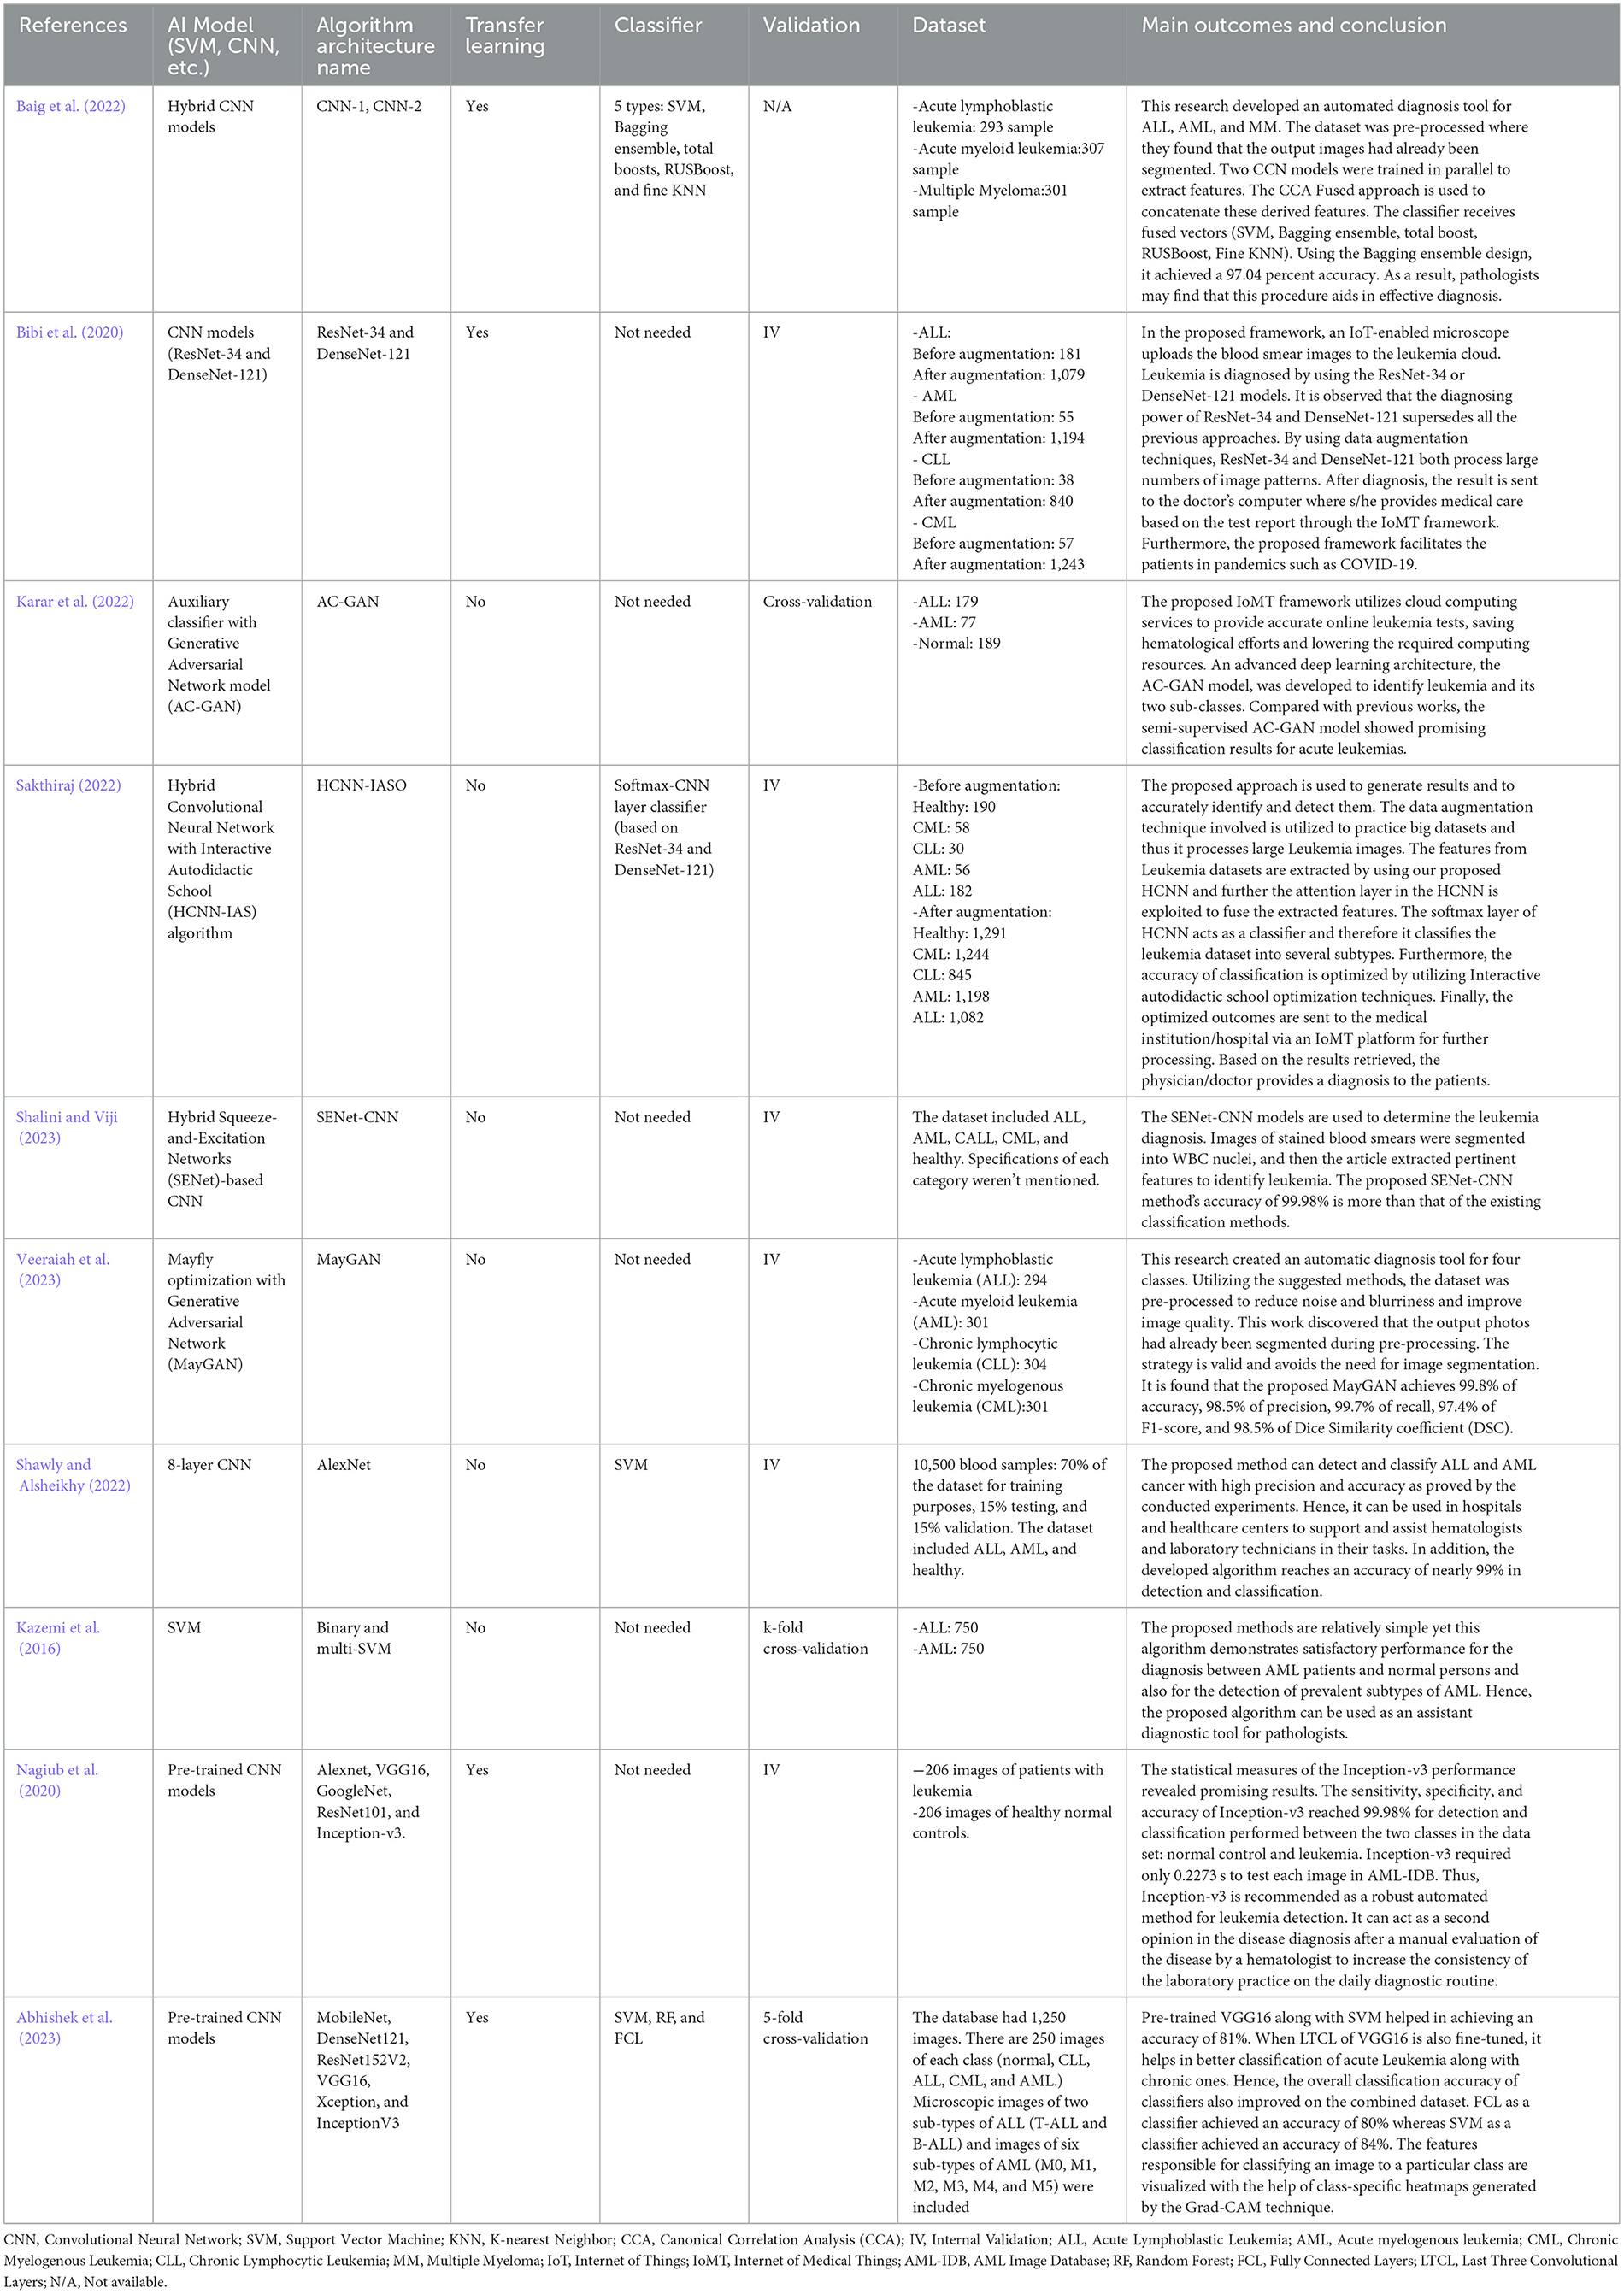
We evaluated 10 studies (Baig et al., 2022; Bibi et al., 2020; Karar et al., 2022; Sakthiraj, 2022; Shalini and Viji, 2023; Veeraiah et al., 2023; Shawly and Alsheikhy, 2022; Kazemi et al., 2016; Nagiub et al., 2020; Abhishek et al., 2023) On AML detection that were performed between 2016 and 2023. These studies have been conducted in various countries including Pakistan, Saudi Arabia, the United States, India, Iran, and Egypt. They employed both binary and multiclass classification tasks to distinguish between different types of leukemia and healthy samples. Two of these studies (Kazemi et al., 2016; Nagiub et al., 2020) used a heterogeneous image set, including both PBS and bone marrow data; however, they met all the necessary inclusion criteria to participate in our analysis.
Regarding the type of AI algorithm used, most studies have depended on DL algorithms. Specifically, CNNs were used in seven studies (Baig et al., 2022; Bibi et al., 2020; Sakthiraj, 2022; Shalini and Viji, 2023; Shawly and Alsheikhy, 2022; Nagiub et al., 2020; Abhishek et al., 2023), GANs in two (Karar et al., 2022; Veeraiah et al., 2023), and SVM in one (Kazemi et al., 2016). For the selection of datasets, five studies (Bibi et al., 2020; Karar et al., 2022; Sakthiraj, 2022; Shalini and Viji, 2023; Nagiub et al., 2020) depended on images from online datasets such as the American Society of Hematology Image Bank (ASH-bank) and the Acute Lymphoblastic Leukemia Image Database for Image Processing (ALL-IDB). At the same time, the rest of the studies either used local data images from hospitals, and laboratories, or another online dataset (namely, The Kaggle site) (Shawly and Alsheikhy, 2022).
The classification was mostly multi-class classification to stratify images into AML, ALL, normal, or other leukemia types, while only three studies performed binary classification (Shawly and Alsheikhy, 2022; Kazemi et al., 2016; Nagiub et al., 2020). Transfer learning was utilized in four studies, and classifiers in five studies. Detailed characteristics of the included studies, including the study design, chosen dataset, number of images used (while applying image augmentation or not), and name of the AI algorithm tested, among others, can be found in Tables 1, 2.
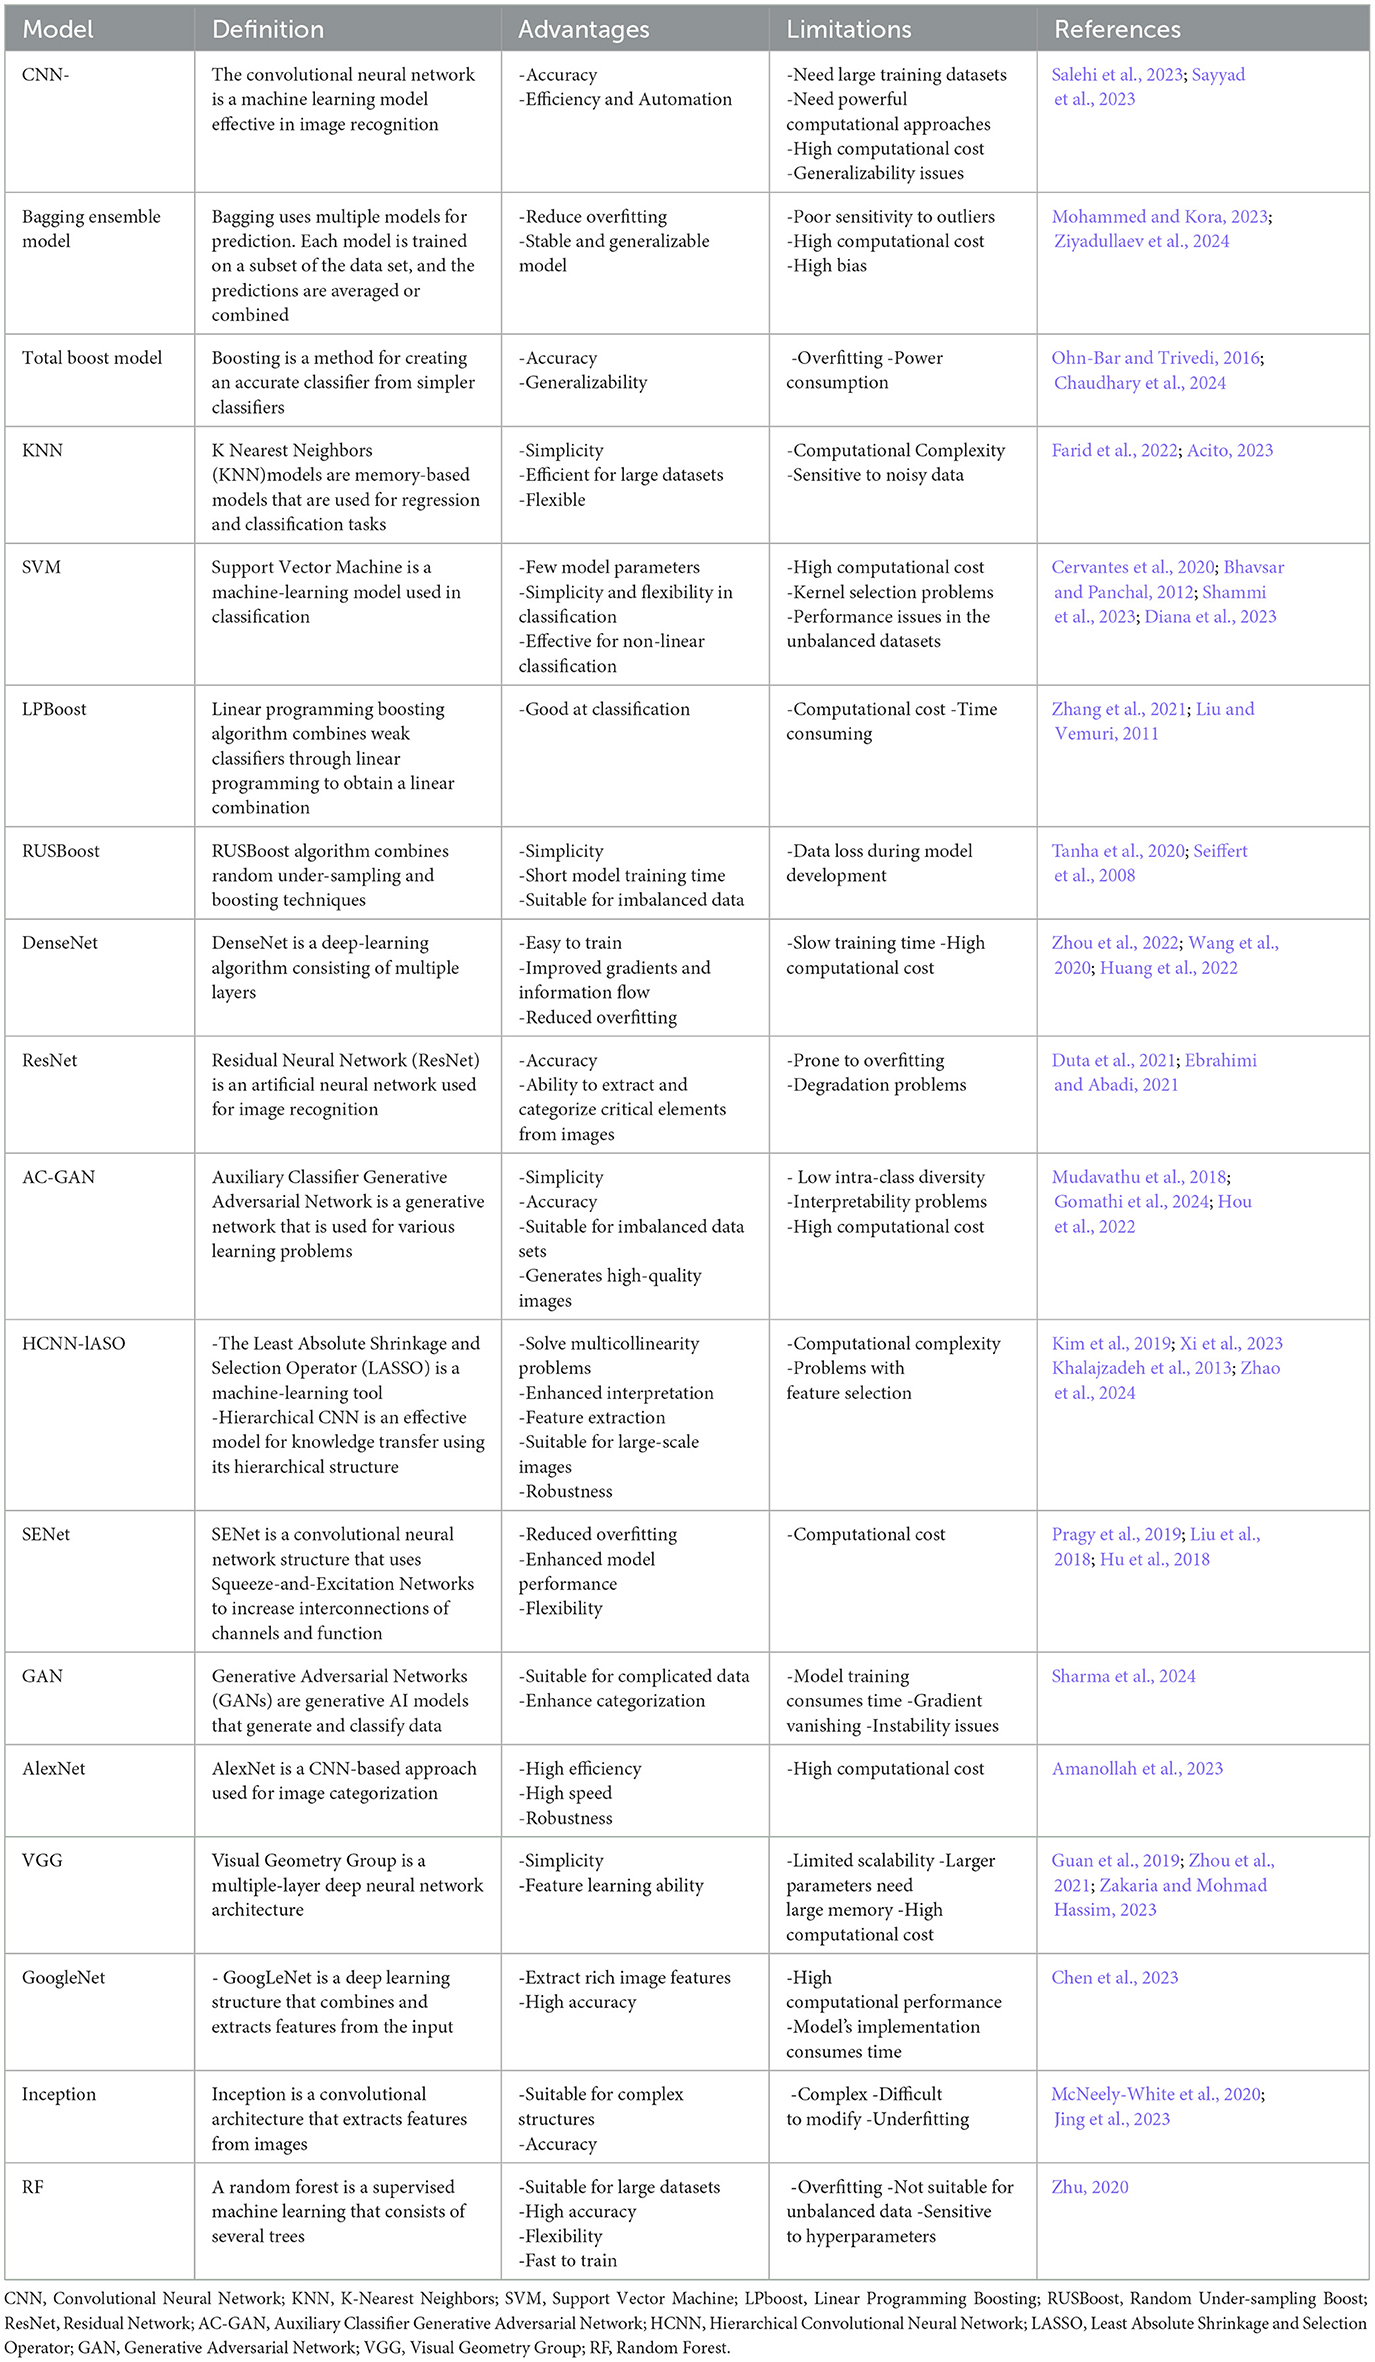
Table 3 summarizes the definitions, advantages, and limitations of different AI models included in our study.
4.3 Assessment of the potential for bias (Quality)
Quality assessment using the QUADAS-2 tool revealed an overall low risk of bias and a low risk of applicability concerns, with some unclarity regarding the flow and timing domains (Figure 2).
4.4 Data synthesis and meta-analysis
4.4.1 Accuracy
The common effect model yielded an accuracy of 1.0000 [0.9999; 1.0001], whereas the random-effects model yielded an accuracy of 0.9557 [0.9312; 0.9802]. In the random-effects model, the estimate of the overall accuracy was 0.9557 with a standard error of 0.0125. The z-value was 76.5840, and the p-value was < 0.0001, indicating that the overall accuracy was significantly different from chance (Figure 3).
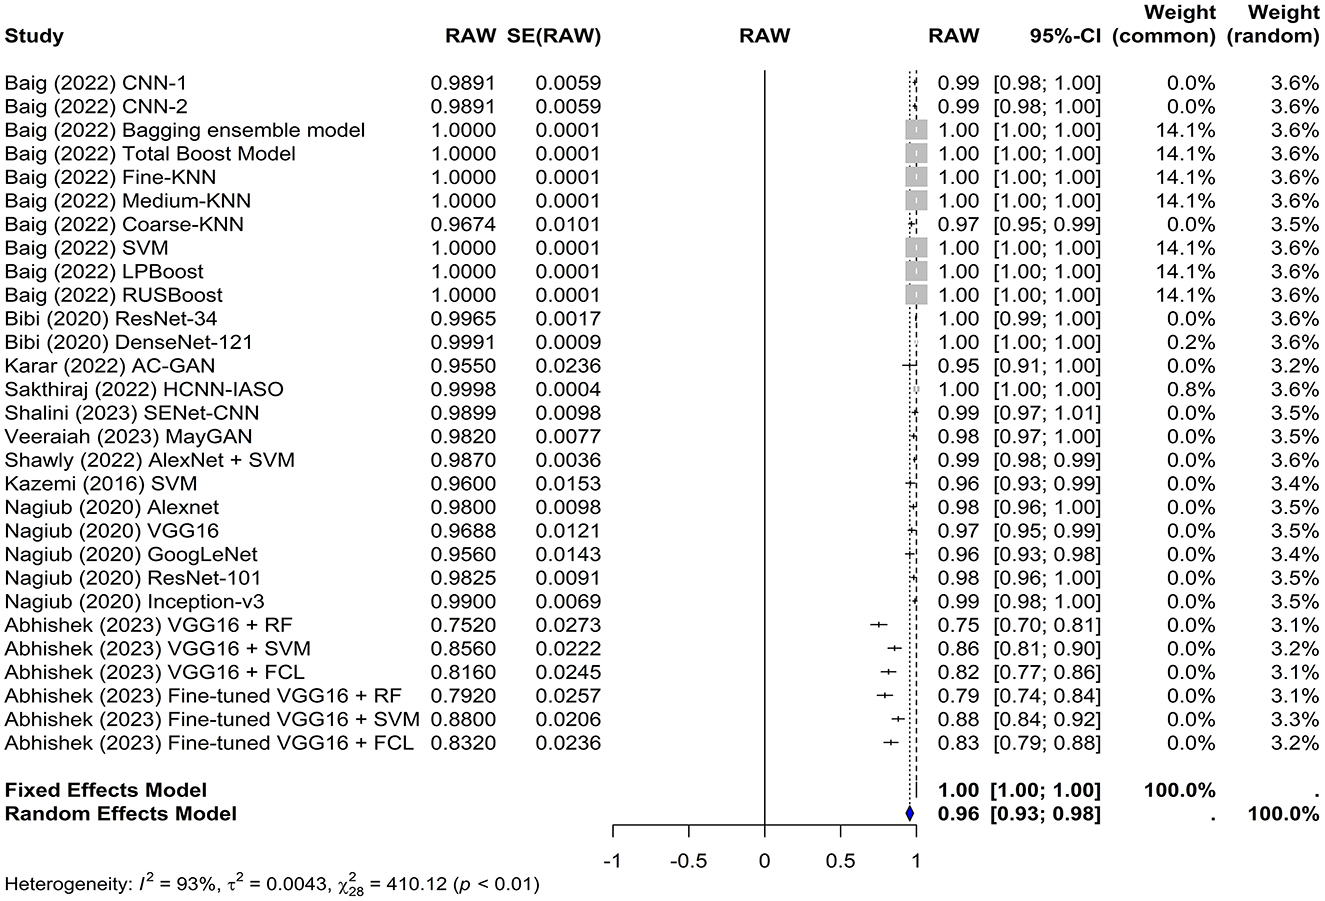
Figure 3. Forest plot for analyzing the accuracy of the different models used across the studies. CI, confidence interval.
The test for heterogeneity resulted in a Q-value of 410.1247 with 28 degrees of freedom, indicating significant heterogeneity among the studies (p < 0.0001). The I2 and H2 statistics were 100.00% and 94,583.49, respectively, suggesting a high level of heterogeneity. Furthermore, heterogeneity among studies was quantified using tau∧2 and tau. The Tau∧2 value was 0.0043 with a standard error (SE) of 0.0012, and the tau (square root of the estimated Tau∧2 value) was 0.0659.
These results demonstrate the potential of artificial intelligence in detecting leukemia with high accuracy. However, the high level of heterogeneity suggests that the accuracy may vary depending on the specific characteristics of the study, such as the type of classifier used and whether transfer learning was employed.
4.4.2 Sensitivity
In this meta-analysis, both the common and random effects models yielded high sensitivity values of 1.0000 and 0.8581, respectively, suggesting that the machine learning models used in the studies were effective in correctly identifying true positive cases of leukemia. In the random-effects model, the overall sensitivity was estimated to be 0.8581 with a z-value of 18.33 and a p-value of < 0.0001, which indicates that this sensitivity significantly differs from chance (Figure 4). Several models achieved 100% sensitivity in the diagnosis of leukemia such as KNN, LPboost, Inception, and DenseNet-based models. The VGG16+RF and the fine-tuned VGG16+RF models in Abhishek et al. (2023) had the lowest sensitivity (12% and 20%, respectively).
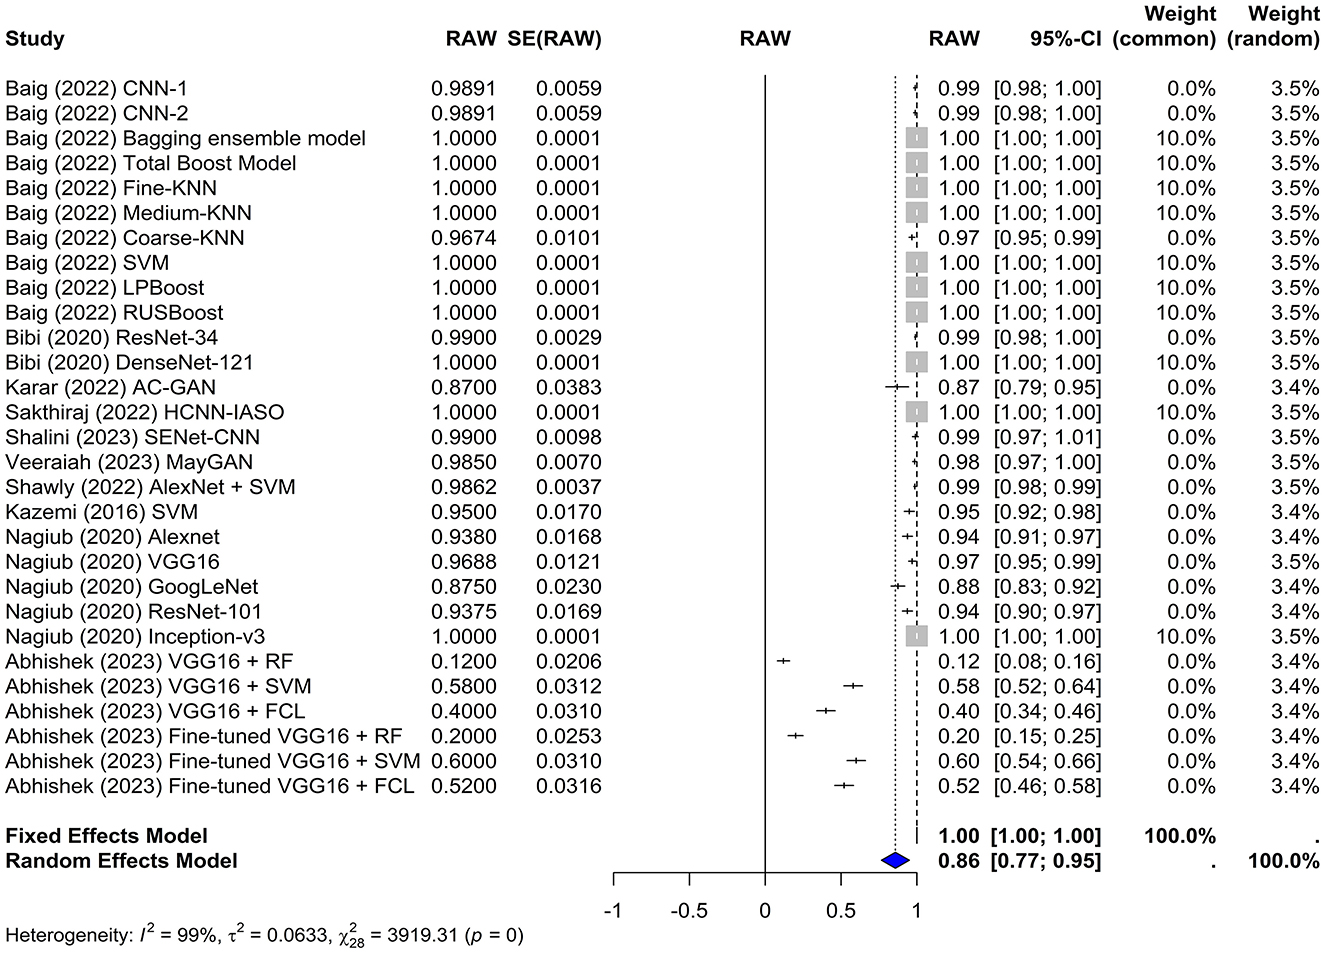
Figure 4. Forest plot for analyzing the sensitivity of the different models used across the studies. CI, confidence interval.
The test for heterogeneity yielded a Q-value of 3,919.31 with 28 degrees of freedom. A p-value of 0 indicates significant heterogeneity among the studies, suggesting that the variability in study outcomes is due to real differences in effect sizes rather than chance. The I2 statistic was 99.3%, indicating a high level of heterogeneity, which was further confirmed by an H2 value of 11.83.
Furthermore, the Tau∧2 was 0.0633, with an SE of 0.0012 and tau of 0.2516, which provided additional information about the heterogeneity among the studies.
4.5 Publication bias
Funnel plots were created to detect potential biases or systematic heterogeneity. The asymmetry observed in the plots suggests potential publication or other bias, indicating that smaller studies with positive outcomes are more likely to be published. Several studies appeared outside the funnel shape. This may be due to a small sample size, poor study design, or heterogeneity (Figures 5, 6).
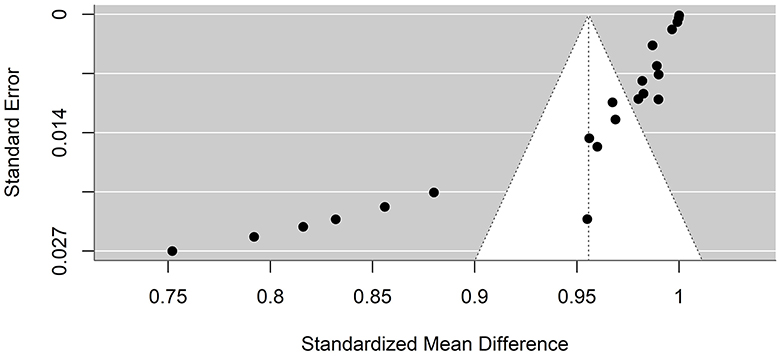
Figure 5. Precision funnel plot of the estimated effects from studies on artificial intelligence model performance accuracy.
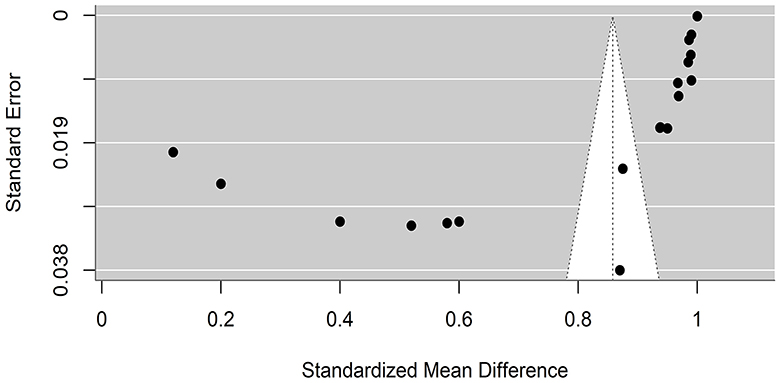
Figure 6. Precision funnel plot of the estimated effects from studies on artificial intelligence model performance sensitivity.
5 Discussion
Our meta-analysis aimed to analyze the diagnostic accuracy of AI methods in identifying and diagnosing AML, which revealed significant findings regarding the performance of machine-learning models in such detection. Both the common effects and random effects models demonstrated high accuracy, with values of 1.0000 and 0.9557 respectively. However, there was significant heterogeneity among the studies, as indicated by a Q-value of 410.1247 and I2 statistic of 100%. Additionally, both models showed high sensitivity for correctly identifying true-positive cases of leukemia, with values of 1.0000 and 0.8581, respectively. Nevertheless, sensitivity also demonstrated significant heterogeneity among the studies, as shown by a Q-value of 3,919.31, and an I2 statistic of 99.3%.
The significant heterogeneity in the accuracy results suggests that the accuracy of each model may vary depending on the specific characteristics of each study, such as the type of classifier used and whether transfer learning is employed. Baig et al. (2022) initially tested two CNN models for proper identification of AML from ALL or healthy cells. Subsequently, they applied multiple classifier models using fusion methods, such as the Bagging Ensemble and the RUSboost, aiming to combine the complex feature vectors of CCN-1 and CNN-2, thus improving the prediction performance. On the other hand, other studies, such as Bibi et al. (2020), Kazemi et al. (2016), and (Nagiub et al., 2020) only focused on the main ML model used without any further classifications, where they yielded satisfactory results. Such mixed approaches have resulted in varying ranges of accuracy and subsequent overall heterogeneity.
Remarkably, Baig et al. (2022) used traditional ML models. This was justified by the need to minimize the computation of the network used. Training a deep learning network can take several hours or even days, whereas traditional machine learning models require a few minutes. The use of a DL model such as a CNN while training it using a traditional ML classifier displayed quite remarkable results compared to DL. This can be attributed to the limited dataset sizes, where training complex DL models usually requires larger datasets (Sarker, 2021). Furthermore, leukemia microscopic images can be complex, containing nuanced morphological and textural characteristics that may be difficult for DL models to extract reliably. Such factors could potentially contribute to traditional ML methods, which sometimes outperform DL methods.
Transfer Learning was another common variable among the included studies. Some authors prefer to work with pre-trained models to speed up the results and generate faster outcomes. In particular, one model is that of Abhishek et al. (2023), who tested multiple pre-trained CNN models and subsequently chose the top-performing model (VGG16) for further fine-tuned analysis. However, other studies preferred to train their models from scratch, including Shalini and Viji (2023) who trained a squeeze-and-excitation network (SENet)-based CNN model on a hybrid dataset of blood smear images by combining both the ASH-bank and the ALL-IDB to complement the data. Heterogeneity is further magnified through these vast differences between testing models; however, this is expected due to the continuous evolution of the ML and DL worlds. Notably, most studies demonstrated closely related statistics, except for the models used by Abhishek et al. (2023), which demonstrated lower values for both accuracy and sensitivity. However, this most likely cannot be attributed to transfer learning as a concept in general, as various other studies have used it, and the results are promising. A possible rationale for the poor performance of these models could be the variation in the training dataset domain between the CNN models and the deep transfer learning dataset. Their study involved deep transfer learning using a microscopic blood smear dataset; therefore, there is a potential for negative transfer because the pre-trained CNN models were trained on the ImageNet dataset, which only comprises real-life images, resulting in the overall low accuracy of the models.
A few important elements that can have a significant impact on the AI model performance are feature extraction, data augmentation, data source and size, and model design. For instance, traditional machine learning techniques frequently depend on domain-specific feature engineering, in which experts manually identify and extract pertinent features from data (Gibert et al., 2022). On the other hand, deep learning models can automatically learn features by utilizing the hierarchical structure of the network; nevertheless, the model architecture and training data affect the quality of the learned features (Gibert et al., 2022). Ideally, a combination of both approaches could significantly enhance detection systems, as previously mentioned by Baig et al. (2022). Finally, image augmentation was a common factor in almost half of the included studies (Baig et al., 2022; Bibi et al., 2020; Sakthiraj, 2022; Kazemi et al., 2016; Abhishek et al., 2023) and performed better in training their sets on a larger number of samples. This helped to increase the diversity and size of the training dataset, which is an important aspect for DL models to yield better results. Additionally, the origin of the data, whether from one or more sources, can also have an impact on how well the model handles variances and real-world situations. Over half of the included studies utilized online datasets, which could have been beneficial in enhancing their sensitivity and accuracy, as they included data from multiple sources rather than a single area/hospital.
Internet of Medical Things (IoMT) is a common term observed in three studies included in our review (Bibi et al., 2020; Karar et al., 2022; Sakthiraj, 2022). It is essentially a medical device that communicates with Wi-Fi and smart computer networks (Ud Din et al., 2019). Smart medical gadgets use sensors and computational resources to provide healthcare in various settings, including homes, clinics, hospitals, healthcare facilities, and basic communities (Khan et al., 2020). Consequently, they are linked to cloud platforms for data analyses and processing. Linking patients to doctors and securely transferring medical data reduces the strain on health systems, allowing for the accurate remote examination, diagnosis, and treatment of many disorders (Awan et al., 2021; Almogren et al., 2021). Bibi et al. developed a model utilizing ResNet-34 and DenseNet-121, with promising accuracy (Bibi et al., 2020). Karar et al. (2022) established a GAN classifier integrated within an IoMT framework for multiclass classification of ALL, AML, and normal blood images. Finally, the last study (Sakthiraj, 2022) used a hybrid Convolutional Neural Network with an interactive autodidactic school (HCNN-IAS) algorithm, which has multi-performance effects in terms of feature extraction, fusing, and classification operations. The proposed methodology allowed for higher classification accuracy in terms of the detection of different leukemia classes, with an accuracy of approximately 99%. All these approaches utilizing the IoMT architecture allow doctors to provide medical care based on test results supplied to their computers after diagnosis, which in turn is of promising value for optimized patient care.
Different methods of outcome reporting are one noticeable concern that varied across the studies. For instance, some studies reported the area under the curve (AUC) and false positive rate, whereas others produced results in terms of precision and F-1 scores. Therefore, it is necessary to define precise reporting guidelines for diagnostic accuracy studies evaluating AI procedures to unify the reporting methods among similar studies and to aid in performing homogenous meta-analyses. Examples of anticipated work in progress include STARD-AI (Sounderajah et al., 2020) and TRIPOD-AI (Collins and Moons, 2019). The QUADAS-2 assessment tool was used to systematically assess the risk of bias and applicability in diagnostic accuracy studies. However, this tool was not specifically designed for DL diagnostic accuracy studies. The unique nature of ML and DL studies requires the creation of a novel specific and unified quality assessment tool for all healthcare-related AI tools (Aggarwal et al., 2021).
AI has been used for image diagnosis in similar studies in which comparable findings were found. For instance, Sampathila et al. (2022) tested a CNN model for diagnosing ALL, and the results showed a high performance, as evidenced by an accuracy of 95.54%, specificity of 95.81%, and sensitivity of 95.91%. Additionally, Ghaderzadeh et al. (2021) performed a systematic review of studies classifying leukemia using ML on PBS images and found an average accuracy of >97%. Furthermore, Rawat et al. (2017) introduced a computer-assisted classification framework using SVM, which achieved a maximum accuracy of 99.5% for screening AML and ALL blast cells. Deep convolutional networks are also used in detecting the ratio of WBCs in peripheral blood smear analysis. The proposed model relied on hyperspectral imaging technology (HSI), which combines conventional imaging and spectroscopy to produce 3-dimensional data. The model achieved 97.72% accuracy in the WBC classification (Wang et al., 2021). Wang et al. (2017) developed an AI-based model to identify lymphoblast and lymphocytes and diagnose ALL. The model combined spectral and spatial information achieving 92.9% accuracy (Wang et al., 2017). This highlights the potential of AI models in the diagnosis of different types of leukemia.
However, all of these studies focused on detecting either ALL alone or leukemia in general, with no prior meta-analyses evaluating the diagnostic accuracy of whole PBS images for AML. This highlights the uniqueness of our analysis in both the detection of AML and the use of whole images rather than leukocyte/blast-cell images.
6 Limitations and strengths
Our study has several limitations. First, a high level of heterogeneity was observed between the included studies. This is probably because of the continuous change in the ML and AI worlds, where multiple methods of data augmentation, classification, transfer learning, and feature extraction are used. The varying sample sizes and number of images used between studies are another limitation that could affect the results. Most of the included studies additionally utilized ASH-bank as the main dataset for model training; thus, the generalizability of our findings regarding diagnostic performance in different clinical settings is limited. Another drawback is that the counts needed to reconstruct the 2 × 2 tables of results for each study were not always provided; thus, analysis of more diagnostic metrics, such as specificity, was limited. Moreover, one of the main differences between these studies was the application of a data augmentation technique to the training and testing sets. Such an application can result in a misleadingly higher accuracy than the genuine value; therefore, the results are not always realistic. Finally, the potential publication bias was presented, where most of the models with positive results are likely to be the ones published disregarding others that might affect our interpretation of the overall AI accuracy.
On the other hand, to the best of our knowledge, this is the first systematic review with a meta-analysis specifically on the accuracy of AI models in diagnosing AML. Previous studies have frequently focused on single-cell classification or used preprocessed images, limiting applications to real-world situations. Our focus on the analysis of whole PBS images mitigated this issue and enhanced overall accuracy.
7 Conclusion and future directions
In conclusion, our systematic review and meta-analysis found an overall high accuracy and sensitivity of AI models in correctly identifying true-positive cases of Acute Myeloid Leukemia. This is the first study to compare artificial intelligence-related studies discussing the diagnosis of AML in particular rather than ALL or Leukemia diagnoses in general.
Future research should focus on assessing multiple performance measures to assess every possible outcome related to the tested model. The unification of accuracy, sensitivity, and specificity for each cancer type, rather than an overall average, would be more valuable in allowing for the proper critical appraisal of each model in terms of properly identifying AML.
Additionally, additional work related to the advancement of DL-based diagnostic tools as an IoMT approach is highly intriguing. Cancer treatment is a complicated process and the ability to diagnose samples through an accurate IoMT device with fewer hospital visits, especially during epidemics and pandemics like the recent COVID-19, would be extremely beneficial, especially if the future models delve deeper into the diagnosis of different subtypes.
8 Summary
Leukemia is the 10th most common type of cancer globally, and acute myeloid leukemia (AML) is the most common malignant blood cancer in adults.
Microscopic blood testing is the most common method used to identify leukemia subtypes. An automated optical image processing system employing artificial intelligence (AI) has recently been used to aid clinical decision-making, although its performance and accuracy remain unclear.
We aimed to assess the effectiveness of all AI-based techniques in the detection and diagnosis of AML using a systematic review and meta-analysis.
We discovered that AI models are often quite accurate and sensitive for properly recognizing true-positive cases of AML.
Future research should focus on harmonizing AI-based diagnostic reporting techniques with performance assessment criteria.
Data availability statement
The original contributions presented in the study are included in the article/Supplementary material, further inquiries can be directed to the corresponding author.
Author contributions
FA-O: Conceptualization, Data curation, Formal analysis, Funding acquisition, Investigation, Methodology, Project administration, Resources, Software, Supervision, Validation, Visualization, Writing – original draft, Writing – review & editing. WH: Project administration, Resources, Software, Supervision, Validation, Visualization, Writing – original draft, Writing – review & editing, Conceptualization, Data curation, Formal analysis, Funding acquisition, Investigation, Methodology. AR: Conceptualization, Data curation, Formal analysis, Funding acquisition, Investigation, Methodology, Project administration, Resources, Software, Supervision, Validation, Visualization, Writing – original draft, Writing – review & editing. MJ: Conceptualization, Data curation, Formal analysis, Funding acquisition, Investigation, Methodology, Project administration, Resources, Software, Supervision, Validation, Visualization, Writing – original draft, Writing – review & editing. MG: Data curation, Methodology, Conceptualization, Formal analysis, Software, Writing – review & editing. IC-O: Conceptualization, Data curation, Formal analysis, Funding acquisition, Investigation, Methodology, Project administration, Resources, Software, Supervision, Validation, Visualization, Writing – original draft, Writing – review & editing. DS-R: Data curation, Methodology, Conceptualization, Formal analysis, Investigation, Software, Writing – review & editing.
Funding
The author(s) declare that no financial support was received for the research, authorship, and/or publication of this article.
Conflict of interest
The authors declare that the research was conducted in the absence of any commercial or financial relationships that could be construed as a potential conflict of interest.
Publisher's note
All claims expressed in this article are solely those of the authors and do not necessarily represent those of their affiliated organizations, or those of the publisher, the editors and the reviewers. Any product that may be evaluated in this article, or claim that may be made by its manufacturer, is not guaranteed or endorsed by the publisher.
Supplementary material
The Supplementary Material for this article can be found online at: https://www.frontiersin.org/articles/10.3389/fdata.2024.1402926/full#supplementary-material
References
Abhishek, A., Jha, R. K., Sinha, R., and Jha, K. (2023). Automated detection and classification of leukemia on a subject-independent test dataset using deep transfer learning supported by Grad-CAM visualization. Biomed. Signal Process. Control 83:104722. doi: 10.1016/j.bspc.2023.104722
Acito, F. (2023). k Nearest Neighbors. Predictive analytics with KNIME. Cham: Springer Nature Switzerland, 209–27. doi: 10.1007/978-3-031-45630-5_10
Aggarwal, R., Sounderajah, V., Martin, G., Ting, D. S. W., Karthikesalingam, A., King, D., et al. (2021). Diagnostic accuracy of deep learning in medical imaging: a systematic review and meta-analysis. Npj Digit. Med. 4:65. doi: 10.1038/s41746-021-00438-z
Ahmed, N., Yigit, A., Isik, Z., and Alpkocak, A. (2019). Identification of leukemia subtypes from microscopic images using convolutional neural network. Diagnostics 9:104. doi: 10.3390/diagnostics9030104
Almogren, A., Mohiuddin, I., Din, I. U., Almajed, H., and Guizani, N. (2021). FTM-IoMT: fuzzy-based trust management for preventing sybil attacks in internet of medical things. IEEE Internet Things J. 8, 4485–4497. doi: 10.1109/JIOT.2020.3027440
Alzubaidi, L., Zhang, J., Humaidi, A. J., Al-Dujaili, A., Duan, Y., Al-Shamma, O., et al. (2021). Review of deep learning: concepts, CNN architectures, challenges, applications, future directions. J. Big Data 8:53. doi: 10.1186/s40537-021-00444-8
Amanollah, H., Asghari, A., Mashayekhi, M., and Zahrai, S. M. (2023). Damage detection of structures based on wavelet analysis using improved AlexNet. Structures 56:105019. doi: 10.1016/j.istruc.2023.105019
Amin, M. M., Kermani, S., Talebi, A., and Oghli, M. G. (2015). Recognition of acute lymphoblastic leukemia cells in microscopic images using k-means clustering and support vector machine classifier. J. Med. Signals Sens. 5, 49–58. doi: 10.4103/2228-7477.150428
Awan, K. A., Din, I. U., Almogren, A., Almajed, H., Mohiuddin, I., Guizani, M., et al. (2021). NeuroTrust—artificial-neural-network-based intelligent trust management mechanism for large-scale internet of medical things. IEEE Internet Things J. 8, 15672–15682. doi: 10.1109/JIOT.2020.3029221
Baig, R., Rehman, A., Almuhaimeed, A., Alzahrani, A., and Rauf, H. T. (2022). Detecting malignant leukemia cells using microscopic blood smear images: a deep learning approach. Appl. Sci. 12:6317. doi: 10.3390/app12136317
Bain, B. J. (2005). Diagnosis from the blood smear. N. Engl. J. Med. 353, 498–507. doi: 10.1056/NEJMra043442
Ben-Suliman, K., and Krzyżak, A. (2018). “Computerized counting-based system for acute lymphoblastic leukemia detection in microscopic blood images,” in Artificial Neural Networks and Machine Learning–ICANN 2018: 27th International Conference on Artificial Neural Networks, Rhodes, Greece, October 4–7, 2018, Proceedings, Part II 27 (Springer International Publishing), 167–178. doi: 10.1007/978-3-030-01421-6_17
Bhavsar, H., and Panchal, M. H. (2012). A review on support vector machine for data classification. Int. J. Adv. Res. Comput. Eng. Technol. 1, 185–189.
Bibi, N., Sikandar, M., Din, I. U., Almogren, A., and Ali, S. (2020). IOMT-based automated detection and classification of leukemia using deep learning. J. Healthc. Eng. 2020:6648574. doi: 10.1155/2020/6648574
Bray, F., Ferlay, J., Soerjomataram, I., Siegel, R. L., Torre, L. A., Jemal, A., et al. (2018). Global cancer statistics 2018: GLOBOCAN estimates of incidence and mortality worldwide for 36 cancers in 185 countries. CA Cancer J. Clin. 68, 394–424. doi: 10.3322/caac.21492
Cervantes, J., Garcia-Lamont, F., Rodríguez-Mazahua, L., and Lopez, A. (2020). A comprehensive survey on support vector machine classification: applications, challenges and trends. Neurocomputing 408, 189–215. doi: 10.1016/j.neucom.2019.10.118
Chaudhary, C., Gupta, A., and Murugan, R. (2024). “Comparing boosting and bagging algorithms for image classification,” in 2024 International Conference on Optimization Computing and Wireless Communication (ICOCWC) (IEEE), 1–7. doi: 10.1109/ICOCWC60930.2024.10470582
Chaurasia, A., Namachivayam, A., Koca-Ünsal, R. B., and Lee, J.-H. (2024). Deep-learning performance in identifying and classifying dental implant systems from dental imaging: a systematic review and meta-analysis. J. Periodontal Implant Sci. 54, 3–12. doi: 10.5051/jpis.2300160008
Chen, S. H., Wu, Y. L., Pan, C. Y., Lian, L. Y., and Su, Q. C. (2023). Breast ultrasound image classification and physiological assessment based on GoogLeNet. J. Radiat. Res. Appl. Sci. 16:100628. doi: 10.1016/j.jrras.2023.100628
Collins, G. S., and Moons, K. G. M. (2019). Reporting of artificial intelligence prediction models. Lancet 393, 1577–1579. doi: 10.1016/S0140-6736(19)30037-6
Diana, D. C., Hema, R., Kumar, G. N., and Kumar, R. R. (2023). “Support vector based classification for adaptive channel equalization,” in 2023 Second International Conference on Electronics and Renewable Systems (ICEARS) (IEEE), 325–331. doi: 10.1109/ICEARS56392.2023.10085218
Duta, I. C., Liu, L., Zhu, F., and Shao, L. (2021). “Improved residual networks for image and video recognition,” in 2020 25th International Conference on Pattern Recognition (ICPR) (IEEE), 9415–9422. doi: 10.1109/ICPR48806.2021.9412193
Ebrahimi, M. S., and Abadi, H. K. (2021). “Study of residual networks for image recognition,” in Intelligent Computing: Proceedings of the 2021 Computing Conference, Volume 2 (Springer International Publishing), 754–763. doi: 10.1007/978-3-030-80126-7_53
Elsayed, B., Elhadary, M., Elshoeibi, R. M., Elshoeibi, A. M., Badr, A., Metwally, O., et al. (2023). Deep learning enhances acute lymphoblastic leukemia diagnosis and classification using bone marrow images. Front. Oncol. 13:1330977. doi: 10.3389/fonc.2023.1330977
Farid, D. M., Sworna, N. S., Amin, R., Sadia, N., Rahman, M., Liton, N. K., et al. (2022). “Boosting k-nearest neighbour (knn) classification using clustering and adaboost methods,” in 2022 IEEE Region 10 Symposium (TENSYMP) (IEEE), 1–6. doi: 10.1109/TENSYMP54529.2022.9864503
Ghaderzadeh, M., Asadi, F., Hosseini, A., Bashash, D., Abolghasemi, H., Roshanpour, A., et al. (2021). Machine learning in detection and classification of leukemia using smear blood images: a systematic review. Sci. Progr. 2021, 1–14. doi: 10.1155/2021/9933481
Gibert, D., Planes, J., Mateu, C., and Le, Q. (2022). Fusing feature engineering and deep learning: a case study for malware classification. Expert Syst. Appl. 207:117957. doi: 10.1016/j.eswa.2022.117957
Gomathi, R., Gnanavel, S., Narayana, K. E., and Dhiyanesh, B. (2024). ACGAN adaptive conditional generative adversarial network architecture predicting skin lesion using collaboration of transfer learning models. Automatika 65, 1458–1468. doi: 10.1080/00051144.2024.2396167
Guan, Q., Wang, Y., Ping, B., Li, D., Du, J., Qin, Y., et al. (2019). Deep convolutional neural network VGG-16 model for differential diagnosing of papillary thyroid carcinomas in cytological images: a pilot study. J. Cancer 10, 4876–4882. doi: 10.7150/jca.28769
He, K., Zhang, X., Ren, S., and Sun, J. (2016). “Deep residual learning for image recognition,” in Proceedings of the IEEE Conference on Computer Vision and Pattern Recognition, 770–778). doi: 10.1109/CVPR.2016.90
Hegde, R. B., Prasad, K., Hebbar, H., and Sandhya, I. (2018). Peripheral blood smear analysis using image processing approach for diagnostic purposes: a review. Biocybern. Biomed. Eng. 38, 467–480. doi: 10.1016/j.bbe.2018.03.002
Hegde, R. B., Prasad, K., Hebbar, H., and Singh, B. M. K. (2019). Comparison of traditional image processing and deep learning approaches for classification of white blood cells in peripheral blood smear images. Biocybern. Biomed. Eng. 39, 382–392. doi: 10.1016/j.bbe.2019.01.005
Hou, L., Cao, Q., Shen, H., Pan, S., Li, X., and Cheng, X. (2022). “Conditional gans with auxiliary discriminative classifier,” in International Conference on Machine Learning (PMLR), 8888–8902.
Hu, J., Shen, L., and Sun, G. (2018). “Squeeze-and-excitation networks,” in Proceedings of the IEEE Conference on Computer Vision and Pattern Recognition, 7132–7141. doi: 10.1109/CVPR.2018.00745
Huang, G., Liu, Z., Pleiss, G., van der Maaten, L., and Weinberger, K. Q. (2022). Convolutional networks with dense connectivity. IEEE Trans. Pattern Anal. Mach. Intell. 44, 8704–8716. doi: 10.1109/TPAMI.2019.2918284
Huang, G., Liu, Z., Van Der Maaten, L., and Weinberger, K. Q. (2017). “Densely connected convolutional networks,” in Proceedings of the IEEE Conference on Computer Vision and Pattern Recognition, 4700–4708). doi: 10.1109/CVPR.2017.243
Hunter, B., Hindocha, S., and Lee, R. W. (2022). The role of artificial intelligence in early cancer diagnosis. Cancers 14:1524. doi: 10.3390/cancers14061524
Jing, Y., Li, C., Du, T., Jiang, T., Sun, H., Yang, J., et al. (2023). A comprehensive survey of intestine histopathological image analysis using machine vision approaches. Comput. Biol. Med. 165:107388. doi: 10.1016/j.compbiomed.2023.107388
Karar, M. E., Alotaibi, B., and Alotaibi, M. (2022). Intelligent medical IoT-enabled automated microscopic image diagnosis of acute blood Cancers. Sensors 22, 1–16. doi: 10.3390/s22062348
Kazemi, F., Najafabadi, T., and Araabi, B. (2016). Automatic recognition of acute myelogenous leukemia in blood microscopic images using K-means clustering and support vector machine. J. Med. Signals Sens. 6, 183–193. doi: 10.4103/2228-7477.186885
Khalajzadeh, H., Mansouri, M., and Teshnehlab, M. (2013). Hierarchical structure based convolutional neural network for face recognition. Int. J. Comput. Intell. Appl. 12:1350018. doi: 10.1142/S1469026813500181
Khan, S. R., Sikandar, M., Almogren, A., Ud Din, I., Guerrieri, A., Fortino, G., et al. (2020). IoMT-based computational approach for detecting brain tumor. Futur. Gener. Comput. Syst. 109, 360–367. doi: 10.1016/j.future.2020.03.054
Kim, Y., Hao, J., Mallavarapu, T., Park, J., and Kang, M. (2019). Hi-LASSO: high-dimensional LASSO. IEEE Access 7, 44562–44573. doi: 10.1109/ACCESS.2019.2909071
Krizhevsky, A., Sutskever, I., and Hinton, G. E. (2017). ImageNet classification with deep convolutional neural networks. Commun. ACM 60, 84–90. doi: 10.1145/3065386
Li, M., Jiang, Y., Zhang, Y., and Zhu, H. (2023). Medical image analysis using deep learning algorithms. Front. Public Heal. 11:1273253. doi: 10.3389/fpubh.2023.1273253
Liu, J., Chen, G., and Guo, J. (2018). “SENet for weakly-supervised relation extraction,” in Proceedings of the 2018 2nd International Conference on Computer Science and Artificial Intelligence, 511–515. doi: 10.1145/3297156.3297223
Liu, M., and Vemuri, B. C. (2011). “Robust and efficient regularized boosting using total Bregman divergence,” in CVPR 2011 (IEEE), 2897–2902. doi: 10.1109/CVPR.2011.5995686
McNeely-White, D., Beveridge, J. R., and Draper, B. A. (2020). Inception and ResNet features are (almost) equivalent. Cogn. Syst. Res. 59, 312–318. doi: 10.1016/j.cogsys.2019.10.004
Mohammed, A., and Kora, R. (2023). A comprehensive review on ensemble deep learning: opportunities and challenges. J. King Saud Univ. – Comput. Inf. Sci. 35, 757–774. doi: 10.1016/j.jksuci.2023.01.014
Mudavathu, K. D. B., Rao, M. C. S., and Ramana, K. V. (2018). “Auxiliary conditional generative adversarial networks for image data set augmentation,” in 2018 3rd International Conference on Inventive Computation Technologies (ICICT) (IEEE), 263–269. doi: 10.1109/ICICT43934.2018.9034368
Nagiub, E., Hussain, K., Omar, N., and Al-Rashedi, Q. (2020). Acute myeloid leukemia diagnosis using deep learning. Egypt. J. Haematol. 45:167. doi: 10.4103/ejh.ejh_11_20
Nasr-Esfahani, E., Samavi, S., Karimi, N., Soroushmehr, S. M. R., Jafari, M. H., Ward, K., et al. (2016). “Melanoma detection by analysis of clinical images using convolutional neural network,” in 2016 38th Annual International Conference of the IEEE Engineering in Medicine and Biology Society (EMBC) (IEEE), 1373–1376. doi: 10.1109/EMBC.2016.7590963
Ohn-Bar, E., and Trivedi, M. M. (2016). “To boost or not to boost? On the limits of boosted trees for object detection,” in 2016 23rd International Conference on Pattern Recognition (ICPR) (IEEE), 3350–3355. doi: 10.1109/ICPR.2016.7900151
Okikiolu, J., Dillon, R., and Raj, K. (2021). Acute leukaemia. Medicine 49, 274–281. doi: 10.1016/j.mpmed.2021.02.004
Patterson, J., and Gibson, A. (2017). Deep learning: A practitioner's approach. O'Reilly Media, Inc.
Pragy, P., Sharma, V., and Sharma, V. (2019). Senet CNN based tomato leaf disease detection. Int. J. Innov. Technol. Explor. Eng. 8, 773–777. doi: 10.35940/ijitee.K1452.0981119
Rawat, J., Singh, A., Virmani, H. S. B. J., and Devgun, J. S. (2017). Computer assisted classification framework for prediction of acute lymphoblastic and acute myeloblastic leukemia. Biocybern. Biomed. Eng. 37, 637–654. doi: 10.1016/j.bbe.2017.07.003
Sakthiraj, F. S. K. (2022). Autonomous leukemia detection scheme based on hybrid convolutional neural network model using learning algorithm. Wirel. Pers. Commun. 126, 2191–2206. doi: 10.1007/s11277-021-08798-1
Salehi, A. W., Khan, S., Gupta, G., Alabduallah, B. I., Almjally, A., Alsolai, H., et al. (2023). A study of CNN and transfer learning in medical imaging: advantages, challenges, future scope. Sustainability 15:5930. doi: 10.3390/su15075930
Sampathila, N., Chadaga, K., Goswami, N., Chadaga, R. P., Pandya, M., Prabhu, S., et al. (2022). Customized deep learning classifier for detection of acute lymphoblastic leukemia using blood smear images. Healthcare 10:1812. doi: 10.3390/healthcare10101812
Sarker, I. H. (2021). Deep learning: a comprehensive overview on techniques, taxonomy, applications and research directions. SN Comput. Sci. 2:420. doi: 10.1007/s42979-021-00815-1
Sayyad, J., Patil, P., and Gurav, S. (2023). Exploring the potential of convolutional neural networks in healthcare engineering for skin disease identification. Int. J. Recent Innov. Trends Comput. Commun. 11, 307–319. doi: 10.17762/ijritcc.v11i10.8494
Seiffert, C., Khoshgoftaar, T. M., Van Hulse, J., and Napolitano, A. (2008). “RUSBoost: improving classification performance when training data is skewed,” in 2008 19th International Conference on Pattern Recognition (IEEE), 1–4. doi: 10.1109/ICPR.2008.4761297
Shalini, V., and Viji, K. S. A. (2023). Automatic detection and classification of leukemia from blood smear image using senet convolutional neural network. J. Theor. Appl. Inf. Technol. 101, 6065–6075.
Shammi, S., Sohel, F., Diepeveen, D., Zander, S., and Jones, M. G. K. (2023). A survey of image-based computational learning techniques for frost detection in plants. Inf. Process Agric. 10, 164–191. doi: 10.1016/j.inpa.2022.02.003
Sharma, P., Kumar, M., Sharma, H. K., and Biju, S. M. (2024). Generative adversarial networks (GANs): introduction, taxonomy, variants, limitations, and applications. Multimed. Tools Appl. 83, 88811–88858. doi: 10.1007/s11042-024-18767-y
Shawly, T., and Alsheikhy, A. (2022). A biomedical diagnosis of leukemia using a deep learner classifier. Comput. Intell. Neurosci. 2022:1568375. doi: 10.1155/2022/1568375
Sounderajah, V., Ashrafian, H., Aggarwal, R., De Fauw, J., Denniston, A. K., Greaves, F., et al. (2020). Developing specific reporting guidelines for diagnostic accuracy studies assessing AI interventions: the STARD-AI steering group. Nat. Med. 26, 807–808. doi: 10.1038/s41591-020-0941-1
Sung, H., Ferlay, J., Siegel, R. L., Laversanne, M., Soerjomataram, I., Jemal, A., et al. (2021). Global cancer statistics 2020: GLOBOCAN estimates of incidence and mortality worldwide for 36 cancers in 185 countries. CA Cancer J. Clin. 71, 209–249. doi: 10.3322/caac.21660
Szegedy, C., Liu, W., Jia, Y., Sermanet, P., Reed, S., Anguelov, D., et al. (2015). “Going deeper with convolutions,” in Proceedings of the IEEE Conference on Computer Vision and Pattern Recognition, 1–9. doi: 10.1109/CVPR.2015.7298594
Tan, M., and Le, Q. (2019). “Efficientnet: rethinking model scaling for convolutional neural networks,” in International Conference on Machine Learning (PMLR), 6105–6114.
Tanha, J., Abdi, Y., Samadi, N., Razzaghi, N., and Asadpour, M. (2020). Boosting methods for multi-class imbalanced data classification: an experimental review. J. Big Data 7:70. doi: 10.1186/s40537-020-00349-y
Ud Din, I., Guizani, M., Hassan, S., Kim, B.-S., Khurram Khan, M., et al. (2019). The internet of things: a review of enabled technologies and future challenges. IEEE Access 7, 7606–7640. doi: 10.1109/ACCESS.2018.2886601
Veeraiah, N., Alotaibi, Y., and Subahi, A. F. (2023). MayGAN: mayfly optimization with generative adversarial network-based deep learning method to classify leukemia form blood smear images. Comput. Syst. Sci. Eng. 46, 2039–2058. doi: 10.32604/csse.2023.036985
Wang, L., Zhao, C., Shao, L., and Wu, Y. (2020). “UDenseNet: a universal dense convolutional network for image recognition,” in Chinese Conference on Pattern Recognition and Computer Vision (PRCV) (Cham: Springer International Publishing), 209–221. doi: 10.1007/978-3-030-60636-7_18
Wang, Q., Wang, J., Zhou, M., Li, Q., and Wang, Y. (2017). Spectral-spatial feature-based neural network method for acute lymphoblastic leukemia cell identification via microscopic hyperspectral imaging technology. Biomed. Opt. Express 8:3017. doi: 10.1364/BOE.8.003017
Wang, Q., Wang, J., Zhou, M., Li, Q., Wen, Y., Chu, J. A., et al. (2021). 3D attention networks for classification of white blood cells from microscopy hyperspectral images. Opt. Laser. Technol. 139:106931. doi: 10.1016/j.optlastec.2021.106931
Xi, L. J., Guo, Z. Y., Yang, X. K., and Ping, Z. G. (2023). Application of LASSO and its extended method in variable selection of regression analysis. Zhonghua Yu Fang Yi Xue Za Zhi 57, 107–111. doi: 10.3760/cma.j.cn112150-20220117-00063
Yue, S., Li, S., Huang, X., Liu, J., Hou, X., Zhao, Y., et al. (2022). Machine learning for the prediction of acute kidney injury in patients with sepsis. J. Transl. Med. 20:215. doi: 10.1186/s12967-022-03364-0
Zakaria, N., and Mohmad Hassim, Y. M. (2023). Improved image classification task using enhanced visual geometry group of convolution neural networks. JOIV Int. J. Inform. Vis. 7:2498. doi: 10.30630/joiv.7.4.1752
Zhang, X., Fang, R., Zhang, G., Fang, Y., Zhou, X., Ma, Y., et al. (2021). Research on transformer fault diagnosis: Based on improved firefly algorithm optimized LPboost–classification and regression tree. IET Gener. Transm. Distrib. 15, 2926–2942. doi: 10.1049/gtd2.12229
Zhao, H., Li, Z., He, W., and Zhao, Y. (2024). Hierarchical convolutional neural network with knowledge complementation for long-tailed classification. ACM Trans. Knowl. Discov. Data 18, 1–22. doi: 10.1145/3653717
Zhou, T., Ye, X., Lu, H., Zheng, X., Qiu, S., Liu, Y., et al. (2022). Dense convolutional network and its application in medical image analysis. Biomed Res. Int. 2022, 1–22. doi: 10.1155/2022/2384830
Zhou, Y., Chang, H., Lu, Y., Lu, X., and Zhou, R. (2021). Improving the performance of VGG through different granularity feature combinations. IEEE Access 9, 26208–26220. doi: 10.1109/ACCESS.2020.3031908
Zhu, T. (2020). Analysis on the applicability of the random forest. J. Phys. Conf. Ser. 1607:012123. doi: 10.1088/1742-6596/1607/1/012123
Keywords: artificial intelligence, acute myeloid leukemia, blood images, machine learning, neural networks, meta-analysis
Citation: Al-Obeidat F, Hafez W, Rashid A, Jallo MK, Gador M, Cherrez-Ojeda I and Simancas-Racines D (2025) Artificial intelligence for the detection of acute myeloid leukemia from microscopic blood images; a systematic review and meta-analysis. Front. Big Data 7:1402926. doi: 10.3389/fdata.2024.1402926
Received: 18 March 2024; Accepted: 23 December 2024;
Published: 17 January 2025.
Edited by:
Euijoon Ahn, James Cook University, AustraliaReviewed by:
Qingli Li, East China Normal University, ChinaMehul S. Raval, Ahmedabad University, India
Copyright © 2025 Al-Obeidat, Hafez, Rashid, Jallo, Gador, Cherrez-Ojeda and Simancas-Racines. This is an open-access article distributed under the terms of the Creative Commons Attribution License (CC BY). The use, distribution or reproduction in other forums is permitted, provided the original author(s) and the copyright owner(s) are credited and that the original publication in this journal is cited, in accordance with accepted academic practice. No use, distribution or reproduction is permitted which does not comply with these terms.
*Correspondence: Wael Hafez, V2guaGFmZXpAbnJjLnNjaS5lZw==; d2FlZWxoYWZlekB5YWhvby5jb20=; d2FlbC5oYWZlekBubWMuYWVvcmNpZC5vcmc=
†ORCID: Wael Hafez orcid.org/0000-0003-1203-0808
 Feras Al-Obeidat
 Wael Hafez
 Asrar Rashid
 Mahir Khalil Jallo
 Munier Gador
 Ivan Cherrez-Ojeda
 Daniel Simancas-Racines
