- Research Institute for Sustainable Humanosphere, Kyoto University, Uji, Japan
Equatorial plasma bubbles (EPBs) in the ionospheric F region are notorious for causing severe scintillation in radio signals, posing significant challenges for communication and navigation systems. Understanding and forecasting EPB occurrence is crucial from a space weather perspective, given their impact on satellite and terrestrial communication. In this study, we present the impacts of E-region conductivity on the generation of EPBs by using the 3D high-resolution bubble (HIRB) model. By changing the production rate of
1 Introduction
Equatorial plasma bubbles (EPBs) are large-scale plasma density depletions in the equatorial ionospheric F region, typically forming post-sunset due to the development of the Rayleigh–Taylor instability (e.g., Kelley, 2009; Woodman, 2009). This phenomenon was named EPB because the lower density region grows nonlinearly and penetrates through into the top of the F region. These bubbles can severely disrupt radio wave propagation by inducing scintillation in amplitude and phase, which affects communication and navigation systems that rely on ionospheric propagation. The concept of EPB was proposed by Woodman and LaHoz (1976) based on radar observations and supported by numerical simulations on a magnetic equatorial plane (Scannapieco and Ossakow, 1976). There have been a number of simulation studies of EPBs since the first outcome reported by Scannapieco and Ossakow (1976). The historical review of the numerical simulation studies of EPBs was presented by Yokoyama (2017).
Despite their critical importance, predicting the day-to-day variability of EPB occurrence remains a significant challenge due to the complex interplay of contributing factors. Several studies have addressed the day-to-day variability of the occurrence of EPBs (e.g., Abdu et al., 2009; Carter et al., 2014; Aa et al., 2023), but it was quite difficult to determine a key factor that controls their occurrence. From the modeling approach, the EPB occurrence characteristics were investigated by using a global atmosphere–ionosphere coupled model (Wu, 2015; Shinagawa et al., 2018; Pedatella et al., 2024). The linear growth rate of the Rayleigh–Taylor instability estimated from the simulated parameters shows reasonable seasonal and longitudinal patterns and strong day-to-day variability. Shinagawa et al. (2018) attributed the day-to-day variability to the forcing from the lower atmosphere. The ionospheric altitude variation driven from above (solar and geomagnetic activities) and below (atmospheric activities) makes the occurrence conditions of EPBs more complicated.
This paper aims to address this challenge by utilizing the 3D high-resolution bubble (HIRB) model, which provides a detailed framework for simulating EPB evolution under a range of ionospheric conditions and thereby improves our understanding of their behavior and predictability (Yokoyama et al., 2014; Yokoyama et al., 2015; Yokoyama et al., 2019). The spectral characteristics of the irregularities inside EPBs have been studied using the HIRB model (Rino et al., 2018b; a; Rino et al., 2023), and a comparison with radar observations has been conducted (Tulasi Ram et al., 2017; Tulasi Ram et al., 2020). In this study, we concentrate on the impact of the ionospheric E-region on the generation of EPBs. It has been known that the E-region conductivity contributes to the flux-tube-integrated linear growth rate of the Rayleigh–Taylor instability because the equatorial F region is coupled with the off-equatorial E region by the magnetic flux tube. To the best of our knowledge, however, such contribution of the E-region conductivity has not been carefully studied. Understanding the importance of E-region conductivity will help in understanding the day-to-day variability of EPB occurrence and the prediction of EPB occurrences in the future.
2 Model description
The high-resolution bubble (HIRB) model developed by Yokoyama et al. (2014) is used in this study. It incorporates an advanced 3D numerical simulation framework to accurately replicate the growth and dynamics of EPBs in the equatorial ionosphere. The governing equations in the model are the continuity (Equation 1) and momentum (Equations 2, 3) equations for
where
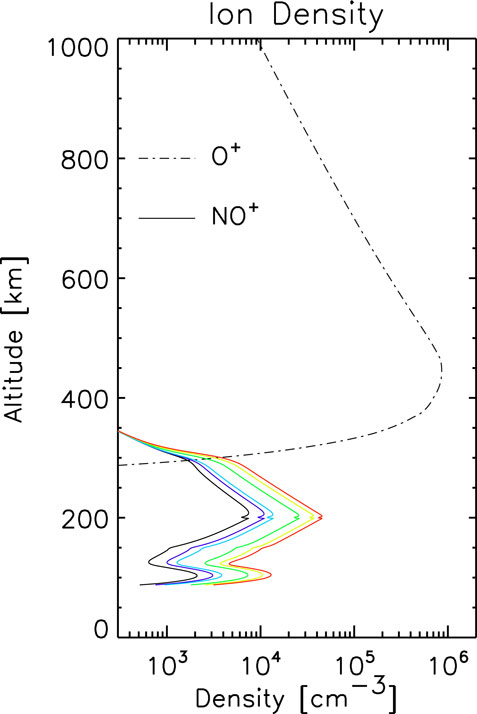
The simulation setting in this study is basically the same as those conducted in Yokoyama et al. (2014), except for the plasma density (
3 Results
Figure 1 shows plasma density profiles at the beginning of the simulations. Six solid lines indicate

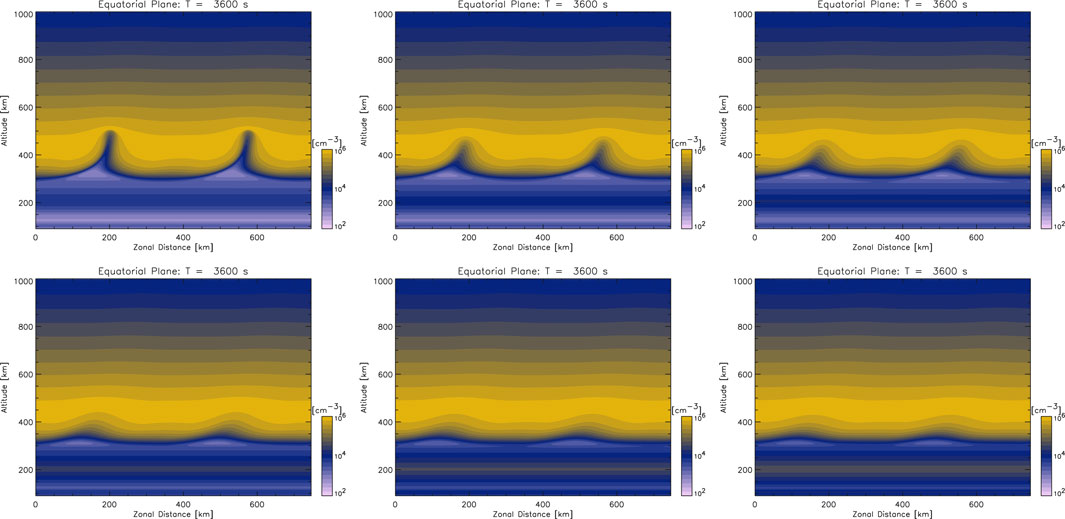
Figure 2. Plasma density distribution on a magnetic equatorial plane at

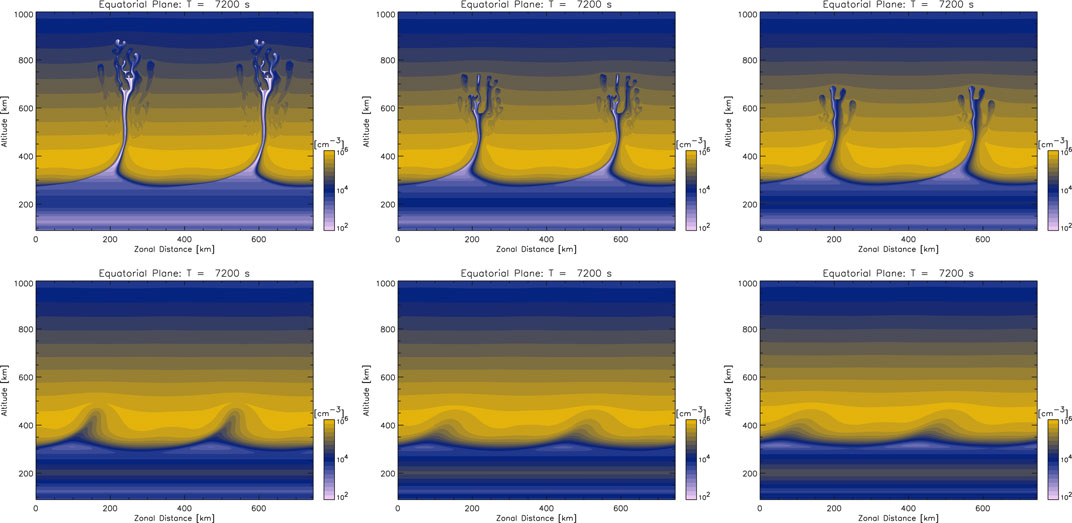
Figure 3. Same as Figure 2 at 7,200 s.
4 Discussion
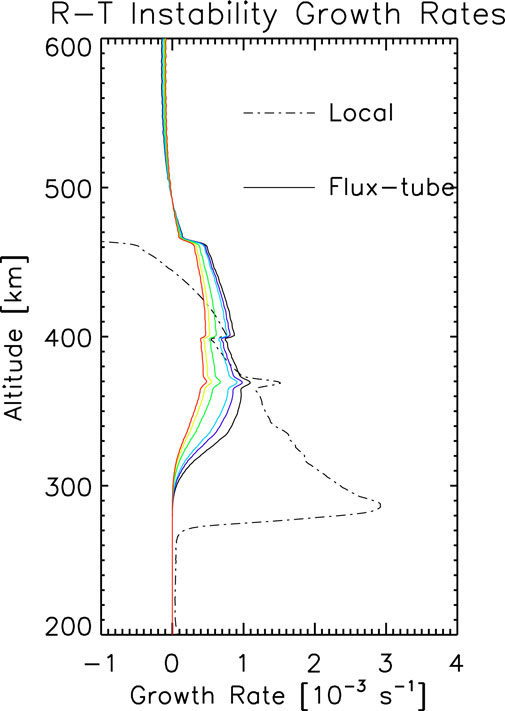
The local linear growth rate of Rayleigh–Taylor instability
This formula does not have an E region contribution to the growth rate. In the equatorial and low-latitude ionosphere, the equatorial F region is coupled with the off-equatorial E region along the magnetic flux tubes. The flux-tube-integrated linear growth rate of Rayleigh–Taylor instability
where
Figure 4 shows the local and flux-tube-integrated linear growth rate of Rayleigh–Taylor instability at the initial stage for the six simulation cases. The maximum value of the flux-tube-integrated growth rate for the six cases was
Even minor changes in the linear growth rate could lead to significant differences in EPB growth after a few hours. This finding is particularly important in real applications, where variability in E-region conductivity due to factors such as geomagnetic activity or lower atmosphere phenomena can lead to significant changes in EPB behavior. Furthermore, the impact of E-region conductivity on the temporal characteristics of EPBs may suggest that real-time measurements could be valuable for improving EPB forecasting. By integrating E-region conductivity data into predictive models, it may be possible to enhance the accuracy of forecasts and provide more reliable warnings for communication and navigation systems affected by EPBs.
Our simulation results, unfortunately, emphasize the difficulty of forecasting EPBs based on the growth rate estimation, even though we have access to multiple real-time observations. First, we need to obtain the flux-tube-integrated growth rate, which means ionospheric parameters along the magnetic flux tube, such as E-region plasma density at the off-equatorial regions. This information may only be available at limited longitude sectors where sufficient instruments have been installed. Second, even if sufficient observations are available to estimate the flux-tube-integrated growth rate, the threshold of the growth rate by which the evolution of EPBs should be judged is difficult to define. As shown in this study, a moderate variation of the growth rate becomes a significant difference in EPB growth into the top of the ionosphere. This is a major factor that has made forecasting EPB generation quite difficult for several decades.
5 Conclusion
This study advances our understanding of equatorial plasma bubble (EPB) dynamics by employing the 3D high-resolution bubble (HIRB) model to simulate and analyze EPB growth under various ionospheric E-region conditions. A key finding is the significant impact of E-region conductivity on EPB development, even when linear growth rates of the Rayleigh–Taylor instability (RTI) show moderate variation. Increased E-region conductivity leads to weaker EPB growth. This underscores the importance of considering E-region conductivity as a crucial factor in EPB forecasting models. Integrating real-time E-region conductivity measurements into forecasting models could further enhance their accuracy and reliability, offering better predictions and mitigation strategies for communication and navigation systems affected by EPBs. However, our results highlight that traditional linear growth rate analyses alone may not fully capture the complexities of EPB behavior and suggest the difficulty of predicting EPB generation in advance. Overall, this research contributes valuable insights into the intricate relationship between ionospheric parameters and EPB formation, emphasizing the need for a holistic approach to EPB modeling. Future work should focus on refining these models and incorporating additional factors to improve forecasting capabilities and better understand the nuances of EPB behavior.
Data availability statement
The raw data supporting the conclusions of this article will be made available by the authors, without undue reservation.
Author contributions
TY: conceptualization, data curation, formal analysis, funding acquisition, investigation, methodology, project administration, resources, software, supervision, validation, visualization, writing–original draft, and writing–review and editing.
Funding
The author(s) declare that financial support was received for the research, authorship, and/or publication of this article. This work was supported by JSPS KAKENHI Grant Numbers JP20K04037, JP20H00197, and JP22K21345. The computer simulation was mostly performed on the A-KDK computer system at the Research Institute for Sustainable Humanosphere, Kyoto University. This research is also supported by the Collaborative Research Project on Computer Science with High-Performance Computing at Nagoya University.
Conflict of interest
The author declares that the research was conducted in the absence of any commercial or financial relationships that could be construed as a potential conflict of interest.
The author(s) declared that they were an editorial board member of Frontiers, at the time of submission. This had no impact on the peer review process and the final decision.
Publisher’s note
All claims expressed in this article are solely those of the authors and do not necessarily represent those of their affiliated organizations, or those of the publisher, the editors, and the reviewers. Any product that may be evaluated in this article, or claim that may be made by its manufacturer, is not guaranteed or endorsed by the publisher.
References
Aa, E., Zhang, S.-R., Coster, A. J., Erickson, P. J., and Rideout, W. (2023). Multi-instrumental analysis of the day-to-day variability of equatorial plasma bubbles. Front. Astron. Space Sci. 10, 1167245. doi:10.3389/fspas.2023.1167245
Abdu, M. A., Batista, I. S., Reinisch, B. W., de Souza, J. R., Sobral, J. H. A., Pedersen, T. R., et al. (2009). Conjugate point equatorial experiment (COPEX) campaign in Brazil: electrodynamics highlights on spread f development conditions and day-to-day variability. J. Geophys. Res. 114, A04308. doi:10.1029/2008JA013749
Carter, B. A., Yizengaw, E., Retterer, J. M., Francis, M., Terkildsen, M., Marshall, R., et al. (2014). An analysis of the quiet time day-to-day variability in the formation of postsunset equatorial plasma bubbles in the southeast asian region. J. Geophys. Res. Space Phys. 119, 3206–3223. doi:10.1002/2013JA019570
Kelley, M. C. (2009). “The earth’s ionosphere: plasma physics and electrodynamics,” in Boston: int. Geophys. Ser. 2nd edn, 96. Academic Press.
Pedatella, N. M., Aa, E., and Maute, A. (2024). Quasi 6-day planetary wave oscillations in equatorial plasma irregularities. J. Geophys. Res. Space Phys. 129, e2023JA032312. doi:10.1029/2023ja032312
Rino, C., Carrano, C. S., Groves, K. M., and Yokoyama, T. (2018a). A configuration space model for intermediate-scale ionospheric structure. Radio Sci. 53, 1472–1480. doi:10.1029/2018RS006678
Rino, C., Yokoyama, T., and Carrano, C. (2018b). Dynamic spectral characteristics of high-resolution simulated equatorial plasma bubbles. Prog. Earth Planet. Sci. 5, 83. doi:10.1186/s40645-018-0243-0
Rino, C., Yokoyama, T., and Carrano, C. (2023). A three-dimensional stochastic structure model derived from high-resolution isolated equatorial plasma bubble simulations. Earth, Planets Space 75, 64. doi:10.1186/s40623-023-01823-6
Scannapieco, A. J., and Ossakow, S. L. (1976). Nonlinear equatorial spread F. Geophys. Res. Lett. 3, 451–454. doi:10.1029/gl003i008p00451
Shinagawa, H., Jin, H., Miyoshi, Y., Fujiwara, H., Yokoyama, T., and Otsuka, Y. (2018). Daily and seasonal variations in the linear growth rate of the Rayleigh–taylor instability in the ionosphere obtained with gaia. Prog. Earth Planet. Sci. 5, 16. doi:10.1186/s40645-018-0175-8
Sultan, P. J. (1996). Linear theory and modeling of the Rayleigh–Taylor instability leading to the occurrence of equatorial spread F. J. Geophys. Res. 101 (26), 26875–26891. doi:10.1029/96ja00682
Tsunoda, R. T., and White, B. R. (1981). On the generation and growth of equatorial backscatter plumes 1. Wave structure in the bottomside F layer. J. Geophys. Res. 86, 3610–3616. doi:10.1029/ja086ia05p03610
Tulasi Ram, S., Ajith, K. K., Yokoyama, T., Yamamoto, M., Hozumi, K., Shiokawa, K., et al. (2020). Dilatory and downward development of 3-m scale irregularities in the funnel-like region of a rapidly rising equatorial plasma bubble. Geophys. Res. Lett. 47, e2020GL087256. doi:10.1029/2020GL087256
Tulasi Ram, S., Ajith, K. K., Yokoyama, T., Yamamoto, M., and Niranjan, K. (2017). Vertical rise velocity of equatorial plasma bubbles estimated from Equatorial Atmosphere Radar (EAR) observations and HIRB model simulations. J. Geophys. Res. Space Phys. 122, 6584–6594. doi:10.1002/2017JA024260
Woodman, R. F. (2009). Spread F – an old equatorial aeronomy problem finally resolved? Ann. Geophys. 27, 1915–1934. doi:10.5194/angeo-27-1915-2009
Woodman, R. F., and LaHoz, C. (1976). Radar observations of F region equatorial irregularities. J. Geophys. Res. 81, 5447–5466. doi:10.1029/ja081i031p05447
Wu, Q. (2015). Longitudinal and seasonal variation of the equatorial flux tube integrated Rayleigh–taylor instability growth rate. J. Geophys. Res. Space Phys. 120, 7952–7957. doi:10.1002/2015JA021553
Yokoyama, T. (2017). A review on the numerical simulation of equatorial plasma bubbles toward scintillation evaluation and forecasting. Prog. Earth Planet. Sci. 4, 37. doi:10.1186/s40645-017-0153-6
Yokoyama, T., Jin, H., and Shinagawa, H. (2015). West wall structuring of equatorial plasma bubbles simulated by three-dimensional HIRB model. J. Geophys. Res. Space Phys. 120, 8810–8816. doi:10.1002/2015JA021799
Yokoyama, T., Jin, H., Shinagawa, H., and Liu, H. (2019). Seeding of equatorial plasma bubbles by vertical neutral wind. Geophys. Res. Lett. 46, 7088–7095. doi:10.1029/2019GL083629
Keywords: ionosphere, equatorial plasma bubbles, simulation, Rayleigh–Taylor instability, growth rate
Citation: Yokoyama T (2024) Simulation study of the impacts of E-region density on the growth of equatorial plasma bubbles. Front. Astron. Space Sci. 11:1502618. doi: 10.3389/fspas.2024.1502618
Received: 27 September 2024; Accepted: 23 October 2024;
Published: 04 December 2024.
Edited by:
David Hysell, Cornell University, United StatesReviewed by:
Eliana Nossa, The Aerospace Corporation, United StatesSampad Kumar Panda, K. L. University, India
Ercha Aa, Massachusetts Institute of Technology, United States
Qian Wu, National Center for Atmospheric Research (UCAR), United States
Copyright © 2024 Yokoyama. This is an open-access article distributed under the terms of the Creative Commons Attribution License (CC BY). The use, distribution or reproduction in other forums is permitted, provided the original author(s) and the copyright owner(s) are credited and that the original publication in this journal is cited, in accordance with accepted academic practice. No use, distribution or reproduction is permitted which does not comply with these terms.
*Correspondence: Tatsuhiro Yokoyama, eW9rb3lhbWFAcmlzaC5reW90by11LmFjLmpw
 Tatsuhiro Yokoyama
