- 1Department of Electrical Engineering, University of Colorado Denver, Denver, CO, United States
- 2Department of Physics and Astronomy, West Virginia University, Morgantown, WV, United States
Wave-particle interaction plays a crucial role in the dynamics of the Earth’s radiation belts. Cyclotron resonance between coherent whistler mode electromagnetic waves and energetic electrons of the radiation belts is often called a coherent instability. Coherent instability leads to wave amplification/generation and particle acceleration/scattering. The effect of wave on particle’s distribution function is a key component of the instability. In general, whistler wave amplitude can grow over threshold of quasi-linear (linear) diffusion theory which analytically tracks the time-evolution of a particle distribution. Thus, a numerical approach is required to model the nonlinear wave induced perturbations on particle distribution function. A backward test particle model is used to determine the energetic electrons phase space dynamics as a result of coherent whistler wave instability. The results show the formation of a phase space features with much higher resolution than is available with forward scattering models. In the nonlinear regime the formation of electron phase space holes upstream of a monochromatic wave is observed. The results validate the nonlinear phase trapping mechanism that drives nonlinear whistler mode growth. The key differences in phase-space perturbations between the linear and nonlinear scenarios are also illustrated. For the linearized equations or for low (below threshold) wave amplitudes in the nonlinear case, there is no formation of a phase-space hole and both models show features that can be characterized as linear striations or ripples in phase-space.
1 Introduction
The Earth’s magnetosphere can support various electromagnetic wave modes that play a vital role in near-Earth space dynamics. These electromagnetic waves of which the whistler mode is of particular importance, concurrently interact with higher energy radiation belt particles which are trapped in a magnetic mirror configuration of the geomagnetic field (Bell and Buneman, 1964; Helliwell, 1965; Kennel and Petschek, 1966; Lyons et al., 1972; Gendrin, 1981; Omura et al., 1991; Bortnik et al., 2008). Two primary aspects of whistler mode wave-particle interactions are the amplification of the waves by an unstable hot particle distribution, and the precipitation and/or acceleration of these particles by the waves. In general, modeling wave amplification along with particle scattering and acceleration is a difficult problem that requires a self-consistent solution to the Vlasov-Maxwell system of equations. Several researchers have approached the self-consistent problem using particle-in-cell (PIC) or hybrid simulations (Katoh and Omura, 2007; Gibby et al., 2008; Hikishima et al., 2010; Omura and Nunn, 2011; Wang et al., 2024); however, such computationally intensive self-consistent simulations can be unnecessary in scenarios where particle induced modifications to the wave are small and particle scattering by the waves is of greater interest. In other words, to investigate particle dynamics while minimizing computational costs, the test particle method can be employed, where the feedback of particles on the waves is neglected.
A common approach is to specify the wave-fields and neglect feedback from the particles which results in a simpler but only approximate system of equations. For small amplitude and incoherent signals such as plasmaspheric hiss, quasi-linear diffusion theory is a common method to track the time-evolution of a particle distribution (Kennel and Petschek, 1966; Inan et al., 1978; Abel and Thorne, 1998; Albert, 1999; Summers, 2005). For arbitrary wave-fields (which can go beyond the scope of linear theory), however, the dynamics of the particle distribution may need to be investigated using test particle simulations (Maldonado et al., 2016; Fu et al., 2019) or other methods (Hu and Krommes, 1994). Although test particle simulations have been successful in previous work, simulations with large-amplitude and coherent waves can still require many millions of particles to accurately describe the nonlinear phase-space dynamics of the particle distribution function (Dysthe, 1971; Matsumoto and Omura, 1981; Bell, 1984; Gibby et al., 2008; Nunn, 1974; Albert et al., 2012).
In order to alleviate the computational cost of traditional test-particle methods, a more efficient backward test particle solution to the Vlasov equation is employed here to evaluate the nonlinear effects of large-amplitude coherent waves on the energetic particle distribution function. The backward test particle approach exploits the conservation of phase space as articulated in Louisville’s theorem and permits determination of the prior state of a particle distribution if the wave-fields are known. Practically, this technique allows regions of interest in phase-space to be defined a priori which thus greatly reduces the number of particles that need to be tracked in the simulations and avoids complications from potential under sampling. The method has been previously utilized to efficiently model particle precipitation by coherent whistler mode waves since the loss-cone is well defined (Harid et al., 2014; Nunn and Omura, 2015). In addition, the technique is well-suited for analyzing acceleration to high energies and second-scale variations to the particle distribution function. In this work, the detailed temporal dynamics of the nonlinear wave-induced trap in phase-space are shown at a higher resolution than has been shown in previous works by full PIC (Figure 7 in Hikishima and Omura, 2012) or hybrid (Figure 4.9 in Harid, 2015) simulations. This high resolution allows for the accurate determination of “scattered” fields to investigate salient features of amplified and triggered magnetospheric waves.
2 Theory
The mathematical basis of modeling wave-particle interactions is via the Vlasov-Maxwell system of equations. The Vlasov equation governs the evolution of electron (with mass of m, and charge of q) phase space density
where the quantities
For a circularly polarized whistler mode wave with frequency
Counter streaming electrons that travel at the appropriate positive velocity will experience an approximately static wave fields and significant energy exchange. This is referred to as Doppler shifted cyclotron resonance or gyro-resonance where resonance velocity (
The terms
Maxwell’s equations govern the evolution of the wave electric and magnetic fields, but the wave equations in a magneto-plasma can be simplified under the assumption of a narrowband modulating wavepacket, given the coherence of the signals observed in the data. The term
These narrowband wave equations have the advantage of separately quantifying the effect of the wave growth and frequency change and can provide useful physical intuition behind the evolution of a wavepacket that is propagating at the group velocity (
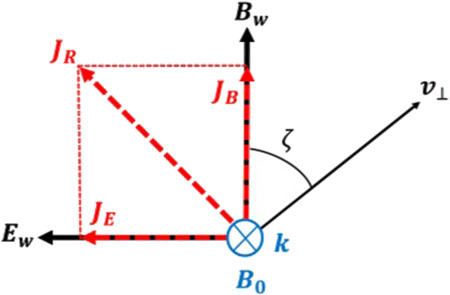
The geometry of the resonant currents (
The dynamics of resonant electrons in a monochromatic whistler mode wave field (
where
Here the variable
Differentiating Equation 12 with respect to time and plugging into Equation 13, results in a nonlinear ordinary differential equation which represents a forced pendulum equation where the forcing term is proportional to
For
Of particular importance is the formation of a wave-induced trap in phase-space which changes structure depending on the location along the geomagnetic field line. Figure 2 shows the shape of the phase-space trap at several positions (for a monochromatic whistler mode wave) (Gołkowski et al., 2019). The variable
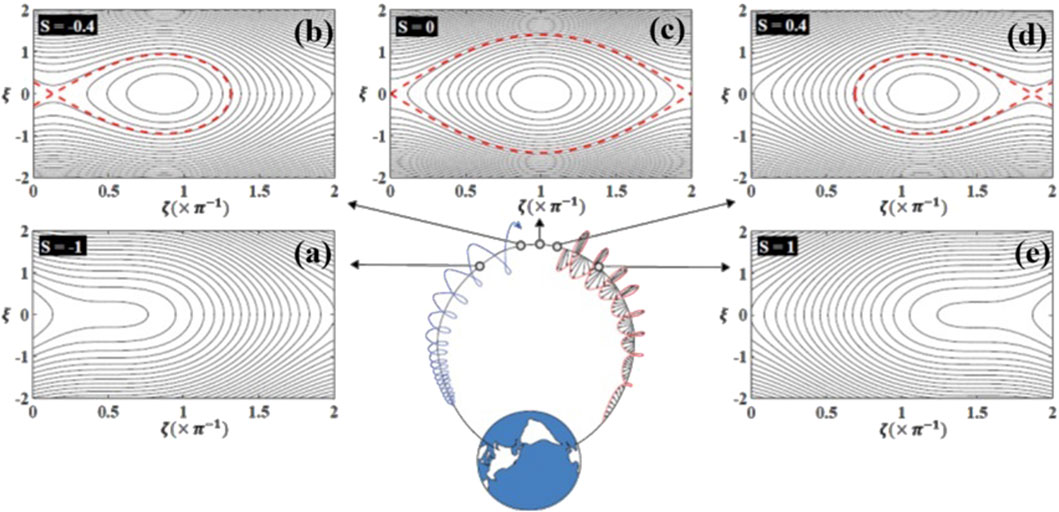
Figure 2. Phase-space trap along the field line at a (A) S =-1, (B) S = -0.4, (C) S = 0, (D) S = -0.4, and (E) S =1 (Gołkowski et al., 2019).
The trapped trajectories correspond to closed curves in phase-space while the untrapped particles follow open curves. The trapped and untrapped electron populations are separated by a boundary known as a separatrix and are shown by the red contours. Formally, the separatrix can only exist when
3 Backward test particle model
The backward test particle numerical model essentially solves the Vlasov Equation 1 for a given wave at a particular location along the geomagnetic field line. Since the Vlasov equation is an advective-type partial differential equation (PDE), information propagates around phase space in a complicated manner. An accurate method of computing the distribution is by using the method of characteristics, which in the context of Vlasov equation is equivalent to Liouville’s theorem. By neglecting the transverse spatial motion of electrons and only considering spatial variation along the field line, the Vlasov Equation 1, can be written as Equation 16:
where the terms in parenthesis corresponds to equations of motion in Equations 8–11. This is done by considering characteristic curves, which are curves along which the distribution function is advected. This turns the PDE into a set of ODEs. More specifically, consider a general advection equation as:
This type of equation describes advection of the quantity
The original advection Equation 17 can only be satisfied if
The simulations use an interaction region that is approximately
where the parameter
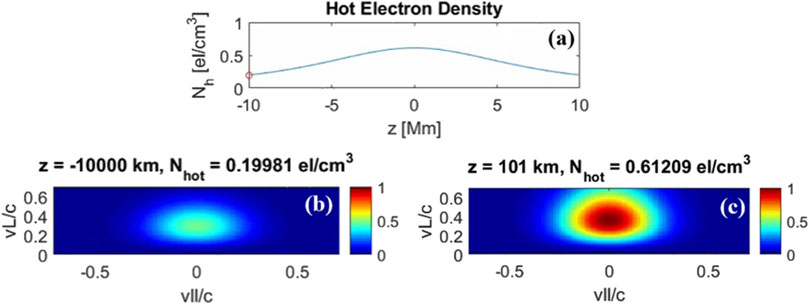
Figure 3. (A) Hot electron density as a function of position along the field line, and Subtracted bi-Maxwellian distribution function at a distance (B) −10,000 km and (C) 101 km from the magnetic equator, with
The wave fields are taken into account by illuminating the entrance of the interaction region with an input signal and using this as a boundary condition for the wave equations. A fourth-order Runge-Kutta (RK4) time-stepping scheme is used to evolve Equations 8–11. The wave equation is time stepped using a semi-Lagrangian scheme with cubic spline interpolation.
For a distribution function of this form, the pitch angle anisotropy is given by
4 Results
We first use BTP model to explore a small number of particle trajectories as has been done in other works using forward time stepping methods (Inan, 1977; Albert, 2002; Tao et al., 2012) to illustrate some basic physical phenomena. The test particle trajectories will be compared to the linearized equations of motion to emphasize the need for a scattering model which includes both linear and nonlinear effects. Afterwards, the backward test particle model is used to investigate particle scattering and dynamics of the distribution function.
4.1 Test particle trajectories
The BTP code used in the context of a test particle simulation basically treats a few phase space points as test particles and traces them backwards to create the trajectories. Tracing the test particles backward is done by solving the exact same equations of motion as in the BTP approach, but instead of a lot of particles sampled to represent the distribution function, only a few test particles are evaluated to examine their motion in phase (velocity) space.
Figure 4 shows test particle trajectories for a monochromatic constant amplitude wave. The trajectories using the nonlinear expressions (panel b) are compared to those obtained when the equations of motion are linearized around the adiabatic motion (panel a) [Harid et al., 2014, Appendix A, Equations A6-A7]. As is shown in the left panel (Figure 4A), for an assumed dipole geomagnetic field, the phase trapped resonant particles do not appear in the linearized trajectories. All particles are uniformly distribution in gyrophase with the same value of
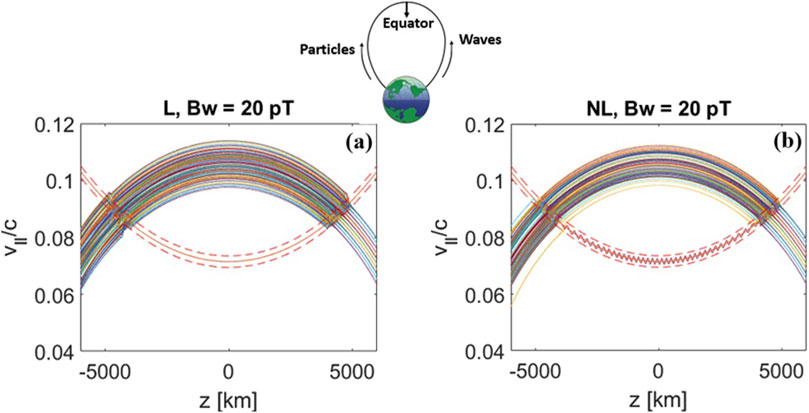
Figure 4. Linear L, panel (A) and nonlinear NL, panel (B) test particle trajectories for a monochromatic constant amplitude wave. In both cases, the majority of particles follow adiabatic motion along the rainbow shaped curve, with only slight perturbations when they intersect the orange resonance curve. In the nonlinear (NL) case (panel b), a few particle trajectories are visible along the orange cyclotron resonance curve. These particles are phase trapped and forced to stay in resonance with the wave.
The phase trapped particles are released when the geomagnetic gradient increases to a level where the trapping condition (
For a wave amplitude lower than nonlinear threshold, for instance
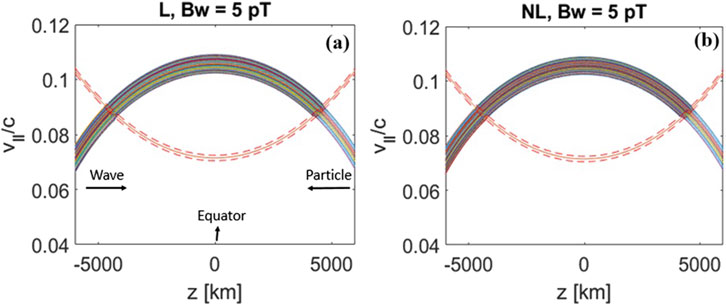
Figure 5. Test particle trajectories for a monochromatic constant lower (5 pT) amplitude wave. For this lower amplitude the (A) linear and (B) nonlinear models yield the same results.
4.2 Short pulse - detrapping
In the previous section, we showed the test particle trajectories for the constant wave amplitude and the wave filling the entire simulation domain along the geomagnetic field. These simulation results demonstrate important physical concepts behind wave-particle interactions, such as phase trapping once the wave amplitude is above the nonlinear trapping threshold. A more typical scenario inspired by ground based observations is when a wave of limited duration propagates through the interaction region (Inan et al., 1982; Hosseini et al., 2017). More specifically, such monochromatic pulses are not long enough in time (or space) to fill out the entire simulation domain, which introduces unique effects at the front and back end of the pulse.
Figure 6B shows the test particle trajectories for an injected traveling 0.5-s pulse with wave amplitude of 60 pT and compares it to a “long” pulse (Figure 6A) that fills the whole simulation space as the results in Section 4.1. Large amplitude (up to 3–8 nT) of whistler mode waves are reported from in situ observations (Wilson III et al., 2011; Santolík et al., 2014). Such waves can be naturally occurring chorus waves, waves from lightning or waves from transmitters. As is shown in Figure 6B, once the wave front reaches the particles location, some of the particles get phase trapped and stay in resonance with the wave until the back end of the traveling wave leaves the particle location. Once the particles that have been phase trapped by the travelling wave are let go by the wave (detrapping), they keep traveling on adiabatic trajectories. If the detrapped particles hold their phase-bunched (coherence) characteristic for a few trapping periods after they exit the wave field, they are capable of radiating either a falling or rising emission (Roux and Pellat, 1978). To be more specific, the phase-bunched particles traveling on adiabatic trajectories are capable of creating coherent resonant currents that radiate Doppler shifted frequencies in a manner of an end fire antenna (Helliwell and Crystal, 1973; Nunn, 1974). It is worth noting that at this stage (after detrapping) the injected wave has left the particles, and the radiated frequencies are associated with “free running” triggered waves (Harid et al., 2022; Tao et al., 2021).
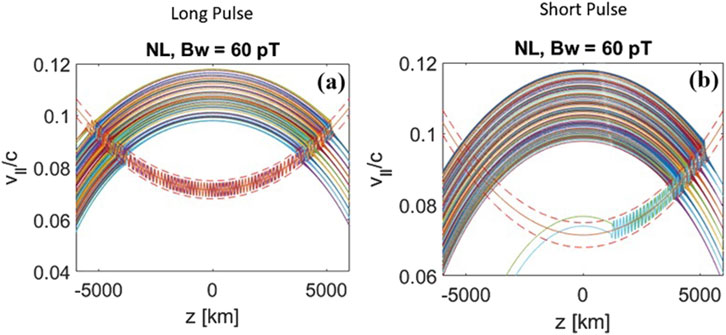
Figure 6. Test particle trajectories for an injected short (0.5 s) pulse with wave amplitude of 60 pT right panel (B) compared to a “long” pulse left panel (A) that fills the simulation space.
If the conversion to adiabatic motion takes place before (after) the equator toward a region of lower (higher) gyrofrequency, the radiated frequencies are frequency-time risers (fallers). This finding is consistent with change of fallers to risers in the experimental data when transmitted pulse duration is changed (Li et al., 2014). Specifically, Helliwell and Katsufrakis (1974) showed that fallers are generated by short pulses up to
The above-described backward test particle (BTP) simulation demonstrates some important physical concepts of individual particle motion such as phase trapping, detrapping, and the possibility of end-fire antenna radiation. In this section, we use the BTP approach which solves the same equations of motion for sampled phase space grid points sampled to represent the distribution function. This backward scheme thus investigates the dynamic of the phase space distribution function for a counter-streaming whistler mode pulse.
The shape of the phase space trap changes along the geomagnetic field line. The top panels (d-f) of Figure 7 shows the structure of the phase space trap at several position along the field line for a monochromatic constant amplitude whistler mode wave. As a reminder,
where zero value on the vertical axis corresponds to the resonance velocity. The closed curves in phase-space correspond to the trapped trajectories that are separated by the separatrix from the open curves representing untrapped particles. The separatrix is shown on the contours as a red dashed line in the top panels of Figures 7D–F. Trapped particles that are forced to remain in resonance from their initial contact with the wave for a long period of time, moving toward the equator, drag the value of their distribution function to phase space locations that are upstream. Here, downstream is the direction of the wave propagation, the resonant particles travel in the opposite direction so they travel upstream, As shown in the test particle (see Figure 4), electrons that are trapped downstream of the wave will start at a higher value of
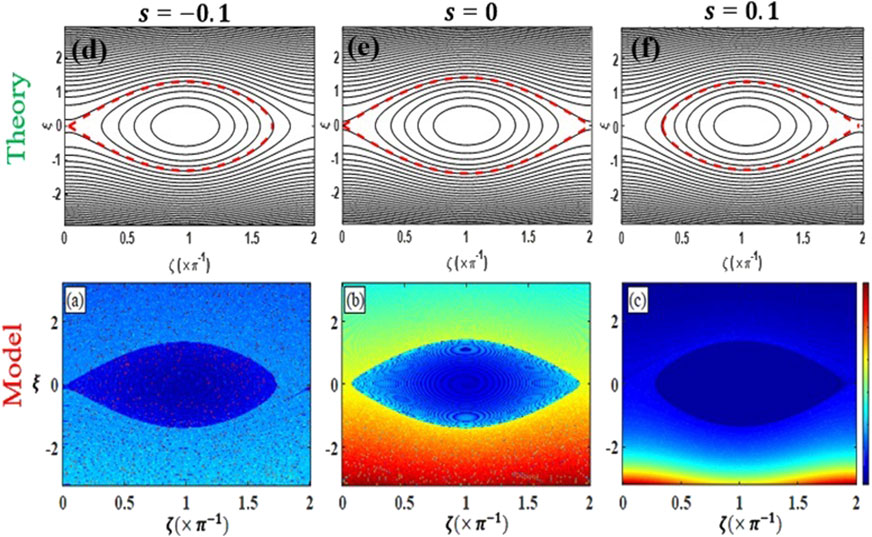
Figure 7. Formation of phase-space electron hole from test particle trajectories. (A) upstream location, (B) equator, and (C) downstream location relative to the wave propagation direction compared to theory (D–F).
By running test particle trajectories backwards in time, and using Liouville’s theorem, the distribution function can be reconstructed in high resolution. It is important to note that running the simulation backwards in time means that we can have arbitrary resolution of the perturbed distribution as this maps to known coordinates of the known initial distribution. In contrast, when simulations are run forward in time, it is not clear how finely the initial distribution must be sampled in phase space to capture all salient features of the disturbed distribution. For the case of a monochromatic and constant amplitude wave, the bottom panels of Figures 7A–C shows the electron hole for three different locations along the field line (upstream (a), equator (b), and downstream (c) of the wave). It is worth noting that the concept of
One should note that for a short pulse (or higher pitch angles) the opposite can occur and an “electron hill” can be formed as well (Nunn and Omura, 2012; Hikishima and Omura, 2012). It is worth noting that the trapping mechanism transports one region of phase space to another, carrying with it the phase space density from one location and displacing the one that would be there from adiabatic motion. Whether a hole or hill is formed depends on where the particles are initially trapped and the value of their resonance velocity when they are released as compared to the adiabatic background. Here the wave has sufficient amplitude that the leading edge of the wave pulse immediately phase traps electrons that are locally resonant. The initial location of trapping is a function of time, changing as the wave propagates downstream. The electrons will be de-trapped when they are no longer under the influence of the wave. Therefore, where the electrons exit the trap depends on the length of the pulse in time which is proportional to its length in physical space. The exit location also changes in time and can be before the particles reach the equator, at the equator or upstream of the equator on the other side. For a constant frequency considered here, a phase space hole is formed for particles trapped downstream of the equator and released on the downstream side of the equator or at the equator. A hill will be formed if particles are released upstream of the equator. Such electrons are trapped initially closer to the equator and released farther away so they are transported to a higher resonant velocity. In the above discussion we have assumed that the pitch angles are low enough so that they do not limit the interaction length with the wave. Higher pitch angles limit the interaction length, so they have the same effect as a shortened pulse length.
For a monochromatic constant wave amplitude higher than the trapping threshold, the electron hole exists when
Figure 8 shows the phase space distribution for five different locations along the field line (z = 1750, 750, −250, −1,250, and −2,250 km) at three specific times (t = 0.24 s (Figure 8A), 0.30 s (Figure 8G), and 0.35 s (Figure 8M) after injection of a monochromatic 0.5 s pulse. At
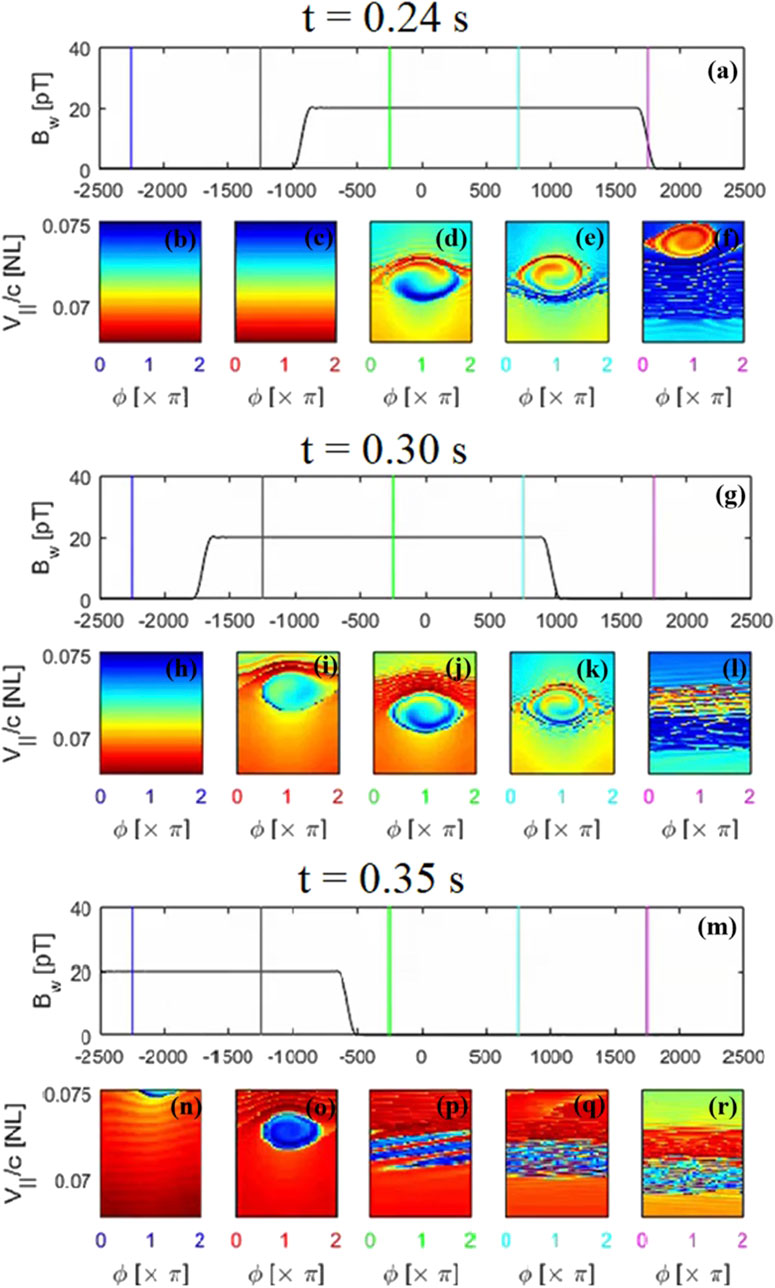
Figure 8. Phase space distribution for five different locations [z = 1,750 km (F, L, R), 750 km (E, K, Q), −250 km (D, J, P), −1,250 km (C, I, O), and −2,250 km (B, H, N)] along the field line at three specific times [t = 0.24 s (A), 0.30 s (G), and 0.35 s (M)].
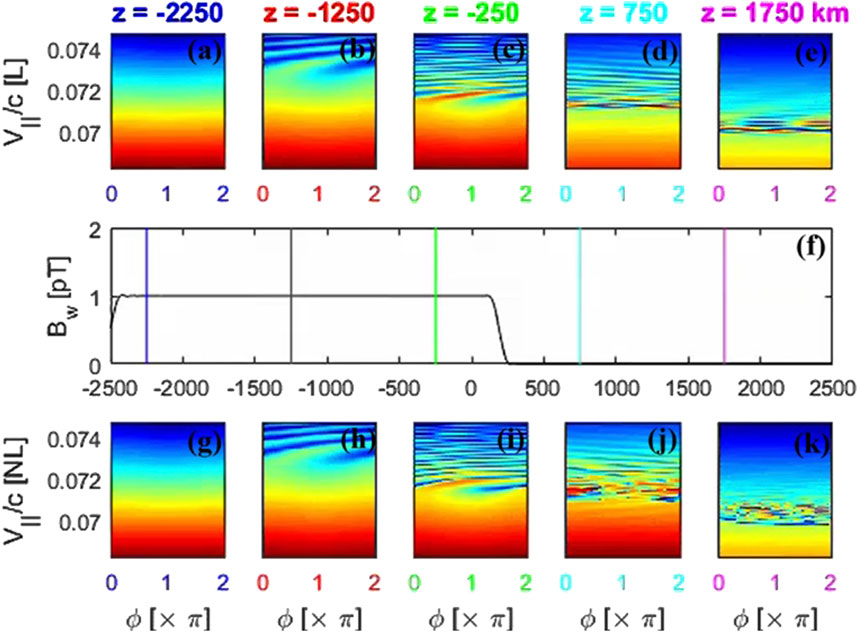
Figure 9. Linear scattered particle distribution (top a-e panels) for five different locations [z = 1,750 km (A), 750 km (B), −250 km (C), −1,250 km (D), and −2,250 km (E)] along the field line at (F)
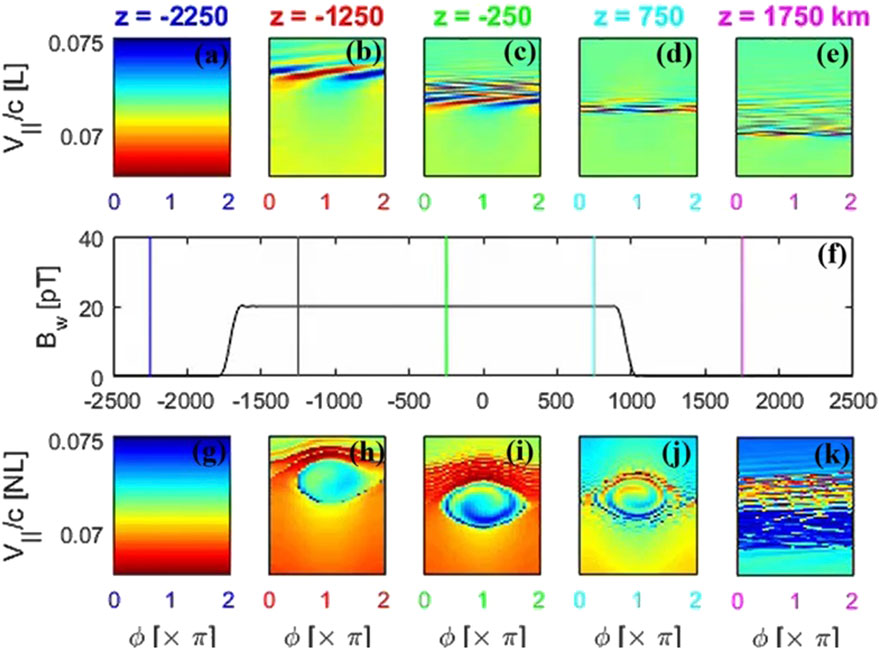
Figure 10. Linear scattered particle distribution (top a-e panels) for five different locations [z = 1,750 km (A), 750 km (B), −250 km (C), −1,250 km (D), and −2,250 km (E)] along the field line at (F)
At
At
5 Comparison to linear theory
As mentioned before, phase trapping is a nonlinear process and therefore is not in the scope of linear scattering theory. The distribution function is calculated when particles are linearly scattered by the wave. The linearly scattered distribution can be reconstructed by running test particle trajectories backwards in time over linearized equations of motion and employing Liouville’s theorem. The goal was to be able to compare the distribution dynamic in the linear regime with the results when full equations of motion are considered in constructing the distribution function.
Figure 9 shows the Linear scattered particle distribution (top a-e panels) for five different locations (z = 1750, 750, −250, −1,250, and −2,250 km) along the field line at
Following the previous Figure setup, Figure 10 shows the distribution function for a
6 Conclusion
We developed a backward test particle numerical model that calculates scattering of the energetic electrons distribution by coherent whistler mode waves. This model requires specifying the wave fields a priori and is quite useful at evaluating the effect of waves on the particles in terms of scattering. This study provides important insights into the nonlinear dynamics of wave-particle interactions in Earth’s radiation belts, particularly through the lens of coherent whistler wave instability and whistler mode wave amplification. By utilizing a backward test particle model, we have demonstrated the formation of distinct phase space structures, such as electron phase space holes, in the nonlinear regime, which are not present under linear conditions. These findings underscore the limitations of quasi-linear diffusion theory in capturing the full scope of wave-induced perturbations. The differences observed between the linear and nonlinear perturbations confirm the significant role of nonlinear phase trapping in driving the amplification of whistler mode waves. Although, the presented model is not able to reproduce the effect of the particles on the wave’s amplitude and phase, the formation of nonlinear structures in phase-space can be obtained and analyzed and the expected radiation currents from the perturbed distribution can be evaluated. These results contribute to a more comprehensive understanding of radiation belt dynamics and the complex processes involved in particle acceleration and scattering, with implications for future studies in space weather modeling and the prediction of radiation belt behavior.
Data availability statement
The raw data supporting the conclusions of this article will be made available by the authors, without undue reservation.
Author contributions
PH: Formal Analysis, Visualization, Writing–original draft, Writing–review and editing. VH: Conceptualization, Methodology, Supervision, Writing–review and editing. MG: Funding acquisition, Investigation, Project administration, Resources, Supervision, Writing–review and editing. WT: Funding acquisition, Resources, Writing–review and editing, Supervision.
Funding
The author(s) declare that financial support was received for the research, authorship, and/or publication of this article. The authors acknowledge support from NSF Award AGS 2312282 to University of Colorado Denver and NASA grants 80NSSC21K1312 and 80NSSC21K2008 to West Virginia University.
Conflict of interest
The authors declare that the research was conducted in the absence of any commercial or financial relationships that could be construed as a potential conflict of interest.
Publisher’s note
All claims expressed in this article are solely those of the authors and do not necessarily represent those of their affiliated organizations, or those of the publisher, the editors and the reviewers. Any product that may be evaluated in this article, or claim that may be made by its manufacturer, is not guaranteed or endorsed by the publisher.
References
Abel, B., and Thorne, R. M. (1998). Electron scattering loss in Earth’s inner magnetosphere: 1. Dominant physical processes. J. Geophys. Res. 103, 2385–2396. doi:10.1029/97JA02919
Albert, J. M. (1999). Analysis of quasi-linear diffusion coefficients. J. Geophys. Res. 104 (A2), 2429–2441. doi:10.1029/1998JA900113
Albert, J. M. (2002). Nonlinear interaction of outer zone electrons with VLF waves. Geophys. Res. Lett. 29 (8), 116–1. doi:10.1029/2001gl013941
Albert, J. M., Tao, X., and Bortnik, J. (2012). “Aspects of nonlinear wave-particle interactions,” in Dynamics of the Earth’s radiation belts and inner magnetosphere. Geophys. Monogr. Ser. Editor D. Summers (Washington, D. C.: AGU), 199, 255–264. doi:10.1029/2012GM001324
Bell, T. F. (1984). The nonlinear gyroresonance interaction between energetic electrons and coherent VLF waves propagating at an arbitrary angle with respect to the Earth’s magnetic field. J. Geophys. Res. 89 (A2), 905–918. doi:10.1029/JA089iA02p00905
Bell, T. F., and Buneman, O. (1964). Plasma instability in the whistler mode caused by a gyrating electron stream. Phys. Rev. 133, A1300–A1302. doi:10.1103/PhysRev.133.A1300
Bell, T. F., and Inan, U. S. (1981). Transient nonlinear pitch angle scattering of energetic electrons by coherent VLF wave packets in the magnetosphere. J. Geophys. Res. Space Phys. 86 (A11), 9047–9063. doi:10.1029/ja086ia11p09047
Bortnik, J., Thorne, R. M., and Inan, U. S. (2008). Nonlinear interaction of energetic electrons with large amplitude chorus. Geophys. Res. Lett. 35, L21102. doi:10.1029/2008GL035500
Carpenter, D. L., and Anderson, R. R. (1992). An ISEE/whistler model of equatorial electron density in the magnetosphere. J. Geophys. Res. 97, 1097–1108. doi:10.1029/91JA01548
Chen, H., Wang, X., Chen, L., Zhang, X. J., Omura, Y., Chen, R., et al. (2024a). Nonlinear electron trapping through cyclotron resonance in the formation of chorus subpackets. Geophys. Res. Lett. 51 (11), e2024GL109481. doi:10.1029/2024gl109481
Chen, H., Wang, X., Zhao, H., Lin, Y., Chen, L., Omura, Y., et al. (2024b). Electron dynamics associated with advection and diffusion in self-consistent wave-particle interactions with oblique chorus waves. Geophys. Res. Lett. 51 (14), e2024GL110362. doi:10.1029/2024gl110362
Dowden, R. L., McKay, A. D., Amon, L. E. S., Koons, H. C., and Dazey, M. H. (1978). Linear and nonlinear amplification in the magnetosphere during a 6.6-kHz transmission. J. Geophys. Res. Space Phys. 83 (A1), 169–181. doi:10.1029/ja083ia01p00169
Dysthe, K. B. (1971). Some studies of triggered whistler emissions. J. Geophys. Res. 76 (28), 6915–6931. doi:10.1029/JA076i028p06915
Fu, S., Ni, B., Zhou, R., Cao, X., and Gu, X. (2019). Combined scattering of radiation belt electrons caused by Landau and bounce resonant interactions with magnetosonic waves. Geophys. Res. Lett. 46 (17-18), 10313–10321. doi:10.1029/2019gl084438
Gendrin, R. (1981). General relationships between wave amplification and particle diffusion in a magnetoplasma. Rev. Geophys. 19 (1), 171–184. doi:10.1029/RG019i001p00171
Gibby, A. R., Inan, U. S., and Bell, T. F. (2008). Saturation effects in the VLF-triggered emission process. J. Geophys. Res. 113, A11215. doi:10.1029/2008JA013233
Gołkowski, M., Harid, V., and Hosseini, P. (2019). Review of controlled excitation of non-linear wave-particle interactions in the magnetosphere. Front. Astronomy Space Sci. 6, 2. doi:10.3389/fspas.2019.00002
Harid, V., Gołkowski, M., Bell, T., and Inan, U. S. (2014). Theoretical and numerical analysis of radiation belt electron precipitation by coherent whistler mode waves. J. Geophys. Res. Space Phys. 119 (6), 4370–4388. doi:10.1002/2014ja019809
Harid, V. (2015). Coherent interactions between whistler mode waves and energetic electrons in the Earth's radiation belts: Stanford University
Harid, V., Gołkowski, M., Hosseini, P., and Kim, H. (2022). Backward-propagating source as a component of rising tone whistler-mode chorus generation. Front. Astronomy Space Sci. 9, 981949. doi:10.3389/fspas.2022.981949
Helliwell, R. A. (1965). VLF wave stimulation experiments in the magnetosphere from Siple Station, Antarctica. Rev. Geophys. 26 (3), 551–578. doi:10.1029/RG026i003p00551
Helliwell, R. A., and Crystal, T. L. (1973). A feedback model of cyclotron interaction between whistler-mode waves and energetic electrons in the magnetosphere. J. Geophys. Res. 78 (31), 7357–7371. doi:10.1029/ja078i031p07357
Helliwell, R. A., and Katsufrakis, J. P. (1974). VLF wave injection into the magnetosphere from Siple Station, Antarctica. J. Geophys. Res. 79 (16), 2511–2518. doi:10.1029/ja079i016p02511
Hikishima, M., and Omura, Y. (2012). Particle simulations of whistler-mode rising-tone emissions triggered by waves with different amplitudes. J. Geophys. Res. Space Phys. 117 (A4). doi:10.1029/2011ja017428
Hikishima, M., Omura, Y., and Summers, D. (2010). Self-consistent particle simulation of whistler mode triggered emissions. J. Geophys. Res. 115, A12246. doi:10.1029/2010JA015860
Hosseini, P., Golkowski, M., and Turner, D. L. (2017). Unique concurrent observations of whistler mode hiss, chorus, and triggered emissions. J. Geophys. Res. Space Phys. 122, 6271–6282. doi:10.1002/2017ja024072
Hu, G., and Krommes, J. A. (1994). Generalized weighting scheme for δf particle-simulation method. Phys. plasmas 1 (4), 863–874. doi:10.1063/1.870745
Inan, U. S. (1977). Non-linear gyroresonant interactions of energetic particles and coherent VLF waves in the magnetosphere Doctoral dissertation. Stanford University.
Inan, U. S., Bell, T. F., and Chang, H. C. (1982). Particle precipitation induced by short-duration VLF waves in the magnetosphere. J. Geophys. Res. 87, 6243–6264. doi:10.1029/JA087iA08p06243
Inan, U. S., Bell, T. F., and Helliwell, R. A. (1978). Nonlinear pitch angle scattering of energetic electrons by coherent VLF waves in the magnetosphere. J. Geophys. Res. 83 (A7), 3235–3253. doi:10.1029/JA083iA07p03235
Katoh, Y., and Omura, Y. (2007). Computer simulation of chorus wave generation in the Earth’s inner magnetosphere. Geophys. Res. Lett. 34, L03102. doi:10.1029/2006GL028594
Kennel, C. F., and Petschek, H. E. (1966). Limit on stably trapped particle fluxes. J. Geophys. Res. 71, 1–28. doi:10.1029/jz071i001p00001
Li, J. D., Spasojevic, M., Harid, V., Cohen, M. B., Gołkowski, M., and Inan, U. (2014). Analysis of magnetospheric ELF/VLF wave amplification from the Siple Transmitter experiment. J. Geophys. Res. Space Phys. 119 (3), 1837–1850. doi:10.1002/2013ja019513
Lyons, L. R., Thorne, R. M., and Kennel, C. F. (1972). Pitch-angle diffusion of radiation belt electrons within the plasmasphere. J. Geophys. Res. 77 (19), 3455–3474. doi:10.1029/JA077i019p03455
Maldonado, A. A., Chen, L., Claudepierre, S. G., Bortnik, J., Thorne, R. M., and Spence, H. (2016). Electron butterfly distribution modulation by magnetosonic waves. Geophys. Res. Lett. 43 (7), 3051–3059. doi:10.1002/2016gl068161
Matsumoto, H., and Omura, Y. (1981). Cluster and channel effect phase bunchings by whistler waves in the nonuniform geomagnetic field. J. Geophys. Res. 86 (A2), 779–791. doi:10.1029/JA086iA02p00779
Nunn, D. (1974). A self-consistent theory of triggered VLF emissions. Planet. Space Sci. 22, 349–378. doi:10.1016/0032-0633(74)90070-1
Nunn, D., and Omura, Y. (2012). A computational and theoretical analysis of falling frequency VLF emissions. J. Geophys. Res. Space Phys. 117 (A8). doi:10.1029/2012ja017557
Nunn, D., and Omura, Y. (2015). A computational and theoretical investigation of nonlinear wave-particle interactions in oblique whistlers. J. Geophys. Res. Space Phys. 120 (4), 2890–2911. doi:10.1002/2014ja020898
Omura, Y., Katoh, Y., and Summers, D. (2008). Theory and simulation of the generation of whistler-mode chorus. J. Geophys. Res. 113, A04223. doi:10.1029/2007JA012622
Omura, Y., Matsumoto, H., Nunn, D., and Rycroft, M. J. (1991). A review of observational, theoretical and numerical studies of VLF triggered emissions. J. Atmos. Terr. Phys. 53, 351–368. doi:10.1016/0021-9169(91)90031-2
Omura, Y., and Nunn, D. (2011). Triggering process of whistler mode chorus emissions in the magnetosphere. J. Geophys. Res. 116, A05205. doi:10.1029/2010JA016280
Omura, Y., and Summers, D. (2006). Dynamics of high-energy electrons interacting with whistler mode chorus emissions in the magnetosphere. J. Geophys. Res. Space Phys. 111 (A9). doi:10.1029/2006ja011600
Ozaki, M., Mizote, K., Kondo, T., Yagitani, S., Hikishima, M., and Omura, Y. (2024). Suppression of nonlinear chorus wave growth by active control of gyroresonant interactions with electron hole deformation. Geophys. Res. Lett. 51, e2024GL112218. doi:10.1029/2024GL112218
Roux, A., and Pellat, R. (1978). A theory of triggered emissions. J. Geophys. Res. 83 (A4), 1433–1441. doi:10.1029/JA083iA04p01433
Santolík, O., Kletzing, C. A., Kurth, W. S., Hospodarsky, G. B., and Bounds, S. R. (2014). Fine structure of large-amplitude chorus wave packets. Geophys. Res. Lett. 41 (2), 293–299. doi:10.1002/2013gl058889
Summers, D. (2005). Quasi-linear diffusion coefficients for field-aligned electromagnetic waves with applications to the magnetosphere. J. Geophys. Res. 110, A08213. doi:10.1029/2005JA011159
Tao, X., Bortnik, J., Albert, J. M., and Thorne, R. M. (2012). Comparison of bounce-averaged quasi-linear diffusion coefficients for parallel propagating whistler mode waves with test particle simulations. J. Geophys. Res. Space Phys. 117 (A10). doi:10.1029/2012ja017931
Tao, X., Zonca, F., and Chen, L. (2021). A “trap-release-amplify” model of chorus waves. J. Geophys. Res. Space Phys. 126 (9), e2021JA029585. doi:10.1029/2021ja029585
Wang, X., Chen, H., Omura, Y., Hsieh, Y. K., Chen, L., Lin, Y., et al. (2024). Resonant electron signatures in the formation of chorus wave subpackets. Geophys. Res. Lett. 51 (8), e2023GL108000. doi:10.1029/2023gl108000
Keywords: gyroesonance, test particle, radiation belt, magnetosphere, plasma wave
Citation: Hosseini P, Harid V, Gołkowski M and Tu W (2024) Backward test particle simulation of nonlinear cyclotron wave-particle interactions in the radiation belts. Front. Astron. Space Sci. 11:1484399. doi: 10.3389/fspas.2024.1484399
Received: 21 August 2024; Accepted: 23 October 2024;
Published: 06 November 2024.
Edited by:
Hong Zhao, Auburn University, United StatesCopyright © 2024 Hosseini, Harid, Gołkowski and Tu. This is an open-access article distributed under the terms of the Creative Commons Attribution License (CC BY). The use, distribution or reproduction in other forums is permitted, provided the original author(s) and the copyright owner(s) are credited and that the original publication in this journal is cited, in accordance with accepted academic practice. No use, distribution or reproduction is permitted which does not comply with these terms.
*Correspondence: Poorya Hosseini, cG9vcnlhLmhvc3NlaW5pQHVjZGVudmVyLmVkdQ==
 Poorya Hosseini
 Vijay Harid
 Mark Gołkowski
 Weichao Tu