- 1Department of Geophysics, The College of Geology Engineering and Geomatics, Chang’an University, Xi’an, China
- 2Key Laboratory of Geospace Environment, Chinese Academy of Sciences, University of Science and Technology of China, Hefei, Anhui, China
- 3Center for Environmental Research and Earth Sciences (CERES), Salem, MA, United States
- 4Institute of Earth Physics and Space Science (ELKH EPSS), Sopron, Hungary
- 5Shandong Guoyao Quantum Lidar Co., Ltd., Jinan, China
- 6Mengcheng National Geophysical Observatory, School of Earth and Space Sciences, University of Science and Technology of China, Hefei, Anhui, China
The so-called sporadic sodium layers (SSLs or NaS) are proposed to be strongly related to wave fluctuations. The solitary wave is a particular solution of the partial differential equation whose energy travels as a localized wave packet. A soliton, on the other hand, is a special type of solitary wave that exhibits a particle-like behavior with a strong stable form. For the first time, the solitary wave theory has been used in this research to study the fine structure of SSL/NaS. We performed soliton fitting processes on the observed data from the Andes Lidar Observatory and found out that 24/27 NaS events had exhibited similar features/characteristics to a soliton. Time series of the net anomaly of the NaS revealed the same variation process to the solution of a generalized five-order KdV equation. Our results, therefore, suggested that the NaS phenomenon would be a pertinent tracer for non-linear wave studies in the atmosphere.
Highlights
• The solitary wave theory is proposed to be a candidate to explain the fine structure of some particular NaS events.
• A solitary wave fit was made to the observations from the Andes Lidar Observatory, and 24/27 NaS events exhibited similar features to a soliton.
• Time series of the net anomaly of the NaS revealed a similar dynamical process to the solution of a generalized five-order KdV equation.
1 Introduction
The sodium layer is located around an altitude of 80–110 km. Normally, the ablationof meteors produces a Gaussian distribution of mesospheric metals including sodium and iron atoms (Kane and Gardner, 1993; Kopp, 1997). The most interesting phenomenon of the sodium layer is the so-called sporadic sodium layer (SSL or NaS) (Cox et al., 1993; Gardner et al., 1993; Mathews et al., 1993). For the NaS event, the sodium density increases rapidly and could be more than double the background value (e.g., with an intensity factor >2) within several minutes in a narrow altitude range (Hansen and von Zahn, 1990). NaS lasts from tens of minutes to several hours (Nagasawa and Abo, 1995; Prasanth et al., 2007), and their full width at half maximum (FWHM) is usually less than 5 km or sometimes only 1–2 km (Hansen and von Zahn, 1990; Nagasawa and Abo, 1995; Prasanth et al., 2007). Since first reported in 1978 (Clemesha et al., 1978), a lot of viable mechanisms have been proposed (Cox et al., 1993; von Zahn et al., 1987; Zhou et al., 1993). The current evidence suggests that the ion–molecule theory is a possible mechanism for NaS, based on local observations (Dou et al., 2009; Dou et al., 2010; Hansen and von Zahn, 1990; Heinrich et al., 2008; Heinselman et al., 1998; Kirkwood and Nilsson, 2000; Nesse et al., 2008; Qiu et al., 2016; von Zahn and Hansen, 1988; Williams et al., 2006) and model simulations (Cox et al., 1993; Cox and Plane, 1998; Collins et al., 2002; Plane, 2003; Plane et al., 2015). The sodium ions from ES could potentially offer a sufficient neutral sodium atom source through recombination with free electrons (Cox et al., 1993; Cox and Plane, 1998; Collins et al., 2002; Plane, 2003; Plane et al., 2015; Qiu et al., 2020). On the other hand, it has also been shown that some regions of the sodium layer can be used as tracers for dynamic disturbances under normal conditions. This means that dynamic influence cannot be ruled out in SSL-related investigations (Gardner and Shelton, 1985; Gardner and Voelz, 1987; Hickey and Plane, 1995; Xu and Smith, 2003).
Mesospheric sodium layer observations by lidars provide a tracer for identifying the atmospheric wave signals (Gardner and Voelz, 1987; Xu and Smith, 2004; Li et al., 2007a; Li et al., 2007b; Gong et al., 2015; Gardner et al., 2019). The existing mechanisms indicate that NaS is closely related to wave fluctuations (Kane et al., 1991; Zhou et al., 1993; Zhou and Mathews, 1995; Clemesha et al., 1997; Qian et al., 1998). Many observational results reveal that NaS is frequently accompanied and associated with gravity waves (Qian et al., 1998; Li et al., 2007a; Li et al., 2007b; Ban et al., 2015). Meanwhile, the fine structures of NaS manifest distinct characters related to waves on short timescales (Liu and Yi, 2009; Chen and Yi, 2011; Liu et al., 2013). The bursts of the sodium atoms show a pulse period of 30 s (Liu and Yi, 2009), indicating a wave fluctuation effect on the evolution of NaS.
In the last decade and earlier, a peculiar kind of the non-linear wave, which is called the solitary wave, has been widely studied (Belashov and Vladimirov, 2005; Wazwaz, 2009; Benci and Fortunato, 2014). It was first reported by John Scott Russell (1808–1882), when he was observing the motion of a boat rapidly drawn along a narrow channel (Russell, 1884). Ever since then, many researchers have conducted in-depth studies on the theoretical derivation and exploration on this non-linear problem. In general, a solitary wave is a wave which propagates without any temporal evolution in shape or size when viewed in the reference frame moving with the group velocity of the wave and a soliton is a self-reinforcing single wave packet that maintains its shape while it propagates at a constant velocity. It is a stable solution within a non-linear wave equation (Benci and Fortunato, 2014). Soliton is a fascinating topic of interest in modern physics and mathematics (Belashov and Vladimirov, 2005; Wazwaz, 2009; Benci and Fortunato, 2014). It is a physical description and representation for the non-linear wave processes, which plays an important role in the wide spectrum of areas of research related to the wave physics, e.g., in hydrodynamics, plasma physics, condensed matter, and optics (Belashov and Vladimirov, 2005). Nowadays, solitary waves are commonly utilized in Earth Sciences, especially involving oceanic and atmospheric applications, such as surface wave, ion-acoustic wave, magneto-sonic wave, internal gravity wave, and Raleigh wave transmission from the seismic source (Belashov and Vladimirov, 2005).
The non-linear solitary wave theory was first asserted by Diederik Korteweg and Gustav de Vries as the simplified model equation for surface waves on shallow water,
with solutions of stable solitary waves (Korteweg and de Vries, 1895). The term soliton was first introduced in 1965 by Zabusky and Kruskal who demonstrated that the Korteweg–de Vries equation (KdV equation) reveals hidden linear properties, allowing a solution in the form of a non-linear solitary wave propagating without changing its profile (Zabusky and Kruskal, 1965). These authors also pointed out that the soliton has two important properties: 1) extremely stable wave packet like a particle and 2) invariant even under particle collisions (Zabusky and Kruskal, 1965).
In this research, the solitary wave theory has been utilized to interpret and explain lidar observations. We performed particular data processing on the observed results from a narrow band lidar at the Andes Lidar Observatory (Liu et al., 2016). We discovered that the fine structure of NaS evolutions exhibit similar characters to a soliton, indicating a common existence of solitary waves in the mesopause region. The evolution of the net anomaly of the NaS peak profiles exhibit the same characters to the solution of five-order KdV equation. Our results, therefore, suggest the NaS phenomenon would be a possible tracer for non-linear wave studies of the mesosphere.
2 Solitary wave theory and data processing
2.1 Non-linear and dispersion effects
Considering a one-dimensional wave at time moment
where
where N is the newly generated particle number per unit area (e.g., column density);
We assign the parameters with appropriate values as
After the input,
where
This solution indicates each part of the wave has a different speed of
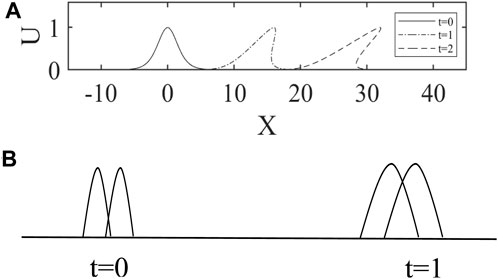
FIGURE 1. Convergence (A) and dispersion (B) effects of a wave. (A) Wave packet front becomes steeper and steeper as the wave propagates, leading to a non-linear effect of convergence. (B) Dispersion effect for the wave packet.
On the other hand, a wave propagating in the
where
and
respectively. If
Start with Euler’s equations for ideal fluid:
The boundary conditions are
where
Let
Let
and we substitute Eq. 12 into Eq. 11:
Consequently,
where
Substituting Eq. 14 into Eq. 11, we can get
Then, substituting Eq. 15 into Eq. 9,
According to the lower boundary conditions,
and according to the upper boundary conditions,
Thus, we can obtain
Especially, in shallow water conditions,
where
whereas
Therefore, when
In addition,
Therefore, the effect of
On the other hand, since the layer density response is highly dependent on the density gradients occurring in the layer, the steady-state layer density profile becomes important (Gardner and Shelton, 1985). Large density gradients encourage non-linearities in the layer response (Gardner and Shelton, 1985). Therefore, when the non-linear effect affected by the gradient of the Na density profile is balanced with the dispersion effect mentioned previously, the wave shows neither dispersion nor non-linear characteristics, but propagates in the form of solitary waves.
So, the dispersion term of a surface wave in incompressible shallow fluid is given by
where
In the complex space, we have
We set
This equation (similar to Eq. 1) is one of the simplest forms of the KdV equation, balanced by both the non-linear term
2.2 Solution of the KdV equation and numerical simulation
The travelling wave could be represented by the form
Eq. 26 or Eq. 1 has a special solution given by
where
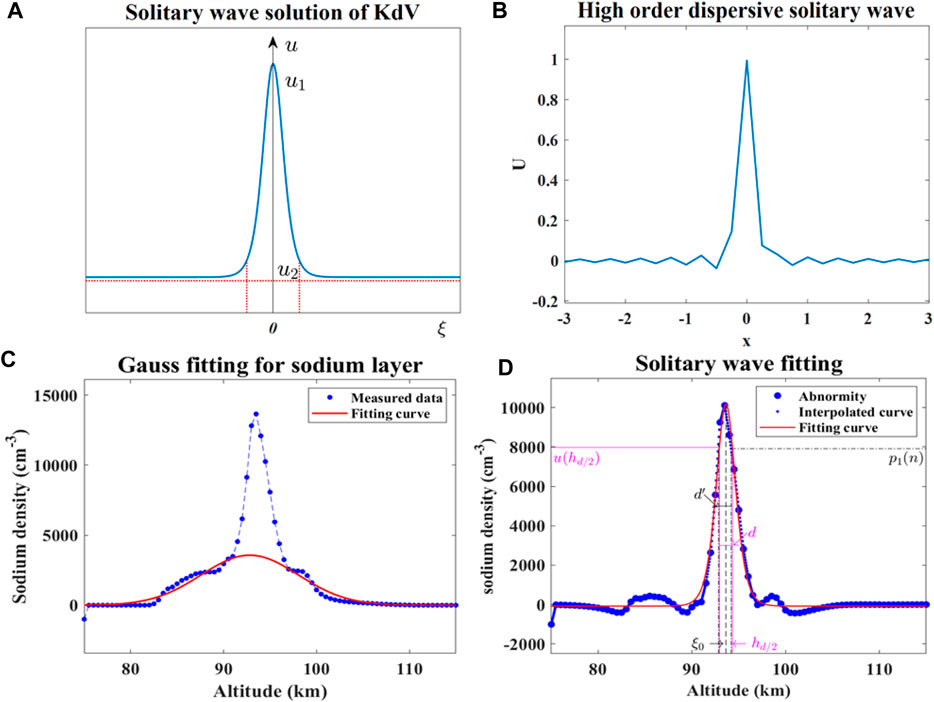
FIGURE 2. Comparison of the theoretical solitary wave profiles and observed peak density profiles of NaS. (A) Solitary wave profile according to Eq. 11, with u2 representing the limiting wave amplitude at infinity and u1 characterizing the peak of the wave. The width
Eq. 27 is the soliton solution of Eq. 26 (similar to Eq. 1), and its evolution image is shown in Figure 3A when taking
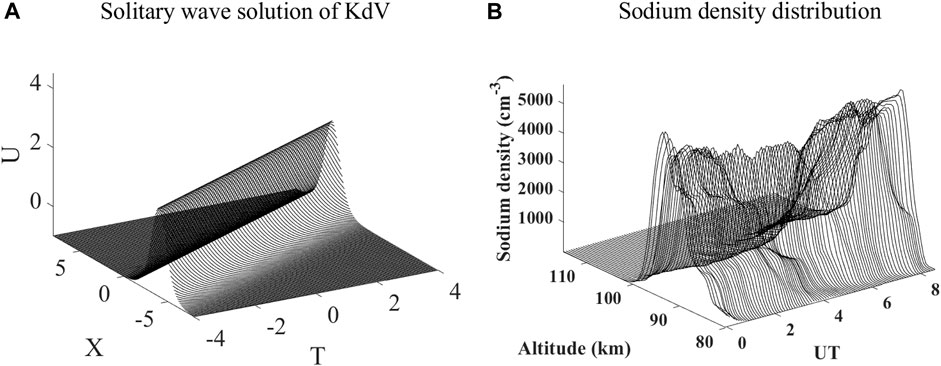
FIGURE 3. (A) By solving the KdV equation with specific condition and assumption (see text), a solitary wave solution was obtained. (B) NaS event detected by the Andes lidar station.
3 Observational results and discussion
The observational data from the Andes lidar from 20 August 2014 to 7 July 2019 are processed in detail as follows: 1) The typical NaS event with intensity factor
3.1 Gaussian distribution of the sodium density profile
It is shown that the sodium density variation with height can be approximated by the Gaussian distribution.
where
When the NaS occurs, the sodium density suddenly increases in a narrow and confined altitude range and the density profile obviously deviates from the Gaussian distribution. To quantitatively explore this anomaly, the Gaussian distribution function of the background sodium density should be determined first.
The sodium density data observed at one night by the lidar compose of a two-dimensional matrix: the elements on the column vectors of the matrix represent the sodium densities at different heights at a given moment, and the elements on the row vectors represent the results at different moments at a given height. Now, we choose the column vector of the matrix for data processing.
The origin observation data matrix of the day is set to be
where n is the number of observational points on the day. The maximum element in
When the value of an element in the column vector is greater than dc, it reflects the anomaly of Na density. Otherwise, it is considered that the column vector conforms to the Gaussian distribution of Na density on that day. The column vector reflecting the Na density anomaly is arranged into a matrix in the order of the observed time as follows:
Then, we set the matrix of column vectors matching the Gaussian distribution in the order of observational moments to be
To obtain the Gaussian distribution of Na density on that day, we average all column vectors in
where
where
3.2 Net anomaly of sodium density and solitary wave fitting
Based on the observational data at Andes station from 20 August 2014 to 7 July 2019, 27 NaS events are distinguished among 147 observation days. We continue to take the case on 3 November 2016 as an example. The column vector of
and the distribution of
Then, the solitary wave fitting is performed on the vector
where
which means
The fitting results are shown as the red curve in Figure 2D. Now, we know
Let
Substituting it into Eq. 37, we have
which means the density at 0.6891 km from the peak is predicted to be 8071.41
Furthermore, the height value at the theoretical full width at half maximum (FWHM) of a soliton is given as follows:
To test the fitting results, the observed altitude of the selected case needs to be close to the calculated
According to the definition of the soliton,
where
The deduced values of
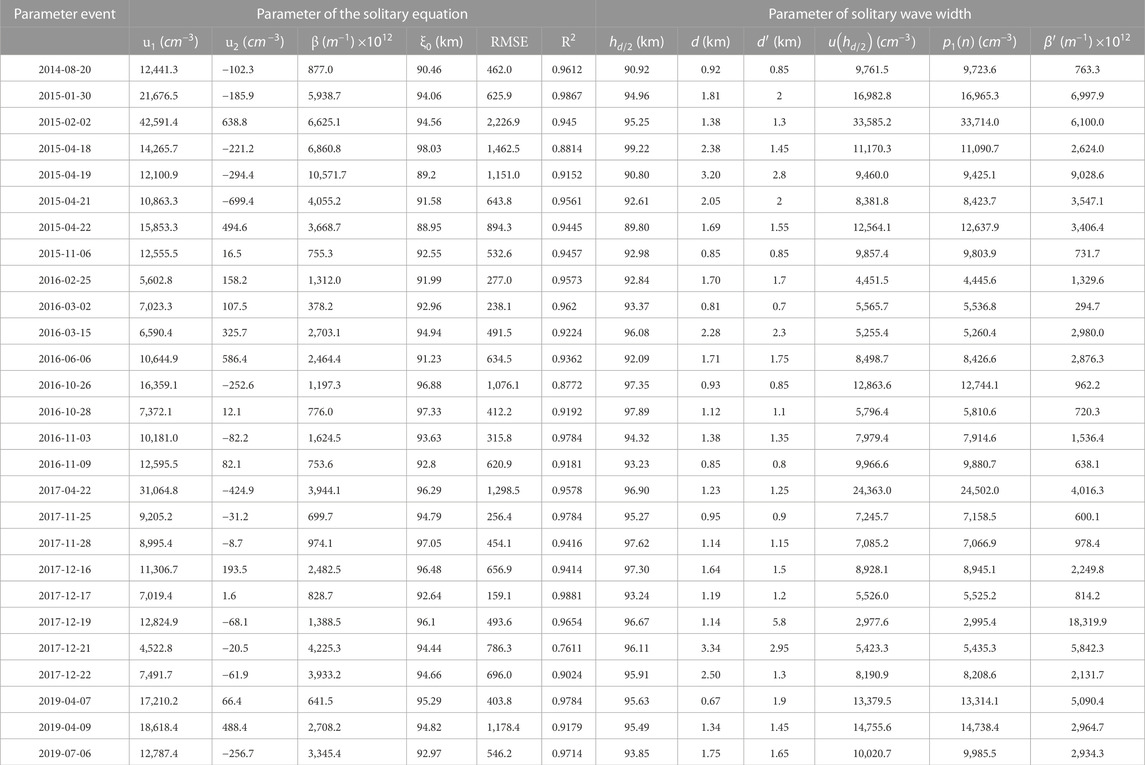
TABLE 1. Statistics of fitting parameters and fitting quality evaluation for the observations at the Andes station from 20 August 2014 to 7 July 2019.
Alternatively, the column vector obtained by Eq. 37 is denoted as
and
where
The denominator of Eq. 45 denotes the residuals obtained by predicting the net anomaly vector
The values of the parameters
Figure 4 shows a simple data mining operation in Table 1. The net anomalous sodium density data
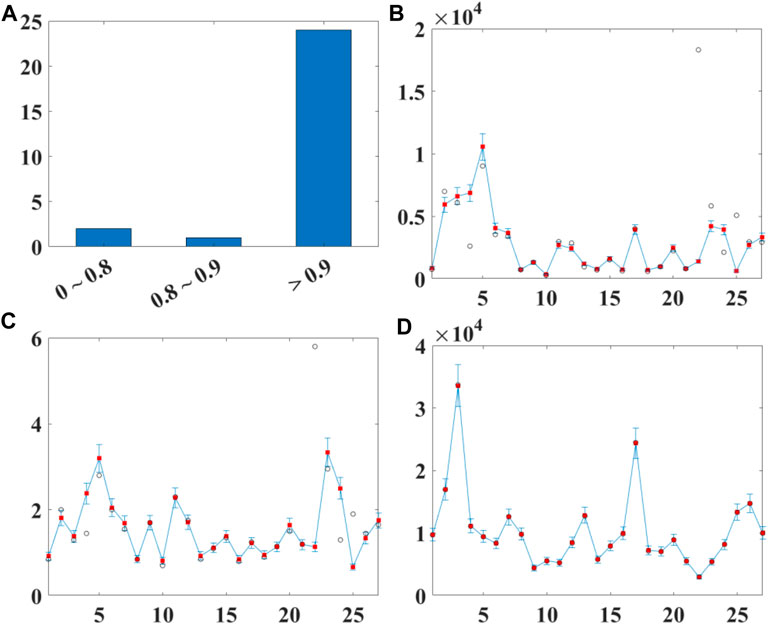
FIGURE 4. (A) A statistical histogram of the parameter
3.3 Further explanation of NaS by the higher-order solitary wave equation
In Figure 2D, it is shown that some small wavelets appear on both wings of the blue dotted line drawn from the net anomaly vector
Kawahara and Takuji proposed to add a higher-order dispersion term to the KdV equation, which considers dissipation, instability, and higher-order dispersion effects in the fluid medium (Kawahara and Takuji, 2007). This generalized KdV equation is written as follows:
which is also called the Kawahara equation (Kawahara and Takuji, 2007).
The numerical simulation results show that the Kawahara equation has two types of solutions: in the case of
whose solution at
Furthermore, we can study the evolution of the waveform over time using the Fourier transform method. Let the initial conditions be
Since the vertical scale of NaS observed by the lidar is generally less than 10 km, while the horizontal scale is often reported to be more than 300 km or even over 1,000 km (Fan et al., 2007; Ma et al., 2019), this scenario is inconsistent with the shallow water model. The solitary waves could particularly appear at the interface between upper and lower stratifications in the fluid medium (Bogucki and Garrett, 1993). They are frequently found in the stratified or sheared places in the ocean and atmosphere (Huthnance, 1989; Doviak et al., 1991; Gan and Ingram, 1992). In fact, in the lower atmosphere, in rotating, magnetized dusty plasma and in the dayside tropical mesosphere, many solitary wave events have also been observed (Christie et al., 1977; Christie et al., 1981; Mushtaq, 2006). This might suggest that solitary waves propagate beyond the mesospheric Na layer (the Na lidar range) with a larger vertical scale. Therefore, it is more effective to look for observational results related to stable stratifications or shears. The NaS event on 9 April 2019 is selected as an example of this scenario (Figure 5A). This NaS appears before the beginning of the observation at about 95 km altitude, with a downward propagation. The deduced vertical wind confirms the NaS occurs in downward vertical wind (shown as the negative value region in Figure 5B). The vertical wind velocity field in this example has a low-velocity band with a width of around 3 km, and this low-velocity band (as shown in Figure 5B) decreases by roughly 9 km (95–86 km) in 10 hours (8 April 2019, 23:00–9 April 2019, 09:00), and the downward speed is roughly 0.9 km/h. Furthermore, the spatial and temporal distribution of NaS on that day corresponds well with the distribution of this vertical wind low-velocity zone. The results of numerical simulations demonstrate that the non-linear term factor affects the propagation of the solitons along the spatial axis. Moreover, the downward vertical phase of the NaS is consistent with the aforementioned properties of solitons. This implies that vertical wind speed has a non-linear function in this NaS event, influencing the sodium density transfer. As stated in previous studies (Chen et al., 2021a; Chen et al., 2021b), NaS is also modulated by the horizontal wind field. Figures 5C–E show the zonal wind, meridional wind, and the temperature profiles, respectively. These three profiles indicate the NaS has been located near the stratification with strong shear. Furthermore, the stability of the stratification is determined by the Richardson number
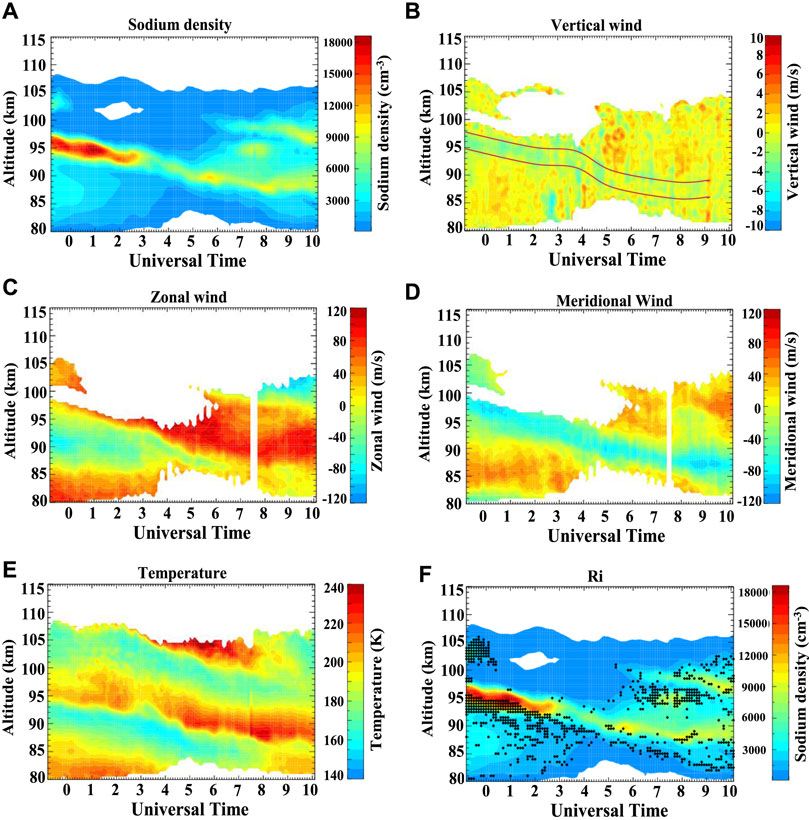
FIGURE 5. Observations and results from the Andes lidar on 9 April 2019. The empty areas indicate a low signal-to-noise ratio and large error of the observed data. (A) Sodium density profile. The NaS appears before the beginning of the observation, at about 95 km altitude. (B) Vertical wind observations. (C) Zonal wind profile. (D) Meridional wind profile. (E) Temperature variations. (F) Calculated Ri distributions. The black scatter dots represent Ri with a value >1.5.
In unit time, due to vertical displacement, for a unit mass of air, the convective flow energy to resist the net Archimedes buoyancy is as follows:
where w = dz/dt is the vertical speed;
On the other hand, for unit mass of air, the horizontal kinetic energy consumed per unit time in the presence of vertical wind shear, i.e., the kinetic energy provided to convective motion, is as follows:
where u and v are the zonal and meridional wind velocities, respectively.
Thus, the stability of the layer depends on the value of
which could be deduced from the wind and temperature results observed by the lidar (Figures 5C–E). The calculated Ri with a value
Furthermore, the evolution of the observed net anomaly for the Na_s throughout whole night is also needed for comparison. In Section 3.1, the initial observation of sodium density is denoted as
The Gaussian distribution model of the current day is noted as a two-dimensional matrix
Obviously, the net anomaly evolution of the NaS is obtained by observation data matrix
where
In order to compare the numerical simulation results
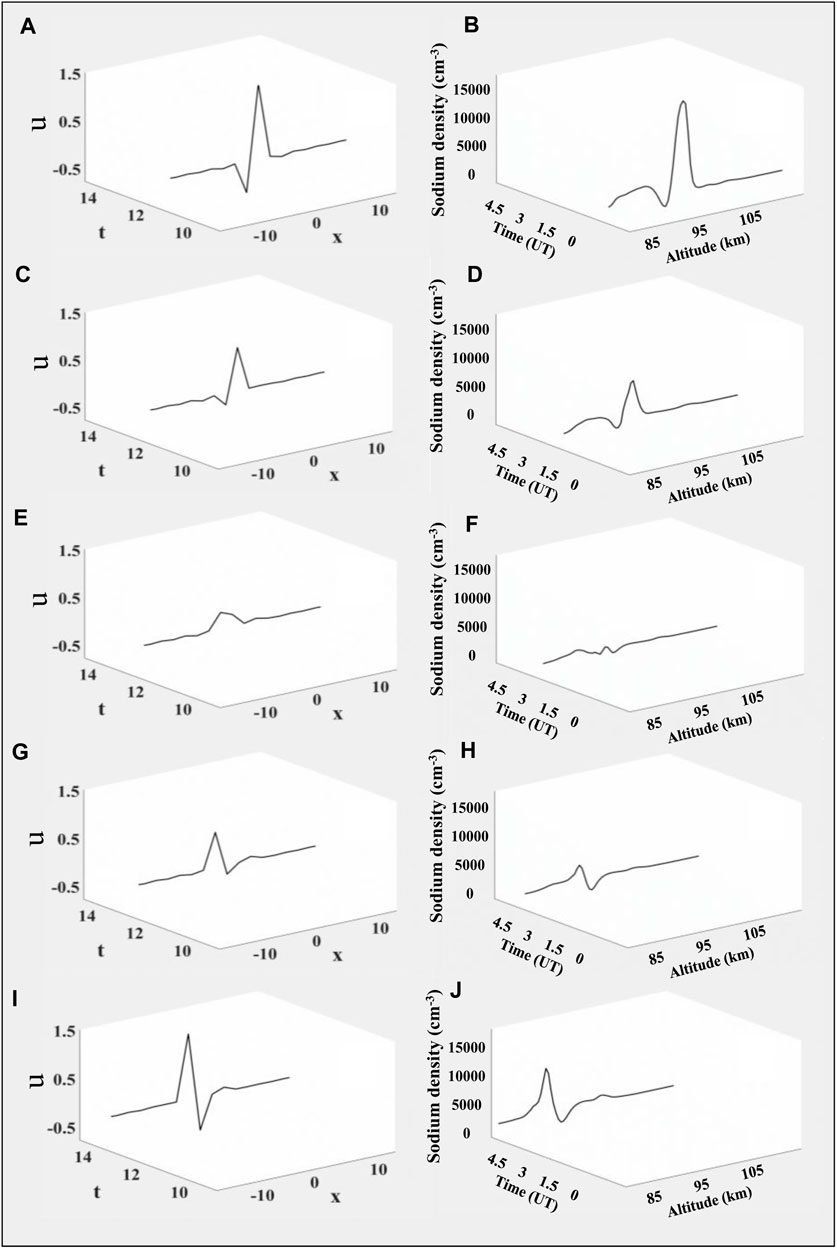
FIGURE 6. Comparison of five-order solitary wave evolution images over time and Na density net anomalies observed at the Andes station on 9 April 2019. (A,B) At this moment, the simulated wave shape is similar to the observed peak density profile. (C,D) Huge peaks attenuate synchronously. (E,F) Peaks decay to about zero value. (G,H) Peaks change phase and resume. (I,J) Peaks recover to a sharp form similar to the initial condition, except with different phase. A dynamic video of the variation of their column vectors with time is uploaded as Supplementary Movie S1.
However, it is worth noting that the numerical simulation of the higher-order KdV equation is probably only suitable for explaining the events similar to the selected case. These events are typically characterized by occurrence heights below 95 km, longer durations, and descending patterns similar to tidal fluctuations. In contrast, the other events with shorter durations and cloud-like shapes are less consistent with the higher-order simulation results. This discrepancy also implies that NaS with different characteristics may have different fine structures.
The fluctuations can affect various physical parameters in the upper mesosphere. During the NaS event on 9 April 2019, the temperature in the mesosphere displayed a distinct wave signature similar to the solitary wave observed in sodium density.
Similar to the approach used to analyze sodium density data, in the current study, the background temperature distribution (illustrated in Figure 7A) was obtained by averaging the temperature data of April 2019, excluding the temperature data recorded during the NaS event. The temperature anomaly distribution (illustrated in Figure 7B) was obtained by differencing the temperature observations on 9 April 2019 when the Nas event occurred with the background temperature.
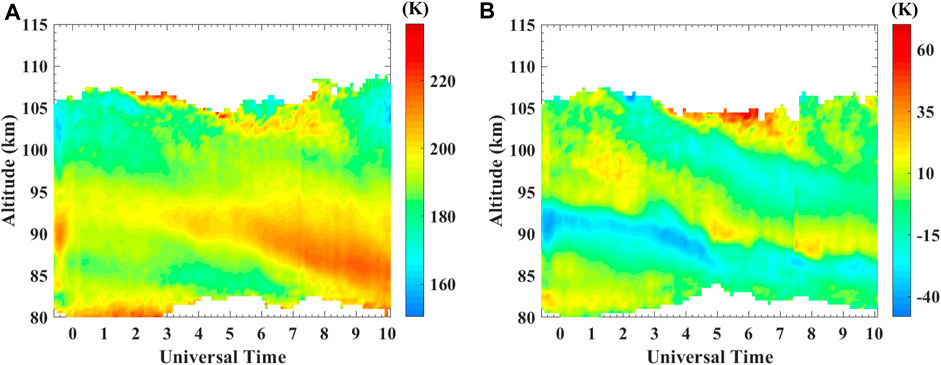
FIGURE 7. (A) Temperature distribution in the mesopause region (80–115 km) near the Andes station in April 2019, obtained by averaging temperature observations at the same UT time and altitude in April 2019 when no NaS event was observed at the Andes station. When analyzing the Nas event on 9 April 2019, this background temperature was used. (B) Distribution of temperature anomalies from 93 to 97 km above the Andes lidar station on 9 April 2019. The temperature anomaly distribution was obtained by differencing the temperature observations on 9 April 2019 with the background temperature.
Figure 7A displays the background temperature distribution in the 93–97 km region consistently maintaining 190–200 K from −0.8 UT to 2.8 UT (where 9 April 2019 00:00 UT is marked as 0 UT), with no significant anomaly. The distribution of temperature anomalies from 93 to 97 km above the Andes lidar station on 9 April 2019 is shown in Figure 7B. Compared with the background temperature profile, there is a stripe or band of warming region with an amplitude of approximately 15 K within 93–97 km from −0.8 UT to 2.8 UT, overlapping the region of NaS. Figure 8 presents the temperature plots (black lines) vs. the background temperature profiles (red lines) for 93–97 km, with (a) to (f) corresponding to the time sequence from −0.1 UT, 0.1 UT, 0.3 UT, 0.5 UT, and 0.7 UT, to 0.9 UT. Figures 8A–F show that the temperature anomalies in this region persist at approximately 10–15 K throughout the NaS event (−0.8 UT∼2.8 UT), indicating a stable propagation pattern/signal similar to that expected for solitary wave.
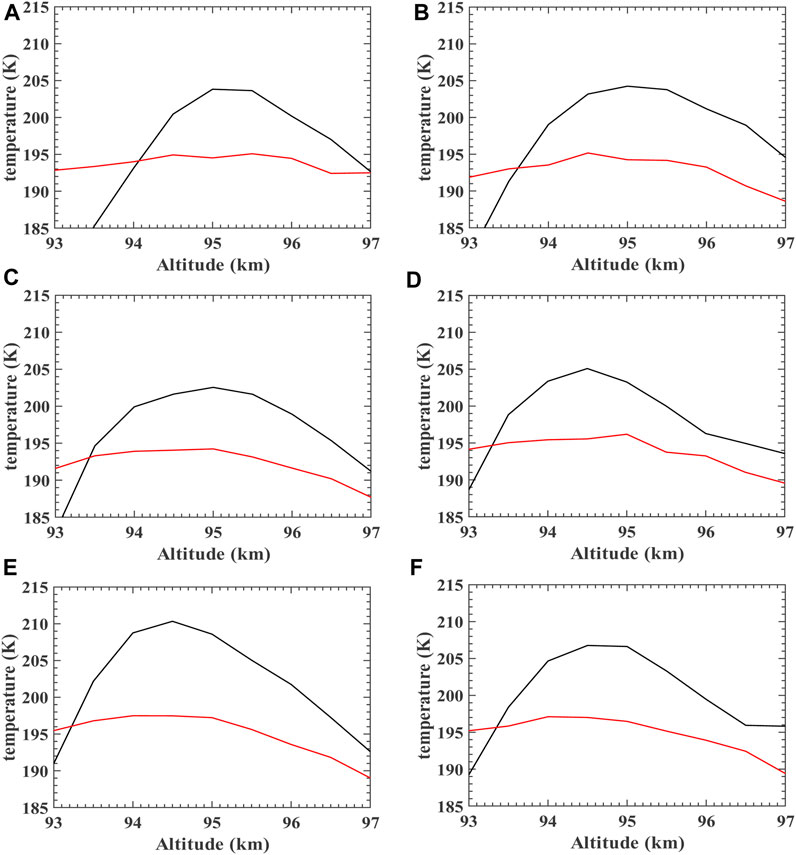
FIGURE 8. Temperature profiles (black lines) vs. background temperature profiles (red lines) for 93–97 km above the Andes lidar station on 9 April 2019, with (A–F) corresponding to the time sequences of −0.1 UT, 0.1 UT, 0.3 UT, 0.5 UT, 0.7 UT, and 0.9 UT.
Moreover, in contrast to Figure 2C, the temperature profile does not undergo any significant changes as the sodium density varies during the occurrence of the NaS event. This discrepancy could potentially be explained by the following factors: 1) The occurrence of NaS involves an input source (the sodium ions from ES could potentially offer a sufficient neutral sodium atom source through recombination with free electrons). This implies that passive temperature variations may not be as sensitive to fluctuations as NaS. 2) The temperature in the mesopause is also affected by atmospheric dynamical processes such as solar radiation, photochemical reactions, gravity waves, and tidal waves. Therefore, accurately determining the background temperature becomes challenging, which can result in less-pronounced fluctuation features in the temperature profile.
4 Conclusion
In this research, the solitary wave theory is applied to study the NaS phenomenon of the mesosphere. Among the observations of Andes lidar from 20 August 2014 to 7 July 2019, 27 NaS cases with intensity factor >3 have been selected for processing through the Gaussian and soliton fitting steps. The original observed peak density profile of the NaS is subtracted by the Gaussian distribution, and then, the net anomaly peak is obtained. The net peak is fitted by the soliton solution from the standard KdV equation, and the quality of the fitting is then evaluated. The statistical results reveal that in 24/27 cases, the net peak of NaS exhibits similar features to a soliton. Time series of the net anomaly on 9 April 2019 reveals a similar dynamical process to the solution of a five-order KdV equation. Although still uncertain, this solitary wave theory could possibly explain some characteristics of NaS.
Data availability statement
Publicly available datasets were analyzed in this study. These data can be found at: http://lidar.erau.edu/data/nalidar/.
Author contributions
SQ conceived this study and wrote this manuscript. MS performed data analysis and prepared Figures 1–4 and Supplementary Movie S1. WS was in charge of the organization and English polishing of the whole manuscript. MJ prepared Figure 5 and gave some useful comments on the content. PJ contributed to the discussion of KdV equations. XD designed this study. All authors contributed to the article and approved the submitted version.
Funding
This work was supported by the National Natural Science Foundation of China (Nos. 41974178 and 42130203) and CNSA Pre-research Project on Civil Aerospace Technologies (No. D020105).
Acknowledgments
The authors acknowledge the use of data from the Andes Lidar Observatory database. They express sincere gratitude to Prof. Alan Liu from the Center for Space and Atmospheric Research and Department of Physical Sciences, Embry-Riddle Aeronautical University, United States, for providing the valuable data.
Conflict of interest
Author MJ was employed by Shandong Guoyao Quantum Lidar Co., Ltd.
The remaining authors declare that the research was conducted in the absence of any commercial or financial relationships that could be construed as a potential conflict of interest.
Publisher’s note
All claims expressed in this article are solely those of the authors and do not necessarily represent those of their affiliated organizations, or those of the publisher, the editors, and the reviewers. Any product that may be evaluated in this article, or claim that may be made by its manufacturer, is not guaranteed or endorsed by the publisher.
Supplementary material
The Supplementary Material for this article can be found online at: https://www.frontiersin.org/articles/10.3389/fspas.2023.1241663/full#supplementary-material
References
Ban, C., Li, T., Fang, X., Dou, X. K., and Xiong, J. G. (2015). Sodium lidar-observed gravity wave breaking followed by an upward propagation of sporadic sodium layer over Hefei, China. J. Geophys. Res. Space Phys. 120, 7958–7969. doi:10.1002/2015JA021339
Belashov, V. Y., and Vladimirov, S. V. (2005). Solitary waves in dispersive complex media. Berlin, Heidelberg, XIV: Springer Series in Solid-State Sciences, Springer, 294.
Benci, V., and Fortunato, D. (2014). Variational methods in non-linear field equations. Cham, Switzerland, XIX: Springer Monographs in Mathematics, Springer, 253.
Bogucki, D., and Garrett, C. (1993). A simple model for the shear-induced decay of an internal solitary wave. J. Phys. Oceanogr. 23, 1767–1776. doi:10.1175/1520-0485(1993)023<1767:asmfts>2.0.co;2
Chen, L., and Yi, F. (2011). Average properties and small-scale variations of the mesospheric Na and Fe layers as observed simultaneously by two closely colocated lidars at 30° N. Ann. Geophys. 29, 1037–1048. doi:10.5194/angeo-29-1037-2011
Chen, X. C., Huang, W. T., Ban, C., Kosch, M. J., Murphy, D. J., Hu, Z. J., et al. (2021a). Dynamic properties of a sporadic sodium layer revealed by observations over zhongshan, Antarctica: A case study. J. Geophys. Res. Space Phys. 127. doi:10.1029/2021JA029787
Chen, X. C., Liu, J. J., Kosch, M. J., Hu, Z. J., Wang, Z. W., Zhang, B. C., et al. (2021b). Simultaneous observations of a sporadic E layer by digisonde and SuperDARN HF radars at zhongshan, Antarctica. J. Geophys. Res. Space Phys. 127. doi:10.1029/2021JA029921
Christie, D. R., Muirhead, K. J., and Hales, A. L. (1977). On solitary waves in the atmosphere. J. Atmos. Sci. 35, 805–825. doi:10.1175/1520-0469(1978)035<0805:oswita>2.0.co;2
Christie, D. R., Muirhead, K. J., and Clarke, R. H. (1981). Solitary waves in the lower atmosphere. Nature 293, 46–49. doi:10.1038/293046a0
Clemesha, B. R., Batista, P. P., and Simonich, D. M. (1997). Wave–associated sporadic neutral layers in the upper atmosphere. Rev. Bras. Geof. 15, 237–250. doi:10.1590/S0102–261X1997000300003
Clemesha, B. R., Kirchhoff, V. W. J. H., Simonich, D. M., and Takahashi, H. (1978). Evidence of an extra-terrestrial source for the mesospheric sodium layer. Geophys. Res. Lett. 5, 873–876. doi:10.1029/gl005i010p00873
Collins, S. C., Plane, J. M. C., Kelleya, M. C., Wright, T. G., Soldán, P., Kanee, T. J., et al. (2002). A study of the role of ion–molecule chemistry in the formation of sporadic sodium layers. J. Atmos. Sol. Terr. Phys. 64, 845–860. doi:10.1016/s1364-6826(02)00129-3
Cox, R. M., and Plane, J. M. C. (1998). An ion-molecule mechanism for the formation of neutral sporadic Na layers. J. Geophys. Res. Atmos. 103, 6349–6359. doi:10.1029/97jd03376
Cox, R. M., Plane, J. M. C., and Green, J. S. A. (1993). A modelling investigation of sudden sodium layers. Geophys. Res. Lett. 20, 2841–2844. doi:10.1029/93gl03002
Dou, X. K., Xue, X. H., Chen, T. D., Wan, W. X., Li, T., Chen, C., et al. (2009). A statistical study of sporadic sodium layer observed by Sodium lidar at Hefei (31.8° N, 117.3° E). Ann. Geophys. 27, 2247–2257. doi:10.5194/angeo-27-2247-2009
Dou, X. K., Xue, X. H., Li, T., Chen, T. D., Chen, C., and Qiu, S. C. (2010). Possible relations between meteors, enhanced electron density layers, and sporadic sodium layers. J. Geophys. Res. Space Phys. 115, A06311. doi:10.1029/2009ja014575
Doviak, R. J., Chen, S. S., and Christie, D. R. (1991). A thunderstorm–generated solitary wave observation compared with theory for non-linear waves in a sheared atmosphere. J. Atmos. Sci. 48, 87–111. doi:10.1175/1520-0469(1991)048<0087:atgswo>2.0.co;2
Fan, Z. Y., Plane, J. M. C., and Gumbel, J. (2007). On the global distribution of sporadic sodium layers. Geophys. Res. Lett. 34, 87–101. doi:10.1029/2007gl030542
Gan, J., and Ingram, R. G. (1992). Internal hydraulics, solitons and associated mixing in a stratified sound. J. Geophys. Res. 97, 9669–9688. doi:10.1029/92JC00491
Gardner, C. S., Guo, Y., and Liu, A. Z. (2019). Parameterizing wave-driven vertical constituent transport in the upper atmosphere. Earth Space Sci. 6, 904–913. doi:10.1029/2019ea000625
Gardner, C. S., Kane, T. J., Senft, D. C., Qian, J., and Papen, G. C. (1993). Simultaneous observations of sporadic E, Na, Fe, and Ca+ layers at urbana, Illinois: three case studies. J. Geophys. Res. Atmos. 98, 16865–16873. doi:10.1029/93jd01477
Gardner, C. S., and Shelton, J. D. (1985). Density response of neutral atmospheric layers to gravity wave perturbations. J. Geophys. Res. 90, 1745. doi:10.1029/JA090iA02p01745
Gardner, C. S., and Voelz, D. G. (1987). Lidar studies of the nighttime sodium layer over urbana, Illinois: 2. Gravity waves. J. Geophys. Res. Space Phys. 92, 4673–4694. doi:10.1029/ja092ia05p04673
Gong, S. H., Yang, G. T., Cheng, X. W., Gong, S. S., Xu, J. Y., Li, F. Q., et al. (2015). Lidar observation campaigns on diurnal variations of the sodium layer in Beijing and Wuhan, China. Sci. China Earth Sci. 58 (8), 1377–1386. doi:10.1007/s11430-015-5099-1
Hansen, G., and von Zahn, U. (1990). Sudden sodium layers in polar latitudes. J. Atmos. Sol. Terr. Phys. 52, 585–608. doi:10.1016/0021-9169(90)90055-r
Heinrich, D., Nesse, H., Blum, U., Acott, P., Williams, B., and Hoppe, U. P. (2008). Summer sudden Na number density enhancements measured with the ALOMAR Weber Na Lidar. Ann. Geophys. 26, 1057–1069. doi:10.5194/angeo-26-1057-2008
Heinselman, C. J., Thayer, J. P., and Watkins, B. J. (1998). A high–latitude observation of sporadic sodium and sporadic E-layer formation. Geophys. Res. Lett. 25, 3059–3062. doi:10.1029/98gl02215
Hickey, M. P., and Plane, J. M. C. (1995). A chemical-dynamical model of wave-driven sodium fluctuations. Geophys. Res. Lett. 22, 2861–2864. doi:10.1029/95gl02784
Huthnance, J. M. (1989). Internal tides and waves near the continental shelf edge. Geophys. Astrophys. Fluid Dyn. 48, 81–106. doi:10.1080/03091928908219527
Kane, T. J., and Gardner, C. S. (1993). Lidar observations of the meteoric deposition of mesospheric metals. Science 259, 1297–1300. doi:10.1126/science.259.5099.1297
Kane, T. J., Hostetler, C. A., and Gardner, C. S. (1991). Horizontal and vertical structure of the major sporadic sodium layer events observed during ALOHA–90. Geophys. Res. Lett. 18, 1365–1368. doi:10.1029/91gl01154
Kawahara, T. (2007). Oscillatory solitary waves in dispersive media. J. Phys. Soc. Jpn. 33, 260–264. doi:10.1143/JPSJ.33.260
Kirkwood, S., and Nilsson, H. (2000). High–latitude sporadic–E and other thin layers – The role of magnetospheric electric fields. Space Sci. Rev. 91, 579–613. doi:10.1023/a:1005241931650
Kopp, E. (1997). On the abundance of metal ions in the lower ionosphere. J. Geophys. Res. Space Phys. 102, 9667–9674. doi:10.1029/97ja00384
Korteweg, D. J., and de Vries, G. (1895). XLI. On the change of form of long waves advancing in a rectangular canal, and on a new type of long stationary waves. Philos. Mag. 39 (240), 422–443. doi:10.1080/14786449508620739
Li, T., She, C. Y., Liu, H. L., and Montgomery, M. T. (2007b). Evidence of a gravity wave breaking event and the estimation of the wave characteristics from sodium lidar observation over Fort Collins, CO (41°N, 105°W). Geophys. Res. Lett. 34, L05815. doi:10.1029/2006gl028988
Li, T., She, C. Y., Liu, H. L., Leblanc, T., and Mcdermid, I. S. (2007a). Sodium lidar–observed strong inertia-gravity wave activities in the mesopause region over Fort Collins, Colorado (41°N, 105°W). J. Geophys. Res. Atmos. 112, D22104. doi:10.1029/2007jd008681
Liu, A. Z., Guo, Y., Vargas, F., and Swenson, G. R. (2016). First measurement of horizontal wind and temperature in the lower thermosphere (105–140 km) with a Na Lidar at Andes Lidar Observatory. Geophys. Res. Lett. 43, 2374–2380. doi:10.1002/2016GL068461
Liu, S. D., and Liu, S. K. (2011). Dynamics of the atmosphere. Beijing: The Publishing House of Beijing University.
Liu, Y. J., Clemesha, B. R., H Wang, J., and Cheng, X. W. (2013). Comparison of sporadic sodium layer characteristics observed at different time resolutions. Ann. Geophys. 31, 1899–1912. doi:10.5194/angeo-31-1899-2013
Liu, Y., and Yi, F. (2009). Behavior of sporadic Na layers on small time scale. J. Atmos. Solar–Terrestrial Phys. 71, 1374–1382. doi:10.1016/j.jastp.2009.06.013
Ma, J., Xue, X. H., Dou, X. K., Chen, T. D., Tang, Y. H., Jia, M. J., et al. (2019). Large–scale horizontally enhanced sodium layers coobserved in the midlatitude region of China. J. Geophys. Res. Space Phys. 124, 7614–7628. doi:10.1029/2018JA026448
Mamun, A. A., and Shukla, P. K. (2009). Effects of nonthermal distribution of electrons and polarity of net dust–charge number density on nonplanar dust–ion–acoustic solitary waves. Phys. Rev. E 80, 037401. doi:10.1103/PhysRevE.80.037401
Mathews, J. D., Zhou, Q. H., Philbrick, C. R., Morton, Y. T., and Gardner, C. S. (1993). Observations of ion and sodium layer coupled processes during AIDA. J. Atmos. Terr. Phys. 55, 487–498. doi:10.1016/0021-9169(93)90083-b
Mushtaq, A., Shah, H. A., Rubab, N., and Murtaza, G. (2006). Study of obliquely propagating dust acoustic solitary waves in magnetized tropical mesospheric plasmas with effect of dust charge variations and rotation of the plasma. Phys. Plasmas 13. doi:10.1063/1.2206547
Nagasawa, C., and Abo, M. (1995). Lidar observations of a lot of sporadic sodium layers in mid–latitude. Geophys. Res. Lett. 22, 263–266. doi:10.1029/94gl03008
Nesse, H., Heinrich, D., Williams, B., Hoppe, U. P., Stadsnes, J., Rietveld, M., et al. (2008). A case study of a sporadic sodium layer observed by the ALOMAR Weber Na lidar. Ann. Geophys. 26, 1071–1081. doi:10.5194/angeo-26-1071-2008
Plane, J., Feng, W., and Dawkins, E. (2015). The mesosphere and metals: chemistry and changes. Chem. Rev. 115, 4497–4541. doi:10.1021/cr500501m
Plane, J. M. C. (2003). Atmospheric chemistry of meteoric metals. Chem. Rev. 103, 4963–4984. doi:10.1021/cr0205309
Prasanth, P. V., Kumar, Y. B., Rao, D. N., and Narayana Rao, D. (2007). Lidar observations of sporadic Na layers over Gadanki (13.5° N, 79.2° E). Ann. Geophys. 25, 1759–1766. doi:10.5194/angeo–25–1759–2007
Qian, J., Gu, Y., and Gardner, C. S. (1998). Characteristics of the sporadic Na layers observed during the airborne lidar and observations of Hawaiian airglow/airborne noctilucent cloud (ALOHA/ANLC–93) campaigns. J. Geophys. Res. Atmos. 103, 6333–6347. doi:10.1029/97jd03374
Qiu, S. C., Tang, Y. H., Jia, M. J., Xue, X. H., Dou, X. K., Li, T., et al. (2016). A review of latitudinal characteristics of sporadic sodium layers, including new results from the Chinese Meridian Project. Earth–Science Rev. 162, 83–106. doi:10.1016/j.earscirev.2016.07.004
Qiu, S. C., Wang, N., Soon, W., Lu, G. P., and Dou, X. K. (2020). Sporadic sodium layer: A possible tracer for the conjunction between the upper and lower atmospheres. Atmos. Chem. Phys. 21, 11927–11940. doi:10.5194/acp–2020–1079
Richter, E. S., and Sechrist, C. F. (1979). A meteor ablation-cluster ion atmospheric sodium theory. Geophys. Res. Lett. 6, 183–186. doi:10.1029/gl006i003p00183
Russell, J. M. (1884). Report of the fourteenth meeting of the. London: British Association for the Advancement of Science, 311–390.
Schunk, R., and Nagy, A. (2009). Ionospheres: Physics, plasma physics, and chemistry. Cambridge: Cambridge University Press, 206–230. doi:10.1017/CBO9780511635342
von Zahn, U., and Hansen, T. L. (1988). Sudden neutral sodium layers: A strong link to sporadic E layers. J. Atmos. Terr. Phys. 50, 93–104. doi:10.1016/0021-9169(88)90047-5
von Zahn, U., von der Gathen, P., and Hansen, G. (1987). Forced release of sodium from upper atmospheric dust particles. Geophys. Res. Lett. 14, 76–79. doi:10.1029/gl014i001p00076
Wazwaz, A. M. (2009). Partial differential equations and solitary waves theory, non-linear physical science. Berlin, Heidelberg: Springer.
Williams, B. P., Croskey, C. L., She, C. Y., Mitchell, J. D., and Goldberg, R. A. (2006). Sporadic sodium and E layers observed during the summer 2002 MaCWAVE/MIDAS rocket campaign. Ann. Geophys. 24, 1257–1266. doi:10.5194/angeo-24-1257-2006
Xu, J. Y., and Smith, A. K. (2003). Perturbations of the sodium layer: controlled by chemistry or dynamics? Geophys. Res. Lett. 30. doi:10.1029/2003gl018040
Xu, J. Y., and Smith, A. K. (2004). Studies of gravity wave-induced fluctuations of the sodium layer using linear and non-linear models. J. Geophys. Res. Atmos. 109, D02306. doi:10.1029/2003jd004038
Xue, X. H. (2007). Studies on geoeffectiveness of coronal mass ejections and near–earth space environment. Hefei, China: Ph.D, University of Science and Technology of China.
Zabusky, N. J., and Kruskal, M. (1965). Interaction of “solitons” in a collisionless plasma and the recurrence of initial states. Phys. Rev. Lett. 15, 240–243. doi:10.1103/PhysRevLett.15.240
Zhou, Q. H., and Mathews, J. D. (1995). Generation of sporadic sodium layers via turbulent heating of the atmosphere? J. Atmos. Terr. Phys. 57, 1309–1319. doi:10.1016/0021-9169(95)97298-i
Keywords: sporadic sodium layers, non-linear wave, solitary wave, soliton, lidar
Citation: Qiu S, Shi M, Yousof H, Soon W, Jia M, Xue X, Li T, Ju P and Dou X (2023) Solitary wave characteristics on the fine structure of the mesospheric sporadic sodium layer. Front. Astron. Space Sci. 10:1241663. doi: 10.3389/fspas.2023.1241663
Received: 17 June 2023; Accepted: 23 August 2023;
Published: 12 September 2023.
Edited by:
Daniel Emmons, Air Force Institute of Technology, United StatesReviewed by:
Guotao Yang, Chinese Academy of Sciences (CAS), ChinaAsit Saha, Sikkim Manipal University, India
Sheng-Yang Gu, Wuhan University, China
Copyright © 2023 Qiu, Shi, Yousof, Soon, Jia, Xue, Li, Ju and Dou. This is an open-access article distributed under the terms of the Creative Commons Attribution License (CC BY). The use, distribution or reproduction in other forums is permitted, provided the original author(s) and the copyright owner(s) are credited and that the original publication in this journal is cited, in accordance with accepted academic practice. No use, distribution or reproduction is permitted which does not comply with these terms.
*Correspondence: Shican Qiu, c2NxQHVzdGMuZWR1LmNu; Xiankang Dou, ZG91QHVzdGMuZWR1LmNu
 Shican Qiu
 Mengxi Shi1
 Hamad Yousof
 Willie Soon
 Xianghui Xue