 Paul Prikryl
 Vojto Rušin
- 1Physics Department, University of New Brunswick, Fredericton, NB, Canada
- 2Astronomical Institute, Slovak Academy of Sciences, Tatranská Lomnica, Slovakia
A tendency of heavy rainfall-induced floods in Canada to follow arrivals of solar wind high-speed streams (HSSs) from coronal holes is observed. Precipitation events during the winter, including extreme freezing rain events in the province of New Brunswick, also tend to occur following HSSs. More direct evidence is provided using the satellite-based gridded precipitation dataset Integrated Multi-satellitE Retrievals for GPM (IMERG) in the superposed epoch analysis of high-rate precipitation. The results show an increase in the high-rate daily precipitation occurrence over Canada following arrivals of major HSSs. This is consistent with previously published results for other mid-latitude geographic regions. The ERA5 meteorological reanalysis is used to evaluate the slantwise convective available potential energy (SCAPE) that is of importance in the development of storms. The role of the solar wind-magnetosphere-ionosphere-atmosphere coupling, mediated by globally propagating aurorally excited atmospheric gravity waves releasing the conditional symmetric instability in the troposphere leading to convection and precipitation, is proposed.
1 Introduction
Solar influences on weather and climate through changes in total solar irradiance (Reid, 1997; Crowley, 2000), ultraviolet flux (Chandra and McPeters, 1994), and galactic and extragalactic cosmic rays modulated by solar activity (Harrison and Carslaw, 2003) have been extensively studied and reviewed (Gray et al., 2010).
A possible influence of solar wind and the resulting geomagnetic activity on the winter mid-latitude tropospheric circulation on the scale of days was suggested in the 1960s and 1970s. Wintertime deepening of 300-mb troughs has been found to be statistically related to geomagnetic activity (Macdonald and Roberts, 1960; Roberts and Olson, 1973). Wilcox et al. (1973) and Wilcox et al. (1974) discovered a relation (now referred to as the “Wilcox effect”) between the solar magnetic sector structure and tropospheric vorticity using the upper-level tropospheric vorticity area index, which is a proxy for extratropical storminess. These results have been shown to be statistically significant (Hines and Halevy, 1977), raised a lively discussion among scientists (Williams, 1978; Williams and Gerety, 1978; Burns et al., 1980; Rostoker and Sharma, 1980; Arora and Padgaonkar, 1981; Lundstedt, 1984), and prompted a search for a physical mechanism that could explain these results (Park, 1976; Wilcox et al., 1976; Wilcox, 1979; Wilcox and Scherrer, 1981). More recently, the dawn–dusk (By) component of the interplanetary magnetic field (IMF) and atmospheric electrical circuit influences on the ground-level atmospheric pressure have been shown (Burns et al., 2007; Burns et al., 2008; Tinsley, 2008; Lam et al., 2013; Lam et al., 2014; Lam and Tinsley, 2016), and Lam and Tinsley (2016) reviewed the connections of solar wind–atmospheric electricity–cloud microphysics to weather and climate. Owens et al. (2014) considered the polarity of the magnetic field modulating lightning in UK, and Scott et al. (2014) observed solar wind modulation of lightning in response to the arrival of solar wind high-speed streams coinciding with an increased flux of solar energetic protons.
A tendency of significant weather conditions, including explosive extratropical cyclones (Prikryl et al., 2016; Prikryl et al., 2018), rapid intensification of tropical cyclones (Prikryl et al., 2019), and heavy rainfall causing floods (Prikryl et al., 2021a; Prikryl et al., 2021b), to follow arrivals of solar wind high-speed streams from coronal holes has been observed. A possible physical mechanism that could explain these results was proposed (Prikryl et al., 2003; Prikryl et al., 2007; Prikryl et al., 2009a; Prikryl et al., 2009b).
Extreme weather events, such as heavy precipitation leading to floods or flash floods, particularly in summer, and snow- or ice-storms in winter, pose natural hazards with major socio-economic and environmental consequences (Brooks et al., 2001; Burn et al., 2016; Buttle et al., 2016). Despite the advances made in forecasting and improved understanding of mesoscale processes (Doswell and Bosart, 2001), predictions of extreme precipitation events continue to present difficult challenges (Doswell and Bosart, 2001; Villarini et al., 2010; Gourley et al., 2012). Such events are common in Canada, and with climate change affecting the stability of the Earth’s atmosphere, their occurrence is expected to increase (Burn and Whitfield, 2016). Buttle et al. (2016) ( Table 2) reviewed the key processes, classified as meteorological, hydrological, geomorphic, and human-induced, which generate floods in Canada.
In this paper, we focus on heavy precipitation events in Canada where the proximity of the auroral zone, the source region of atmospheric gravity waves (AGWs), makes it the most favorable geographic location to investigate the relationship between high-rate precipitation occurrence and solar wind high-speed streams.
2 Data sources and methods
A list of heavy rainfall-induced flood events in Canada between 1966 and 2020 is compiled from various other sources (https://www.for.gov.bc.ca/hfd/library/documents/, https://www.public-safety.gc.ca/cnt/rsrcs/cndn-dsstr-dtbs/index-en.aspx). The initial days of heavy rainfall events (some lasting for a few days) that lead to these floods were checked and identified as the events’ first days with significant rainfall by browsing historical weather data on the Environment and Climate Change Canada website (https://climate.weather.gc.ca/index_e.html).
Winter storm precipitation events, including extreme freezing rain, which caused power outages in the Province of New Brunswick have been studied by Chartrand and Thériault (2020) and Chartrand et al. (2022). These events were associated with a low-pressure system and were identified in sea-level pressure maps.
The Integrated Multi-satellitE Retrievals for GPM (IMERG) Final Precipitation L3 1 day 0.1° × 0.1° V06 (GPM_3IMERGDF) dataset (Huffman et al., 2019) is provided by the Goddard Earth Sciences Data and Information Services Center (https://disc.gsfc.nasa.gov/datasets/GPM_3IMERGDF_06/summary?keywords=IMERG).
For the analysis of moist symmetric instability in the troposphere, the latest hourly climate reanalysis produced by ECMWF, ERA5, at 0.25 × 0.25° is utilized (Hersbach et al., 2020). Following Chen et al. (2018), indices including convective available potential energy (CAPE), slantwise CAPE (SCAPE), and vertically integrated extent of realizable symmetric instability (VRS) are diagnosed, to assess the likelihood of slantwise convection in the observed precipitation events.
For the study of high-rate precipitation occurrence in the context of solar wind, the interplanetary magnetic field and solar wind plasma data are provided by the National Space Science Data Center (NSSDC), OMNIWeb (http://omniweb.gsfc.nasa.gov) (King and Papitashvili, 2005). The OMNI data also include geomagnetic indices, e.g., the Dst index that is used to characterize geomagnetic storms (Gonzalez et al., 1994). Solar wind plasma parameters are used to identify co-rotating interaction regions (CIRs) at the leading edge of high-speed streams (HSSs). As CIRs pass by a spacecraft, the solar wind density increases to a maximum and then decreases within a narrow stream interface while the magnetic field magnitude peaks. This interface between the fast and slow solar wind defines arrivals of HSSs. The high-density plasma ahead of CIRs (Tsurutani et al., 1995) and interplanetary coronal mass ejections (ICMEs) are also known to be highly geoeffective (Gopalswamy, 2016; Tsurutani et al., 2016). A catalog of near-Earth ICMEs was compiled by Richardson and Cane (2010) (https://izw1.caltech.edu/ACE/ASC/DATA/level3/icmetable2.html).
The sources of HSSs are coronal holes, open solar magnetic field regions that appear dark in the solar corona observed in the emission lines of ionized atoms, e.g., Fe XIV, 530.3 nm. Measurements of this green coronal emission by ground-based coronagraphs at high altitudes have been merged into a modified homogeneous coronal dataset (Dorotovič et al., 2014) (https://www.suh.sk/online-data), as a continuation of the original homogenized coronal dataset (Rybanský, 1975; Rybanský et al., 2005).
Super Dual Auroral Radar Network (SuperDARN) radars (Chisham et al., 2007) measure the line-of-sight velocity of ionospheric irregularities (ionospheric convection) and ground scatter power to observe traveling ionospheric disturbances, such as the ones caused by atmospheric gravity waves.
The superposed epoch analysis (SPE) method (Ambrož, 1979) is applied on the time series of green corona intensity, solar wind parameters and high-rate precipitation keyed to heavy rainfall events, arrivals of major HSSs/CIRs (Prikryl et al., 2021a; Prikryl et al., 2021b), or the maximum growth rate of extratropical cyclones (Prikryl et al., 2016).
3 The SPE analysis of high precipitation occurrences in the context of solar wind HSSs
Following the approach taken in previous studies ( Prikryl et al., 2021a; Prikryl et al., 2021b), the SPE analysis (Figures 1A, B) of the time series of the green corona intensity and solar wind variables is keyed to the initial days of heavy rainfall events that lead to floods in Canada. For each epoch day, Figure 1C shows, for the IMERG data that are available since 2000, the cumulative number of IMERG grid cells over Canada up to 60° N of latitude where daily precipitation rates exceeded thresholds of 60, 80, 100, and 120 mm. Figure 1A shows a depletion in the mean green corona intensity at low heliographic latitudes before the epoch day −2, which is due to superposition of coronal holes that are sources of HSSs arriving a few days later, as shown by the mean solar wind variables in Figure 1B, with the mean velocity, V, ramping up to a maximum on epoch day +1. The broad peaks in the mean density and magnetic field are due to superposition of CIRs. The standard deviation, σBz, of the IMF, BZ, component, which is a measure of solar wind Alfvén wave amplitudes, also maximizes around the epoch day 0. These results suggest these heavy rainfall events tend to follow arrivals of HSSs/CIRs.
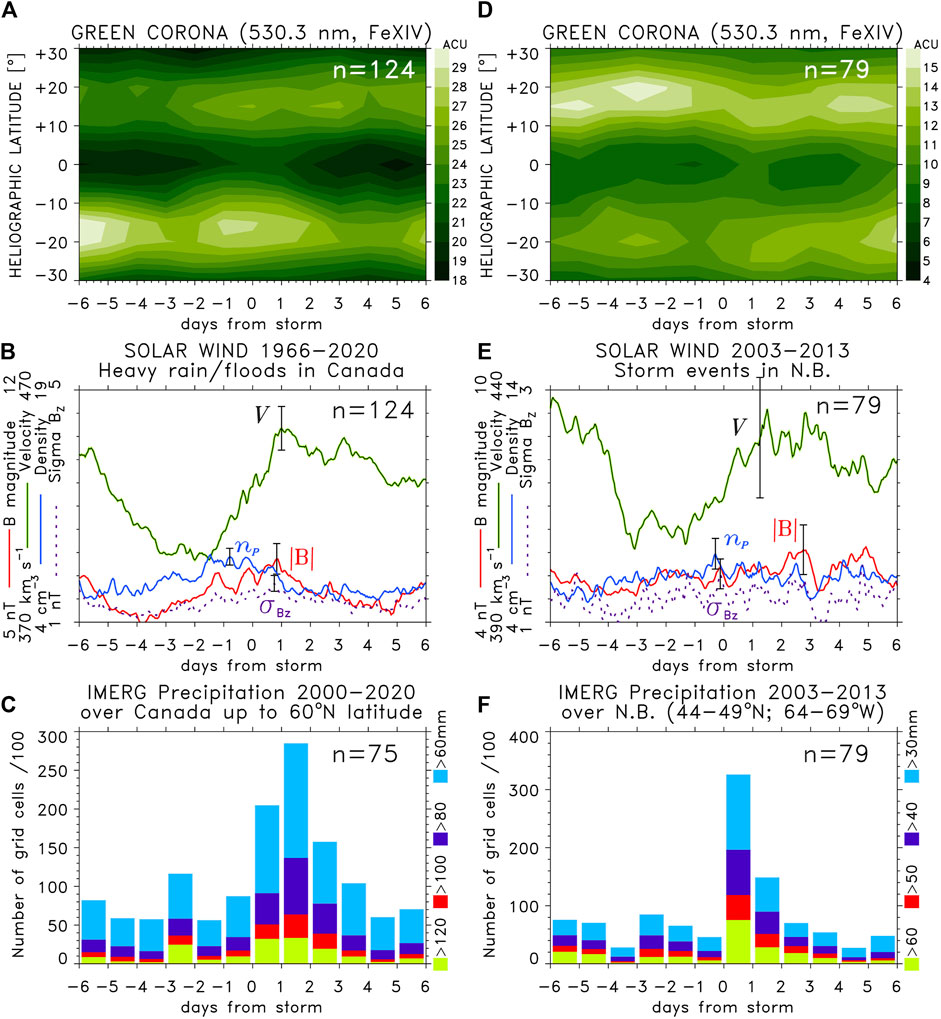
FIGURE 1. SPE analysis of the time series of (A,D) green corona intensity and (B,E) solar wind plasma variables keyed to start dates of (left panels) heavy rainfall-induced flood events in Canada and (right panels) significant precipitation events, including snow and freezing rain in New Brunswick (NB). The representative standard error bars for the mean values are shown. Bottom panels show cumulative numbers of grid cells with above-threshold daily precipitation rates (C) over Canada up to latitude 60° N and (F) over a rectangular area that includes NB.
Figures 1D, E show the results of the SPE analysis keyed to start days of significant precipitation events, including snow and freezing rain (Chartrand et al., 2022) that caused power outages in New Brunswick (NB) during 2003–2013. Figure 1F shows the cumulative number of IMERG grid cells over a rectangular area that includes NB, where daily precipitation rates exceeded thresholds of 30, 40, 50, and 60 mm. Although the patterns of the mean V pattern and the depletion in the mean green corona intensity are similar to those in Figures 1A, B, the increase in the mean density, np, and magnetic field magnitude, B, around epoch day 0 is less prominent. The pattern still indicates that many NB events were associated with arrivals of HSSs/CIRs. The peaks in B and np at later epoch days (+2 and +4) are due to superposition of ICMEs, as further discussed later.
In Figure 2, to examine the statistical occurrence of high-rate precipitation relative to arrivals of HSSs/CIRs, the approach is inverted by defining the key time in the SPE analysis as arrival times of major HSSs/CIRs. For the period of 2000–2020 and major HSSs reaching a maximum solar wind velocity Vmax >600 km/s, Figures 2A, B show the SPE analysis results for the green corona intensity and solar wind parameters. As expected, the superposition of HSSs/CIRs relative to the well-defined interface between the fast and slow solar wind results in sharp peaks in the mean values of np, B, and σBz close to the key time, while mean solar wind velocity V increases from a minimum before to a maximum after the key time (Figure 2B), with the mean coronal hole preceding it by about 4 days.
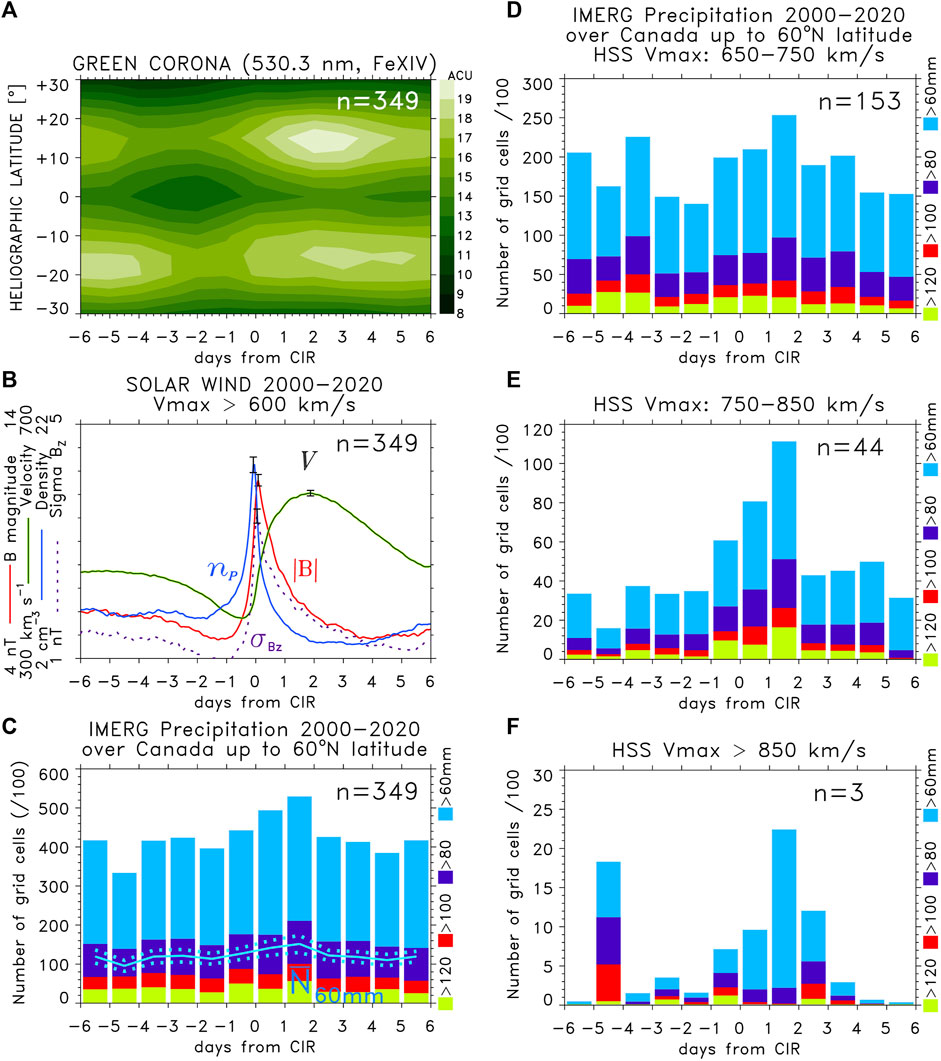
FIGURE 2. SPE analysis of the time series of (A) green corona intensity and (B) solar wind plasma variables keyed to arrivals of major HSSs/CIRs for solar wind streams that reached maximum velocity Vmax >600 km/s. (C) Histograms show cumulative numbers of IMERG grid cells (divided by 100) over Canada up to 60° N latitude with above-threshold daily precipitation rates. Line plots (in the blue color) of the mean numbers of grid cells with the precipitation rate exceeding 60 mm/day, along with standard error bars for the mean that are superposed. (D–F) Cumulative numbers of IMERG grid cells for the SPE analysis performed for three ranges of Vmax.
The main interest in this analysis is the total cumulative number of IMERG grid cells over Canada, up to 60° N latitude where daily precipitation rates exceeded given thresholds, summed up for each epoch day relative to the key time (Figure 2C). The occurrence of high-rate precipitation shows an increase starting at epoch day −1, to a maximum at epoch day +1 following the arrival of HSSs/CIRs. For the numbers of grid cells with the precipitation rate exceeding 60 mm/day, the mean ± standard error of the mean is shown. While the observed increase is relatively small, it is greater than the standard error of the mean. Furthermore, splitting the analysis into subperiods shows that the increase persists and becomes progressively more prominent for faster HSSs. The SPE analysis for three intervals of Vmax (Figures 2D–F) shows the increase in the cumulative number of IMERG grid cells with above-threshold daily precipitation rates. In all three cases, high precipitation rates peak at epoch day +1. For progressively faster/stronger HSSs/CIRs, the relative increase in the high-rate precipitation occurrence following the key time is higher (Figures 2E, F). It is important to vary n and group the analysis by Vmax. First, larger n should yield higher statistical significance for SPE results. Second, faster HSSs result in stronger MIA coupling. Third, the grouping into subperiods allows the consistency of SPE results to be checked.
In the case of NB events that caused power outages in the period of 2003–2013, we identified extratropical cyclones that caused the storms. Using global satellite images of clouds provided by the International Satellite Cloud Climatology Project (ISCCP), the Global ISCCP B1 Browse System (GIBBS) (https://www.ncdc.noaa.gov/gibbs/) and the mean sea level pressure (SLP) fields from the JRA-55 meteorological reanalysis data, the minima of central pressure of deepening extratropical cyclones were traced. Following the criterion introduced by Sanders and Gyakum (1980), the normalized central pressure deepening rate (NDRc) [Lim and Simmonds 2002; their Eq. (1)] was computed. The maximum deepening rates of the cyclones are used as key times in the SPE analysis, with Figure 3C showing the mean SLP and deepening rate dP/dt. The results for the green corona intensity and solar wind plasma variables (Figures 3A, B) are similar to those in Figures 1D, E and to the previously published results linking the explosive development of extratropical cyclones to arrivals of HSSs/CIRs (Prikryl et al., 2016). The pattern of an increase in mean solar wind velocity V, from a minimum before the key time to a maximum at the epoch day + 2, with substantial increase in mean solar wind density np and magnetic field magnitude B starting from epoch day −2 is due to superposition of the number of CIRs that are shown in histograms between epoch days −2 and +1. This indicates a tendency of intensification of these cyclones to be associated with arrivals of HSSs/CIRs, which are often preceded by high-density plasma that is further discussed in the next section. In addition to CIRs, six ICMEs that are superposed on epoch day +1 contributed to peaks in B and np. However, as will be discussed in Section 6, HSSs/CIRs generate trains of AGWs. The impacts of ICMEs, while often resulting in geomagnetic storms, are more impulsive but short-lived.
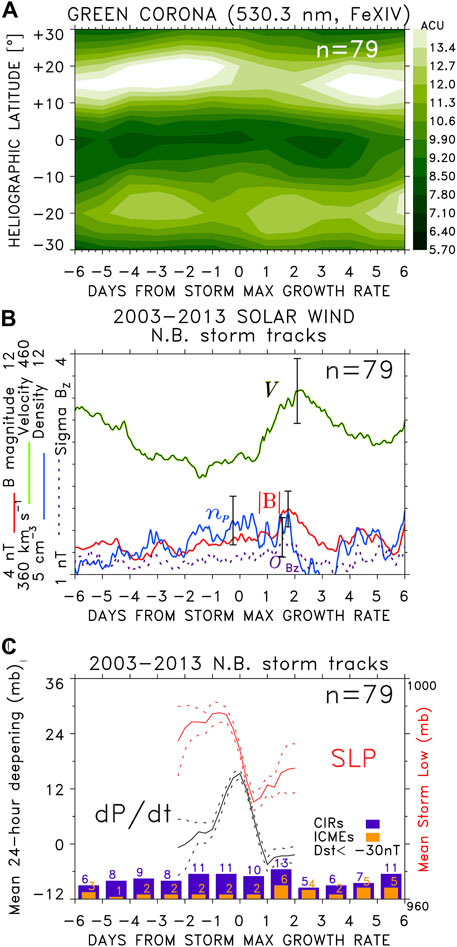
FIGURE 3. SPE analysis of the time series of (A) green corona intensity and (B) solar wind plasma variables keyed to the maximum growth (deepening) rate of extratropical cyclones that caused NB storm events. (C) Corresponding mean sea level pressure and mean deepening rate. The dotted lines show the standard error of the mean. Histograms of the number of CIRs (purple) and ICMEs (orange) are shown at the bottom.
4 Cases of high precipitation events leading to floods in the context of solar winds
4.1 Heavy rainfall-induced floods in Canada
The results of SPE analyses in Figures 1, 2 indicate a strong tendency of high-precipitation occurrence following arrivals of HSSs from coronal holes. We now examine cases of heavy rainfall events in the context of solar wind disturbances, including HSSs/CIRs (Gosling and Pizzo, 1999; Tsurutani et al., 2006a; Tsurutani et al., 2006b) and interplanetary coronal mass ejections (Gopalswamy, 2016). The solar wind magnetic sector boundaries, where the IMF direction switches its polarity between “away” and “toward” the Sun, that have been identified as heliospheric current sheets (HCSs; Smith et al., 1978; Hoeksema et al., 1983), usually closely precede or are imbedded within CIRs at the leading edge of HSSs. The high-density plasma (HDP) ahead of HCSs/CIRs leads to magnetic field compression, which is another geoeffective solar wind disturbance (Tsurutani et al., 1995). In the absence of IMF data, the magnetic sectors can be estimated from ground-based magnetograms (Svalgaard, 1975).
Figure 4 shows solar wind variables such as the IMF direction longitude (orange crosses) and the Dst index (green line). The symbols on the time axis indicate the times of HSS/CIR arrivals, impacts of ICMEs, and the IMF sector boundary/HCS crossings. Where available, the proxy magnetic field sectors (A: away; T: toward) are indicated below the time axis. Start dates of heavy rainfall events in Canada included in the SPE analysis are marked by symbols at the top. These are examples of events that occurred following arrivals of HSSs/HCSs/CIRs or impacts of ICMEs that caused geomagnetic storms. On 8 June 1999 (Figure 4A), White Rock, BC, experienced a sudden, intense storm with heavy rain that caused flash floods and mudslides. In July 1999 (Figure 4B), heavy snow and rain fell starting on July 2 caused flooding in Clearwater, AB. On September 22–23 (Figure 4C), Prince Edward Island experienced a severe rainstorm, causing flash flooding, damaging eight highways and bridges. The IMERG satellite-based precipitation data for June 2000 are obtained. At the top in Figures 4D, E, the maximum IMERG daily rates at any grid cell over Canada (solid purple line) and the number of IMERG grid cells over Canada with precipitation rates exceeding 50 mm (dotted line) are shown. Figures 4C, D show cases of heavy rainfall events in New Brunswick and Quebec, respectively, and enhanced high-rate precipitation occurrence following HSSs/CIRs. More events in the context of solar wind can be viewed in the Supplementary Material.
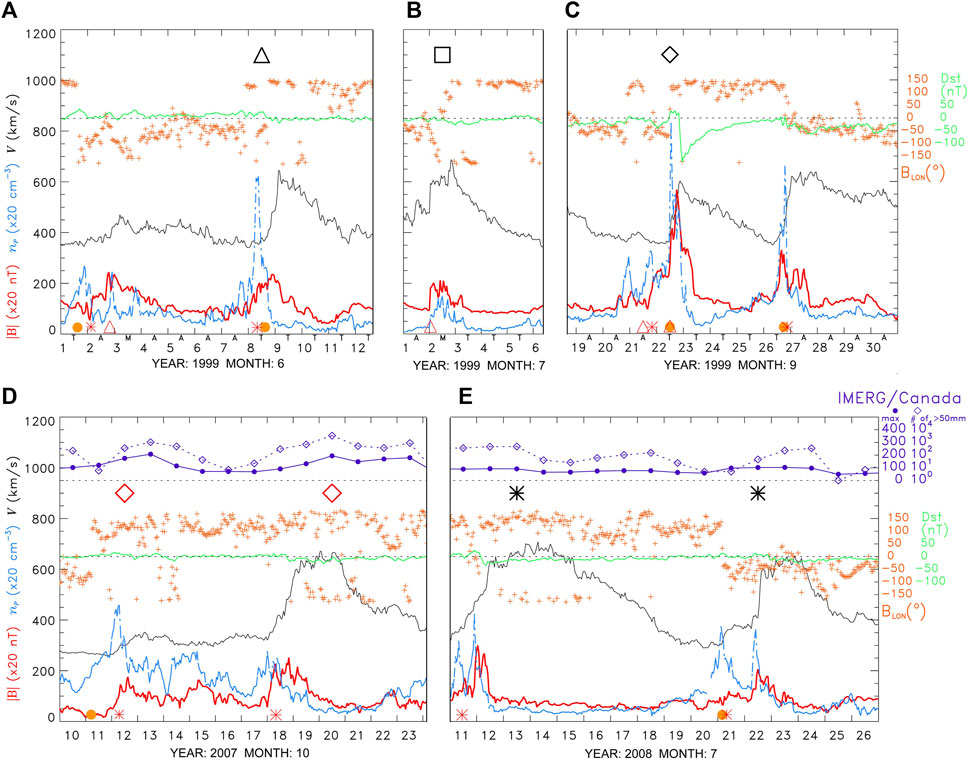
FIGURE 4. OMNI solar wind V (solid black line), B (red), and np (broken light blue line, with the y-axis scales shown on the left). The magnetic field direction longitude (orange crosses) and the Dst index (green line) with the y-axis are shown on the right. The symbols at the time axis indicate CIRs ( ), ICMEs (
 ), HCSs (
 ), and the proxy magnetic field sector (A: away; T: toward). (A–E) The symbols at the top mark the starting days of heavy rainfall-induced floods in Canada (∆ BC; □ AB/SK/MB; ⁎ ON/QC; ◊ NS/PEI/NL;
  NB). (D,E) Maximum IMERG daily rates (solid purple line); the number of grid cells over Canada with precipitation rates exceeding 50 mm (dotted purple line) is shown at the top.
4.2 Winter NB storm precipitation events in December 2010
Several heavy precipitation events affected eastern Canada in December 2010. Figure 5 shows the maximum IMERG daily rates and the number of grid cells over New Brunswick with precipitation rates exceeding 50 mm. The focus here is on the NB storms (marked by red diamonds) that followed rapid intensifications of extratropical cyclones (marked by open circles scaled by the maximum normalized deepening rate of the central mean SLP). On December 6, the storm that caused strong winds, heavy wet snow, and floods coincided with the arrival of a broad CIR on the leading edge of a moderate HSS that was preceded by high-density plasma adjacent to HCSs. While heavy precipitation and an extreme storm surge that caused floods occurred after the low pressure reached the east coast on December 6, this extratropical cyclone explosively deepened off the East Coast of the United States. Figure 6A shows the daily accumulated precipitation on December 6, overlaid with the storm track. The maximum deepening rate and the minimum central SLP reached are indicated in green and red colors, respectively. Another intense storm during December 13–14 resulted in extensive flood damages in New Brunswick and Quebec. It was caused by a rapidly deepening low-pressure system (Figure 6B) that closely followed the arrival of a major HSS/CIR (Figure 5). The cyclone brought heavy rain, wet snow, and strong winds, causing major power outages in New Brunswick. Heavy rain and floods also occurred in Gaspé, QC, when the high-rate IMERG precipitation peaked. Figure 6B shows the daily accumulated precipitation on December 13, overlaid with the storm track. Similarly, minor HSSs/CIRs on December 20 and 25 were followed by rapid intensifications of extratropical cyclones over the east coast, which brought heavy rain, wet snow, and strong winds to New Brunswick. The December 21 storm also caused a storm surge and flooding. In each case, there was an increase in the IMERG high-rate precipitation occurrence over New Brunswick (Figure 5).
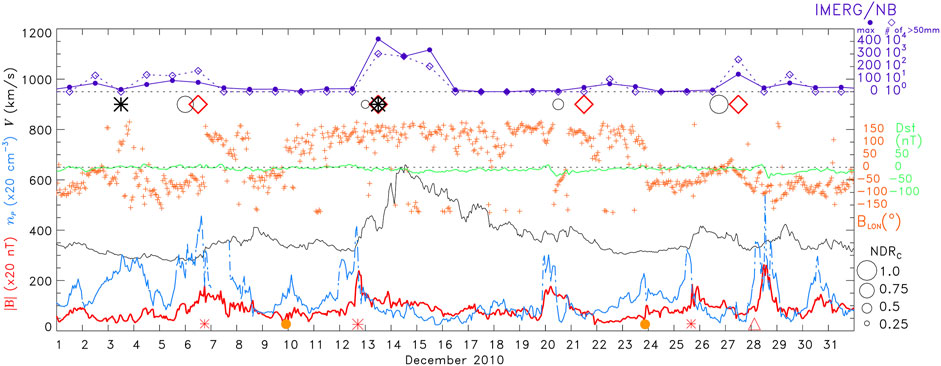
FIGURE 5. OMNI solar wind V (solid black line), B (red), and np (broken light blue line, with the y-axis scales shown on the left). The magnetic field direction longitude (orange crosses) and the Dst index (green line) with the y-axis shown on the right. The symbols at the time axis indicate CIRs ( ), ICMEs (
 ), and HCSs (
 ). Open circles scaled by the maximum normalized deepening rate (NDRc) of the central mean SLP of extratropical cyclones that caused NB storms. The symbols mark the starting days of heavy rainfall-induced floods in Canada (∆ BC; □ AB/SK/MB; ⁎ ON/QC; ◊ NS/PEI/NL;
  NB storms).
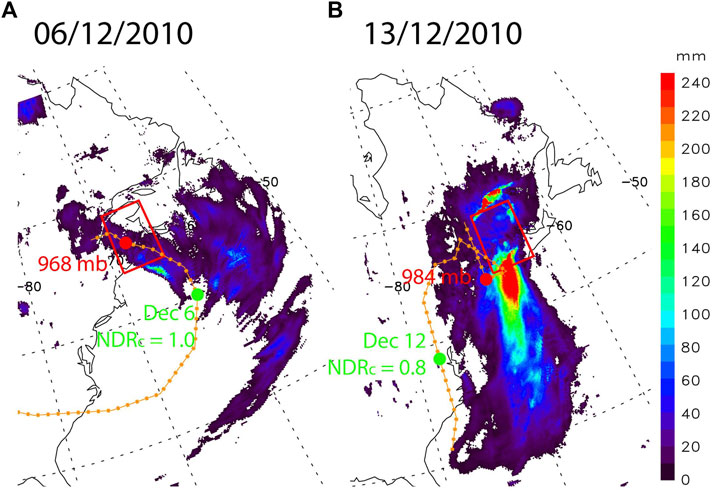
FIGURE 6. IMERG daily accumulated precipitation (A) on December 6 and (B) 13 December 2010. The rectangular area around New Brunswick is superposed. Tracks of central SLP of intensifying extratropical cyclones (orange line) with the maximum deepening rate and minimum central SLP are shown by green and red dots, respectively.
5 Assessment of conditional symmetric instability and slantwise convection
Prikryl et al. (2009b) suggested that down-going aurorally-excited atmospheric gravity waves could contribute to release of moist symmetric instability, leading to slantwise convection (Schultz and Schumacher, 1999). Such a mechanism could explain the aforementioned results linking severe weather occurrences to solar wind events. In this section, the presence of slantwise convection in frontal zones is assessed for cases of extratropical cyclones using the method discussed by Chen et al. (2018).
Release of conditional symmetric instability (CSI; Schultz and Schumacher, 1999; Chen et al., 2018) has been known to initiate slantwise convection over frontal precipitation bands (Bennetts and Hoskins, 1979; Bluestein, 1993; Houze, 1993; Emanuel, 1994). The warm frontal cloud bands, in rapidly intensifying extratropical cyclones, were identified as “striated delta” clouds (Feren, 1995). Glinton et al. (2017) (Figures 1, 2) studied cases of CSI release contributing to precipitation in mature extratropical cyclones. Chen et al. (2018) (Figures 7, 10) investigated the evolution of slantwise convective available potential energy and CAPE in explosive and nonexplosive cyclones. They found that SCAPE exhibits values greater than CAPE prior to the onset of the rapid intensification of explosive cyclones and then decreases sharply thereafter, thus pointing to the importance of CSI in the development of storms.
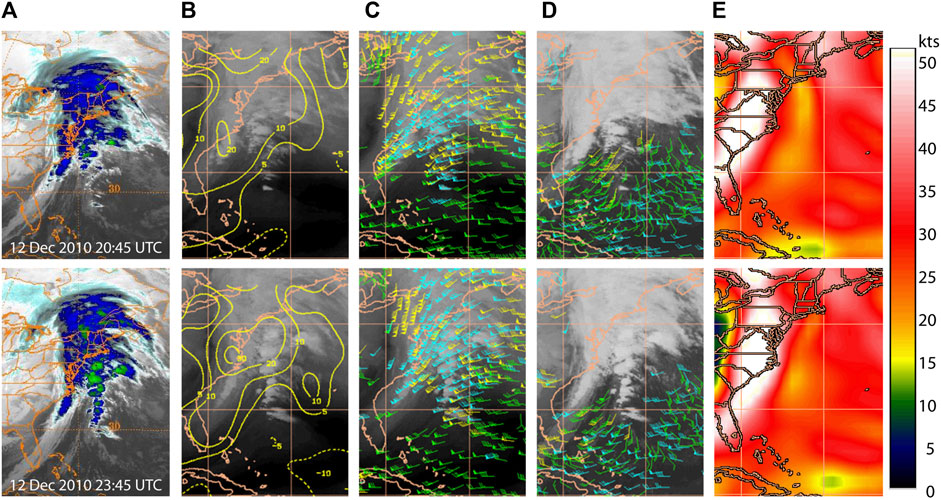
FIGURE 7. (A) GOES-13 infrared images (https://www.ncdc.noaa.gov/gibbs/) of an intensifying extratropical cyclone showing “back building” squall lines. Overlay data products from the CIMSS data archive (http://tropic.ssec.wisc.edu/archive/) of wind analysis show (B) upper-level (150–300 mb) divergence, (C) mid-upper-level winds, (D) low-level IR-cloud drift winds, and (E) mid-level wind shears.
5.1 Case of the storm on 12–13 December 2010
The GOES-13 infrared images (https://www.ncdc.noaa.gov/gibbs/) of an intensifying extratropical cyclone showed “back building” convection cells along squall lines (Bluestein and Jain, 1985) off the East Coast of United States (Figure 7A). The CIMSS data archive (http://tropic.ssec.wisc.edu/archive/) provides overlay data products from wind analysis. The enhanced upper-level (150–300 mb) divergence (Figure 7B) indicates a region with rising air motion. There were strong mid-upper-level southwesterly winds (Figure 7C), low-level winds (Figure 7D) turning southerly over a string of convection cells, and large mid-level wind shear (Figure 7E). Furthermore, low-level winds and vertical wind shears based on the ERA5 reanalysis are also shown in Figure 8, discussed as follows. These conditions are conducive to over-reflection of down-going aurorally excited AGWs with a possibility of amplification (Section 6.3). The over-reflecting AGWs in the unstable frontal zone could contribute to the release of CSI, resulting in a series of convection cells forming the “back building” squall line. Similar cases of intensifying extratropical cyclones were discussed previously (Prikryl et al., 2018; including Supplementary Material).
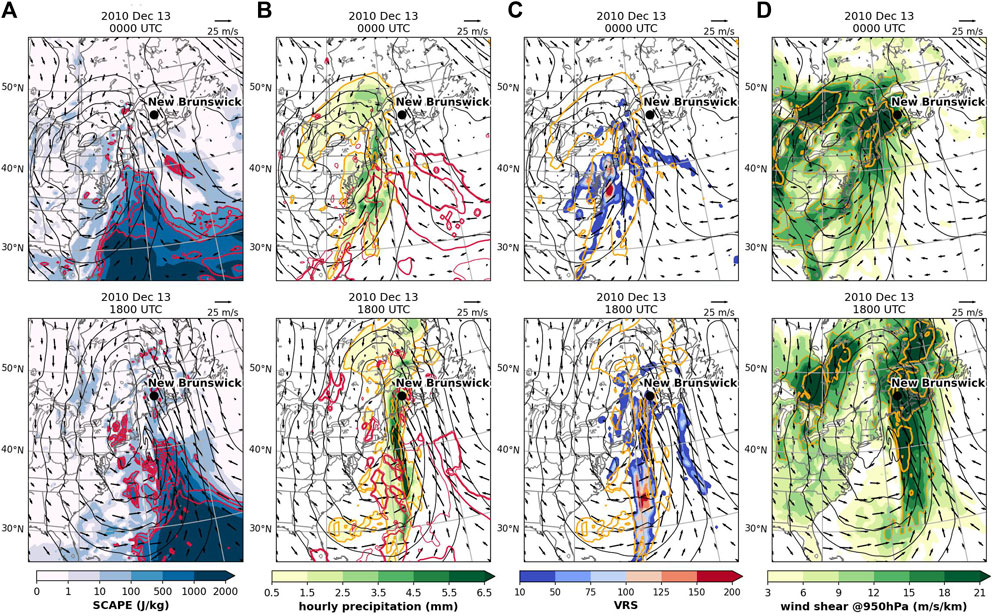
FIGURE 8. (A) SCAPE (shaded) and SCAPE–CAPE (red contours; 100, 300, and 500 J/kg), (B) 1-h accumulated precipitation (shaded) and fs (red contours; thin for 0.5 and thick for 0.8), and (C) VRS (shaded) and precipitation (yellow contours; 0.5 and 5.5 mm), (D) low-level wind shear (yellow contour; 12, 21 m/s/km). (A–D) All overlapped with 950-hPa wind (vectors; m/s) and 950-hPa geopotential height (black contours; m; at intervals of 50 m).
Several indices are calculated using the ERA5 reanalysis to evaluate the likelihood of slantwise convection in this case. These indices that provide different but Supplementary Material, include SCAPE, fractional SCAPE residual (fs = (SCAPE—CAPE)/SCAPE), and vertically integrated extent of realizable symmetric instability (Glinton et al., 2017; Chen et al., 2018). A high SCAPE, indicating high convective available potential energy for a slantwise ascending air parcel from low levels, is found but limited to the warm sector of the cyclone (Figure 8A). A closer-to-one fs indicates the relative dominance of slantwise over upright convection, although such a condition is also scattered mostly in the south (Figure 8B). While the aforementioned two indicate the potential energy, VRS shows the thickness of the air layer (measured in pressure), where CSI, high relative humidity, and vertical motion coexist (Chen et al., 2018). Figure 8C shows that the cold front, where strings of “back building” convection cells (Figure 7A) produced high-rate precipitation co-located well with a high VRS value of above 150 hPa, shows a strong indication that CSI is being released actively there. Such high VRS values well-match the high precipitation band persisted for more than 1 day. As already noted previously, this was co-located with low-level southerly winds and wind shears evaluated between 900 and 1,000-hPa levels (Figure 8D), which is favorable for over-reflection of AGWs.
5.2 Case of the storm on 5–6 December 2010
The extratropical cyclone that caused heavy rain in New Brunswick on December 6 explosively intensified off the east coast (Figure 6A). This coincided with the arrival of the solar wind high-density plasma sheet on the leading edge of a moderate HSS/CIR (Figure 5). Figure 9A shows the GOES-13 infrared images (https://www.ncdc.noaa.gov/gibbs/) of an explosive extratropical cyclone showing development of a “striated delta” cloud in the cyclone vortex and “back building” bands in the cold front. They coincide with regions of high SCAPE and close-to-one fs (Figure 9B). The resulting latent heat release could have contributed to the explosive development of the cyclone that later brought heavy rainfall to New Brunswick (Figure 6A).
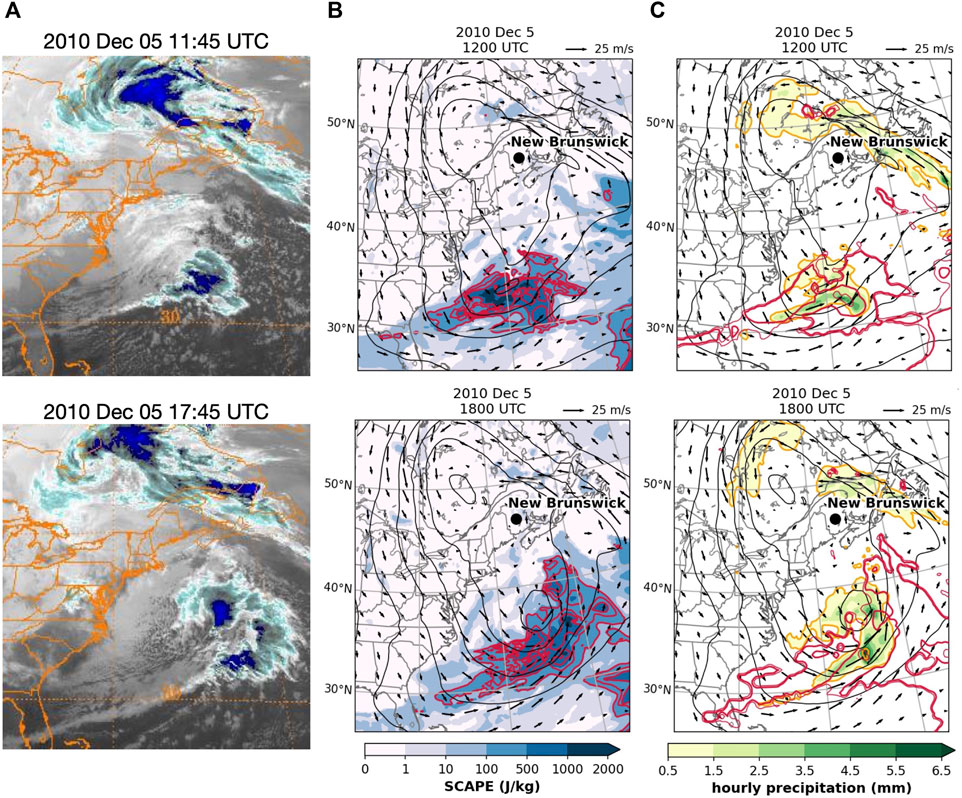
FIGURE 9. (A) GOES-13 infrared images (https://www.ncdc.noaa.gov/gibbs/) of an explosive extratropical cyclone showing a “striated delta” cloud in the cyclone vortex and “back building” bands in the cold front. (B) SCAPE (shaded) and SCAPE–CAPE (red contours; 100, 200, 300, and 400 J/kg), (C) 1-h accumulated precipitation (shaded) and fs (red contours; thin for 0.5 and thick for 0.8). (B,C) All overlapped with the 950-hPa wind (vectors; m/s) and 950-hPa geopotential height (black contours; m; at intervals of 50 m).
While large SCAPE–CAPE residuals are mostly over the warm sector (to the south) of the extratropical cyclone, the heavy precipitation over New Brunswick on December 6, 00:06 UTC (Figure 10B), is co-located with some locally high VRS values (peak >150 hPa thickness at 03:00 UTC) that lasted more than 6 h over the “bent-back warm front” that wraps around the cyclone center. It should be noted that there exist other low-level forcing mechanisms for heavy precipitation, e.g., frontogenetical lifting and the strong low-level convergence of flows associated with two cyclone centers, which was likely the case when the cyclone was reaching New Brunswick (Figure 10B). Nevertheless, heavy precipitation and a storm surge that caused floods coincided with the arrival of a broad HSS/CIR with a dense HDP at its leading edge on December 6. Furthermore, similar to the observation on December 13, the high-rate precipitation was co-located with high low-level winds and wind shears at 950 hPa (Figure 10D). Equatorward propagating AGWs generated by solar wind coupling to the magnetosphere–ionosphere–atmosphere system could have reached the cyclone and contributed to the release of CSI, leading to cyclone intensification.
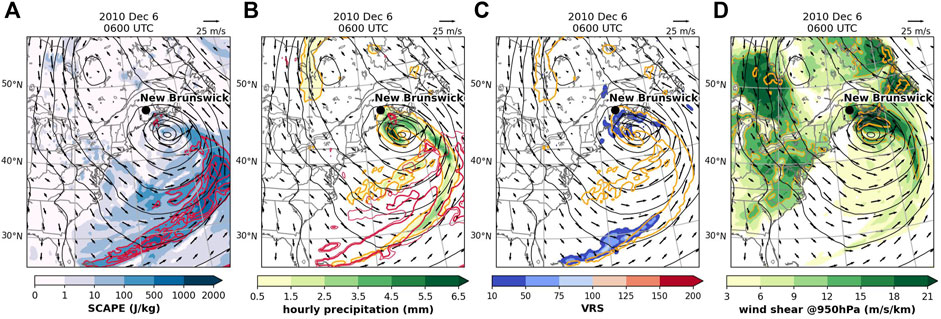
FIGURE 10. Same as Figure 8 but for December 6, 06:00 UTC.
6 Solar wind coupling to the magnetosphere-ionosphere-atmosphere (MIA) system
6.1 High-latitude sources of AGWs in the lower thermosphere
At high latitudes, solar wind coupling to the magnetosphere-ionosphere-thermosphere system is the energy source of auroral heating, primarily Joule heating, due to collisions among electrons, positive ions, and neutral molecules (Brekke and Kamide, 1996; Knipp et al., 2004; Thayer and Semeter, 2004; Xu et al., 2013; Richmond, 2021), although its impact on the thermodynamics of the neutral atmosphere is thought to decrease below 100 km (Xu et al., 2013). Auroral heating is highly variable and often driven by ultra-low-frequency (ULF) waves.
The main source of ULF waves are HSSs emanating from coronal holes (Krieger et al., 1973). HSSs from polar coronal holes have speeds of ∼750–800 km/s (Phillips et al., 1994; Phillips et al., 1995; Tsurutani et al., 2006a; Tsurutani et al., 2006b). However, coronal holes that affect the Earth by HSSs are either extensions of polar coronal holes (Phillips et al., 1994) to low latitudes or are self-contained coronal holes forming at low heliographic latitudes (de Toma, 2011). The high-density HCS plasma sheet ahead of CIRs leads to compression of the magnetic field that can cause recurring moderate-to-weak geomagnetic storms (Tsurutani et al., 1995). The high-density plasma sheet impinging onto the magnetosphere results in precipitation of magnetospheric relativistic electrons (Tsurutani et al., 2016). HSSs/CIRs have been shown (Tsurutani et al., 2006a; Tsurutani et al., 2006b) to be associated with high-intensity, long-duration continuous auroral electrojet activity (HILDCAAs) (Tsurutani and Gonzalez, 1987; Tsurutani et al., 1990; Tsurutani et al., 1995). HILDCAAs are caused by trains of solar wind Alfvén waves (Belcher and Davis, 1971) that couple to the magnetosphere–ionosphere system (Dungey, 1961; Dungey, 1995). Coupling produces pulses of Joule heating in the lower thermosphere that can launch AGWs with duration between tens of minutes to hours.
The theoretical understanding of gravity waves and their role in the ionosphere was developed by Hines (1960). The auroral sources of medium- to large-scale gravity waves have been recognized, and AGWs have been observed as traveling ionospheric disturbances (TIDs) for a long time (Chimonas and Hines, 1970; Testud, 1970; Richmond, 1978; Tanaka, 1979; Williams et al., 1993; Balthazor and Moffett, 1997; Oyama et al., 2001; Oyama and Watkins, 2012; Richmond, 2021). Francis (1974) theoretically described and distinguished between direct and Earth-reflected gravity waves and pointed out that the latter appear in the F-region as wave packets of nearly monochromatic waves, while the former induce isolated (nonperiodic) TIDs, which is consistent with the modeling of gravity waves generated by enhancements in the ionospheric electric field (Millward et al., 1993a; Millward et al., 1993b; Millward, 1994). Each electric field enhancement causes a Joule heating pulse, which in turn launches a single gravity wave propagating equatorward and poleward from the source region.
6.2 Global propagation of AGWs
The gravity wave dispersion relation (Hines, 1960) allows both upward (downward phase) and downward group (upward phase) propagation (Hocke and Schlegel, 1996). For clarity, we will refer to downward/upward group (wave energy) propagation as down/upgoing AGWs to distinguish them from upward/downward AGW phase propagation. Yeh and Liu (1974) used the ray theory approach and the WKB approximation and pointed out that a simplified ray tracing procedure based on Snell’s law is applicable for a horizontally stratified atmosphere, e.g., (Bristow et al., 1996; Prikryl et al., 2005; and Prikryl et al., 2009b). A dispersion relation derived from Navier-Stokes equations (Bristow et al., 1996) with temperature gradients included by allowing the scale height to vary with altitude but not considering viscosity, thermal conductivity, and ion drag, showed results suggesting a seasonally dependent reflection of gravity waves due to the temperature gradient at mesospheric altitudes.
Based on a spectral model in terms of spherical harmonics, Mayr et al. (1984a) and Mayr et al. (1984b) described gravity wave response in the atmosphere and showed that propagating waves originating in the thermosphere can excite a spectrum of AGWs in the lower atmosphere, though with much smaller amplitudes. Their transfer function model (TFM), which describes global propagation of acoustic gravity waves in a dissipative and static atmosphere with globally uniform temperature and density variations, was reviewed (Mayr et al., 1990; Mayr et al., 2013). Globally propagating AGWs from sources in the lower thermosphere at high latitudes can be ducted in the lower atmosphere over long distances and reach the troposphere at mid-to-low latitudes. However, the amplitude of AGWs is known to decrease exponentially with decreasing height. At the top of the troposphere, the amplitude in velocity perturbation is 3–4 orders of magnitude smaller than the amplitude of the wave launched in the E-region (Hines, 1965). In the lower thermosphere, large vertical wind velocities with magnitudes of 10–20 m/s are common at high latitudes (Larsen and Meriwether, 2012). Even larger vertical ion motions with amplitudes up to ± 50 m/s have been observed by incoherent scatter radars (Oyama et al., 2005) at altitudes of 95–111 km. Oyama et al. (2008) observed vertical winds exceeding 30 m/s at high-latitude altitudes of 110–120 km during moderately disturbed geomagnetic conditions. Hernandez (1982) observed periodic oscillations of vertical winds with amplitudes up to 50 m/s and a period of 40 min in the mid-latitude thermosphere, which were attributed to the passage of gravity waves from an auroral source. Rees et al. (1984) identified sources at high latitudes of strong vertical winds >100 m/s, resulting from local geomagnetic energy input and subsequent generation of thermospheric gravity waves. In situ measurements of large vertical motions of 100–250 m/s in the thermosphere were attributed to aurora-induced gravity waves (Spencer et al., 1976; Spencer et al., 1982), and vertical winds of 10–20 m/s are commonly observed in the lower thermosphere (Larsen and Meriwether, 2012). Such vertical motions scale down to a few cm/s at the tropospheric level, which is comparable to mean vertical motions in the troposphere (Fukao et al., 1991; Nastrom and Vanzandt, 1994) but less than typical instantaneous vertical motions of up to a few tens of cm/s associated with tropospheric gravity waves (Nastrom et al., 1990).
6.3 Initiation of tropospheric convection by aurorally excited AGWs
As already mentioned in Introduction, it has been suggested that aurorally excited AGWs can play a role in the CSI release, leading or contributing to explosive development of extratropical cyclones. When downgoing AGWs over-reflect in the warm frontal zone of extratropical cyclones, even a small lift that they would impart to a moist air parcel already rising over the cold air can initiate slantwise convection, forming a precipitation band. Extreme rainfall events often result from mesoscale convective systems producing convective rainfall regions that are sometimes nearly stationary. Bluestein and Jain (1985) (in Figure 1) introduced a concept of distinct kinds of mesoscale convective line (squall line) developments based on radar reflectivity and satellite observations of squall lines, with the two most commonly identified as “broken line” and “back building” formations. The squall lines form in a conditionally and convectively unstable atmosphere. The “broken line” forms typically along a cold front by probable development of “externally” forced multi-cells appearing at about the same time and transforming “into a solid line as the area of each existing cell expands and new cells develop” (Bluestein and Jain, 1985). The “back building” squall line “consists of the periodic appearance of a new cell upstream, relative to cell motion” and can form along different types of surface boundaries. The other types may include warm frontal bands and wide cold frontal bands (Bluestein and Jain, 1985). Similar to striated delta clouds (Prikryl et al., 2018; their Figure 9), the SPE analysis of solar wind data keyed to dates from the list of squall line cases (Bluestein and Jain, 1985; their Table 1) appears to show a tendency of such mesoscale convective line development to follow arrivals of HSSs/CIRs/ICMEs.
TFM simulations (Prikryl et al., 2018; their Figure 16) of propagation of the gravity wave launched by Joule heating with given vertical heating profiles in the lower thermosphere showed that they can produce vertical wind amplitudes of up to ∼1 cm/s at 10 km altitude. The gravity wave ray tracing examples (Prikryl et al., 2018; their Figure 15) show that AGWs can reach lower troposphere altitudes, where they may at least seed the slantwise convection in a symmetrically unstable environment by providing a small lift to a parcel of air and contribute to the release of instability (Prikryl et al., 2009b; pp. 34 and 42–43). Cases of TIDs and/or their sources in the ionosphere followed several hours later by series of rain bands, or convective cells, indicated an approximately one-to-one correspondence (Prikryl et al., 2009b; Prikryl et al., 2018) that was consistent with the estimated AGW propagation time from the lower thermosphere to the upper troposphere. While even a very small amplitude of these AGWs at tropospheric levels may be sufficient to release the CSI, there is possibility of amplification of AGWs at the reflection point if waves encounter a wind shear or an opposing wind (Jones, 1968; Cowling et al., 1971; McKenzie, 1972; Eltayeb and McKenzie, 1975).
6.4 Observations of AGWs in the upper atmosphere
SuperDARN radars (Nishitani et al., 2019) measure the line-of-sight velocity component of E × B drift velocities of ionospheric irregularities in the F-region (at altitudes of ∼350 km), with the electric field E mapping along equipotential magnetic field lines to the lower ionosphere. Velocity measurements are used to map ionospheric convection at mid-to-high latitudes. In addition to ionospheric scattering, the radars also observe the ground scatter power modulated by TIDs, including those that are driven by AGWs. To study the relevant geophysical context of the December 2010 storm event, we now examine in situ measurements of solar wind variables, ionospheric velocity and ground scatter power observed by the SuperDARN, and ground magnetometers sensing ionospheric currents.
On December 12, as in previously studied cases (Prikryl et al., 2009b; Prikryl et al., 2018), pulsed ionospheric flows (PIFs) observed over northern Greenland generated equatorward propagating AGWs/TIDs. Figure 11A shows ionospheric line-of-sight velocity Vlos as a function of the magnetic latitude observed by the Iceland Stokkseyri radar beam 15. The ionospheric currents in the E-region at altitudes of ∼110 km flow in the opposite direction to ionospheric convection (PIFs). It is the Joule heating caused by pulses of ionospheric currents that generated AGWs that were observed as TIDs by the Goose Bay radar in Labrador (Figure 11B). Similarly, on December 5, pulses of ionospheric convection/currents at high latitudes generated equatorward-propagating AGWs. Figure 11C shows TIDs in the ground scatter observed by the Pykkvibaer radar beam 7. Figures 11B, C show the ground scatter power focused/defocused by equatorward-propagating TIDs observed by radar beam 12. Rather than showing the ground scatter slant range, the ground scatter range is mapped to reflect the TID location in the ionosphere (Bristow et al., 1994). It is noted that PIFs and the consequent AGWs/TIDs were generated by solar wind Alfvén waves coupling with the dayside magnetosphere/ionosphere by the pulsed magnetic reconnection at the subsolar magnetopause ( Prikryl et al., 1998; Prikryl et al., 2002).
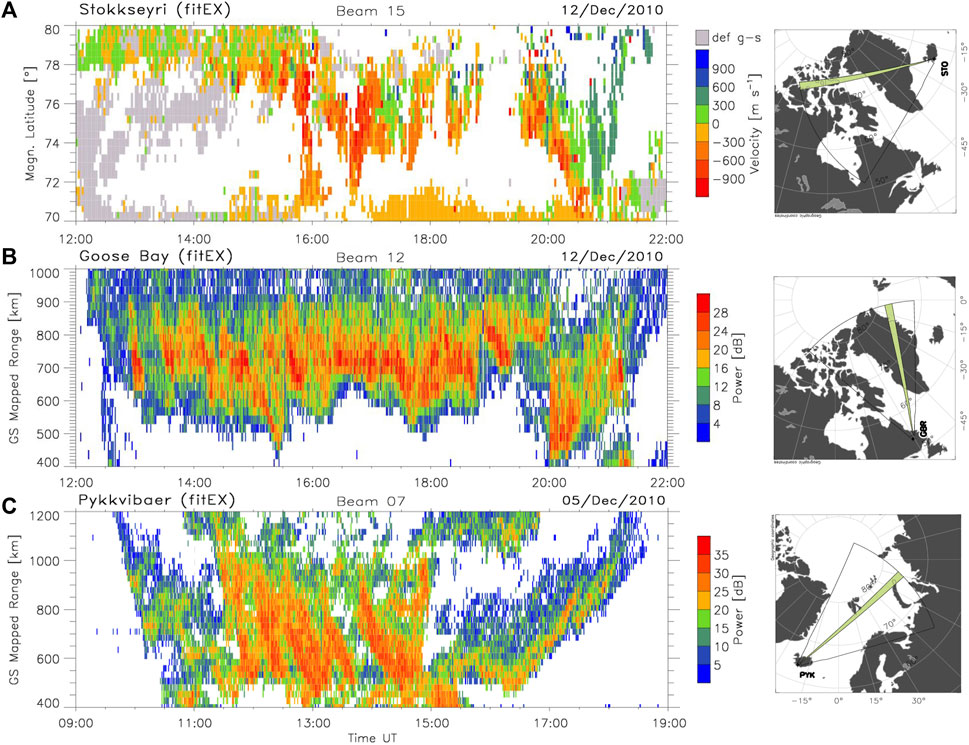
FIGURE 11. (A) Line-of-sight (LoS) velocity observed by the Stokkseyri radar beam 15. (B) Ground scatter power observed by the Goose Bay radar beam 12. (C) Ground scatter power observed by the Pykkvibaer radar beam 7.
The magnetic reconnection is primarily driven by the southward IMF BZ component, which is opposite to the Earth’s magnetic field at the subsolar magnetopause. Figure 12A shows the IMF BZ component in Geocentric Solar Ecliptic (GSE) coordinates (black line) measured by Wind spacecraft in the upstream solar wind. The dotted lines show detrended time series of IMF BZ (red) and proton velocity VZ (blue) components that are correlated. The correlation between the respective components of the solar wind magnetic field is the signature of anti-sunward propagating solar wind Alfvén waves (Belcher and Davis, 1971). The normalized fast Fourier transform (FFT) power spectra of the detrended time series of BZ and VZ show similar multiple peaks at frequencies of ∼0.25, 0.4, and 0.6 mHz.
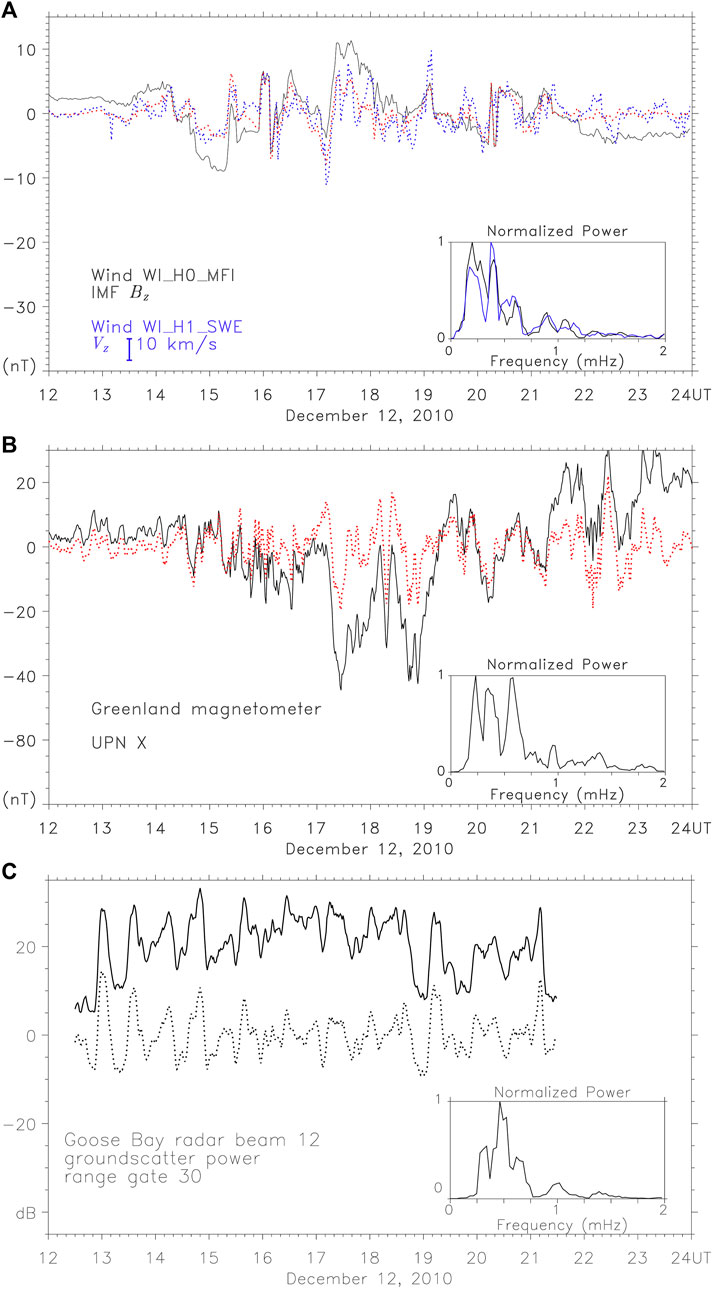
FIGURE 12. (A) Southward components of the magnetic field and proton velocity measured by the Wind spacecraft in the upstream solar wind. The normalized FFT power spectra of the detrended time series (dotted line) of IMF BZ (red) and proton velocity VZ (blue) components are shown. (B) The UPN X component of the ground magnetic field (black line) observed in Upernavik and the FFT spectrum of the detrended time series (dotted red line). (C) Ground scatter power observed by the Goose Bay radar beam 12 at range gate 30 and the FFT spectrum of the detrended time series (dotted line).
The north–south X component of the ground magnetic field (Figure 12B) was measured by a magnetometer on the west coast of Greenland in Upernavik (UPN), located in the field of view of the Stokkseyri radar beam 15. The perturbations of the ground magnetic field are caused by ionospheric currents at altitudes of ∼110 km, with the north–south X component sensing east–west currents. The FFT power spectrum of the detrended time series (red dotted line) is very similar to those of the IMF BZ and VZ observed by the Wind spacecraft.
Figure 12C shows the time series of the Goose Bay radar ground scatter power for the range gate 30 showing variations that are due to equatorward-propagating TIDs. The main peak in the FFT power spectrum of the detrended time series (dotted line) is close 0.5 mHz (∼30 min), representing the period of equatorward-propagating AGWs.
6.5 Ray tracing AGWs in a model atmosphere
Ray tracing of AGWs in a model atmosphere using the dispersion relation has been conducted (Prikryl et al., 2005) to show that downgoing AGWs launched by ionospheric currents at high latitudes can reach the troposphere. They can be ducted in the lower atmosphere to low latitudes, as shown by ray tracing and TFM methods (Prikryl et al., 2018).
Using the MSIS-90 model atmosphere, Figure 13 shows possible group paths from a source at 110 km altitudes of AGWs with a period of 30 min, including the ducted mode in the lower atmosphere. It is noted that group times for rays reaching the troposphere at distances past 3,000 km are greater than 4 h, which is approximately the time from the launch of AGWs to the appearance of “back building” convection cells (Figure 7A). Similar cases have been discussed previously (Prikryl et al., 2009a; Prikryl et al., 2018). Over-reflection of downgoing AGWs in unstable frontal zones could have contributed to the release of the instability, leading to a string of convection cells forming the “back building” squall line shown in Figure 7A.
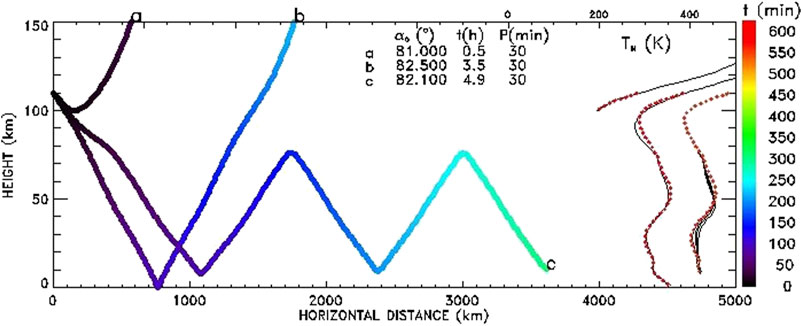
FIGURE 13. Ray tracing in the MSIS-90 model atmosphere of gravity waves with a 30-min period launched over Upernavik, Greenland. The rays are color-coded by group time, t. The neutral temperature TN(z) profiles for each ray are superposed. TN for the first down-leg path is shown by the red dotted line. Multiple offsets of 100 K are applied to successive profiles for rays b and c. The initial values α0 of wave vector k directions from the horizontal direction, wave period P and group time, are printed.
Theoretical analysis of AGW propagation in the lower atmosphere using an expansion of three-dimensional normal mode functions was performed by Hagiwara and Tanaka (2020). These authors showed that the waves can propagate downward to the troposphere as attenuating gravity waves and “the wave propagations and reflections at the surface create an anti-node of geopotential at the bottom of the atmosphere corresponding to the vertical width of the initial state of the impact.” On the other hand, “standing waves in temperature create a node at the ground surface.” They suggested that standing waves generated in the lower troposphere could affect atmospheric stability through the passage of gravity waves, in turn affecting the development of cyclones.
These theoretical results propose the following question: could the strings of convective cells forming “back building” squall lines, as observed in Figure 7A, be caused by standing waves, as they are generated in the lower troposphere by downgoing AGWs? If so, the nodes (anti-nodes) of a standing wave would be separated by half a wavelength λ/2. While upgoing medium-scale AGWs/TIDs have typically horizontal wavelengths λ ≥400 km, downgoing AGW packets would have shorter horizontal wavelengths λ <300 km (Prikryl et al., 2005; their Figure 2B). Standing waves generated by such AGWs in the lower troposphere, as suggested previously, would have node spacing comparable with the spacing between the convective cells (∼150 km or less). Furthermore, the two “back building” squall lines seem to have formed simultaneously (Figure 7A). This would be consistent with the notion that they were formed by equatorward-propagating AGWs at this time, although the one associated with the main cold front transformed more quickly into a solid squall line, while the convective cells forming the adjacent squall line persisted longer as they expanded.
7 Summary and conclusions
It is observed that heavy rainfall-induced floods in Canada tend to follow arrivals of solar wind high-speed streams from coronal holes. Cool season precipitation events, including extreme freezing rain events, that were caused by intensifying low-pressure systems and that resulted in power outages in the province of New Brunswick, also show this tendency. The superposed epoch analysis of solar wind variables keyed to the maximum deepening rate of the central sea-level pressure indicates that many of these extratropical cyclones intensified, some explosively, following arrivals of high-speed streams. Further evidence is provided by using a satellite-based gridded precipitation dataset. The superposed epoch analysis of high-rate precipitation over Canada shows a statistically significant increase in the high-rate precipitation occurrence following arrivals of major high-speed streams. These results support previously published results for other mid-latitude geographic regions. The link between solar wind high-speed streams and heavy precipitation occurrence points to solar wind–magnetosphere–ionosphere–atmosphere coupling mediated by aurorally excited globally propagating atmospheric gravity waves potentially contributing to convection by releasing the conditional symmetric instability in the troposphere. The latent heat release is often associated with intensification of storms. This is supported by the ERA5 reanalysis dataset used to diagnose SCAPE and the vertically integrated extent of realizable symmetric instability to assess the likelihood of slantwise convection. The assessment of conditional symmetric instability using the global ERA5 dataset will provide opportunities to study events when the proposed mechanism may be in action. The role of globally propagating aurorally excited gravity waves will be considered in future studies examining severe weather conditions, such as heavy rainfall-induced flash floods and large tornado outbreaks.
Data availability statement
The original contributions presented in the study are included in the article/Supplementary Material; further inquiries can be directed to the corresponding author.
Author contributions
PP and VR contributed to conception and design of the study. PP and VR contributed to the specific data analysis and organized the database. PP performed the statistical analysis and wrote the first draft of the manuscript. All authors contributed to the article and approved the submitted version.
Funding
This research was supported by the University of New Brunswick and by the VEGA project 2/0048/20 (Slovak Academy of Sciences).
Acknowledgments
The authors would like to thank T-C Chen at the Institute of Meteorology and Climate Research, Karlsruhe Institute of Technology, for providing the results of the analysis of moist symmetric instability and for many valuable comments and suggestions during the preparation of the manuscript. The contributions by ACE, Geotail, IMP-8, SOHO, and Wind spacecraft teams; the NSSDC OMNIWeb; and the SuperDARN project are acknowledged. The SuperDARN is a collection of radars funded by national scientific funding agencies of Australia, Canada, China, France, Italy, Japan, Norway, South Africa, the United Kingdom, and the United States. Meteorological data were accessed online at web pages provided by various institutions, including Environment Canada, the University of Wisconsin–Madison Space Science and Engineering Center, and the University of Washington, Department of Atmospheric Sciences. Satellite images and derived products were provided by the Cooperative Institute for Meteorological Satellite Studies, University of Wisconsin—Madison. The IMERG dataset is provided by the Goddard Earth Sciences Data and Information Services Center. The JRA-55 reanalysis is a product of the Japan Meteorological Agency (JMA). The reanalysis dataset ERA5 is a product of the European Centre for Medium-Range Weather Forecasts (ECMWF).
Conflict of interest
The authors declare that the research was conducted in the absence of any commercial or financial relationships that could be construed as a potential conflict of interest.
Publisher’s note
All claims expressed in this article are solely those of the authors and do not necessarily represent those of their affiliated organizations, or those of the publisher, the editors, and the reviewers. Any product that may be evaluated in this article, or claim that may be made by its manufacturer, is not guaranteed or endorsed by the publisher.
Supplementary material
The Supplementary Material for this article can be found online at: https://www.frontiersin.org/articles/10.3389/fspas.2023.1196231/full#supplementary-material
References
Ambrož, P. (1979). Statistical method of superposition of epochs. I. Methodical analysis and some criteria of application. B. Astron. Inst. Czechosl. 30,114–121.
Arora, B. R., and Padgaonkar, A. D. (1981). Time-Variation of solar influence on tropospheric circulation. J. Atmos. Terr. Phys. 43, 91–95. doi:10.1016/0021-9169(81)90066-0
Balthazor, R. L., and Moffett, R. J. (1997). A study of atmospheric gravity waves and travelling iono-spheric disturbances at equatorial latitudes. Ann. Geophys. 15, 1048–1056. doi:10.1007/s00585-997-1048-4
Belcher, J. W., and Davis, L. (1971). Large- amplitude alfven waves in the interplanetary medium, 2. J. Geophys. Res. 76 (16), 3534–3563. doi:10.1029/ja076i016p03534
Bennetts, D. A., and Hoskins, B. J. (1979). Conditional symmetric instability – a possible explanation for frontal rainbands. Quart. J. Roy. Meteor. Soc. 105, 945–962. doi:10.1002/qj.49710544615
Bluestein, H. B., and Jain, M. H. (1985). Formation of mesoscale lines of pirecipitation: Severe squall lines in Oklahoma during the spring. J. Atmos. Sci. 42 (16), 1711–1732. doi:10.1175/1520-0469(1985)042<1711:FOMLOP>2.0.CO;2
Bluestein, H. B. (1993). Synoptic-dynamic Meteorology in midlatitudes. Volume II: Observations and theory of weather systems. Oxford University Press. doi:10.1016/0021-9169(94)90121-x
Brekke, A., and Kamide, Y. (1996). On the relationship between Joule and frictional heating in the polar ionosphere. J. Atmos. Terr. Phys. 58 (1–4), 139–143. doi:10.1016/0021-9169(95)00025-9
Bristow, W. A., Greenwald, R. A., and Samson, J. C. (1994). Identification of high-latitude acoustic gravity wave sources using the Goose Bay HF radar. J. Geophys. Res. 99 (A1), 319–331. doi:10.1029/93JA01470
Bristow, W. A., Greenwald, R. A., and Villain, J. P. (1996). On the seasonal dependence of medium-scale atmospheric gravity waves in the upper atmosphere at high latitudes. J. Geophys. Res. 101 (15), 15685–15699. doi:10.1029/96ja01010
Brooks, G. F., Evans, S. G., and Clague, J. J. (2001). Flooding. A synthesis of natural geological hazards in Canada. Geol. Surv. Can. Bull. 548, 101–143. doi:10.4095/212210
Burn, D. H., Caissie, D., Peters, D. L., Renzetti, S., St-Hilaire, A., and Whitfield, P. H. (2016). Preface to the special issue on floods in Canada. Can. Water Resour. J./Revue Can. Des Ressources Hydriques 41 (1–2), 2–6. doi:10.1080/07011784.2016.1142908
Burn, D. H., and Whitfield, P. H. (2016). Changes in floods and flood regimes in Canada. Can. Water Resour. J./Revue Can. Des Ressources Hydriques 41 (1–2), 139–150. doi:10.1080/07011784.2015.1026844
Burns, G. B., Bond, F. R., and Cole, K. D. (1980). An investigation of the southern hemisphere vorticity response to solar sector boundary crossings. J. Atmos. Terr. Phys. 42 (8), 765–769. doi:10.1016/0021-9169(80)90059-8
Burns, G. B., Tinsley, B. A., Frank-Kamenetsky, A. V., and Bering, E. A. (2007). Interplanetary magnetic field and atmospheric electric circuit influences on ground-level pressure at vostok. J. Geophys. Res. Atmos. 112 (4), D04103. doi:10.1029/2006JD007246
Burns, G. B., Tinsley, B. A., French, W. J. R., Troshichev, O. A., and Frank-Kamenetsky, A. V. (2008). Atmospheric circuit influences on ground-level pressure in the antarctic and arctic. J. Geophys. Res. Atmos. 113 (15), D15112. doi:10.1029/2007JD009618
Buttle, J. M., Allen, D. M., Caissie, D., Davison, B., Hayashi, M., Peters, D. L., et al. (2016). Flood processes in Canada: Regional and special aspects. Can. Water Resour. J./Revue Can. Des Ressources Hydriques 41 (1–2), 7–30. doi:10.1080/07011784.2015.1131629
Chandra, S., and McPeters, R. D. (1994). The solar cycle variation of ozone in the stratosphere inferred from Nimbus 7 and NOAA 11 satellites. J. Geophys. Res. 99 (D10), 20665–20671. doi:10.1029/94jd02010
Chartrand, J., Thériault, J. M., and Marinier, S. (2022). Freezing rain events that impacted the province of new Brunswick, Canada, and their evolution in a warmer climate. Atmosphere-Ocean 61 (1), 40–56. doi:10.1080/07055900.2022.2092444
Chartrand, J., and Thériault, J.∼M. (2020). “Extreme freezing rain events in the province of new Brunswick, Canada, and their evolution in the future using convection-permitting simulations,” in AGU fall meeting abstracts, A009–A0008.
Chen, T.-C., Yau, M. K., and Kirshbaum, D. J. (2018). Assessment of conditional symmetric instability from global reanalysis data. J. Atmos. Sci. 75 (7), 2425–2443. doi:10.1175/JAS-D-17-0221.1
Chimonas, G., and Hines, C. O. (1970). Atmospheric gravity waves launched by auroral currents. Planet. Space Sci. 18 (4), 565–582. doi:10.1016/0032-0633(70)90132-7
Chisham, G., Lester, M., Milan, S. E., Freeman, M. P., Bristow, W. A., Grocott, A., et al. (2007). A decade of the super dual auroral radar Network (SuperDARN): Scientific achievements, new techniques and future directions. Surv. Geophys. 28 (1), 33–109. doi:10.1007/s10712-007-9017-8
Cowling, D. H., Webb, H. D., and Yeh, K. C. (1971). Group rays of internal gravity waves in a wind-stratified atmosphere. J. Geophys. Res. 76 (1), 213–220. doi:10.1029/ja076i001p00213
Crowley, T. J. (2000). Causes of climate change over the past 1000 years. Science 289 (5477), 270–277. doi:10.1126/science.289.5477.270
de Toma, G. (2011). Evolution of coronal holes and implications for high-speed solar wind during the minimum between cycles 23 and 24. Sol. Phys. 274 (1–2), 195–217. doi:10.1007/s11207-010-9677-2
Dorotovič, I., Minarovjech, M., Lorenc, M., and Rybanský, M. (2014). Modified homogeneous data set of coronal intensities. Sol. Phys. 289 (7), 2697–2703. doi:10.1007/s11207-014-0501-2
Doswell, C. A., and Bosart, L. F. (2001). Extratropical synoptic-scale processes and severe convection. Meteorol. Monogr. 50 (50), 27–70. doi:10.1175/0065-9401-28.50.27
Dungey, J. W. (1961). Interplanetary magnetic field and the auroral zones. Phys. Rev. Lett. 6 (2), 47–48. doi:10.1103/PhysRevLett.6.47
Dungey, J. W. (1995). “Origins of the concept of reconnection and its application to the magnetopause: A historical view. Physics of the magnetopause,” in Geophysical monograph series. Editor P. B. Song, U. O. Sonnerup, and M. F. Thomsen (Washington, D.C.: AGU), 17–19. doi:10.1029/GM090p0017
Eltayeb, I. A., and McKenzie, J. F. (1975). Critical-level behaviour and wave amplification of a gravity wave incident upon a shear layer. J. Fluid Mech. 72 (4), 661–671. doi:10.1017/S0022112075003217
Feren, G. (1995). The “striated delta” cloud system - a satellite imagery precursor to major cyclogenesis in the eastern Australian - weWesternasman Sea region. Weather Forecast. 10 (2), 286–309. doi:10.1175/1520-0434(1995)010<0286:TDCSSI>2.0.CO;2
Francis, S. H. (1974). A theory of medium-scale traveling ionospheric disturbances. J. Geophys. Res. 79 (34), 5245–5260. doi:10.1029/ja079i034p05245
Fukao, S., Larsen, M. F., Yamanaka, M. D., Furukawa, H., Tsuda, T., and Kato, S. (1991). Observations of a reversal in long-term average vertical velocities near the jet stream wind maximum. Mon. Weather Rev. 119 (6), 1479–1489. doi:10.1175/1520-0493(1991)119<1479:ooaril>2.0.co;2(1991)119<1479:OOARIL>2.0.CO;2
Glinton, M., Gray, S. L., Chagnon, J. M., and Morcrette, C. J. (2017). Modulation of precipitation by conditional symmetric instability release. Atmos. Res. 185, 186–201. doi:10.1016/j.atmosres.2016.10.013
Gonzalez, W. D., Joselyn, J. A., Kamide, Y., Kroehl, H. W., Rostoker, G., Tsurutani, B. T., et al. (1994). What is a geomagnetic storm?J. Geophys. Res. Space Phys. 99 (A4), 5771–5792. doi:10.1029/93ja02867
Gopalswamy, N. (2016). History and development of coronal mass ejections as a key player in solar terrestrial relationship. Geosci. Lett. 3 (1), 8. doi:10.1186/s40562-016-0039-2
Gosling, J. T., and Pizzo, V. J. (1999). Formation and evolution of corotating interaction regions and their three dimensional structure. Space Sci. Rev. 89, 21–52. doi:10.1023/A:1005291711900
Gourley, J. J., Erlingis, J. M., Hong, Y., and Wells, E. B. (2012). Evaluation of tools used for monitoring and forecasting flash floods in the United States. Weather Forecast. 27 (1), 158–173. doi:10.1175/WAF-D-10-05043.1
Gray, L. J., Beer, J., Geller, M., Haigh, J. D., Lockwood, M., Matthes, K., et al. (2010). Solar influences on climate. Rev. Geophys. 48 (4). doi:10.1029/2009RG-000282
Hagiwara, M., and Tanaka, H. L. (2020). A theoretical analysis of the atmospheric gravity wave that connects the thermosphere and the troposphere. Tsukuba Geoenvironmental Sci. 16, 1–14. doi:10.15068/00162379
Harrison, R. G., and Carslaw, K. S. (2003). Ion-aerosol-cloud processes in the lower atmosphere. Rev. Geophys. 41 (3), 1012. doi:10.1029/2002RG-000114
Hernandez, G. (1982). Vertical motions of the neutral thermosphere at midlatitude. Geophys. Res. Lett. 9 (5), 555–557. doi:10.1029/GL009i005p-00555
Hersbach, H., Bell, B., Berrisford, P., Hirahara, S., Horányi, A., Muñoz-Sabater, J., et al. (2020). The ERA5 global reanalysis. Q. J. R. Meteorol. Soc. 146, 1999–2049. doi:10.1002/qj.3803
Hines, C. O., and Halevy, I. (1977). On the reality and nature of a certain sun-weather correlation. J. Atmos. Sci. 34, 382–404. doi:10.1175/1520-0469(1977)034<0382:otrano>2.0.co;2
Hines, C. O. (1960). Internal atmospheric gravity waves at ionospheric heights. Can. J. Phys. 38 (11), 1441–1481. doi:10.1139/p60-150
Hines, C. O. (1965). “Motions of the neutral atmosphere,” in Canadian journal of Physics. Editors J. A. F. C. O. Hines, I. Paghis, and T. R. Hartz (London: Prentice-Hall, Inc.).
Hocke, K., and Schlegel, K. (1996). A review of atmospheric gravity waves and travelling ionospheric disturbances: 1982-1995. Ann. Geophys. 14 (9), 917–940. doi:10.1007/s00585-996-0917-6
Huffman, G. J., Stocker, E. F., Bolvin, D. T., Nelkin, E. J., and Tan, J. (2019). GPM IMERG final precipitation L3 1 day 0.1 degree x 0.1 degree V06. Goddard Earth Sciences Data and Information Services Center (GES DISC. doi:10.5067./GPM/IMERGDL/DAY/06
Jones, W. L. (1968). Reflexion and stability of waves in stably stratified fluids with shear flow: A numerical study. J. Fluid Mech. 34 (3), 609–624. doi:10.1017/S0022112068002119
King, J. H., and Papitashvili, N. (2005). Solar wind spatial scales in and comparisons of hourly Wind and ACE plasma and magnetic field data. J. Geophys. Res. 110 (A2), A02104. doi:10.1029/2004JA010649
Knipp, D. J., Tobiska, W. K., and Emery, B. A. (2004). Direct and indirect thermospheric heating sources for solar cycles 21–23. Sol. Phys. 224 (1–2), 495–505. doi:10.1007/s11207-005-6393-4
Krieger, A. S., Timothy, A. F., and Roelof, E. C. (1973). A coronal hole and its identification as the source of a high velocity solar wind stream. Sol. Phys. 29 (2), 505–525. doi:10.1007/BF00150828
Lam, M. M., Chisham, G., and Freeman, M. P. (2014). Solar wind-driven geopotential height anomalies originate in the Antarctic lower troposphere. Geophys. Res. Lett. 41 (18), 6509–6514. doi:10.1002/2014GL061421
Lam, M. M., Chisham, G., and Freeman, M. P. (2013). The interplanetary magnetic field influences mid-latitude surface atmospheric pressure. Environ. Res. Lett. 8 (4), 045001. doi:10.1088/1748-9326/8/4/045001
Lam, M. M., and Tinsley, B. A. (2016). Solar wind-atmospheric electricity-cloud microphysics connections to weather and climate. J. Atmos. Solar-Terrestrial Phys. 149, 277–290. doi:10.1016/j.jastp.2015.10.019
Larsen, M. F., and Meriwether, J. W. (2012). Vertical winds in the thermosphere. J. Geophys. Res. Space Phys. 117 (A9), A09319. doi:10.1029/2012JA-017843
Lim, E.-P., and Simmonds, I. (2002). Explosive cyclone development in the southern hemisphere and a comparison with northern hemisphere events. Mon. Weather Rev. 130 (9), 2188–2209. doi:10.1175/1520-0493(2002)130<2188:ECDITS>2.0.CO;2
Lundstedt, H. (1984). Influence of interplanetary interaction regions on geomagnetic disturbances and tropospheric circulation. Planet. Space Sci. 32 (12), 1541–1545. doi:10.1016/0032-0633(84)90022-9
Macdonald, N. J., and Roberts, W. O. (1960). Further evidence of a solar corpuscular influence on large-scale circulation at 300 mb. J. Geophys. Res. 65 (2), 529–534. doi:10.1029/jz065i002p00529
Mayr, H. G., Harris, I., Herrero, F. A., Spencer, N. W., Varosi, F., and Pesnell, W. D. (1990). Thermospheric gravity waves: Observations and interpretation using the transfer function model (TFM). Space Sci. Rev. 54 (3–4), 297–375. doi:10.1007/BF00177800
Mayr, H. G., Harris, I., Varosi, F., and Herrero, F. A. (1984b). Global excitation of wave phenomena in a dissipative multiconstituent medium - 2. Impulsive perturbations in the earth’S thermosphere. J. Geophys. Res. 89 (A12), 10961–10986. doi:10.1029/JA089iA12p10961
Mayr, H. G., Harris, I., Varosi, F., and Herrero, F. A. (1984a). Global excitation of wave phenomena in a dissipative multiconstituent medium. 1. Transfer function of the earth’S thermosphere. J. Geophys. Res. 89 (A12), 10929–10959. doi:10.1029/JA089iA12p10929
Mayr, H. G., Talaat, E. R., and Wolven, B. C. (2013). Global propagation of gravity waves generated with the whole atmosphere transfer function model. J. Atmos. Solar-Terrestrial Phys. 104, 7–17. doi:10.1016/j.jastp.2013.08.001
McKenzie, J. F. (1972). Reflection and amplification of acoustic-gravity waves at a density and velocity discontinuity. J. Geophys. Res. 77 (16), 2915–2926. doi:10.1029/ja077i016p02915
Millward, G. (1994). A resonance effect in AGWs created by periodic recurrent bursts in the auroral electric field. Ann. Geophysicae- Eur. Geophys. Soc. 12 (1), 94.
Millward, G. H., Moffett, R. J., Quegan, S., and Fuller-Rowell, T. J. (1993a). Effects of an atmospheric gravity wave on the midlatitude ionospheric F layer. J. Geophys. Res. Space Phys. 98 (A11), 19173–19179. doi:10.1029/93ja02093
Millward, G. H., Quegan, S., Moffett, R. J., Fuller-Rowell, T. J., and Rees, D. (1993b). A modelling study of the coupled ionospheric and thermospheric response to an enhanced high-latitude electric field event. Planet. Space Sci. 41 (1), 45–56. doi:10.1016/0032-0633(93)90016-U
Nastrom, G. D., Peterson, M. R., Green, J. L., Gage, K. S., and Vanzandt, T. E. (1990). Sources of gravity wave activity seen in the vertical velocities observed by the Flatland VHF radar. J. Appl. Meteorology 29 (8), 783–792. doi:10.1175/1520-0450(1990)029<0783:SOGWAS>2.0.CO;2
Nastrom, G. D., and Vanzandt, T. E. (1994). Mean vertical motions seen by radar wind profilers. J. Appl. Meteorology 33 (8), 984–995. doi:10.1175/1520-0450(1994)033<0984:MVMSBR>2.0.CO;2
Nishitani, N., Ruohoniemi, J. M., Lester, M., Baker, J. B. H., Koustov, A. V., Shepherd, S. G., et al. (2019). Review of the accomplishments of mid-latitude super dual auroral radar Network (SuperDARN) HF radars. Prog. Earth Planet. Sc. 6, 27–52. doi:10.1186/s40645-019-0270-5
Owens, M. J., Scott, C. J., Lockwood, M., Barnard, L., Harrison, R. G., Nicoll, K., et al. (2014). Modulation of UK lightning by heliospheric magnetic field polarity. Environ. Res. Lett. 9 (11), 115009. doi:10.1088/1748-9326/9/11/115009
Oyama, S., Ishii, M., Murayama, Y., Shinagawa, H., Buchert, S. C., Fujii, R., et al. (2001). Generation of atmospheric gravity waves associated with auroral activity in the polar F region. J. Geophys. Res. Space Phys. 106 (A9), 18543–18554. doi:10.1029/2001ja900032
Oyama, S., and Watkins, B. J. (2012). Generation of atmospheric gravity waves in the polar thermosphere in response to auroral activity. Space Sci. Rev. 168 (1–4), 463–473. doi:10.1007/s11214-011-9847-z
Oyama, S., Watkins, B. J., Maeda, S., Shinagawa, H., Nozawa, S., Ogawa, Y., et al. (2008). Generation of the lower-thermospheric vertical wind estimated with the EISCAT KST radar at high latitudes during periods of moderate geomagnetic disturbance. Ann. Geophys. 26 (6), 1491–1505. doi:10.5194/angeo-26-1491-2008
Oyama, S., Watkins, B. J., Nozawa, S., Maeda, S., and Conde, M. (2005). Vertical ion motion observed with incoherent scatter radars in the polar lower ionosphere. J. Geophys. Res. Space Phys. 110 (A4). doi:10.1029/2004JA010705
Park, C. G. (1976). Solar magnetic sector effects on the vertical atmospheric electric field at Vostok, Antarctica. Geophys. Res. Lett. 3 (8), 475–478. doi:10.1029/GL003i008p00475
Phillips, J. L., Balogh, A., Bame, S. J., Goldstein, B. E., Gosling, J. T., Hoeksema, J. T., et al. (1994). Ulysses at 50° south: Constant immersion in the high-speed solar wind. Geophys. Res. Lett. 21 (12), 1105–1108. doi:10.1029/94GL01065
Phillips, J. L., Bame, S. J., Feldman, W. C., Goldstein, B. E., Gosling, J. T., Hammond, C. M., et al. (1995). Ulysses solar wind plasma observations at high southerly latitudes. Science 268 (5213), 1030–1033. doi:10.1126/science.268.5213.1030
Prikryl, P., Bruntz, R., Tsukijihara, T., Iwao, K., Muldrew, D. B., Rušin, V., et al. (2018). Tropospheric weather influenced by solar wind through atmospheric vertical coupling downward control. J. Atmos. Solar-Terrestrial Phys. 171, 94–110. doi:10.1016/j.jastp.2017.07.023
Prikryl, P., Greenwald, R. A., Sofko, G. J., Villain, J. P., Ziesolleck, C. W. S., and Friis-Christensen, E. (1998). Solar-wind-driven pulsed magnetic reconnection at the dayside magnetopause, Pc5 compressional oscillations, and field line resonances. J. Geophys. Res. Space Phys. 103 (A8), 17307–17322. doi:10.1029/97ja03595
Prikryl, P., Iwao, K., Muldrew, D. B., Rušin, V., Rybanský, M., and Bruntz, R. (2016). A link between high-speed solar wind streams and explosive extratropical cyclones. J. Atmos. Solar-Terrestrial Phys. 149, 219–231. doi:10.1016/j.jastp.2016.04.002
Prikryl, P., Muldrew, D. B., and Sofko, G. J. (2007). “Do auroral atmospheric gravity waves influence mesoscale processes, extratropical and tropical cyclones?,” in 12th conference on mesoscale processes, 11–15.
Prikryl, P., Muldrew, D. B., and Sofko, G. J. (2003). High-speed solar wind, auroral electrojets and atmospheric gravity waves: A link to the earth’s atmosphere. European Space Agency, (Special Publication) ESA SP, 371–376.
Prikryl, P., Muldrew, D. B., Sofko, G. J., and Ruohoniemi, J. M. (2005). Solar wind Alfvén waves: A source of pulsed ionospheric convection and atmospheric gravity waves. Ann. Geophys. 23 (2), 401–417. doi:10.5194/angeo-23-401-2005
Prikryl, P., Muldrew, D. B., and Sofko, G. J. (2009b). The influence of solar wind on extratropical cyclones - Part 2: A link mediated by auroral atmospheric gravity waves?Ann. Geophys. 27 (1), 31–57. doi:10.5194/angeo-27-31-2009
Prikryl, P., Nikitina, L., and Rušin, V. (2019). Rapid intensification of tropical cyclones in the context of the solar wind-magnetosphere-ionosphere-atmosphere coupling. J. Atmos. Solar-Terrestrial Phys. 183, 36–60. doi:10.1016/j.jastp.2018.12.009
Prikryl, P., Provan, G., McWilliams, K. A., and Yeoman, T. K. (2002). Ionospheric cusp flows pulsed by solar wind Alfvén waves. Ann. Geophys. 20 (2), 161–174. doi:10.5194/angeo-20-161-2002
Prikryl, P., Rušin, V., and Prikryl, E. A. (2021a). High-rate precipitation occurrence modulated by solar wind high-speed streams. Atmosphere 12 (9), 1186. doi:10.3390/atmos12091186
Prikryl, P., Rušin, V., Prikryl, E. A., Šťastný, P., Turňa, M., and Zeleňáková, M. (2021b). Heavy rainfall, floods, and flash floods influenced by high-speed solar wind coupling to the magnetosphere–ionosphere–atmosphere system. Ann. Geophys. 39 (4), 769–793. doi:10.5194/angeo-39-769-2021
Prikryl, P., Rušin, V., and Rybanský, M. (2009a). The influence of solar wind on extratropical cyclones – Part 1: Wilcox effect revisited. Ann. Geophys. 27 (1), 1–30. doi:10.5194/angeo-27-1-2009
Rees, D., Smith, R. W., Charleton, P. J., McCormac, F. G., Lloyd, N., and Steen, Å. Å. (1984). The generation of vertical thermospheric winds and gravity waves at auroral latitudes I. Observations of vertical winds. Planet. Space Sci. 32 (6), 667–684. doi:10.1016/0032-0633(84)90092-8
Reid, G. C. (1997). Solar forcing of global climate change since the mid-17th century. Clim. Change 37 (2), 391–405. doi:10.1023/A:1005307009726
Richardson, I. G., and Cane, H. V. (2010). Near-earth interplanetary coronal mass ejections during solar cycle 23 (1996 – 2009): catalog and summary of properties. Sol. Phys. 264, 189–237. doi:10.1007/s11207-010-9568-6
Richmond, A. D. (1978). Gravity wave generation, propagation, and dissipation in the thermosphere. J. Geophys. Res. 83 (A9), 4131. doi:10.1029/ja083ia09p04131
Richmond, A. D. (2021). “Joule heating in the thermosphere. Space Physics and aeronomy collection volume 4: Upper atmosphere dynamics and energetics,” in Geophysical monograph. American geophysical union. Editors W. Wang, and Y. Zhang (John Wiley and Sons, Inc.), 1–18. doi:10.1002/9781119815631.ch1
Roberts, W. O., and Olson, R. H. (1973). Geomagnetic storms and wintertime 300-mb trough development in the north pacific-north America area. J. Atmos. Sci. 30 (1), 135–140. doi:10.1175/1520-0469(1973)030<0135:GSAWMT>2.0.CO;2
Rostoker, G., and Sharma, R. P. (1980). Correlation of high latitude tropospheric pressure with the structure of the interplanetary magnetic field. Can. J. Phys. 58 (2), 255–269. doi:10.1139/p80-039
Rybanský, M., Rušin, V., Minarovjech, M., Klocok, L., and Cliver, E. W. (2005). Reexamination of the coronal index of solar activity. J. Geophys. Res. Space Phys. 110 (A8), A08106. doi:10.1029/2005JA011146
Sanders, F., and Gyakum, J. R. (1980). Synoptic-dynamic Climatology of the “bomb”. Mon. Weather Rev. 108 (10), 1589–1606. doi:10.1175/1520-0493(1980)108<1589:SDCOT>2.0.CO;2
Schultz, D. M., and Schumacher, P. N. (1999). The use and misuse of conditional symmetric instability. Mon. Weather Rev. 127 (12), 2709–2732. doi:10.1175/1520-0493(1999)127<2709:TUAMOC>2.0.CO;2
Scott, C. J., Harrison, R. G., Owens, M. J., Lockwood, M., and Barnard, L. (2014). Evidence for solar wind modulation of lightning. Environ. Res. Lett. 9 (5), 055004. doi:10.1088/1748-9326/9/5/055004
Smith, E. J., Tsurutani, B. T., and Rosenberg, R. L. (1978). Observations of the interplanetary sector structure up to heliographic latitudes of 16°: Pioneer 11. J. Geophys. Res. 83, 717–724.
Spencer, N. W., Theis, R. F., Wharton, L. E., and Carignan, G. R. (1976). Local vertical motions and kinetic temperature from AE-C as evidence for aurora-induced gravity waves. Geophys. Res. Lett. 3 (6), 313–316. doi:10.1029/GL003i006p00313
Spencer, N. W., Wharton, L. E., Carignan, G. R., and Maurer, J. C. (1982). Thermosphere zonal winds, vertical motions and temperature as measured from Dynamics Explorer. Geophys. Res. Lett. 9 (9), 953–956. doi:10.1029/GL009i009p00953
Svalgaard, L. (1975). On the use of Godhavn H component as an indicator of the interplanetary sector polarity. J. Geophys. Res. 80, 2717–2722. doi:10.1029/JA080i019p02717
Tanaka, T. (1979). Global structure and dynamics of the thermo-ionospheres. Rev. Radio Res. Labs. 25 (134), 265–309. (in Japanese).
Testud, J. (1970). Gravity waves generated during magnetic substorms. J. Atmos. Terr. Phys. 32 (11), 1793–1805. doi:10.1016/0021-9169(70)90137-6
Thayer, J. P., and Semeter, J. (2004). The convergence of magnetospheric energy flux in the polar atmosphere. J. Atmos. Solar-Terrestrial Phys. 66 (10), 807–824. doi:10.1016/j.jastp.2004.01.035
Tinsley, B. A. (2008). The global atmospheric electric circuit and its effects on cloud microphysics. Rep. Prog. Phys. 71 (6), 066801. doi:10.1088/0034-4885/71/6/066801
Tsurutani, B. T., McPherron, R. L., Gonzalez, W. D., Lu, G., Gopalswamy, N., and Guarnieri, F. (2006a). “Magnetic storms caused by corotating solar wind streams,” in Recurrent magnetic storms: Corotating solar wind streams. Editors N. Tsurutani, R. McPherron, W. Gonzalez, G. Lu, and J. H. A. Sobral, (AGU monograph). doi:10.1029/GM167
Tsurutani, B. T., Gonzalez, W. D., Gonzalez, A. L. C., Guarnieri, F. L., Gopalswamy, N., Grande, M., et al. (2006b). Corotating solar wind streams and recurrent geomagnetic activity: A review. J. Geophys. Res. Space Phys. 111 (7), A07S01. doi:10.1029/2005JA011273
Tsurutani, B. T., Gonzalez, W. D., Gonzalez, A. L. C., Tang, F., Arballo, J. K., and Okada, M. (1995). Interplanetary origin of geomagnetic activity in the declining phase of the solar cycle. J. Geophys. Res. Space Phys. 100 (A11), 21717–21733. doi:10.1029/95ja01476
Tsurutani, B. T., and Gonzalez, W. D. (1987). The cause of high-intensity long-duration continuous AE activity (HILDCAAs): Interplanetary Alfvén wave trains. Planet. Space Sci. 35 (4), 405–412. doi:10.1016/0032-0633(87)90097-3
Tsurutani, B. T., Gould, T., Goldstein, B. E., Gonzalez, W. D., and Sugiura, M. (1990). Interplanetary Alfvén waves and auroral (substorm) activity: Imp 8. J. Geophys. Res. 95 (A3), 2241–2252. doi:10.1029/ja095ia03p02241
Tsurutani, B. T., Hajra, R., Tanimori, T., Takada, A., Remya, B., Mannucci, A. J., et al. (2016). Heliospheric plasma sheet (HPS) impingement onto the magnetosphere as a cause of relativistic electron dropouts (REDs) via coherent EMIC wave scattering with possible consequences for climate change mechanisms. J. Geophys. Res. Space Phys. , 121 (10), 10,130–10,156. doi:10.1002/2016JA-022499
Villarini, G., Krajewski, W. F., Ntelekos, A. A., Georgakakos, K. P., and Smith, J. A. (2010). Towards probabilistic forecasting of flash floods: The combined effects of uncertainty in radar-rainfall and flash flood guidance. J. Hydrology 394 (1–2), 275–284. doi:10.1016/j.jhydrol.2010.02.014
Wilcox, J. M., and Scherrer, P. H. (1981). On the nature of the apparent response of the vorticity area index to the solar magnetic field. Sol. Phys. 74 (2), 421–432. doi:10.1007/BF00154528
Wilcox, J. M., Scherrer, P. H., Svalgaard, L., Roberts, W. O., Olson, R. H., and Jenne, R. L. (1974). Influence of solar magnetic sector structure on terrestrial atmospheric vorticity. J. Atmos. Sci. 31 (2), 581–588. doi:10.1175/1520-0469(1974)031<0581:IOSMSS>2.0.CO;2
Wilcox, J. M., Scherrer, P. H., Svalgaard, L., Roberts, W. O., and Olson, R. H. (1973). Solar magnetic sector structure: Relation to circulation of the Earth’s atmosphere. Science 180 (4082), 185–186. doi:10.1126/science.180.4082.185
Wilcox, J. M., Svalgaard, L., and Scherrer, P. H. (1976). On the reality of a sun-weather effect. J. Atmos. Sci. 33 (6), 1113–1116. doi:10.1175/1520-0469(1976)033<1113:OTROAS>2.0.CO;2
Wilcox, J. M. (1979). Tropospheric circulation and interplanetary magnetic sector boundaries followed by MeV proton streams. Nature 278 (5707), 840–841. doi:10.1038/278840a0
Williams, P. J. S., Virdi, T., Lewis, R., Lester, M., Rodger, A., McCrea, I., et al. (1993). Worldwide atmospheric gravity-wave study in the European sector 1985–1990. J. Atmos. Terr. Phys. 55 (4–5), 683–696. doi:10.1016/0021-9169(93)90014-P
Williams, R. G. (1978). A study of the energetics of a particular Sun-weather relation. Geophys. Res. Lett. 5 (6), 519–522. doi:10.1029/GL005i006p00519
Williams, R. G., and Gerety, E. J. (1978). Does the troposphere respond to day-to-day changes in solar magnetic field?Nature 275 (5677), 200–201. doi:10.1038/275-200b0
Xu, J., Smith, A. K., Wang, W., Jiang, G., Yuan, W., Gao, H., et al. (2013). An observational and theoretical study of the longitudinal variation in neutral temperature induced by aurora heating in the lower thermosphere. J. Geophys. Res. Space Phys. 118 (11), 7410–7425. doi:10.1002/2013JA019144
Keywords: high-speed solar wind, magnetosphere–ionosphere–atmosphere coupling, atmospheric gravity waves, heavy rainfall-induced floods, high-rate precipitation, moist symmetric instability, slantwise convective available potential energy
Citation: Prikryl P and Rušin V (2023) Occurrence of heavy precipitation influenced by solar wind high-speed streams through vertical atmospheric coupling. Front. Astron. Space Sci. 10:1196231. doi: 10.3389/fspas.2023.1196231
Received: 29 March 2023; Accepted: 06 July 2023;
Published: 31 July 2023.
Edited by:
Dimitry Pokhotelov, Institute for Solar-Terrestrial Physics, GermanyReviewed by:
Maosheng He, Leibniz Institute of Atmospheric Physics (LG), Germany
Philip J. Erickson, Massachusetts Institute of Technology, United States
Copyright © 2023 Prikryl and Rušin. This is an open-access article distributed under the terms of the Creative Commons Attribution License (CC BY). The use, distribution or reproduction in other forums is permitted, provided the original author(s) and the copyright owner(s) are credited and that the original publication in this journal is cited, in accordance with accepted academic practice. No use, distribution or reproduction is permitted which does not comply with these terms.
*Correspondence: Paul Prikryl, cGF1bC5wcmlrcnlsQHVuYi5jYQ==