 J. C. Suárez
- Física Teórica y del Cosmos Dept, University of Granada, Granada, Spain
This study explores the use of Shannon entropy to find periodic patterns in the oscillation spectra of δ Scuti stars. We have developed a new diagnostic tool for detecting potential patterns that scans for minimal entropic states in the well-known échelle diagrams. Here, we describe the basic mathematical grounds of the Shannon entropy and how it can be applied to échelle diagrams through a new diagnostic diagram: the entropy (H) spectrum (HSpec). The method is first validated with the solar-like pulsator HD 49933, for which the large separation was found compatible with values published in the literature. Then we computed the entropy spectrum for two well-studied δ Scuti stars: HD 174936 and HD 174966, for which HSpec analysis was able to accurately determine their large separation (or some multiple or submultiple of it). Although these results are promising, the HSpec tool presents several limitations: it has a strong dependence on the probability distribution of the frequencies in the échelle diagram, and on the way it is calculated. We discuss possible solutions to this that rely on 2D probability distributions and conditional entropy.
1 Introduction
The analysis of periodic patterns is crucial for asteroseismology. Up to date, the search for individual mode identification has been found to be an almost unreachable task for most of the variable stars. This has barely progressed even with the availability of ultra-precise data from space. However, some structures in the oscillation power spectrum of pulsating stars provide very useful information about the stellar interiors. This has been especially successful for the Sun and solar-like pulsators (e.g., red giants), whose periodic patterns can be observed without difficulty (see e.g., Aerts et al., 2010; Corsaro et al., 2012). In fact, from main-sequence to read giants solar-like pulsators, the automated mode identification (including mixed modes) is nowadays a reality (details in e.g., Kallinger, 2019; Corsaro et al., 2020; Nielsen et al., 2021) This has led to a revolution in the understanding of their internal structure and evolution with the use of scaling relations (see e.g., Hekker and Christensen-Dalsgaard, 2016, and references therein), which have been used as a proxy of stellar masses, radii, mean densities, ages, etc. This has allowed us to perform more accurate stellar population studies of the galaxy (Miglio et al., 2016, 2013). On the other hand, for other stars with different pulsation mechanisms, such periodic patterns are not so easy to detect.
Thanks to a great observational effort, Breger et al. (1999) found periodic regularity in the oscillation spectrum of FG Vir, which was proposed as possible large separation-like pattern in the low-frequency regime (around the fundamental radial mode). Later on, in the era of space missions like MOST (Walker et al., 2003), CoRoT (Baglin et al., 2006), and Kepler (Koch et al., 2010), thanks to ultra-precise photometric time series, such patterns in the low-frequency regime of δ Scuti stars were again observed (see e.g., García Hernández et al., 2009; Handler, 2009; García Hernández et al., 2013). These patterns were also predicted theoretically (Reese et al., 2008; Ouazzani et al., 2015) and were found to be compatible with a large separation that scales with the mean density of the star (Δν, Suárez et al., 2014). This scaling was then empirically confirmed by García Hernández et al. (2015) using binary systems with a δ Scuti component. Then Hernández et al. (2017) used the scaling Δν − ρ relation to demonstrate that it was possible to accurately determine the surface gravity of those stars when precise measurements of stellar parallaxes are available. This paved the way to perform multivariable correlations analyses in the observed seismic data (Moya et al., 2017) as well as to find the empiric relation between the frequency at maximum power of their oscillation spectra (νmax) and the effective temperature (Barceló Forteza et al., 2018), or even with surface gravity through the study of the gravity darkening in fast rotators (Barceló Forteza et al., 2020). Interestingly, Mirouh et al. (2019) retrieved a similar Δν − ρ scaling relation for fast rotating stars using island modes identified using a convolutional neural network. The most recent theoretical relation has been obtained by Rodríguez-Martín et al. (2020) using synthetic spectra of rotating models.
A confident knowledge of the large separation is also valuable because it allows to better search for other interesting patterns, such as the rotational splitting (see e.g., Barceló Forteza et al., 2017; Ramón-Ballesta et al., 2021), the identification of certain radial modes in young δ Scuti stars (see Bedding et al., 2020, for more details), or put asteroseismic constraints on the age of open clusters (Pamos Ortega et al., 2022).
Despite all this progress, the detection of periodicities remains critical. In the last decades, methods based on pattern recognition have been applied in the time domain (see e.g., Mosser and Appourchaux, 2009, and references therein) with significant success in solar-like pulsators, red giants, etc. For A–F stars, the discrete Fourier transform (DFT) of the frequency positions (García Hernández et al., 2009) is the most successful method to detect large separations in A–F stars. Some attempts to automatize its use have been developed (see e.g., Paparó et al., 2016); however, all of them still requires some supervision, preventing the implementation in automatic pipelines.
In this work, we tackled the problem of frequency pattern detection with a concept borrowed from Information Theory: the Shannon entropy. This concept has mainly been applied in the realm of information transmission, computer science, etc. In astronomy, Cincotta et al. (1995) and Cincotta et al. (1999) developed the first methods to detect patterns in astronomical time series.
In recent years, Shannon entropy has regained interest in the so-called big data and machine learning fields as a reliable measure of statistical dependence (see e.g., Malakar et al., 2012), as well as a criterion for feature selection in engineering (Tourassi et al., 2001). This work considers the frequency patterns as features in stellar power spectra, and thus we applied the concept of Shannon entropy to detect them with no hypothesis about their statistical distributions. In Section 2, we define the concept of Shannon entropy in the manner we calculated it and the new diagnostic tool based on it, the entropy spectrum (HSpec). The method is then validated against well-known frequency patterns of the solar-like star HD 49993 and applied to the two selected δ Scuti stars (Section 3). Finally, in Section 4, we interpret the results as compared with other methods and discuss the limitations of the tool as well as possible solutions to improve its robustness.
2 Methods
The methodology followed in this work relies entirely upon the use of the Shannon entropy, a concept which was introduced for the first time by Claude Shannon in the context of communication theory (see his famous study Shannon, 1948, for details). In the following, for the sake of simplicity the word “entropy” will be used as a shortcut of “Shannon Entropy”. It is thus worthy defining it to better understand its importance for the method. The entropy H of a discrete random variable X is defined in terms of its probability distribution P(X), as follows:
When there is no knowledge about the distribution of probabilities P(x) we need to estimate it. This thus implies that instead of calculating the entropy we will estimate it
where
is the ML estimate of probability distribution based on the observed counts yk normalized by the total number of observations.
2.1 The échelle diagrams
We are interested in finding frequency patterns in the oscillation spectra, that is, the set of observed oscillation frequencies of a given pulsating star. For this purpose, we use the following statistical variables:
where [νi] represents the set of observed frequencies and Δνj is a given frequency periodicity.
Such a relation between variables is the well-known échelle diagram, widely used in asteroseismology for the visual inspection and determination of large separations (mainly in solar-type stars). When Δνj corresponds to the large separation, the oscillation modes appear aligned, with a vertical distance between points of Δνj for the same angular degree. The different ridges represent the modes with different mode degrees, although the identification of the modes is out of the scope of this study.
Figure 1 shows the échelle diagram of HD 49993 for two different spacing: its large separation and a random value. Notice that when vertical ridges come up, most of the modes are vertically aligned, which indicates certain regularity. This is indeed, the way of finding the correct Δν using échelle diagrams. However, the clarity of the vertical ridges is progressively lost as one moves away from the optimal value, up to some Δνj at which points seem to be randomly distributed, and therefore indicates less regularity, or at least, less regularity than the previous case, which is the main point of the present method.
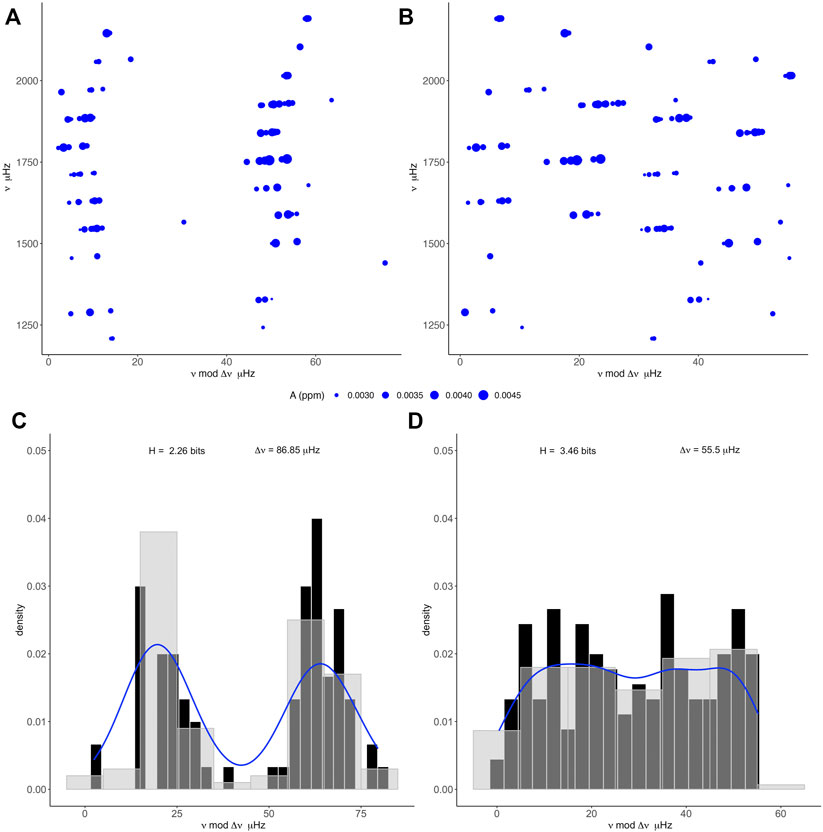
FIGURE 1. Upper panels show the échelle diagrams of the solar-like star HD 49933, the first solar-like star observed by CoRoT. These were built using its oscillation frequencies obtained from a pre-whitening process (see Section 3.1). The size of dots indicates the amplitude of the observed modes in ppm. (A) shows the classical vertical ridges corresponding to modes ordered by Δν = 86.85 μHz. (B) shows the same diagram for a random value of Δν = 55.5 μHz. Lower panels, (C,D), are the histograms (density of counts) of the échelle diagrams corresponding to (A,B), respectively. Grey and black represent histograms computed with bandwidths of 10 μHz and 3 μHz, respectively. For illustration the density curve for the latter is also depicted in blue color.
2.2 The entropy of échelle diagrams
The concept of order and disorder are somewhat ambiguous. Instead, let us use the notion of measure of information, as originally proposed by C. Shannon. This measure can also be understood as a kind of uncertainty about the information itself1. The measure of information conveys how hard it is to transmit information through a message. Hard means that you need more bits of information to transmit the same information. In this case, the message is carried by the distribution of points in the échelle diagram. In other words, an ordered-like distribution as the one seen in Figure 1A requires less bits of information to be transmitted, as compared with the random-like distribution of Figure 1B. Qualitatively this means that HA < HB.
In order to quantify the entropy, H, it is necessary to know the distribution of the points P(X) in the échelle diagram (see Eq. 1). The simplest way of obtaining such information is to compute the histogram of the échelle diagram’s abscissa, that is, how ν |Δνj|, for a given Δνj. This is illustrated in panels C and D of Figure 1, where the distribution of counts (bars) or density (shaded curve) is P(X). As expected, when points are distributed in two regions (lobes of panel A), the uncertainty about the location of points is low (or equivalently, the amount of bits necessary to transmit the information about the distribution of the points is low), HA = 1.96 bits, as compared with a uniform P(X) of panel B, for which is HB = 3.46 bits.
At this point it is important to emphasize that this is an interpretation of entropy in terms of measure of information, hence nothing can be said about the information it may conveys. That is, one can deduce or extract useful information from panels A or B of Figure 1, regardless their measure of information, which is just related with how the distribution of points in the échelle diagrams can be coded. It can also be interpreted as the degree of uncertainty or even as the average unlikelihood of occurrence of the outcomes.
2.3 The Hspec
The main objective of the method is to find the distribution of points in the échelle diagram that minimizes its entropy H. In practice, we proceed according to the following steps:
1. Selection of the interval of the periodicities Δνj to be explored and its resolution R. Depending on the previous knowledge about type of pulsation, estimates of periodic patterns, etc., we establish how wide the scan frequency will be. For solar-like pulsations this is quite straightforward since scaling relations can provide an initial guess on Δν, which may help to shorten the interval to explore. However, the scaling relations for δ Scuti stars relies the large separation with the mean density of the star (see Rodríguez-Martín et al., 2020, for the most updated relation), calibrated for eclipsing binaries, for which independent measurements of the mean density are available. The resolution, that is, the step in frequency R = Δνj − Δνj−1 can be arbitrarily small. However, this can increase the amount of numerical operations needed. The lower limit, in any case, should be twice the observational uncertainties of the oscillation frequencies: 2 |ϵ(νj)|.
2. Choosing the range of observed frequencies to be explored. Although, this step is not strictly required, it is recommended to restrict it (if possible) to the frequency domain where the targeted periodic patterns are expected to be. Complete exploration is also possible, although the - spectra might be noisier or less reliable.
3. Estimation of the number of bins nb to sample the probability distributions. We selected a given number of bins for the scan of Δνj.
4. Building the entropy spectrum, HSpec. Échelle diagrams are computed for each the scanned Δνj values explored within the selected ranges of frequency and periodicities [Δνmin, Δνmax]. Then Hj is calculated for each one of those échelle diagrams. The complete set of (Hj, Δνj) is what I called entropy spectrum.
The absolute minimum of entropy in HSpec is considered the dominant periodicity, which can be interpreted as the large separation or a submultiple of it (see Section 4).
2.4 A first glance to HSpec on a synthetic oscillation spectrum
Notice that the Shannon entropy is sensitive not only to variations in the overall distribution of the points but also in the way the probability distribution is computed, that is, the size and/or number of bins used in the histograms.
A detailed analysis of HSpec for different configuration of parameters lies beyond the scope of this study. Nonetheless, a first glance to synthetic oscillation spectra indicates that HSpec would be more sensitive to the number of bins than any other factor (see Figure 2). The entropy spectra showed in that figure were computed for an asteroseismic model of 1.52 M⊙ using the evolutionary code mesa (Paxton et al., 2019) and the adiabatic pulsation code filou (Suárez and Goupil, 2008). Standard physics for δ Scuti stars were considered with solar metallicity and a moderately fast surface rotation (40% of the break-up frequency). Adiabatic frequencies were corrected for the effect of rotation including near-degeneracy effects (Suárez et al., 2006). The theoretical large separation of Δν = 86.83 μHz was computed as the median of the large separations obtained for each ℓ within the range n = [2, 10].
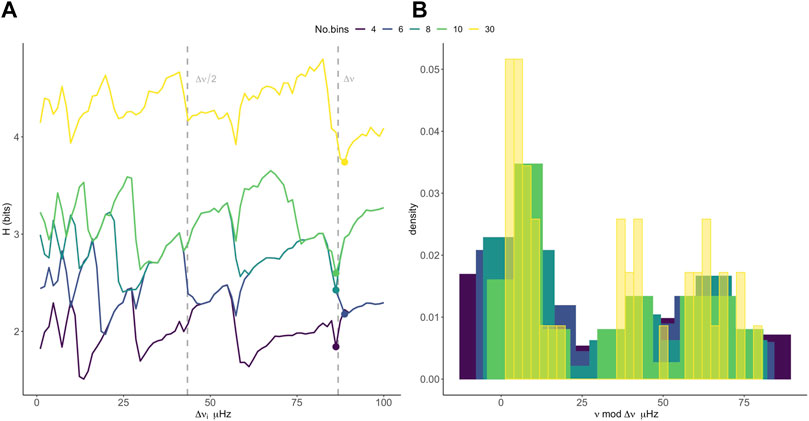
FIGURE 2. Panel (A) shows the variation of HSpec with the number of bins for an asteroseismic model of 1.52 M⊙. For illustration, the large separation of the model, Δν = 86.84 μHz, and its half, are shown as vertical dashed lines. Filled dots indicate the location of the local minima that spot the large separation value. (B) depicts the histograms from which the probability distributions were extracted to compute the entropy spectra shown in (A).
The value of the actual large separation is always spotted whatever the number of bins considered. However, these local minima do not always correspond with the absolute minima. In some cases, it is hard to find out which of the peaks would be the right one. For lower Δνi values, the analysis is even more difficult since there are significant shifts of the peaks of about 5–20 μHz. Bear in mind that all the modes are considered (from ℓ = 0 to 2), that is, no visibility function was convoluted with the oscillation spectrum. This is therefore the best case, for which there is no lack of modes contributing to Δν. (see Section 4 for more details on the next steps foreseen to improve the method).
3 Results
As the main goal of the HSpec analysis is to find the large separation in δ Scuti stars, it is important to validate the method on stars for which the large separation is known and easily detectable, such as solar-type stars.
3.1 The HSpec of the solar-like pulsator HD 49933
For this star, we used the 60 days data from the CoRoT initial run (IR) processed with the MIARMA code to fill the gaps due to the satellite duty cycle (in particular the gaps caused by the passage of the satellite through the South Atlantic anomaly (see details in Pascual-Granado et al., 2015). We then obtained the pulsation frequencies of the star using the pre-whitening procedure described in Pascual-Granado et al. (2018), using the code sigspec (Reegen, 2007).
The large separation of HD 49933 was estimated from the light curve by Appourchaux et al. (2008) and later on by Benomar et al. (2009) is Δν = 85.9 ± 0.15 μHz. In the frequency domain, using échelle diagrams, its value is confirmed (Figure 1A). In addition, in those studies a rotational splitting in the range of 3.5 − 6 μHz is also reported.
Following the procedure explained in the previous section, we built the entropy spectrum for HD 49933 by first selecting the frequency range, and second, by keeping only a set of frequencies with the largest amplitudes. This procedure, similar to the one followed in García Hernández et al. (2009), helps us to obtain better results, assuming that the modes with the highest amplitudes (in general low-degree modes when observed with photometry) are those that mostly contribute to Δν. Figure 3 shows the aforementioned selection (panel A) and the HSpec (panel B) for HD 49993.
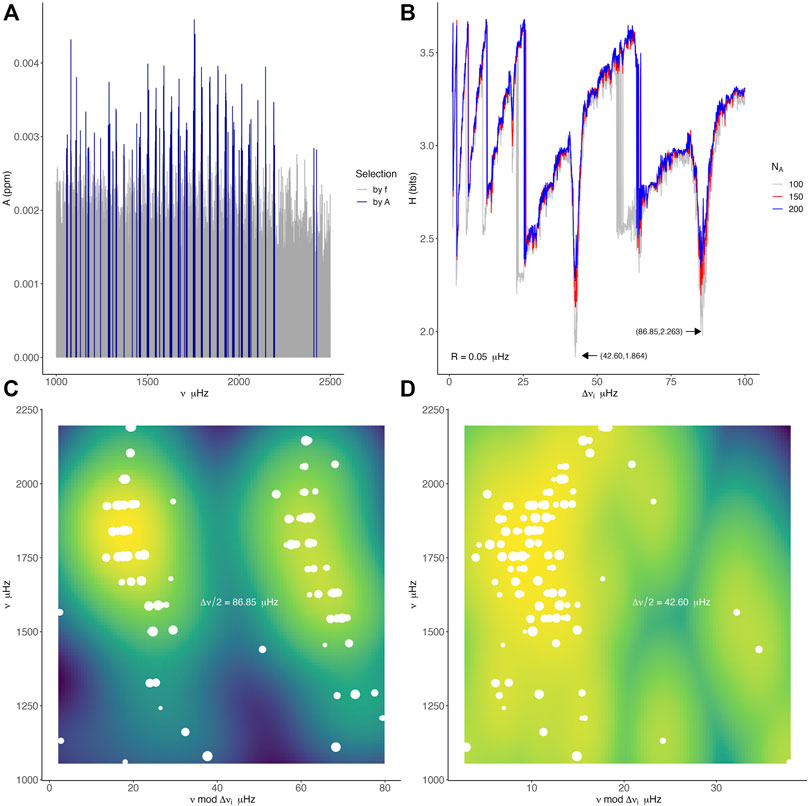
FIGURE 3. Panel (A) depicts the oscillation spectrum in the frequency range where p-modes are found (in grey), and a selection of NA =100 frequencies from that range with the largest amplitude (an explanation of this arbitrary number is given in the discussion section). Panel (B) shows the entropy spectrum (HSpec) computed for three different numbers of large amplitude frequencies: NA = 100, 150, and 200. Notice that the minimum H value is found for the half of the observed large separation whatever NA. Panels (C,D) show the échelle diagram for both the estimated large separation and its half. As for panel 3, the size of white dots is proportional to the amplitude of the modes, and the background is the 2D density of the échelle diagrams..
As expected, HSpec shows high variability with different entropy minima corresponding to, say, local states of low H. When exploring low Δνi values peaks may correspond with échelle diagrams with a too small number of points. From the information theory interpretation, this is equivalent to the presence of a pattern; hence, the actual H value may be similar. Therefore, as happens for the DFT method, the peaks in that range will not be considered in this first study.
It can be seen that the absolute minimum (H = 1.864 bits) within the range of Δν is reached for Δνi = 42.60 μHz, which is half of the large separation found by Benomar et al. (2009). The entropy spectrum was constructed with a resolution of R = 0.05 μHz. If we consider this resolution as the uncertainty of the estimate, the detected periodicity would thus be Δνi = 42.60 ± 0.05 μHz. However, this must be considered with caution, since a comprehensive analysis of the different sources of errors must be done in order to properly estimate the uncertainty of Δν. As an example, the HSpec shows different local minima and even some shifts in Δν when using a different amount of frequencies of highest amplitude to construct the échelle diagrams for each Δνi. The depth and width of the peaks and their relation might be good estimators for the uncertainty in the measure when all the error sources are included. They can be modified by, for example, the number of frequencies, number of bins used to construct the probability distribution, method used to estimate entropy, etc. (see Section 2). This however exceeds the scope of this exploratory work. As for the DFT and AC, the HSpec show both the large separation and its submultiples. The presence of an absolute minimum may be used to consider that periodicity as the one to which more modes are contributing due to their visibility.
3.2 The HSpec of the δ Scuti stars HD 174936 and HD 174966
These objects are two of the best-known δ Scuti stars, for which there is a reliable determination of the large separation using the discrete Fourier transform method. Any method based on statistical estimators has an intrinsic dependence upon the number of realizations (observations). This is the case of the discrete Fourier transform, autocorrelation (AC), and histogram of frequency differences (HFD), currently used for determining the large separation of δ Scuti stars2.
As for HD 49993, the light curves of both δ Scuti stars were observed by the CoRoT satellite (Seismo Field). Their oscillation spectra were obtained from the fractal analysis of the pre-whitening process (see De Franciscis et al., 2018; De Franciscis et al., 2019, for more details). That method allowed us to find the harmonic content of the light curve without imposing any statistical criterion about the significance, thereby minimizing the presence of spurious peaks, which is key to avoid any distortion in the échelle diagrams and hence on the computation of HSpec.
As it happens in other statistical methods (DFT, autocorrelation function, etc.), the detection of regularities in these stars is more difficult, due to the complexity of their oscillation spectrum (see Goupil et al., 2005, for an interesting review of the asteroseismology of δ Scuti stars). In contrast to the HSpec of HD 49993, the number of bins, resolution, and frequency domain play an important role in the determination of the large separation. This implies to perform several iterations to find the optimum HSpec from which the Δν and its multiples (and submultiples) were determined.
Figure 4 depicts the HSpec for both stars together with the échelle diagram corresponding to the detected Δν. It is worth noting that the leftmost part of the entropy spectrum is quite similar to the one found for HD 49993, which reinforces the explanation of the peaks as a consequence of the lack points in the échelle diagram. When the number of frequencies is small this configuration may lead to the absolute minimum of entropy. This is the case of HD 174966, for which the second minimum is compatible with the half of the large separation determined by the DFT method Δν = 65 ± 1 μHz (García Hernández et al., 2013). The next minima are above 75 μHz, far beyond twice the Δν/2. As discussed before, this may be caused by the way in which the distribution of probability is constructed.
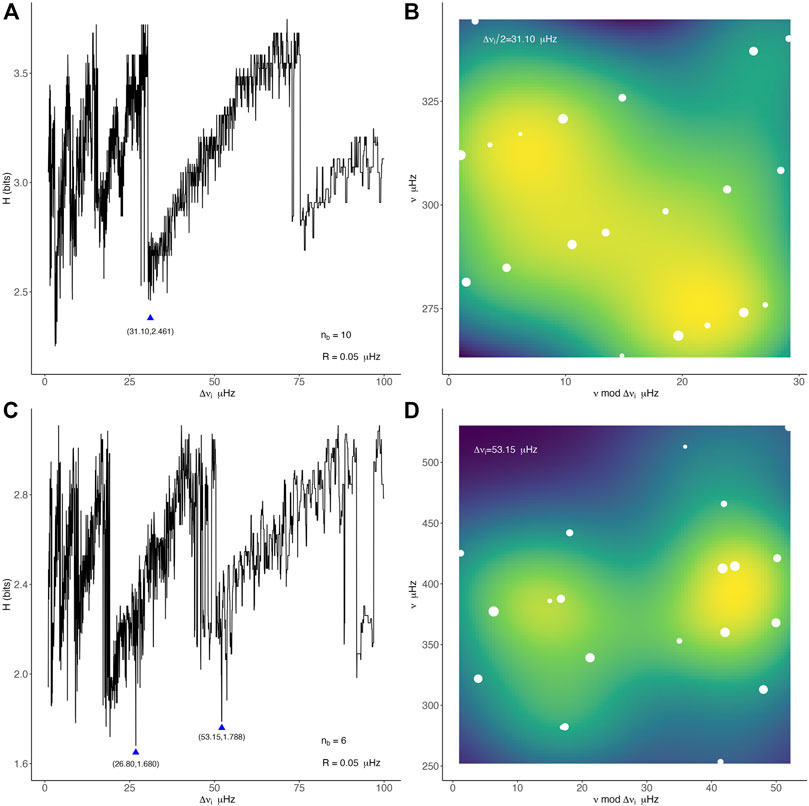
FIGURE 4. Entropy spectrum (HSpec) for HD 174966 (A) and HD 174936 (C). Panels (B,D) show the resulting échelle diagram (white dots) for the large separation determined by the HSpec in panels (A,B), respectively. The size of dots is proportional to the amplitude of the modes. Background corresponds with the 2D density of the échelle diagrams, which help to visually guess the probability distribution of the points in both vertical and horizontal axes. Notice that for HD 174966, the échelle diagram is built for the half of the large separation, corresponding to the absolute minimum in HSpec.
Moreover, the number of bins used for HD 174966 is 10, while only six were sufficient for HD 174936. This is because although the total number of frequencies for both stars is somewhat similar (120 and 177 frequencies for HD 174966 and HD 174936, respectively), the frequency range in which the highest amplitude peaks are found is [250, 350] μHz for HD 174966 and [160, 650] μHz for HD 174936. This implies that échelle diagrams were built with 20 frequencies for HD 174966 and 127 frequencies for HD 174936.
For HD 174936, both the half of the large separation Δν/2 = 28.80 ± 0.05 μHz and twice the value (i.e., the large separation) Δν = 53.15 ± 0.05 μHz were found, which is compatible with the large separation found using the DFT technique, that is, Δν = 52 ± 10 μHz (García Hernández et al., 2009). Notice that, once again the absolute minimum within the range of explored Δνi is identified with the half of the large separation, which might be interpreted in terms of the modes’ visibility.
In addition, the échelle diagram of HD 174936 frozen at its large separation shows a glimpse of the classical échelle configuration with two vertical ridges composed by the modes with the highest amplitudes. In contrast, this configuration is not visible in the échelle diagram of HD 174966, but a series of inclined fringes with no clear pattern for the modes with the highest amplitudes. A similar distribution of points in the échelle diagram is found for twice Δν/2, even if this is not clearly a minimum in HSpec.
Regarding the values of H, it can be seen that the HSpec of HD 17966 is shifted by about 1 bit on average respect to the HSpec of HD 174936. Since there is no reference value for the entropy, except maybe its average over the HSpec, which allows us to calculate some statistics, there is no way to compare two HSpec by their absolute H values. The hypothesis that seems more plausible to explain such a shift is the amount of frequencies that are actually contributing to the large separation.
4 Discussion
The entropy spectrum analysis was found to be reliable and robust for the solar-like pulsator HD 49993. For this star Δν/2 and Δν were found the two minima of the HSpec. As happens with other methods mentioned previously, additional information is required to spot Δν multiples or submultiples, and thereby the actual value of Δν. This has implications on the visibility of the modes which are inherently related with the angle of inclination of the star respect to the observer.
For the two selected δ Scuti stars HD 174966 and HD 174936 HSpec was able to accurately determine the periodicities corresponding to either the large separation or its half. However, in contrast to HD 49993, the optimum HSpec was obtained by several iterations with different combinations of frequency ranges, number of bins, and number of frequencies with the highest amplitudes. Although this is an evident limitation of the method, the HSpec looks promising as a tool to determine the large separation of δ Scuti stars, even for oscillation spectra containing a few tens of modes.
In order to render the method here presented more robust, it is necessary to minimize both the human supervision and the additional information required to accurately determine the large separation of δ Scuti stars. The next steps will thus be focused on improving the treatment of the probability distribution of the échelle diagram points. I envisage to work on two main aspects: 1) the enhancement of the signal through the échelle diagrams, i.e., to implement a modified version of those diagrams that enhance the vertical alignment features in the probability distribution, and 2) the incorporation of joint probability distribution that accounts for the relation between nu ad ν modulo Δνj. For 1) there is well-known method widely used for solar-like pulsators, the so-called collapsed échelle diagrams (see e.g., Corsaro et al., 2012, and references therein). These collapsed échelle diagrams take into account the entire observed power spectrum, which may render transitions between entropic states smoother. The background signal would also be present so it might be used somewhat as reference entropy for each star. Another interesting point is that it can be quite fast since no pre-whitening process is necessary, so it might be used in pipelines for asteroseismic analyses. Regarding the joint probability distributions 2), the inclusion of an additional dimension, the distribution of frequencies, might render HSpec method more sensitive to the presence of vertical patterns than any other patterns (for instance tilted ridges or even diagonal fringes).
Data availability statement
The original contributions presented in the study are included in the article further inquiries can be directed to the corresponding author.
Author contributions
JCS is the unique contributor to this work, from conception of the idea to development, test, and manuscript writing.
Funding
This work has been supported by Spanish public funds for research under project “Contribution of the UGR to the PLATO2.0 space mission. Phase C/D-1”, funded by MCNI/AEI/PID2019-107061GB-C64.
Acknowledgments
JCS acknowledges support by University of Granada and by Spanish public funds for research under project “Contribution of the UGR to the PLATO2.0 space mission. Phase C/D-1”, funded by MCNI/AEI/PID2019-107061GB-C64.
Conflict of interest
The author declares that the research was conducted in the absence of any commercial or financial relationships that could be construed as a potential conflict of interest.
Publisher’s note
All claims expressed in this article are solely those of the authors and do not necessarily represent those of their affiliated organizations, or those of the publisher, the editors, and the reviewers. Any product that may be evaluated in this article, or claim that may be made by its manufacturer, is not guaranteed or endorsed by the publisher.
Footnotes
1Note that, here, H does not deal with the information itself, but with its measure.
2Throughout the study, when referring to large separation in δ Scuti stars means the low-order (n = [2, 8–10]) large separation.
References
Aerts, C., Christensen-Dalsgaard, J., and Kurtz, D. W. (2010). Asteroseismology. Dordretch, Netherlands: Springer. doi:10.1007/978-1-4020-5803-5
Appourchaux, T., Michel, E., Auvergne, M., Baglin, A., Toutain, T., Baudin, F., et al. (2008). CoRoT sounds the stars: p-Mode parameters of sun-like oscillations on HD 49933. Astron. Astrophys. 488, 705–714. doi:10.1051/0004-6361:200810297
Baglin, A., Auvergne, M., Barge, P., Deleuil, M., Catala, C., Michel, E., et al. (2006). “Scientific objectives for a minisat: CoRoT,” in ESA special publication. Editors M. Fridlund, A. Baglin, J. Lochard, and L. Conroy (Noordwijk, Netherlands: ESTEC), 33.
Barceló Forteza, S., Moya, A., Barrado, D., Solano, E., Martín-Ruiz, S., Suárez, J. C., et al. (2020). Unveiling the power spectra of δ Scuti stars with TESS. The temperature, gravity, and frequency scaling relation. Astron. Astrophys. 638, A59. doi:10.1051/0004-6361/201937262
Barceló Forteza, S., Roca Cortés, T., García Hernández, A., and García, R. A. (2017). Evidence of chaotic modes in the analysis of four δ Scuti stars. Astron. Astrophys. 601, A57. doi:10.1051/0004-6361/201628675
Barceló Forteza, S., Roca Cortés, T., and García, R. A. (2018). The envelope of the power spectra of over a thousand δ Scuti stars. The - νmax scaling relation. Astron. Astrophys. 614, A46. doi:10.1051/0004-6361/201731803${\bar{T}}_{\spmathit{{eff}}}$
Bedding, T. R., Murphy, S. J., Hey, D. R., Huber, D., Li, T., Smalley, B., et al. (2020). Very regular high-frequency pulsation modes in young intermediate-mass stars. Nature 581, 147–151. doi:10.1038/s41586-020-2226-8
Benomar, O., Baudin, F., Campante, T. L., Chaplin, W. J., García, R. A., Gaulme, P., et al. (2009). A fresh look at the seismic spectrum of HD49933: Analysis of 180 days of CoRoT photometry. Astron. Astrophys. 507, L13–L16. doi:10.1051/0004-6361/200913111
Breger, M., Pamyatnykh, A. A., Pikall, H., and Garrido, R. (1999). The δ Scuti star FG virginis IV. Mode identifications and pulsation modelling. Astronomy Astrophysics 341, 151–162.
Cincotta, P. M., Helmi, A., Mendez, M., Nunez, J. A., and Vucetich, H. (1999). Astronomical time-series analysis – II. A search for periodicity using the Shannon entropy. Mon. Notices R. Astronomical Soc. 302, 582–586. doi:10.1046/j.1365-8711.1999.02128.x
Cincotta, P. M., Mendez, M., and Nunez, J. A. (1995). Astronomical time series analysis. I. A search for periodicity using information entropy. Astrophys. J. 449, 231. doi:10.1086/176050
Corsaro, E., McKeever, J. M., and Kuszlewicz, J. S. (2020). Fast and automated peak bagging with DIAMONDS (FAMED). Astron. Astrophys. 640, A130. doi:10.1051/0004-6361/202037930
Corsaro, E., Stello, D., Huber, D., Bedding, T. R., Bonanno, A., Brogaard, K., et al. (2012). Asteroseismology of the open clusters ngc6791, ngc6811, and ngc6819 from 19 months of kepler photometry. Astrophys. J. 757, 190. doi:10.1088/0004-637X/757/2/190
De Franciscis, S., Pascual-Granado, J., Suárez, J. C., García Hernández, A., and Garrido, R. (2018). Fractal analysis applied to light curves of δ Scuti stars. Mon. Not. R. Astron. Soc. 481, 4637–4649. doi:10.1093/mnras/sty2496
De Franciscis, S., Pascual-Granado, J., Suárez, J. C., García Hernandez, A., Garrido, R., Lares-Martiz, M., et al. (2019). A fractal analysis application of the pre-whitening technique to δ Scuti stars time series. Mon. Not. R. Astron. Soc. 487, 4457–4463. doi:10.1093/mnras/stz1571
García Hernández, A., Martín-Ruiz, S., Monteiro, M. J. P. F. G., Suárez, J. C., Reese, D. R., Pascual-Granado, J., et al. (2015). Observational δ ν –$\bar{\rho }$ relation for δ sct stars using eclipsing binaries and space photometry. Astrophys. J. 811, L29. doi:10.1088/2041-8205/811/2/l29
García Hernández, A., Moya, A., Michel, E., Garrido, R., Suárez, J. C., Rodríguez, E., et al. (2009). Asteroseismic analysis of the CoRoT δ Scuti star HD 174936. Astron. Astrophys. 506, 79–83. doi:10.1051/0004-6361/200911932
García Hernández, A., Moya, A., Michel, E., Suárez, J. C., Poretti, E., Martín-Ruíz, S., et al. (2013). An in-depth study of HD 174966 with CoRoT photometry and HARPS spectroscopy. Large separation as a new observable for δ Scuti stars. Astron. Astrophys. 559, A63. doi:10.1051/0004-6361/201220256
Goupil, M. J., Dupret, M. A., Samadi, R., Boehm, T., Alecian, E., Suárez, J. C., et al. (2005). Asteroseismology of δ Scuti stars: Problems and prospects. J. Astrophys. Astron. 26, 249–259. doi:10.1007/bf02702333
Handler, G. (2009). “Delta Scuti variables,” in Proceedings of the International Conference. AIP Conference Proceedings, Melville, NY Vol. 1170, 403–409.
Hausser, J., and Strimmer, K. (2009). Entropy inference and the james-stein estimator, with application to nonlinear gene association networks. J. Mach. Learn. Res. 10, 1469–1484.
Hekker, S., and Christensen-Dalsgaard, J. (2016). Giant star seismology. Astron. Astrophys. Rev. 49, 1. doi:10.1007/s00159-017-0101-x
Hernández, A. G., Suárez, J. C., Moya, A., Monteiro, M. J. P. F. G., Guo, Z., Reese, D. R., et al. (2017). Precise surface gravities of δ Scuti stars from asteroseismology. Mon. Notices R. Astronomical Soc. Lett. 471, L140–L144. doi:10.1093/mnrasl/slx117
Kallinger, T. (2019). Release note: Massive peak bagging of red giants in the Kepler field. arXiv e-prints , arXiv:1906.09428.
Koch, D. G., Borucki, W. J., Basri, G., Batalha, N. M., Brown, T. M., Caldwell, D., et al. (2010). Kepler mission design, realized photometric performance, and early science. Astrophys. J. 713, L79–L86. doi:10.1088/2041-8205/713/2/l79
Malakar, N. K., Knuth, K. H., and Lary, D. J. (2012). Maximum joint entropy and information-based collaboration of automated learning machines. AIP Conf. Proc. 1443, 230–237. doi:10.1063/1.3703640
Miglio, A., Chaplin, W. J., Brogaard, K., Lund, M. N., Mosser, B., Davies, G. R., et al. (2016). Detection of solar-like oscillations in relics of the milky way: asteroseismology of K giants in M4 using data from the NASA K2 mission. Mon. Not. R. Astron. Soc. 461, 760–765. doi:10.1093/mnras/stw1555
Miglio, A., Chiappini, C., Morel, T., Barbieri, M., Chaplin, W. J., Girardi, L., et al. (2013). Galactic archaeology: Mapping and dating stellar populations with asteroseismology of red-giant stars. Mon. Not. R. Astron. Soc. 429, 423–428. doi:10.1093/mnras/sts345
Mirouh, G. M., Angelou, G. C., Reese, D. R., and Costa, G. (2019). Mode classification in fast-rotating stars using a convolutional neural network: Model-based regular patterns in ’ Scuti stars. Mon. Notices R. Astronomical Soc. Lett. 483, L28–L32. doi:10.1093/mnrasl/sly212
Mosser, B., and Appourchaux, T. (2009). On detecting the large separation in the autocorrelation of stellar oscillation times series. Astron. Astrophys. 508, 877–887. doi:10.1051/0004-6361/200912944
Moya, A., Suárez, J. C., García Hernández, A., and Mendoza, M. A. (2017). Semi-empirical seismic relations of A-F stars from CoRoT and Kepler legacy data. Mon. Not. R. Astron. Soc. 471, 2491–2497. doi:10.1093/mnras/stx1717
Nielsen, M. B., Davies, G. R., Ball, W. H., Lyttle, A. J., Li, T., Hall, O. J., et al. (2021). PBjam: A Python package for automating asteroseismology of solar-like oscillators. Astron. J. 161, 62. doi:10.3847/1538-3881/abcd39
Ouazzani, R.-M., Roxburgh, I. W., and Dupret, M.-A. (2015). Pulsations of rapidly rotating stars. II. Realistic modelling for intermediate-mass stars. Astron. Astrophys. 579, A116. doi:10.1051/0004-6361/201525734
Pamos Ortega, D., García Hernández, A., Suárez, J. C., Pascual Granado, J., Barceló Forteza, S., Rodón, J. R., et al. (2022). Determining the seismic age of the young open cluster α Per using δ Scuti stars. Mon. Not. R. Astron. Soc. 513, 374–388. doi:10.1093/mnras/stac864
Paparó, M., Benkő, J. M., Hareter, M., and Guzik, J. A. (2016). Unespected series of regular spacing of S δ Scuti stars in the non-asymptotic regime. I. The methodology. Astrophys. J. 822, 100. doi:10.3847/0004-637X/822/2/100
Pascual-Granado, J., Garrido, R., and Suárez, J. C. (2015). Miarma: A minimal-loss information method for filling gaps in time series. Astron. Astrophys. 575, A78. doi:10.1051/0004-6361/201425056
Pascual-Granado, J., Suárez, J. C., Garrido, R., Moya, A., Hernández, A. G., Rodón, J. R., et al. (2018). Impact of gaps in the asteroseismic characterization of pulsating stars. Astron. Astrophys. 614, A40. doi:10.1051/0004-6361/201732431
Paxton, B., Smolec, R., Schwab, J., Gautschy, A., Bildsten, L., Cantiello, M., et al. (2019). Modules for experiments in stellar astrophysics (mesa): Pulsating variable stars, rotation, convective boundaries, and energy conservation. Astrophys. J. Suppl. Ser. 243, 10. doi:10.3847/1538-4365/ab2241
Ramón-Ballesta, A., García Hernández, A., Suárez, J. C., Rodón, J. R., Pascual-Granado, J., Garrido, R., et al. (2021). Study of rotational splittings in δ Scuti stars using pattern finding techniques. Mon. Not. R. Astron. Soc. 505, 6217–6224. doi:10.1093/mnras/stab1719
Reegen, P. (2007). SigSpec. I. Frequency- and phase-resolved significance in Fourier space. Astron. Astrophys. 467, 1353–1371. doi:10.1051/0004-6361:20066597
Reese, D., Lignières, F., and Rieutord, M. (2008). Regular patterns in the acoustic spectrum of rapidly rotating stars. Astron. Astrophys. 481, 449–452. doi:10.1051/0004-6361:20078075
Rodríguez-Martín, J. E., García Hernández, A., Suárez, J. C., and Rodón, J. R. (2020). Study of the low-order Δν-ρ− relation for moderately rotating δ Scuti stars and its impact on their characterization. Mon. Not. R. Astron. Soc. 498, 1700–1709. doi:10.1093/mnras/staa2378
Shannon, C. E. (1948). A mathematical theory of communication. Bell Syst. Tech. J. 27, 379–423. doi:10.1002/j.1538-7305.1948.tb01338.x
Suárez, J. C., and Goupil, M. J. (2008). Filou oscillation code. Astrophys. Space Sci. 316, 155–161. doi:10.1007/s10509-007-9568-7
Suárez, J. C., Goupil, M. J., and Morel, P. (2006). Effects of moderately fast shellular rotation on adiabatic oscillations. Astron. Astrophys. 449, 673–685. doi:10.1051/0004-6361:20054181
Suárez, J. C., Hernández, A. G., Moya, A., Rodrigo, C., Solano, E., Garrido, R., et al. (2014). Measuring mean densities ofδScuti stars with asteroseismology. Astron. Astrophys. 563, A7. doi:10.1051/0004-6361/201322270
Tourassi, G. D., Frederick, E. D., Markey, M. K., and Floyd, C. E. (2001). Application of the mutual information criterion for feature selection in computer-aided diagnosis. Med. Phys. 28, 2394–2402. doi:10.1118/1.1418724
Keywords: asteroseismology, time series analysis, stellar structure and evolution, information theory, stellar pulsations, delta Scuti stars, solar-like oscillations
Citation: Suárez JC (2022) The potential of Shannon entropy to find the large separation of δ Scuti stars: The entropy spectrum. Front. Astron. Space Sci. 9:953231. doi: 10.3389/fspas.2022.953231
Received: 26 May 2022; Accepted: 29 June 2022;
Published: 22 August 2022.
Edited by:
Tiago Campante, Instituto de Astrofísica e Ciências do Espaço (IA), PortugalReviewed by:
Jadwiga Daszynska-Daszkiewicz, University of Wrocław, PolandEnrico Maria Nicola Corsaro, Osservatorio Astrofisico di Catania (INAF), Italy
Copyright © 2022 Suárez. This is an open-access article distributed under the terms of the Creative Commons Attribution License (CC BY). The use, distribution or reproduction in other forums is permitted, provided the original author(s) and the copyright owner(s) are credited and that the original publication in this journal is cited, in accordance with accepted academic practice. No use, distribution or reproduction is permitted which does not comply with these terms.
*Correspondence: J. C. Suárez, amNzdWFyZXpAdWdyLmVz