- Murata-laboratory, Department of Physics, Rikkyo University, Toshima-City, Japan
The influence of birefringence on rays entering and exiting a non-isotropic medium is a complex process that depends on its dielectric tensor, the orientation and geometry of the medium, the surrounding material, and the inclination of the incident ray. Thus, when aiming for a calculation of the effects, many parameters need to be taken into account while simplifications are generally not applicable. Moreover, the complexity of the general issue makes it almost impossible to find an analytical solution for backward calculations of stress-birefringence from polarization measurements. In this paper, a report is given on the formulation of a birefringence ray-tracing program in Python for the convenient evaluation of optical effects inside uniaxial crystals under stress. The aim thereby is to have an easily applicable tool that can be used in interferometer commissioning for current and future gravitational-wave detectors. Results from test simulations using realistic parameters for a sapphire mirror as used in the gravitational-wave detector KAGRA are implemented and show the capabilities of this tool.
1 Introduction
Large-scale laser-interferometer form the fundamental technology of modern gravitational-wave detectors like LIGO in the United States (Aasi et al. (2015)), Virgo in Italy (Acernese et al. (2015)) and KAGRA in Japan (Akutsu et al. (2019; 2020)). This technology proved to be successful in the detection of gravitational waves (Abbott et al. (2016)). Ever since, the number of detections is rising and while the observations give enormous insight into previously only theoretically describable phenomena, scientists are striving to further upgrade the existing detectors to increase their sensitivity and broaden the detectable frequency range (Kalogera et al. (2021); Bailes et al. (2021)). Newer detectors like KAGRA entered the stage of gravitational-wave detection at lower sensitivities and still have to catch up to the current limits, mainly set by the LIGO detectors (Akutsu et al. (2020); Martynov et al. (2016); Aso et al. (2013)). KAGRA, in particular, is using cryogenic cooled mirrors which decreases the thermal noise limiting sensitivity at higher frequencies to a greater extent than LIGO and Virgo can do with room-temperature mirrors (Akutsu et al. (2020)).
Unsurprisingly, the most sensitive parts of those detectors are their optics. The most crucial components are formed by the large (and heavy) mirrors that create the Fabry-Perot cavities (“test-mass”, or TM). In each cavity a large amount of laser-energy is stored which increases the effective sensitivity to space-time deformations of gravitational waves (Saulson (1994)). The partially transmitting mirror at the beam-splitter side of the cavities (ITM) thereby governs the properties of the light entering and exiting (see also Figure 1 for a basic outline of the optics alignment in KAGRA). Since all mirror-coatings in those detectors are designed to reflect (or transmit) a specific portion of light depending on the polarization, it is of utmost importance for the signal’s readout that the polarization remains constant inside the interferometer. A change of polarization especially at the ITMs will decrease the effective signal-power and thus harm sensitivity. While in reflection the dependence of polarization on external parameters like the angle of incidence (AOI) can be kept low by accurately engineered coatings, in transmission a lot more uncertainties exist which make it difficult to predict the precise behavior of the transmitted polarization. Polarization characterization by polariscopes could be very helpful but are still not a standard technique in the construction of gravitational-wave detectors. Instead, transmitted wavefront-error (TWE) maps are analyzed which can indeed detect local density inhomogeneities and thus changes of the refraction index. This however only if the changes are isotropic (Chipman et al. (2018)). For anisotropic inhomogeneities of the refraction index, TWE maps taken at different rotation angles need to be taken and analyzed, an endeavor which currently just has started. In KAGRA the substrate of ITMs is made of sapphire, a non-isotropic (uniaxial) crystal which naturally can change the input polarization of an incoming beam if it is not aligned to be parallel to the sapphire’s c-axis (Dobrovinskaya et al. (2009)). Small inhomogeneities during the growth of the crystal can lead to local misalignment (crystal-defect) and hence disturbed polarization performance. LIGO and Virgo, on the other side, are using substrates made of silica (amorphous SiO2) for their test-masses which is isotropic. But even though, internal stress remaining from manufacturing can turn isotropic materials into (locally) uniaxial ones, making them to behave basically as an anisotropic waveplate (Chipman et al. (2018)). Uniaxial crystals on the other hand may become even biaxial if internal stress resides.
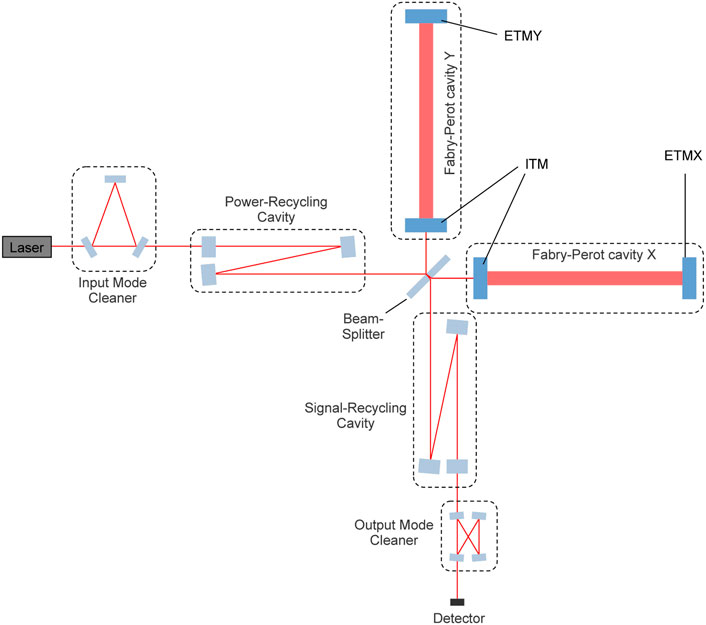
FIGURE 1. Sketch of the basic optics and their principal alignment in the KAGRA detector. The ITM and ETM mirrors forming the Fabry-Perot cavities are (silica-tantala coated) sapphire single-crystals with their c-axis aligned parallel to the laser-beam path.
In general, when an electromagnetic plane-wave enters an uniaxial or biaxial material, it will split into two separate fields representing its eigenpolarizations inside the material and traveling in different directions (see Figure 2). Polarization direction, wavevector k and Poynting vector S of each eigenstate are a function of the material’s indicatrix (refraction-index ellipsoid), AOI, and incoming medium’s optical properties (since in this paper the case of gravitational-wave interferometer is treated, the incoming medium will be assumed to be a vacuum and therefore isotropic). Usually, it is just a mirror’s coating that is of concern when designing its properties which is to reflect and transmit a particular portion of incoming light under a given constraint. Hence, the thickness of mirror-substrates may be of not great interest and can become even negligible for light passing it if birefringence is sufficiently small. In gravitational-wave detectors, however, the test-masses need to meet certain mass and geometry requirements in order to fulfill suspension constraints (Saulson (1994)) or (in case of KAGRA) constraints on thermal conductivity (Akutsu et al. (2020)). The substrates of ITMs are therefore particularly thick. For example, the test-masses in KAGRA measure 220 mm in diameter and ∼ 150 mm in thickness (given are the mean values). With such thicknesses even small AOIs lead to considerable optical path differences between the two refracted beams and thus to changes in the resulting polarization once the beams emerge from the sample. Here, we assume a typical laser-beam (λ = 1064 nm with ø = 35 mm after Aso et al. (2014)) entering the ITMs in KAGRA. The change in polarization is thereby a result of both beams overlapping each other when leaving the substrate. Moreover, even when normal incidence is assured, small changes in the orientation of the indicatrix will also lead to ray-doubling and hence polarization changes. On the other side, any Gaussian beam offers a constantly changing AOI throughout its wavefront when impacting a mirror, thus ray-doubling appears as a function of the wavefront curvature leading to multiple beams passing the substrate. Understanding how the polarization of laser-beams is altered when transmitting through TMs is thus an important aspect in the selection of substrates as well as the calibration of gravitational-wave detectors and should be taken seriously into account for any future detector striving to even greater sensitivities.
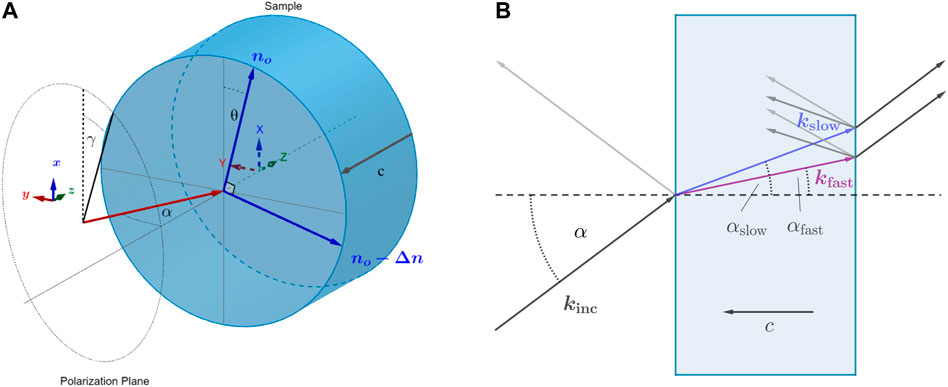
FIGURE 2. (A): reference-frame for the numerical tool. The ray (red) enters the sapphire sample with AOI = α in z-direction, while the orientation of the two separated axes perpendicular to the c-axis is given by θ. The input polarization is described with γ, governing the direction of the input electric-field vector. The global reference direction is given by the x-axis. (B): ray-doubling in birefringent media.
In this paper, a tool will be presented to calculate the impact of internal-stress and changes in indicatrix-orientation on the polarization of rays passing large mirror-substrates using the NumPy and SymPy packages in Python. The theoretical concept of this tool is based on the chapters 10, 19 and 21 of the book “Polarized Light and Optical Systems” by Chipman et al. (2018) where the algorithm is explained in much greater detail. In Section 2, I will thus first give a brief overview of the calculus before the specific case of sapphire substrates in KAGRA is discussed. In Section 3, then, I will present calculation results using the ray-tracing tool from Section 2 to show dependencies of the polarization-impact on stress-induced birefringence and indicatrix alignment for the sapphire substrate as used by KAGRA. Possible impacts of the polarization changes on the sensitivity in gravitational-wave detectors and ray-doubling in KAGRA ITMs will be discussed in Section 4.
2 Theoretical Concept of Polarization Ray-Tracing
In an uniaxial crystal like sapphire, we usually distinguish between an optical axis, denoted as extraordinary, or e, and ordinary axes, o, perpendicular to e. Along e, we find a different refraction index than for o which can be larger (positive crystal) or smaller (negative crystal). If we introduce a stress-tensor affecting the crystal, then generally we have to assume that among axes in o a splitting of the refraction index appears, changing the uniaxial crystal to become basically a biaxial crystal with three refraction indexes along three independent directions. However, unlike pure biaxial crystals, the generation of refraction indexes becomes a function of the spatial vector r, due to the spatial distribution of stress. Hence, each point of the crystal under stress has its own unique indicatrix and needs to be treated individually. This is why a simplification of the problem cannot be done. Moreover, since the representation of the crystal changes to be biaxial, we distinguish a fast and a slow axis for each beam entering the crystal where the electric field experiences a refraction index which is either smaller or larger.
Each separate beam along the fast and along the slow axis represent the electric field’s eigenstate inside the crystal. An important aspect for polarization ray-tracing is therefore a proper description of the electric-field vector E since it defines the direction of polarization. In the general case, the field along the fast axis Efast and the field along the slow axis Eslow have different directions and need thus to be treated separately. As we are using a very general description in global coordinates, a utilization of Jones-vectors and matrices is not very effective and a more generalized calculus in three dimensions with, so called, P-matrices is applied (Chipman et al. (2018)). A P-matrix relates an incoming electric field with its outgoing counterpart of any system in the form
Each beam emerging from a system has its own P-matrix where all information about the emerging field are encoded in, inclusively transmission and reflection ratios. In the following, I will show how to construct a P-matrix in a general way before a description of biaxial systems with the presented calculus will be done.
2.1 Constructing P-Matrices
A very comprehensive description of how a P-matrix is derived for various cases can be found in the mentioned book by Chipman et al. (2018). Here, I will just give a brief overview of the construction.
When a plane-wave reaches an interface between two media, we can generally expect a splitting into 4 different waves: two in transmission and two in reflection. Each of them traveling in a different direction as they experience their own index of refraction. It is thus the refraction index n which firstly needs to be calculated for each refracted/reflected wave. On the other side, n appears as a function of k for each wave and vice versa. Thus, both parameter have to be derived simultaneously. From Maxwell’s equations, it is straightforward to show that in any medium
where ω is the angular frequency of the wave and c the speed of light in vacuum. The dielectric tensor ɛ, which relates the variation in refractive index with the polarization direction of the electric field inside a medium, can be written as (using local coordinates X,Y,Z)
with κ as the absorption index. Please refer to Figure 2 for a description of the reference frame. In Eq. 2, the influence of magnetic permeability has been omitted as it will not be of any concern for the issues to be discussed. We can further simplify Eq. 2 to
with the normalized vector
Consider now an intercept between two media 1 and 2, whereas we know the input wavevector k1 and refractive index n1. In order to find solutions for k2 and n2 one can use the generalized Snell’s law:
and the assumption that any k2 can be constructed from the normalized vectors
Once wavevectors and refraction indexes are known, the field vectors of both electric and magnetic field are calculated for slow and fast wave in refraction and reflection. By singular-value decomposition of the matrix-part in Eq. 4, one will then get the electric fields. The P-matrices, finally, can then be calculated by using the field- and Poynting-vectors of the incoming beam together with the transmission and reflection coefficients of each eigenstate (“1” and “2”) of the incoming field. In the following the coefficents are summarized into vectors, referring to them as t1, and t2. For a more detailed description how to calculate the coefficient matrices, see the Supplementary Appendix. Using i = (tf, ts, rf, rs) as index for each transmitted fast/slow ray (tf, ts) or reflected fast/slow ray (rf, rs), we can write (Chipman et al. (2018))
By changing into global coordinates, the ɛ-tensor needs to be rotated accordingly, but the general calculation scheme will not change.
2.2 Describing Stress-Induced Uniaxial Crystals
With the P-matrices at hand, we can describe a ray passing any medium of concern. The objective is, however, to do so in stress-induced media, and particular in sapphire. Sapphire is a variety of crystalline Al2O3 which crystallizes in a hexagonal lattice-structure. The oxygen anions are arranged in a (slightly distorted) hexagonal close-packing in which the aluminum cations occupy two thirds of the octahedral interstices (Zeidler et al. (2013); Dobrovinskaya et al. (2009)). Due to this, we can differentiate between a distinct axis along the hexagon (c-axis) and 3 axes perpendicular to the c-axis representing the 3 symmetry-directions of a hexagon’s barrel. In the following, we will consider that the sapphire is characterized by a spatially modulated birefringence perturbation superimposed to the constant intrinsic birefringence of the crystal which is given by no − ne = 0.008, with no ≈ 1.754 and ne ≈ 1.746 (Harris et al. (2017)), the refractive indexes of sapphire at 1064 nm wavelength.
Sapphire, as well as fused silica, are manufactured by cooling down a melt. During the cooling process, naturally temperature gradients within the material appear which lead to stress that is preserved in the material when it crystallizes (or solidifies). According to Dobrovinskaya et al. (2009), the typical amount of stress inside a sapphire bulk may range from 1 to 90 MPa (σmin and σmax), depending on the manufacturing process and whether or not annealing has been applied. In the given case of sapphire substrates for test-masses in KAGRA, the constraints on refraction index homogeneity are quite strict. Hence, I will assume an amount of residual stress with a mean
The components of this tensor are known in case of sapphire (Bradley (1963)) and by using the model of a deformed indicatrix which is projected on a plane, the following relation can obtained (see also Iwaki and Koizumi (1989)):
where we have used an eigenvalue decomposition of the projected indicatrix and the reasonable assumption that the stress-induced birefringence is weak (Δn ≪|no − ne|). Using the assumed distribution of the stress-tensor’s coefficients, we can derive an expectation of Δn to be
Without limiting generality, the (additional) birefringence Δn affects the middle component of ɛ only. As Δn is assumed small, the resulting polarization of a ray passing a medium with an ɛ-tensor as given in Eq. 9 will not change if the left component becomes
2.3 Numerical Implementation of the Code
The above given mathematics of polarization ray-tracing are relatively straightforward. Their implementation into a numerical code, however, can become quite complex, particularly if both refracted and reflected rays are to be tracked. The code that has been written for the here given problem uses the reference-frame as illustrated in Figure 2 and is accessible on GitHub (https://github.com/Zeidler-Akiyama/Birefringence). A ray entering the substrate is first described in global coordinates by its wavevector kinc and its electric-field vector Einc having a linear polarization. From the given ɛ-tensors for both substrate and incoming medium (again in global coordinates), kinc, and the intercept’s normal N, the refraction indexes for transmission and reflection are calculated using SymPy’s symbolic algebra system. Since the incoming medium is a vacuum, the index of refraction for the reflected ray does not need to be calculated this way. However, the algorithm is written with a general application in mind and will produce results for the reflected ray if desired. At the same time, the symbolic calculation procedure is the most time-consuming part, particularly when using SymPy’s “solve” algorithm with cross-checking enabled. Thus, if not explicitly needed, the calculation of the reflection should be omitted and reflection-symmetry used instead. Additionally, the input-parameters for the SymPy part are converted to rational numbers where possible to speed up the calculation process (see also 5).
Once n and k for each refracted ray is known, the set of homogeneous linear equations according to Eq. 4 is constructed and solved via singular value decomposition of the matrix-part which can be conveniently done in NumPy. Since each transmitted (or reflected) beam belongs to one of two possible eigenstates, we can expect that there is at least one zero singular-value with a corresponding singular-vector Ei (i = (tf, ts, rf, rs)) that marks the desired solution (only for degenerated n, two solutions will be produced corresponding to the S- and P-polarization states with respect to the intercept). From the eigenstates of the electric-field directions and the k-vectors, we can derive the magnetic-field eigenstates and further the Poynting vectors which are generally not parallel to k. The actual transmitted field in each eigenstate is calculated according to Eq. 7.
In general, this procedure needs to be done three times if we want to trace a beam going through the sample: for the incoming beam and for each fast/slow beam exiting the sample (see also Figure 3). For the exiting beams, however, the refraction indexes as well as k are given and do not need to be calculated. In reflection, we can further assume symmetry with the eigenstates already calculated. Thus, a convenient simplification can be made. Once the exiting ray’s fields are determined (there will be two), their phase-shift with respect to each other needs to be calculated. This can be done by deriving the optical-path length (OPL), given by
where li is the path-length of the energy-flux inside the sample which is defined by Si and the sample’s thickness. Both exiting rays are generally separated and a direct superposition is thus not applicable. However, a light-field in form of a laser, for instance, possesses a certain diameter which can be imagined as a manifold of parallel rays entering the sample. An existing ray of the, e.g, fast-mode will thus superpose with another ray’s exiting slow-mode which leads to a change in the ray’s polarization if both superposing fields are different in direction. In addition to the OPL, another phase-shift ϕ needs to be taken into account arriving from the initial separation of the two rays from which fast and slow mode will overlap upon exiting. This phase-shift may be calculated via
and used for either the fast ray or the slow ray exiting the sample.
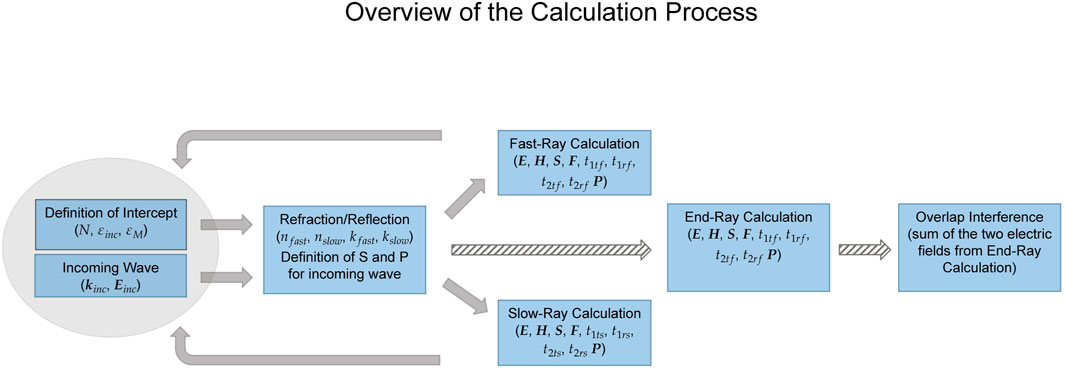
FIGURE 3. Process chart of the code-implementation. From the two initial settings of input-ray and intercept, the refraction indexes and wavevectors of refracted and reflected rays are calculated. The derivation of the field-vectors is separately done for the fast and slow solution and serves as input for the exit-intercept (for details regarding F, please refer to the Supplementary Appendix). From both fast and slow solution after the exit-intercept, the field-vectors are calculated (“end-ray calculation”) and their overlap interference determined.
3 Application of the Numerical Tool for Large Substrates
If we are going to analyze the polarization effects of birefringent sapphire samples, we would need an adequate way to present the results from the mere ray-trace. A possible solution can be a time-tracing of the resulting electric-field vector. The basic output of such a time-trace can be depicted from Figure 4, where a ray having an inclination of α = 1° in the x-y-plane is inserted into a sapphire sample having a thickness of 0.15 m with three different (linear) polarization directions (γ = 0° (S-polarized), 30°, and 60°), in case of Δn = 0 and Δn = 2.8 ⋅ 10–6, respectively. In both cases, an otherwise perfect crystal is given with axes orientation according to the left sketch in Figure 2 and θ = 0°. The tips of the exiting superposed field-vector as well as the incoming field-vector are subsequently drawn for a full 2π-cycle in the time-domain, whereas the two exiting fields are described with
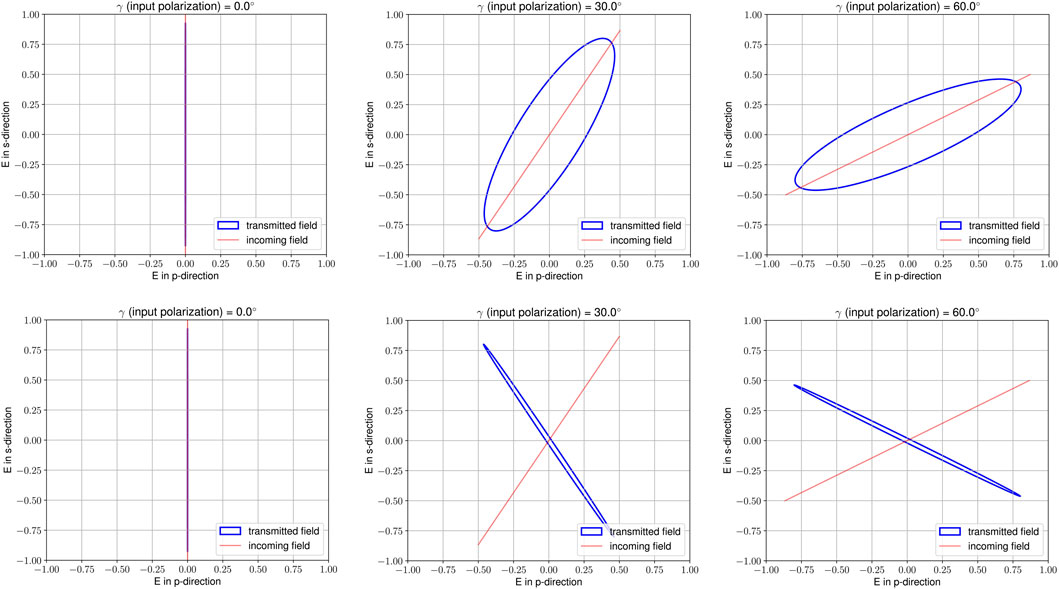
FIGURE 4. Effect of birefringence in a thick sapphire substrate for a beam entering it with 1° inclination and varying input polarization (γ = 0°, 30°, 60°). In the top row, the effect for Δn = 0 is given while the bottom row shows the effect for Δn = 2.8 ⋅ 10–6 (refer to Eq. 9).
Here, ϕ from Eq. 11 is used only for i = ts.
Unsurprisingly, a S-polarized beam will not experience any change by passing the substrate, regardless the birefringence or inclination angle as the transmitted field-component is only non-zero in x-direction which, according to Eq. 9, acts as the slow-ray due to the higher refraction index in case Δn ≠ 0. For any other input polarization, however, we see non-negligible deviations. The exiting beam will become elliptically polarized whether or not Δn is zero. That is foremost the effect of the inclination angle, due to which the passing beam experiences the refraction index ne to a certain extend even though Δn = 0. The birefringence changes the polarization in addition to the inclination, thus leading to a different ellipticity and orientation of the exiting field.
By changing the orientation of the birefringent crystal axes (θ ≠ 0°), we see that the exiting rays become prone to polarization changes even with zero inclination (Figure 5). The effect would be thus similar to a non-zero input polarization-angle γ (note, however, that the similarity ends once the inclination becomes non-zero too). In Figure 5, example figures for Δn = 2.8 ⋅ 10–6 at inclinations 0°, 1°, and 2° are shown for γ = 0° and θ = 20°. In all three cases, the linear polarization from the input-beam changes to an elliptic polarization after exiting.

FIGURE 5. Effect of birefringence in a thick sapphire substrate for a beam entering it with 0°, 1°, and 2° inclination (from left to right) and S input polarization. Δn has been set to 2.8 ⋅ 10–6 while θ = 20°.
All above examples have been calculated for a sample with thickness of 0.15 m, typical for a KAGRA ITM (Akutsu et al. (2019); Aso et al. (2013)). With such thicknesses, even a small birefringence as of the order 10–6 (which is already in the range of mere thermal inhomogeneities) can have a severe impact on the polarization. The left graph in Figure 6 pictures the ellipticity of the exiting field as a function of thickness d and birefringence (θ = 0°, γ = 45°). We can clearly observe a gradual decrease towards both increasing d and Δn, reaching 0 (circular polarized) for d ≈ 9 cm and Δn = 3 ⋅ 10–6 and subsequently increasing again (by flipping orientation of the ellipse). The right graph in the same figure shows the effect of a changing θ-angle with d = 0.15 m.
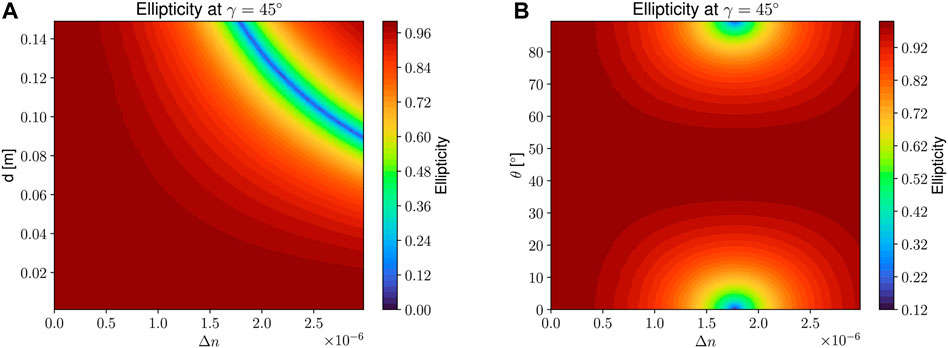
FIGURE 6. Ellipticity of the exiting field as a function of sample-thickness and Δn (A), and θ and Δn (B), respectively. The input polarization is linear with γ = 45° and α = 0° inclination.
As can be observed from Figures 5, 6, an important parameter for the question whether or not polarization-changes occur is the orientation of the birefringence and hence the θ-angle (or, more generally, the ɛ-tensor). As will be presented in an upcoming paper, measurements with a polariscope on spare ITMs show a θ-angle distribution ranging from 3 ∼ 88°. Hence, it can be assumed that the ellipticity-map in Figure 6 presents a realistic image of the distribution of ellipticity in any of such large substrates.
Another important parameter is the orientation of the c-axis inside the crystal. Up to this point, the c-axis has been assumed to be normal to the (non-wedged) input intercept. It is however exactly this parameter which is hard to control in large sapphire substrates. Accuracy margins given by manufacturers are typically of the order 0.5°. Within this order the ellipticity can change over more than a cycle (from 1 to 0 and back to 1) even though Δn = 0, as can be observed from Figure 7. Additionally, in this figure, the orientation of the ellipse is given as an overlying stream-line plot. As already mentioned, the minimum across the graph marks the turning-point where the exiting field’s polarization becomes perpendicular to the incoming field. In the same figure on the right-side, the ellipticity-plot for varying θ as from Figure 6 is shown again but together with the respective stream-line plot of the orientation.
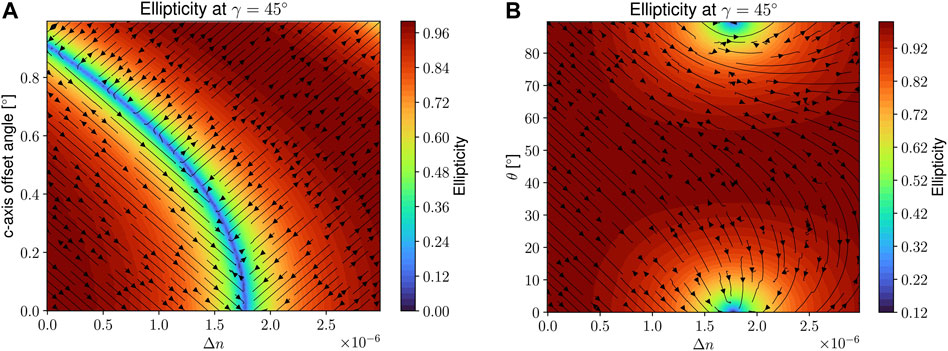
FIGURE 7. Ellipticity and ellipse-orientation plots as a function of an offset-angle between c-axis and surface-normal (A) and θ for different Δn. The (B) plot’s ellipticity graph is the same as in Figure 6. In both graphs, γ is set to 45° while α = 0°.
4 Impacts on Gravitational-Wave Detectors
In the preceding section, the principal effects on the polarization of a transmitted beam through thick sapphire crystals have been presented. The most obvious observation up to this point is the non-negligible influence of even slight distortions in the crystal properties on the resulting electric-field. The main question for gravitational-wave detectors, however, is how much do these effects impact the sensitivity using a realistic ITM model.
Any change of the desired polarization will in principle affect the power that cycles inside the cavities due to coating design of the mirrors. That eventually leads to contrast losses at the detector-port due to imperfections in the interference fringes. The dependence of these imperfections on Δn can be estimated after Winkler et al. (1991) to
where Pmin and Pmax are the power of the dark- and the bright-port, respectively, and d the ITM thickness. Given the constraints for KAGRA (contrast:

FIGURE 8. Result of polarization ray-tracing with a Gaussian beam as input (λ = 1064 nm, waist: 50 μm at z = 0.5 m). Shown are 25 rays as representative of the passing Gaussian wavefront through a substrate with 0.5° c-axis misalignment in y-z-plane (A): 3D illustration of the process; (B): situation of the exited field in 1 m distance; (C): same as center but without c-axis misalignment)).
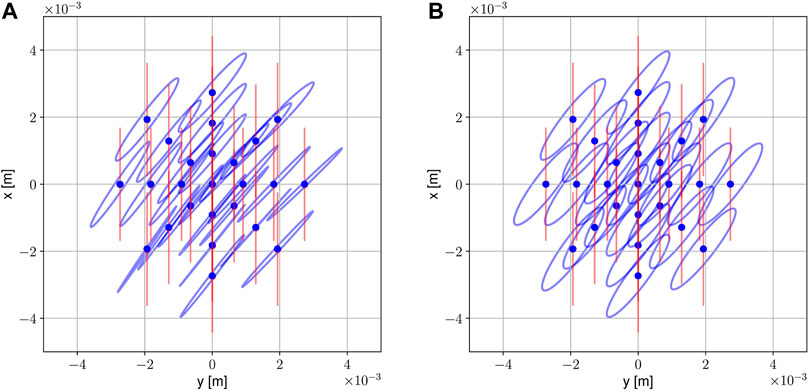
FIGURE 9. Same as Figure 8 but with θ = 20°. The (A) graph shows the situation with c-axis inclination of 0.5° in the y-z-plane while the (B) is a reference for zero c-axis inclination.
Up to this point, three different aspects influencing a beam’s polarization have been discussed: the expectation on Δn, the variance in θ, and the misalignment of the c-axis. Another important point, however, is the non-parallelism of the input and output surfaces, where “input” means facing the beam-splitter in a laser-interferometer and “output” means facing the cavity. The input surface possesses a wedge (
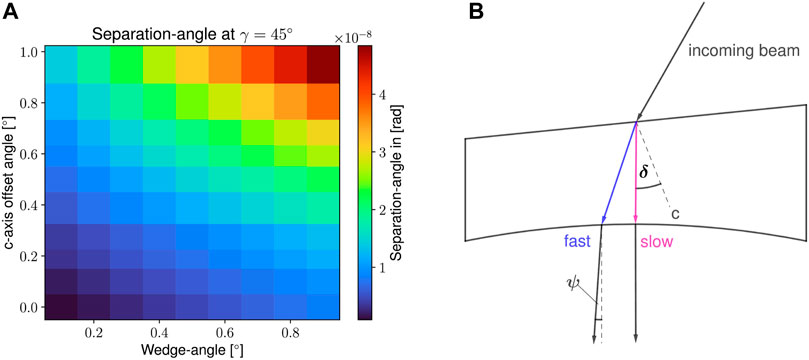
FIGURE 10. (A): distribution of the separation-angle ψ as a function of c-axis misalignment and input wedge-angle. (B): sketch of a wedged ITM (not to scale) with passing beam. The beam is split into a fast and a slow part whereas the slow part refracts perfectly in cavity-direction (curved surface) and the fast part exits with a separation-angle ψ.
5 Conclusion
In this paper, a numerical tool has been presented for polarization-sensitive ray-tracing inside large birefringent media used in current gravitational-wave detectors like KAGRA. The tool is completely written in Python (version 3.8) and can be thus easily applied on any modern PC. While its main scope is the utilization in research and development for the construction of gravitational-wave detectors, the code is general enough to work for any other application in science or education. As indicated in the previous section, the code generates results which are comparable with those calculated analytically (if applicable) and hence can be used with confidence. Current limitations, however, appear wherever the numerical implementation becomes difficult. That is particular the case for problems where a precise floating-point representation of parameter values does not exist whereas precision is of utmost importance. In such cases, numerical errors appear which affect the result. Since the SymPy-solver relies on the correct transcription between floating-point numbers and its symbolic algebra, also fake-solutions or simply no solutions at all are likely to happen. Applying its internal cross-check algorithm helps in most cases but can become extremely time-consuming for solutions of n requiring precision beyond the ppm scale. Currently, there is a plan to involve other symbolic languages like “SAGE” or “symengine” for which Python-wrappers exist but meanwhile only SymPy is used for this task. The use of floating-point numbers does also lead to numerical errors which appears through their limiting accuracy. In basically all calculation steps double-float numbers (64 Bit) are used for which a limiting accuracy (round-error) of
For gravitational-wave detectors like LIGO, Virgo or KAGRA, the here presented tool can in any case support the evaluation of polarization effects and hence could give insights in how the sensitivity will develop when in operation, which may thus help understanding possible issues in the beam reflected from the cavities. As of now, however, the impact of a laser beam with inhomogeneous polarization on the sensitivity of the detector is a matter of ongoing investigation and cannot be discussed in details here. In KAGRA, particularly, the utilization of sapphire is a core-feature due its remarkable thermal properties at low temperatures. On the other side, we see the difficulties in sapphire’s optical behavior as birefringent crystal when assuming realistic conditions. The large thickness of ITMs is a key-aspect in this regard but not the only one. In fact, given the beam-radius at an ITM in KAGRA (∼ 35 mm), we could minimize polarization effects if the substrate is chosen so that the most homogeneous distribution in Δn and θ is in its center, and that θ is aligned with the incoming polarization. That, however, requires knowledge on both Δn and θ in advance which is currently not measured as standard. A forthcoming paper on this problem is currently being written and expected to be published in the near future.
KAGRA has been chosen in this work as a prime example since it uses sapphire as TM material which is inherently birefringent and prone to affect the polarization of transmitting light. However, as mentioned in the introduction, even optical isotropic materials like silica can become anisotropic if internal stress resides which is likely the case given its manufacturing procedure. We can expect, however, that the stress is one order of magnitude smaller than for sapphire (evaluated from own unpublished data) so that the issue may not be urgent for LIGO or Virgo. With the dawn of the next generation gravitational-wave detectors like Einstein-Telescope or Cosmic-Explorer, however, the optical properties of mirror substrates will become an issue for which research in improving the material’s properties is mandatory, and for which this work is supposed to contribute.
Data Availability Statement
The original contributions presented in the study are included in the article/Supplementary Materials, further inquiries can be directed to the corresponding author.
Author Contributions
SZ: Writing code, doing the analysis and writing the paper.
Conflict of Interest
The author declares that the research was conducted in the absence of any commercial or financial relationships that could be construed as a potential conflict of interest.
Publisher’s Note
All claims expressed in this article are solely those of the authors and do not necessarily represent those of their affiliated organizations, or those of the publisher, the editors and the reviewers. Any product that may be evaluated in this article, or claim that may be made by its manufacturer, is not guaranteed or endorsed by the publisher.
Supplementary Material
The Supplementary Material for this article can be found online at: https://www.frontiersin.org/articles/10.3389/fspas.2022.881348/full#supplementary-material
References
Aasi, J., Abbott, B. P., Abbott, R., Abbott, T., Abernathy, M. R., and Ackley, K.The LIGO Scientific Collaboration (2015). Advanced LIGO. Class. Quantum Gravity 32, 074001. doi:10.1088/0264-9381/32/7/074001
Abbott, B. P., Abbott, R., Abbott, T. D., Abernathy, M. R., Acernese, F., Ackley, K., et al. (2016). Observation of Gravitational Waves from a Binary Black Hole Merger. Phys. Rev. Lett. 116, 061102. doi:10.1103/PhysRevLett.116.061102
Acernese, F., Agathos, M., Agatsuma, K., Aisa, D., Allemandou, N., Allocca, A., et al. (2015). Advanced Virgo: a Second-Generation Interferometric Gravitational Wave Detector. Class. Quantum Gravity 32.
Akutsu, T., Ando, M., Arai, K., Arai, Y., Araki, S., Araya, A., et al. (2019). Kagra: 2.5 Generation Interferometric Gravitational Wave Detector. Nat. Astron 3, 35–40. doi:10.1038/s41550-018-0658-y
Akutsu, T., Ando, M., Arai, K., Arai, Y., Araki, S., Araya, A., et al. (2020). Overview of Kagra: Detector Design and Construction History. Prog. Theor. Exp. Phys. 2021, 05A101. doi:10.1093/ptep/ptaa125.05A101
Aso, Y., Michimura, Y., Somiya, K., Ando, M., Miyakawa, O., Sekiguchi, T., et al. (2013). Interferometer Design of the Kagra Gravitational Wave Detector. Phys. Rev. D. 88, 043007. doi:10.1103/physrevd.88.043007
Aso, Y., Michimura, Y., and Somiya, K. (2014). KAGRA Main Interferometer Design Document. Tech. Rep.
Bailes, M., Berger, B. K., Brady, P. R., Branchesi, M., Danzmann, K., Evans, M., et al. (2021). Gravitational-wave Physics and Astronomy in the 2020s and 2030s. Nat. Rev. Phys. 3, 344–366. doi:10.1038/s42254-021-00303-8
Bradley, D. L. (1963). Photoelastic Constants of Synthetic Sapphire. Master’s thesis (East Lansing, Michigan: Michigan State University).
Chipman, R. A., Lam, W.-S. T., and Young, G. (2018). Polarized Light and Optical Systems. Boca Raton, Florida, USA: CRC Press.
Dobrovinskaya, E. R., Lytvynov, L. A., and Valerian, P. (2009). Sapphire - Material, Manufacturing, Applications. Berlin, Germany: Springer.
Harris, D. C., Johnson, L. F., Cambrea, L., Baldwin, L., Baronowski, M., Zelmon, D. E., et al. (2017). Refractive Index of Infrared-Transparent Polycrystalline Alumina. Opt. Eng. 56, 077103. doi:10.1117/1.oe.56.7.077103
Iwaki, T., and Koizumi, T. (1989). Stress-optic Law in a Single Crystal and its Application to Photo-Anisotropic Elasticity. Exp. Mech. 29, 295–299. doi:10.1007/BF02321411
Kalogera, V., Sathyaprakash, B., Bailes, M., Bizouard, M.-A., Buonanno, A., Burrows, A., et al. (2021). The Next Generation Global Gravitational Wave Observatory: The Science Book. arXiv Prepr. arXiv:2111.06990.
Martynov, D. V., Hall, E. D., Abbott, B. P., Abbott, R., Abbott, T. D., Adams, C., et al. (2016). The Sensitivity of the Advanced Ligo Detectors at the Beginning of Gravitational Wave Astronomy. Phys. Rev. D. 93, 112004. doi:10.1103/PhysRevD.93.112004
Nye, J. F. (1985). Physical Properties of Crystals: Their Representation by Tensors and Matrices. Oxford, UK: Oxford University Press.
P. R. Saulson (Editor) (1994). Fundamentals of Interferometric Gravitational Wave Detectors. 1 edn (Singapore: World Scientific).
Tokunari, M., Saito, T., Miyoki, S., Ohashi, M., and Kuroda, K. (2010). Optical Properties Measurement of an Al 2 O 3 Mirror Substrate for the Large-Scale Cryogenic Gravitational Wave Telescope (LCGT). Cl. Quantum Grav. 27, 185015. doi:10.1088/0264-9381/27/18/185015
Winkler, W., Danzmann, K., Rüdiger, A., and Schilling, R. (1991). Heating by Optical Absorption and the Performance of Interferometric Gravitational-Wave Detectors. Phys. Rev. A 44, 7022–7036. doi:10.1103/physreva.44.7022
Keywords: numerical analysis, gravitational-wave detector, sapphire, birefringence, optic
Citation: Zeidler S (2022) Numerical Tool for Calculating Birefringence in Mirror-Substrates for Gravitational-Wave Detectors. Front. Astron. Space Sci. 9:881348. doi: 10.3389/fspas.2022.881348
Received: 22 February 2022; Accepted: 05 May 2022;
Published: 23 June 2022.
Edited by:
Matteo Montani, University of Urbino Carlo Bo, ItalyReviewed by:
Jonathan W. Arenberg, Northrop Grumman, United StatesMihai Bondarescu, University of Mississippi, United States
Copyright © 2022 Zeidler. This is an open-access article distributed under the terms of the Creative Commons Attribution License (CC BY). The use, distribution or reproduction in other forums is permitted, provided the original author(s) and the copyright owner(s) are credited and that the original publication in this journal is cited, in accordance with accepted academic practice. No use, distribution or reproduction is permitted which does not comply with these terms.
*Correspondence: Simon Zeidler, cy56ZWlkbGVyQHJpa2t5by5hYy5qcA==
 Simon Zeidler