- 1Centre for mathematical Plasma Astrophysics, KU Leuven, Leuven, Belgium
- 2School of Physics and Astronomy, Yunnan University, Kunming, China
- 3DIFFER, TU/e Science Park, Eindhoven, Netherlands
Exploiting the general dispersion relation describing all waves in an ideal ion-electron fluid, we revisit established treatments on wave families in a cold ion-electron plasma. These contain the magnetohydrodynamic Alfvén and fast waves at low frequencies, long wavelengths, but are enriched by short wavelength resonance behaviors, electrostatic and electromagnetic mode types, and cut-off frequencies distinguishing propagating from evanescent waves. Our theoretical treatment exploits purely polynomial expressions, which for the cold ion-electron case only depend on 2 parameters: the ratio of masses over charges μ and the ratio E of the electron gyro frequency to the combined ion-electron plasma frequency. We provide a complete description of all waves, which stresses the intricate variation of all five branches of eigenfrequencies ω(k, ϑ) depending on wavenumber k and angle ϑ between wavevector and magnetic field B. Corresponding 5-mode phase and group diagrams provide insight on wave transformations and energy transport. Special cases, like the high frequency modes in magneto-ionic theory following from Appleton-Hartree dispersion relations, are naturally recovered and critically discussed. Faraday rotation for electromagnetic waves is extended to all propagation angles ϑ. The discussion covers all cold ion-electron plasma waves, up into the relativistic regime.
1. Introduction
The theory of wave propagation in ion-electron plasmas is covered in many textbooks (Stix, 1992; Boyd and Sanderson, 2003; Bittencourt, 2004; Chen, 2016; Thorne and Blandford, 2017), and can be considered established. The starting point for many treatments is based on a 2-fluid approach, where one solves for plane wave solutions exp[i(k·x − ωt)] in an otherwise homogeneous medium, usually magnetized with uniform magnetic field B. In the rest frame of a homogeneous ion-electron mixture, assumed to be charge-neutral such that number densities obey ne = Zni when ions have charge number Z, the equilibrium electric field and current vanish, while each species has its own pressure pe, pi. The dispersion relation between wave frequency ω and wavenumber k = ∣k∣ is then usually obtained from linearizing the Maxwell equations, traditionally introducing dielectric, susceptibility and conductivity tensors, to quantify displacement vector, polarization vector and current vector relations to the electric field, respectively. In general, this leaves a large variety of wave modes that are particularly aware of the orientation angle ϑ between wavevector k and the magnetic field B, while the wave properties can differ greatly according to frequency and wavelength. Indeed, when we have electron and ion masses given by me and mi, the plasma is characterized by its ratio of masses over charges μ = Zme/mi, and this background ion-electron mixture introduces its own set of typical frequencies and wavelengths. The former include the electron and ion plasma frequencies and and the electron and ion cyclotron frequencies Ωe = eB/me (where electron charge is −e) and Ωi = μΩe. Lenghscales relate to typical speeds in the system, such as the light speed and the electron and ion sound speeds. One such lengthscale is the skin depth δ = c/ωp, where it turns out convenient to combine the plasma frequencies into . The governing dispersion relation equally follows (e.g., Goedbloed and Poedts, 2004) from a standard linearization of the governing equations of motion for each species, combined with Maxwell equations. We will in what follows rewrite and analyse this general form of the dispersion relation, but specify deliberately to the cold ion-electron case, where the species pressures (and sound speeds) vanish pe = 0 = pi. We can normalize all frequencies to the plasma frequency , and for such cold ion-electron plasma, only two dimensionless parameters remain in the description, namely
That only two parameters cover the full complexity of wave modes in a cold ion-electron plasma is well-known, and is at the basis of the classical Clemmow-Mullaly-Allis plots that feature in most textbooks (Stix, 1992; Bittencourt, 2004; Thorne and Blandford, 2017), which classify wave modes and associated wave normal surfaces (plots of ω/k vs. ϑ, which are figures of revolution about B). In what follows, we will discuss all wave modes and suggest a new classification scheme based on the polynomial form of the governing dispersion relation. That the ideal two-fluid description leads to a 12th order polynomial in the wave frequency ω is well-known (Denisse and Delcroix, 1961), although one frequently exploits lower order polynomials to cover e.g., only the high frequency electromagnetic waves (following e.g., the Appleton-Hartree description), or conversely focuses on the three low frequency branches that relate to the magnetohydrodynamic (MHD) slow, Alfvén and fast mode pairs (Stringer, 1963; Ishida et al., 2005; Damiano et al., 2009; Bellan, 2012; Zhao, 2015). An eight order polynomial approximation, valid above the lower hybrid frequency, was exploited in Zhao (2017) to cover whistler waves and the three high frequency electromagnetic mode pairs. We will instead start from the full 12th order equation, only making the cold plasma assumption, such that the slow MHD modes become marginal solutions ω2 = 0. We make contact with the mentioned textbook treatments, showing how the usual dielectric tensor treatments are indeed mathematically fully equivalent. The advantage of the polynomial method over the dielectric tensor method is the direct relationship of the solutions of the dispersion equation to the primitive two-fluid variables, which would also be exploited in corresponding numerical time stepping codes. This advantage was also pointed out by Bellan (2012), who gave a similar analysis for the low frequency domain. The present paper exploits the polynomial method to full effect to provide the crucial phase and groups diagrams for all values of the parameters, together with their animations.
2. Dispersion Relation For Cold Ion-Electron Plasmas
Following Goedbloed and Poedts (2004), the general dispersion relation for an ideal ion-electron fluid can be written as a twelfth-order polynomial in , where one distinguishes six pairs of forward and backward propagating modes, since the expression is actually sixth order in . This already eliminated a pair of marginal entropy-like modes, and the special case of a cold ion-electron fluid can factor out another solution, corresponding to the slow magnetohydrodynamic (backward and forward) waves. It is a matter of algebra to show that the remaining 10th order polynomial can be rewritten to
where , λ2 = cos2ϑ, containing three 3rd order polynomials in given by
Unlike most textbook treatments, which take Equation (2) at fixed frequency and solve for both roots in , we will consider a given wavenumber , and use the dispersion relation to quantify all five roots in . In what follows, we will also systematically drop the overbars on and , as we will always work with dimensionless frequencies and wavenumbers.
2.1. Cut-Off Frequencies
Cut-off frequencies relate to large wavelength (small wavenumber k) limiting behavior, and Equation (2) reveals instantly that special frequencies then follow from the zeros of the polynomial. These are computed simply as
Hence, the cutoff happens exactly at the combined plasma frequency (this reads as when restoring dimensions). The latter pair distinguishes the upper (+) from the lower (−) cut-off frequency. For E = 0, the three cut-offs coincide at the plasma frequency (noting that I = μE).
In general, the three cut-off frequencies are independent of the angle ϑ, but their relative ordering is influenced by the values of both parameters E, I or equivalently, E and μ. Since μ is normally considered fixed in a specific plasma (e.g., it assumes the value μ ≈ 1/1, 836 in a fully ionized hydrogen plasma), the magnetic field strength in essence determines the other parameter E, going from unmagnetized E = 0 cases, to strongly magnetized regimes E → ∞. A special case is obtained for an electron-positron or pair plasma where μ = 1, when coincide to (Keppens and Goedbloed, in press). For an arbitrary μ, it is clear that (and the equality holds for the unmagnetized case E = 0), but the lower cut-off may be below, equal to, or above unity. The equality of with corresponds to the specific field strength where E = 1/μ − 1. A plot of the three cut-off frequencies for a μ = 1/1, 836 hydrogen plasma vs. E is shown in Figure 1. The vertical dashed lines indicate special values for E, e.g., where E = 1/μ − 1, where the ordering of the three cut-offs changes. The right panel in Figure 1 shows a zoom on the behavior near this value. The above exact expressions for the cut-off frequencies, valid for all values of E, can also be used to get approximate expressions in limits of small or large E regimes. Obviously, the small E limit makes all cut-offs approach their unmagnetized regime: all 3 become the plasma frequency. The opposite, large E limit is easily evaluated to give as upper and lower cut-off (both way above the third cut-off at plasma frequency):
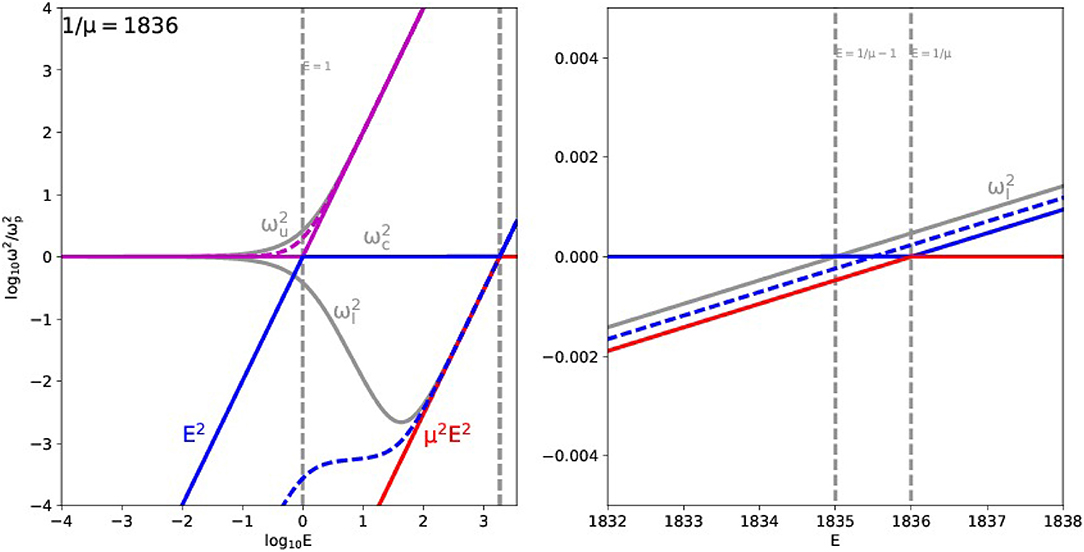
Figure 1. Cut-off frequencies and resonance frequencies ordering for given μ, as function of E. The right panel is a zoom on the behavior near E = 1/μ. Note the horizontal logarithmic scale for E-values in the left (weakly magnetized plasma), vs. a linear scale in the right panel (strongly magnetized). The upper and lower cut-offs are plotted as gray solid lines (the is the middle horizontal line). The vertical dashed gray lines indicate the special values E = 1, E = 1/μ − 1 and E = 1/μ. For each E value, the three colored (purple, blue and red) curve pairs indicate resonance ranges, where parallel propagation corresponds to the solid line, and perpendicular to the dashed line. The red range reaches its perpendicular limit at zero frequency, hence no dashed red line appears.
2.2. Resonances
Resonances occur at large wavenumbers (short wavelengths), and Equation (2) shows that then the zeros of Ā come into play. The three resonances obtained from Ā = 0 can be computed using standard root-finding for polynomial expressions (or, could be explicitly obtained through Cardano's formulae for the roots of a third order polynomial). For a given set of parameters (E, I) or (E, μ), the 3 resonances still depend on the orientation angle ϑ. The exact variation of the three resonances at any (ϑ, E, μ) requires to compute the three roots from
For each of the three resonances, we typically find monotonic behavior ω(ϑ) between the extremal angles of parallel to perpendicular orientation. Figure 1 also shows the range in values obtained for the three resonances, for the same fixed value of μ = 1/1, 836, as function of the remaining E parameter. Three different colors indicate the three resonance ranges. The top (purple) one is seen to stay above unity, and stays between the upper cut-off and E2 for large E. This purple resonance range always shows increasing frequencies when going from parallel (solid) to perpendicular (dashed) behavior. The middle (blue) range is bounded from above by E2, and stays below unity until we reach the value, which lies in between the dotted lines shown at E = 1/μ − 1 and E = 1/μ (right panel). Ultimately, its range becomes bounded by the μ2E2 curve. This blue resonance will relate to the fast magnetosonic wave branch. The lowest resonance range (red) always stays below the μ2E2 line and below unity. In fact, this resonance range extends all the way to zero at exactly perpendicular orientation, and will be shown to relate to the Alfvén branch.
We can get approximate expressions for the three resonances by setting μ = 0 (which is unphysical, but is at the basis of the often used Appleton-Hartree dispersion relation, see section 5.3). We then obtain one solution at zero frequency (which will relate to the red or Alfvén branch), and the purple and blue resonances become
Note that setting μ = 0 eliminates the (normalized) ion cyclotron frequency I from the description.
The plots for the general μ≠0 case in Figure 1 reveal how the red resonance range actually always decreases in frequency, with angle going from parallel to perpendicular, while the purple one is always increasing in frequency, going from parallel to perpendicular orientations. The blue resonance range on the other hand first decreases in frequency, up to the value . From then on, the blue range increases in frequency from parallel to perpendicular. The dashed (perpendicular) and solid (parallel) limits are easily obtained analytically, since
The solutions to the perpendicular (λ = 0) case are thus threefold: one at zero frequency, related to non-propagation of Alfvén waves perpendicular to the magnetic field, the other two solutions from ω4 − (1 + E2 + I2)ω2 + (1 + EI)EI = 0 are known as the upper and lower hybrid resonance, given by our purple and blue dashed lines in Figure 1, respectively. These upper and lower hybrid resonances are thus generally given by
Their limits for low magnetization (E ≪ 1) become 1 and 0, as the electrostatic mode remains and the fast mode becomes marginal (see further). In the limit of high magnetization (E ≫ 1), we find that while .
It can be noted that for the pair plasma case where μ = 1, the above discussion of resonances and cut-offs simplifies significantly: e.g., the blue resonance range collapses on the curve E2. Also, for a pair plasma, the purple resonance range extends (at exactly perpendicular propagation) to the upper cut-off value (Keppens and Goedbloed, in press).
2.3. Low and High Frequency Limits
The dispersion relation Equation (2) also shows clearly the limits at both high and low frequencies, where the plane wave phase speed vph = ω/k attains a finite value. At high frequencies, we find that we obtain a double-valued solution at light speed behavior, as we can instantly write this limit as
Hence, we expect two solutions that will behave as electromagnetic waves at high frequencies. These high frequency solutions, together with a finite phase speed, require large wavenumbers. Hence, together with the three resonances that occur at large wavenumbers, these two will serve to organize the 5 solution branches.
At low frequencies, we similarly retrieve the following solutions
These are actually fast (F) and Alfvén (A) waves, at least at large wavelengths (required to make the phase speed finite at low frequencies). Hence, they will augment the 3 cut-offs to organize the 5 solution branches. The combination EI/(1 + EI) can be recognized as the relativistically correct expression for the Alfvén speed vA. This speed is more commonly written in terms of the magnetization parameter where ρ = neme + nimi and the specific enthalpy h = 1 for a cold plasma, and we get (temporarily restoring dimensions):
3. Dispersion Diagrams
We will now analyse dispersion diagrams, which are obtained as solutions ω2(k, ϑ) to the general dispersion relation. We first fix a parameter set (E, μ). Then, at fixed wavenumber and orientation, Equation (2) is a polynomial of degree 5 in ω2, and due to the symmetry of the underlying determinant (Goedbloed and Poedts, Keppens and Goedbloed, 2004), there will always be five real solutions. We will first address the special orientations of parallel and perpendicular propagation. We plot in Figure 2 two dispersion diagrams, one for parallel (left) and one for perpendicular (right) orientation, for the choice where μ = 1/1, 836 and E = 1.5.
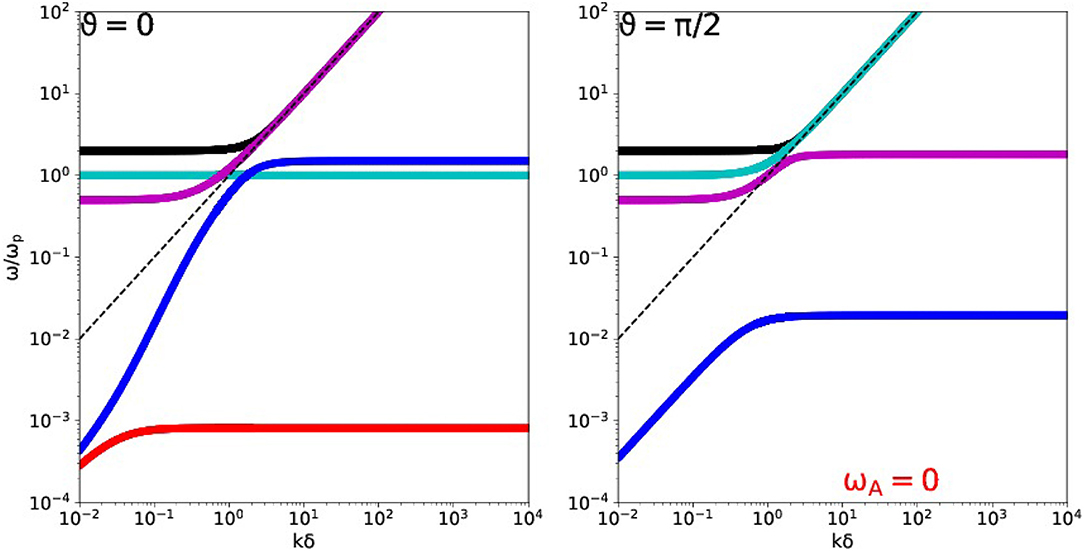
Figure 2. Dispersion diagram for a hydrogen ion-electron plasma at E = 1.5. Shown are the 5 branches at parallel (Left) and perpendicular (Right) propagation. The dashed black line corresponds to light speed behavior.
3.1. Parallel Propagation
A first observation we can directly make from Equation (2) is that parallel propagation (λ = 1) can always factor out the solution ω2 = 1, since . This solution is also retained at all angles when E = 0, where it actually represents the electrostatic mode, which is a non-propagating plasma oscillation. We will find that E≠0 cases will turn this mode into a propagating solution, for all angles away from parallel.
The other 4 pairs in Equation (2) for λ = 1 are intricately mixed, but it is possible to write the remaining 8th order expression as
Note that |E − I| = (1 − μ)E as μ ≤ 1, and in the case of a pair plasma (μ = 1), this leads to a full factorization of all solution branches (Keppens and Goedbloed, in press). However, for μ≠1, Equation (19) does not seem to offer real advantage, since the original formulation was already a 4th order polynomial in ω2, and its four solution pairs , , and retain their meaning as forward and backward propagating mode pairs. Instead, both factors in Equation (19) mix forward and backward pairs: if ωi is solution to its first factor, −ωi will be a solution to its second factor. Still, many textbook treatments in fact rely on the factorization in Equation (19). This, as we will discuss further on, implies a description in left and right circularly polarized waves, and indeed left and right circular polarizations switch roles when going forward or backward in time, or under mirror symmetry (see also Keppens and Demaerel, 2016). It is important to note that the forward-backward means of categorizing the solutions is fully consistent with combined PT symmetry, i.e., flipping the time direction and mirroring space.
We rather use the original Equation (2) to compute at which k-values any of the other 4 branches intersects with the ω2 = 1 solution. This will prove useful when we vary the orientation angle ϑ away from parallel, as we will show further on: these k-values are special as they correspond to those locations where we will first witness avoided crossings of branches. This turns out to be at values
Of course, only positive values need to be considered for k2. A careful analysis of Equation (20) shows that only one sign combination is positive as long as E < 1, and hence in such cases only one other branch will intersect the ω2 = 1 range (e.g., see Figure 2 for E = 0.5, left panel: in this case, the cyan and purple branch cross). However, both sign combinations are positive for 1 < E < 1/μ − 1, implying that two branches intersect the ω2 = 1 branch (e.g., see Figure 2 for E = 1.5, left panel: here we find a crossing between the cyan and both purple and blue branches). Further one positive value (i.e., one intersection) follows in the narrow range 1/μ − 1 < E < 1/μ, and both sign combinations are positive when 1/μ < E, leading again to two crossings of the ω2 = 1 branch. When E > 1/μ, the branches crossing ω2 = 1 are actually the fast (blue) and Alfvén (red) branch, instead of the purple and blue branch found in Figure 2 (for E = 1.5, left panel). In the limit E → ∞, both sign combinations in Equation (20) lead to k2 = 1, since then the fast and Alfvén branch essentially coincide, as seen from Equations (16–17). Note that the pair plasma case is again naturally contained as a special case where E = I. Knowing explicitly the special k-values where branches cross at parallel orientation is also especially useful when wanting to quantify the full phase and group speed variations for all branches, as done in section 4: the phase and group diagrams display intricate wave exchange occuring at these wavenumbers.
3.2. Perpendicular Propagation
At perpendicular propagation (λ = 0), one marginal frequency pair ω2 = 0 is contained in Equation (2), and this mode relates to the long wavelength Alfvén waves, which do not propagate perpendicular to the magnetic field. Another solution at perpendicular propagation is found to be ω2 − 1 − k2 = 0. Indeed, for λ = 0, we can factor Equation (2) into
In the special case of a pair plasma (E = I), a complete factorization can be obtained, as the final term then becomes (ω2 − 1 − E2)(ω4 − ω2(1 + E2 + k2) + k2E2). The latter term also factorizes in the unphysical limit where μ = 0, making I = 0 (see further on in section 5.3), which makes the 6th order term write as ω2(ω4 − ω2(2 + E2 + k2) + 1 + k2(1 + E2)). The branch ω2 − 1 − k2 = 0 is in plasma physics referred to as the ‘ordinary’ or O mode. The three solutions mixed up in the 6th order term are collectively named ‘extraordinary’ or E (or X, depending on the textbook at hand). In line with this terminology, and acknowledging the fact that one of these three solutions will be a high frequency electromagnetic wave, we will use the label ωX (and the black color) for its highest frequency solution, and call ωO (in cyan color) the mode that relates to the ω2 = 1 + k2 branch.
Figure 2, right panel, shows the 5 solution branches for perpendicular propagation, for a hydrogen plasma case where E = 1.5. The marginal (red) Alfvén-related branch is mentioned in the figure for completeness. The ordinary mode ω2 − 1 − k2 = 0 branch (cyan) starts horizontally at unit normalized frequency and goes up like ∝ k2. Direct comparison with its parallel counterpart (right panel) shows how the (purple and cyan) branches have changed connectivity between their long wavelength vs. short wavelength behavior. This is due to avoided crossings, that show up in oblique orientations, which we discuss next.
3.3. Oblique Orientations
At any orientation different from parallel or perpendicular, we must resort to numerical evaluation of the 5 roots in Equation (2), which is rather straightforward. Figure 3 shows this for two representative angles for the case with (E, μ) = (1.5, 1/1, 836). Its left panel took a very small angle ϑ = 0.001, while the right panel has ϑ = π/3. Comparison with Figure 2 shows that oblique propagation demonstrates avoided crossings of branches, occurring near the special k values computed from Equation (20). The inset in the left panel shows this avoided crossing quite clearly. Note how the blue, purple and cyan branch are all affected. Indeed, when we animate the dispersion curves for this case E = 1.5 with angle, only the parallel case is special in its connectivity showing true branch crossings, and all other angles have the 5 branches neatly ordered in frequency: the red lies below the blue, found in turn below the purple, which is below the cyan, and the black branch always lies at the top.
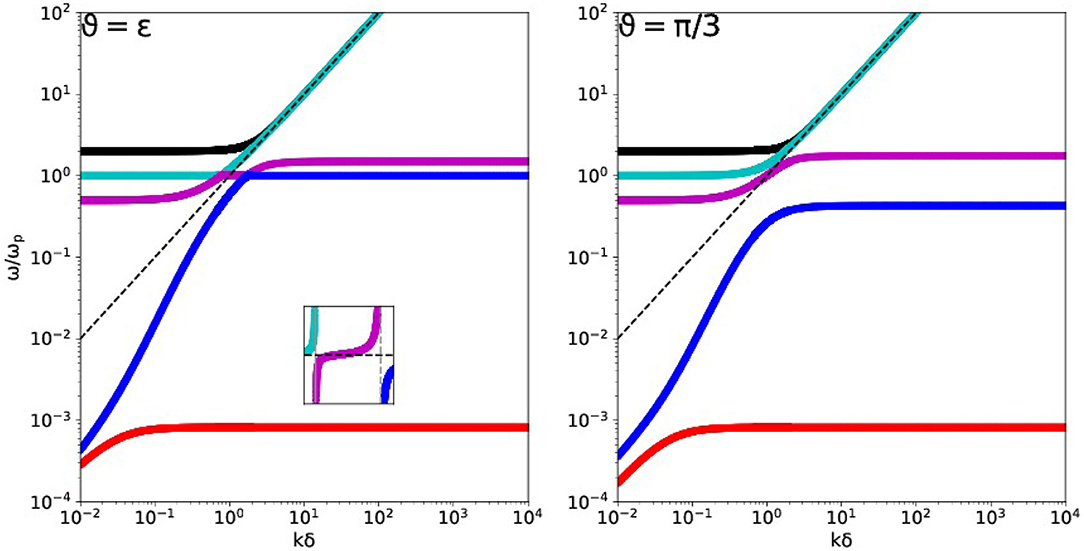
Figure 3. Dispersion diagram for a hydrogen ion-electron plasma at E = 1.5. Shown are the 5 branches at near-parallel ϑ = 0.001 (left) and oblique ϑ = π/3 propagation. The former shows avoided crossings (see inset). The dashed black line corresponds to light speed behavior.
This behavior is generic, and the avoided crossings occur according to the predictions on the basis of Equation (20), as is illustrated in Figure 4 for a case where E = 0.5 and only one branch intersects the ω2 = 1 branch at parallel orientation. The left panel of Figure 4 shows the avoided crossing between the cyan and purple branch, again at ϑ = 0.001 (note the inset).
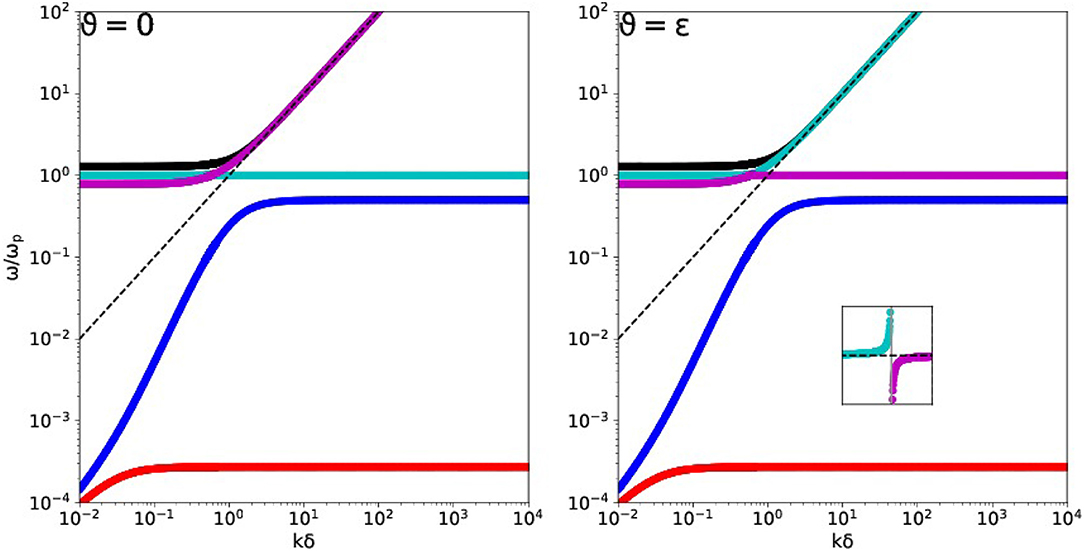
Figure 4. Dispersion diagram for a hydrogen ion-electron plasma at E = 0.5. Shown are the 5 branches at parallel (Left) and near-parallel ϑ = 0.001 (Right) propagation. The latter shows avoided crossings (see inset). The dashed black line corresponds to light speed behavior.
Since for E-values beyond E = 1/μ − 1, the cut-off ordering changes as discussed before with , avoided crossings affect the blue branch only up to E = 1/μ. Beyond E > 1/μ, both the blue and red branch will demonstrate avoided crossings.
The color scheme of the branches in Figures 2–4 is chosen in accord with the red, blue and purple resonance ranges we discussed in section 2.2 and quantified in Figure 1. We introduce a convenient labeling (A/F/M/O/X) for the 5 wave modes through ωA (red), ωF (blue), ωM (purple), ωO (cyan) and ωX (black). Indeed, for all but parallel orientations, the red (Alfvén at small wavenumber), blue (Fast at small wavenumber) and purple branch connect to the corresponding resonance value at that angle. The parallel case is different, since then avoided crossings become true crossings, and only then the cyan branch becomes the non-propagating solution ω2 = 1, its purple branch crosses it to go to electromagnetic behavior, while the blue and red branch connect to the other two resonance frequencies. This is of particular interest, since textbook classifications of wave modes in a cold plasma rely on specific wave properties at parallel or perpendicular orientations. Our analysis suggests that it is more natural to organize the waves according to the 5 branches retained in Equation (2), and handle the special cases when branches can cross separately. In the special case of a pair plasma, a further avoided crossing with the then special (non-propagating) branch ω2 = 1 + E2 at perpendicular orientations can occur, and needs to be accounted for (in press).
4. 5-Mode Phase and Group Diagrams
4.1. Phase Diagrams
We can show the full complexity of the 5 wave mode pairs in a cold plasma in an alternative way. Up till now, we stressed the i = 1, 2, …5 solutions for fixed ϑ, and plotted them in dispersion diagram views vs. k. We can also stress the full and intricate variation with angle ϑ, by fixing a wavenumber k. It is then insightful to plot the dimensionless phasespeed ωi/kc for all 5 modes, and all angles. This is best done in polar plots where we show , where . These are surfaces of revolution about the magnetic field direction, so that we can plot their 2D cross-section and take the magnetic field to be horizontal (i.e., ), making . These phase diagrams then vary with wavenumber k, but the ordering of the branches discussed previously means that at all but parallel orientations, they remain always nested surfaces. The special k values where branches cross at parallel orientations, represent mode transformations occuring when the surfaces locally touch oneanother.
We plot some representative 5-mode phase diagrams in Figure 5 for the hydrogen case at E = 1.5, shown previously in dispersion diagrams in Figures 2, 3. At large wavelengths (small k), we can recognize that the red and blue branch correspond to the long wavelength, low frequency Alfvén and fast magnetohydrodynamic (MHD) modes, respectively. At small wavelengths (large k), the cyan and black branches correspond to phase speeds nearing the light speed, and they are the familiar electromagnetic waves. Note that all branches that (partly) lie above the dashed vertical line in Figures 2–4 have phase speeds above the light speed c, which does not pose any physical problem as we are quantifying phase speeds here. It is even possible to identify when branches go from superluminal to subluminal phase speeds, happening at specific k − ϑ combinations for particularly the purple branch. Animated views (available from the first author's homepage1) of these 5-mode phase diagrams reveal their variations with wavenumber most clearly, as well as the mode transformations happening at parallel orientation, when these nested surfaces of revolution locally touch at specific k values (from Equation 20).
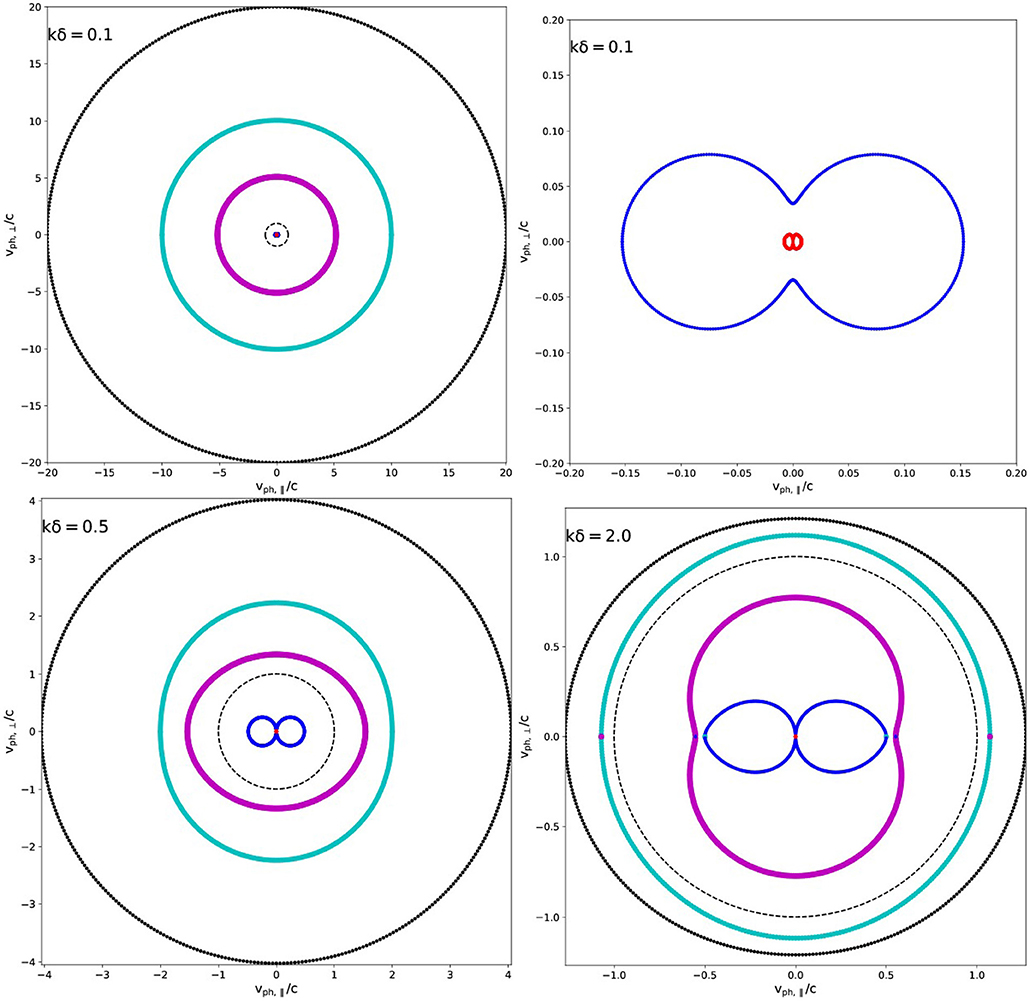
Figure 5. Selected 5-mode phase diagrams at three different values of k = 0.1 (top row), 0.5 (bottom left), 2.0 (bottom right). The dashed black circle always indicates the light circle, hence notice the varying scale. This is for a hydrogen plasma with E = 1.5, as in Figures 2, 3, and we exploit the same color scheme: electromagnetic modes are black (ωX) and cyan (ωO), followed by purple (ωM or Middle), blue (ωF or Fast) and red (ωA or Alfvén) wave. Note that in the k = 2 (bottom right) plot, at parallel orientation (horizontal central line), mode exchanges occurred between the cyan, purple and blue branches. We always show all 5 branches, such that the red Alfvén branch requires further zooming in to see its details: this is done in the top right panel for the k = 0.1 case.
4.2. Group Diagrams
While the 5-mode phase diagrams provide insight in the wave transformations, the way energy is transported is quantified from the group speed. Here, the real power of the polynomial representation comes in, since starting from the dispersion relation (2) written as
we can easily compute the corresponding group speed ∂ω/∂k by implicit derivation. The dependency of the coefficients implies that we only need to use ∂k2/∂k = 2k and where and . The resulting expression can be manipulated into
In this expression, we find the following polynomials
In the P8 polynomial, the α6,4,2 coefficients are
These (admittedly lengthy) expressions can, however, easily be evaluated for each of the 5 branches, and this for all directions and wavenumbers. Indeed, the only thing we need to do is to compute the 5 solutions as zeros of the polynomial in Equation (22) (which is how all previous results shown were obtained), and then evaluate the RHS of expression (25) accordingly. Zeros of the P9 polynomial may need special treatment, but those actually correspond to the double roots of the original polynomial. Since we found that the branches almost never intersect (except at the special crossings discussed previously), this situation hardly occurs. At perpendicular orientations, the Alfvén related branch is marginal ωA = 0, but this case can also be handled separately (it has zero group speed).
The resulting 5-mode group speed diagrams are intricate, and some are shown in Figure 6 for the same hydrogen plasma with E = 1.5. The variation with wavenumber provides fascinating views on the anisotropy inherent in all 5 wave modes. At the special wavenumbers where modes transform, also these diagrams show drastic deformations, which are only appreciated in animated views (available from the first author's homepage1). In Figure 6, the top left panel corresponds to long wavelength behavior, where the typical Friedrichs diagram containing Alfvén (red) and fast (blue) waves is recovered, while the other three waves have all smaller groupspeeds. This is opposite to the behavior at short wavelengths, where the two electromagnetic modes (purple ωO or O and black ωX or X) have group speeds that approach the light circle. As group speeds, all speeds obtained with formula (25) lie within the light circle, but their relative ordering and morphology is rather complicated. This is shown at selected wavenumbers in the four panels of Figure 6.
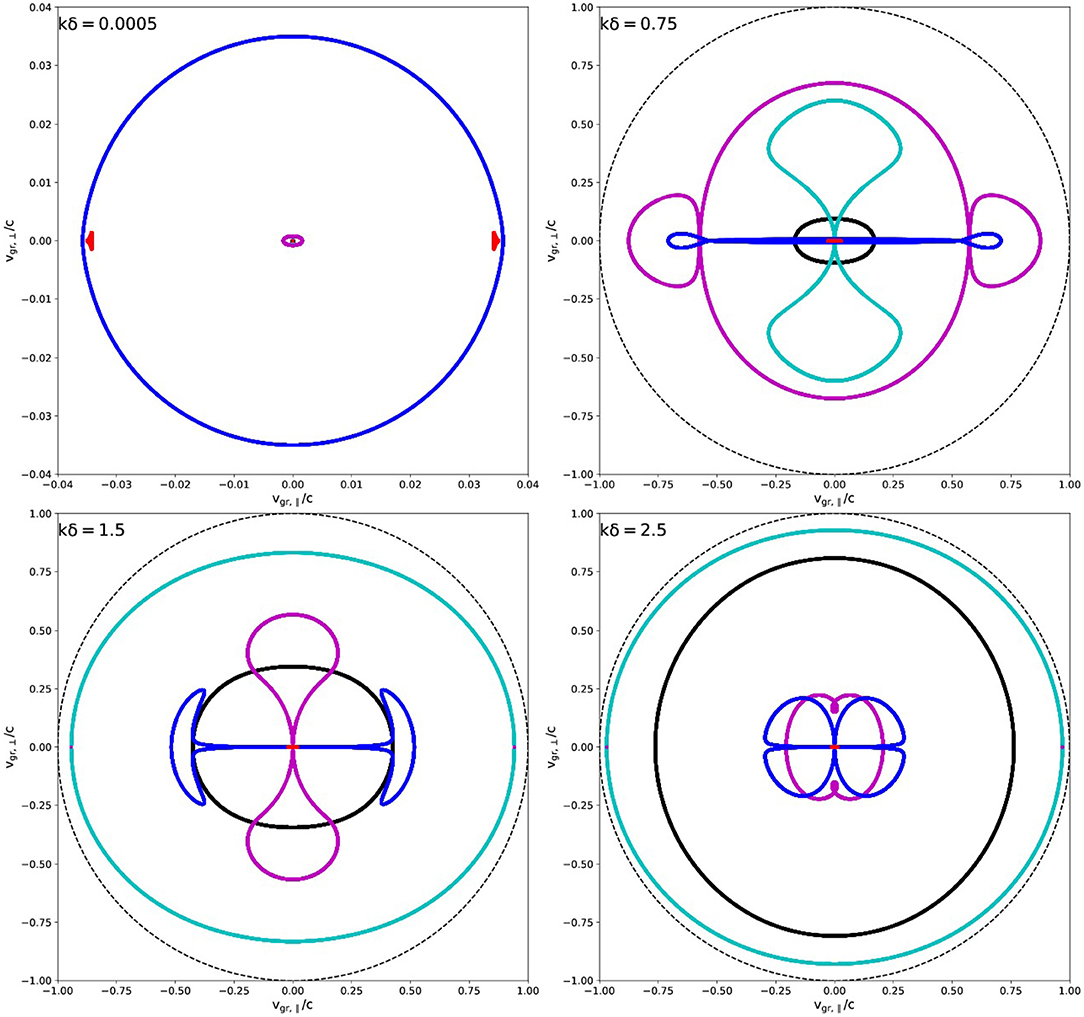
Figure 6. Selected 5-mode group diagrams at four different values of k = 0.0005, 0.75, 1.5, 2.5. The dashed black circle (with unit radius) always indicates the light circle, notice the varying scale used in the top left plot. This is for a hydrogen plasma with E = 1.5, as in Figures 2, 3, 5 phase, using the same color scheme: electromagnetic modes are black (ωX) and cyan (ωO), followed by purple (ωM or Middle), blue (ωF or Fast) and red (ωA or Alfvén) wave.
5. Relation to Textbook Treatments
5.1. Refractive Index Views
Textbook treatments (e.g., Stix, 1992; Bittencourt, 2004; Thorne and Blandford, 2017) rather emphasize that the dispersion relation Equation (2) gives direct information on the refractive index n2 = k2/ω2. When we consider a given frequency ω, next to the choice of (E, μ) and an orientation ϑ, the solutions to Equation (2) follow directly from
At most two real solutions can exist at given frequency, and this is then used to classify the wave modes in various types. Frequency ranges where only one real solution is found, or no real solution at all, must be accounted for. Of course, two complex solutions can always be found, but then the waveform exp[i(k · x − ωt)] adopted with real ω and complex k has an evanescent, instead of propagating behavior. Using the solution (32) in Equation (2), after adding a factor Ān2 on each side of the equality sign, allows one to write the solutions also as (Bittencourt, 2004)
The discriminant appearing in Equations (30-31) can be reworked to
This expression is general, and can be used to rewrite Equation (31) for the special cases of parallel or perpendicular orientations to the formulae in Equations (19–21).
For completeness, we note that textbook treatments typically exploit the following quantities
These appear in the combinations S = (R + L)/2 and D = (R − L)/2, which obey the equality S2 − D2 = RL, and together with P, they build up the cold plasma dielectric tensor, which relates the displacement vector D (giving ∇ × B = μ0∂D/∂t, including displacement currents) to the electric field E through , with
We wrote the tensor components here with the 3rd dimension parallel to B, and the k-B plane as the 1-3 plane. The dispersion relation, and all discussions of polarization in terms of the wave electric field orientation w.r.t. B and k, then follow from
The governing dispersion relation is still given by Equation (30), where the only difference appears as follows: Ā → A, where Ā = ω2(ω2 − E2)(ω2 − I2)A, and similarly for and . In the A, B and C formulations, one can write C = PRL, A = Ssin2ϑ + Pcos2ϑ, and B = RLsin2ϑ + PS(1+cos2ϑ). It is then customary to rewrite the governing dispersion relation as
From this latter expression, one can see that n2 → ∞ implies tan2ϑ = − P/S, and this latter formula gives Ā = 0, which we used to discuss cold plasma resonances. Cut-offs on the other hand are found from P = 0, R = 0 or L = 0, and these make vanish. Since further
the pair plasma case leaves D = 0 (rendering the dielectric tensor diagonal), while S = L = R.
One may recognize the dispersion relation for parallel propagation given by Equation (19) as n2 = L and n2 = R, with P = 0 giving the ω2 = 1 factor. The n2 = R and n2 = L correspond to right-hand and left-hand circularly polarized waves, respectively. We note again that this mixes forward and backward mode pairs from the original formulation. Similarly, the “ordinary” ω2 − 1 − k2 = 0 branch from perpendicular propagation in Equation (21) can be written as n2 = P. The remaining “extraordinary” term, can then be recognized from Equation (38) as n2 = RL/S.
We can plot all dispersion diagrams in terms of the refractive index, and this is done in Figure 7, for exactly the same parameters as taken in Figure 3. Note again the avoided crossings at near-parallel orientations (left panel). The horizontal dashed lines are indicating fixed frequencies where log10ω = −4, −0.1, 0.1, respectively. These return in Figure 8 below.
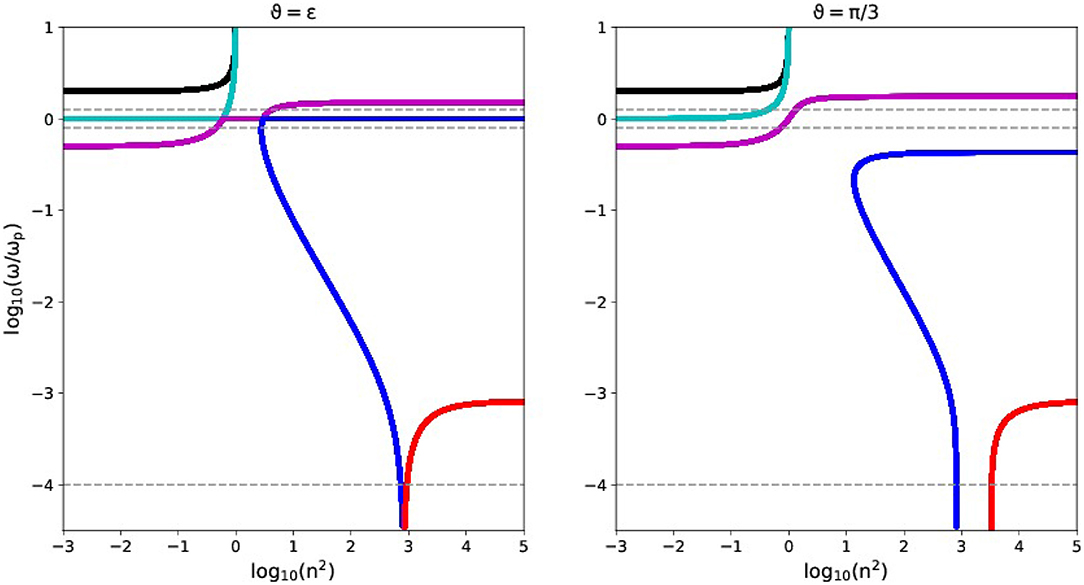
Figure 7. Dispersion diagram for a hydrogen ion-electron plasma at E = 1.5, this time displayed in refractive index view. The parameters and panels correspond to the E = 1.5 hydrogen plasma at near-parallel ϑ = 0.001 (left) and oblique ϑ = π/3 propagation from Figure 3. The horizontal dashed lines correspond to the fixed frequencies for which Figure 8 shows wave normal surfaces.

Figure 8. Wave normal surfaces at fixed frequencies for the hydrogen ion-electron plasma at E = 1.5.
5.2. CMA Related Wave Normal Surfaces
The standard way to discuss cold ion-electron plasma waves, uses the refractive index viewpoint and the solutions obtained as in Equation (30). When both solutions are real, these 2 solutions at fixed frequency lead to a first classification as being “fast” or “slow,” depending on their corresponding phase speed. Two more labels relate to the limiting behaviors at parallel and perpendicular orientations. At parallel orientations, we obtained Equation (19) which (artificially) separates 4 of the 5 mode pairs into n2 = R or right-hand circularly polarized waves, vs. n2 = L for left-hand polarized waves. A corresponding R or L label is then used to classify the mode. At perpendicular orientation, we noted that Equation (21) contains the “ordinary” (O) mode ω2 − 1 − k2 = 0, next to the 3 “extraordinary” (E) ones mixed up in n2 = RL/S. Collectively, the labels fast/slow, L/R, and O/E then serve to identify specific wave mode behavior. We note however that both classifications miss out one of the 5 branches, since the ω2 = 1 solution is left out from the L/R scheme, and the marginal pair is left out from the O/E scheme. To make matters worse, the 5 branches show avoided crossings as soon as one deviates from exactly parallel orientations (and in the case of a pair plasma, this is also true at exactly perpendicular orientations, see Keppens and Goedbloed, in press), and this seems unaccounted for in textbook treatments. That the branches that are left out from the L/R vs. O/E labeling do not correspond at all (one being cyan or ωO, the other being red or ωA for the E = 1.5 case used in our figures), is yet another aspect to be considered.
A way to categorize the diversity of wave modes in a cold plasma is using the classical Clemmow-Mullaly-Allis or CMA diagram (Stix, 1992). When plotting 1/ω2 vs. EI/ω2 (or variations thereoff, like E2/ω2 or E/ω), the lines corresponding to P = 0, R = 0 or R = ∞ and L = 0 or L = ∞, S = 0 and RL = PS divide this phase-space into sixteen distinct regions. These regions correspond to differences in wave propagation characteristics, best visualized through the wave normal surfaces, which plot phase velocity (1/n)[ϑ] for all angles ϑ. The 16 regions correspond to topologically distinct morphologies of the wave normal surface plots, and they can contain zero, one or two solutions depending on the chosen frequency. In Figure 8, we show this CMA-related view of the wave normal surfaces for the E = 1.5 hydrogen plasma considered earlier, and this at three fixed frequencies such that log10(ω) = −4, −0.1, 0.1, from left to right. These frequencies are also indicated in the refractive index plots shown in Figure 7, and we adopted the coloring scheme we introduced for labeling the 5 wave modes ωA (red), ωF (blue), ωM (purple), ωO (cyan) and ωX (black). Note e.g., how the blue ωF branch is in the textbook way a “fast” mode for the left panel, while it becomes a “slow” mode in the middle panel, although in all cases it corresponds to the blue branch that behaves as fast MHD waves at long wavelengths. We did not add the traditional L/R or O/E labels to the surfaces, as they confuse wave modes due to avoided crossings. Indeed, at ϑ = 0 Figure 2 (left panel) shows that at log10(ω) = 0.1 one intersects the purple and blue branch which are L and R, respectively, while at any finite angle (see Figure 2, right panel or Figure 3) the cyan ωO and purple ωM branch matter. The ϑ = π/2 panel from Figure 2 has ωO as cyan being “ordinary” or O, while ωF, ωX and ωM are all “extraordinary” or E, but has no label for the Alfvén mode, while it appears as the “slow” mode in the leftmost panel of Figure 8. We rather opt to use the 5-mode identification which appears naturally, and handle the complications of avoided crossings separately.
5.3. Magneto-Ionic Theory and the Appleton-Hartree Relation
A well-known special case of the general cold ion-electron plasma dispersion relation is the Appleton-Hartree equation. It ignores ion motion, and assumes that one is interested in high frequency waves only. In particular, it is valid for frequencies above the electron plasma frequency ωpe (the dimensional quantity where ), which should be above the ion plasma and ion gyrofrequency. The Appleton-Hartree relation describes high frequency electromagnetic waves that travel at arbitrary angle ϑ, and is used in magneto-ionic theory (Bittencourt, 2004; Thorne and Blandford, 2017).
The Appleton-Hartree relation turns out to be a rather curious limit of the general dispersion relation, where one sets the charge to mass ratio to the unphysical value μ = 0 (or equivalently, where one sets I = 0). This limit of Equation (2) allows one to factor out a ω2 = 0 pair, and one is left with the 8th order polynomial (4th order in ω2) given by
Textbook discussions (Bittencourt, 2004; Chen, 2016; Thorne and Blandford, 2017) rather write this relation in the form given by Equation (31), where if we exploit expression (34), we can write Equation (40) also as
It is clear that the polynomial form (43) is preferable, to discuss how its four solution pairs relate to the original 5 from the full dispersion relation (2). Note that the assumption of μ = 0 means that the dimensionless frequency used in these expression is actually (where previously it meant ω/ωp).
Figure 9 shows the dispersion relation comparison between the 5 modes of the true ion-electron dispersion relation at E = 1.5, and the 4-mode approximation made by Appleton-Hartree. The bottom panel actually quantifies the differences in frequencies, which are hardly distinguishable in the top panel. The approximate dispersion relation (43) also has the ω2 = 1 solution for exactly parallel orientation, and we find indeed at this near-parallel angle a similar avoided crossing behavior for the 4 retained modes. The Appleton-Hartree approximation contains the I = 0 limit of the crossings from Equation (20), so it has k2 = E/(E±1) as special wavenumbers. Note that the Appleton-Hartree relation always discards the Alfvén related branch ωA. The limit μ = 0 obviously implies that all subtleties related to field strengths above E = 1/μ − 1, which enrich the actual dispersion relation with cut-off frequencies that change their relative ordering (see section 2.1 and Figure 1) are completely left out of this approximation. Since we noted that beyond E = 1/μ both the ωF and ωA branch will demonstrate avoided crossings, this aspect can not be discussed on the basis of Appleton-Hartree. Finally, the assumption μ = 0 is obviously completely inappropriate for a pair plasma, where E = I and μ = 1.
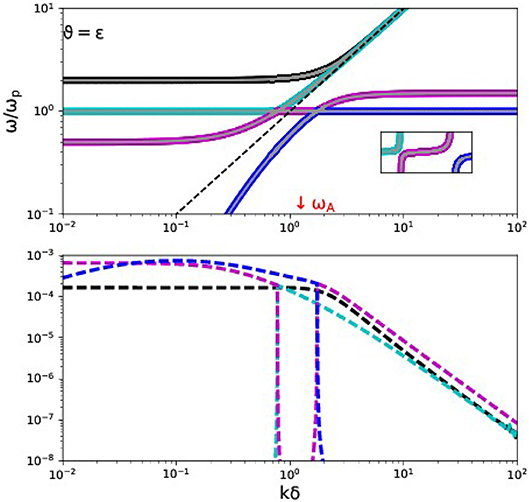
Figure 9. Comparing the Appleton-Hartree approximation to the actual hydrogen ion-electron plasma dispersion diagram for E = 1.5, at a near-parallel orientation (ϑ = 0.001). The top panel shows the branches (ωA is off the scale shown) as in Figure 3 (left panel) in the same color scheme, while the gray lines that are overplotted correspond to the 4 modes of the Appleton-Hartree approximation. The inset shows their agreement near the avoided crossings. The bottom panel quantifies their difference: this is largest at small wavenumbers.
5.4. Faraday Rotation
A final well-known effect that is described by the (cold) ion-electron plasma dispersion relation is Faraday rotation (FR). The effect is usually described for purely parallel propagation, where as noted earlier, the dispersion relation in the form of Equation (19) is recognized as the product (n2 − L)(n2 − R) = 0. At fixed frequency ω, and paying special attention to the high-frequency electromagnetic branches (which are those for frequencies ω > ωu above the upper cutoff frequency from Equation 7), the solution from n2 − L is left circularly polarized (LCP), while n2 = R is right circularly polarized (RCP). The corresponding breaking nL and nR indices differ through their difference in wavenumber, as nL − nR = cΔk/ω. A linearly polarized wave (which can always be decomposed in a LCR and RCP wave) that travels along a magnetic field ends up with its plane of polarization rotated over a finite angle. We can quantify this in a variety of ways, e.g., by using the expressions (35, 36), we find that without any approximation, we can write
This expression demonstrates that for purely parallel propagation, the Faraday effect vanishes for an electron-positron plasma (see also Stewart and Laing, 1992), and that we can approximate the difference in breaking index using the Appleton-Hartree-type recipe (μ = 0, high frequencies) to the textbook expression
where the expression between brackets temporarily restores the dimensions. We can then use this latter expression to get the usual quantification for the change in angle χ for a linearly polarized wave, written with the so-called rotation measure RM as
where the integral is along the line of sight (LOS) and B∥ is the component of B along it.
We note however that the proxy from Equation (43) is better written as (E − I)/ω3 to allow for the vanishing FR effect when μ = 1 and propagation is along the magnetic field (ϑ = 0). Moreover, we meanwhile recognize that this difference in phase speed between the high-frequency wave pair can actually be quantified readily for all angles ϑ. The FR effect for a specific E = 1.5 hydrogen plasma case is then shown in Figure 10, where the left panel shows the actual ϑ = 0 variation in nL − nR as function of frequency in red, the proxy from Equation (43) in blue, and the exact expression (45) in dashed red-blue. The right panel quantifies Δn(ϑ, ω), where the parallel (red line) result is the same as in the left panel. It is clear from this plot that the variation is a smooth function of ϑ, and that one can meaningfully extend the FR quantification, as a corresponding phase speed difference at fixed frequency, for all angles (and for all local magnetic field and number density values incorporated in E). In that sense, the widely adopted RM quantification from Equation (44) is a (usually good) approximation only, since the integral quantifying the line of sight variation of the parallel magnetic field may just as well take the local Δn(ϑ, ω; E) value into account when a field region with varying orientation in B is traversed by a wave with fixed LOS-oriented wavevector k.
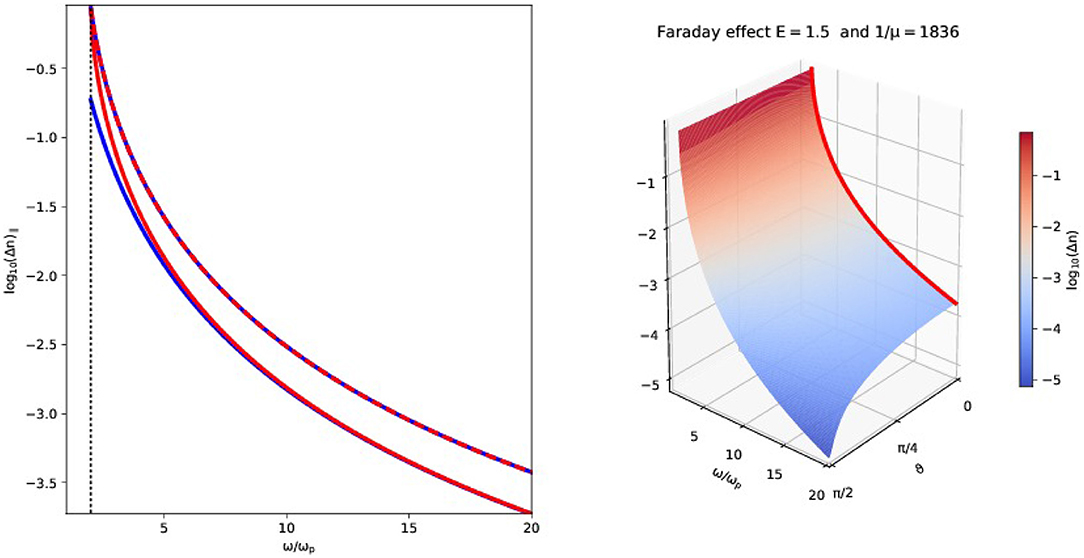
Figure 10. Faraday rotation for an E = 1.5 proton-electron plasma. The left panel quantifies with the blue solid line the textbook expression as function of frequency (above the upper cut-off frequency, indicated as a vertical dotted line). The actual, exact value of nL − nR is given by the red solid line. The dashed red-blue line shows the exact correspondence for the variation. The right panel repeats the red solid line at parallel propagation, but shows how the difference in breaking index between the two electromagnetic waves varies smoothly with angle ϑ.
This realization is important to revisit the claim that electron-positron plasmas do not show any Faraday rotation (Stewart and Laing, 1992): this statement is true for purely parallel propagation, but a quantification for all angles similar to what is shown in Figure 10, right panel, shows that finite to large Δn(ϑ, ω; E) exist for cold electron-positron plasmas, especially near ϑ = π/2 and at frequencies just above ωu.
6. Conclusions
We have revisited the cold ion-electron plasma wave theory, and summarize our main findings as follows:
• The traditional means of using the plasma dielectric tensor for obtaining dispersion relations is equivalent to our polynomial-based treatment. This polynomial description emphasizes the 5 real solution pairs ±ωX, ±ωO, ±ωM, ±ωF, and ±ωA of forward-backward propagating waves, at fixed (real) wavenumber k. The only plasma parameters that matter are the dimensionless ratios μ and E.
• The traditional labeling of waves as fast/slow, L/R, O/E type, which rather fixes a real frequency ω and solves for (real or complex) k has some distinct disadvantages, since avoided crossings of the 5 branches actually alters the connectivity between small and large wavenumber solution branches, from those found at parallel (and sometimes also perpendicular, as in pair plasmas) behavior. The fast/slow terminology confuses the established ordering of MHD waves at low frequency, large wavenumber in slow-Alfvén-fast, which is the cornerstone of all MHD spectroscopy (Goedbloed and Poedts, 2004; Goedbloed et al., 2010, 2019). Our cold assumption has removed the slow MHD waves from the description, which will return in warm plasmas.
• We can use the polynomial representation to predict the wavenumbers for avoided crossings by Equation (20), and at fixed μ, the prevailing E value dictates which and how many branches cross. Our description is valid for all combinations of (E, μ), and covers especially also the high magnetization regime where E > 1/μ. It covers all cold plasma waves, up to full relativistic magnetization.
• The polynomial dispersion relation form gives us a direct means to quantify and visualize the full 5-mode phase and group diagrams, for all wavenumbers k, which contain all relevant information on wave anisotropy and energy flow. These are very different from the wave normal surfaces at fixed frequencies, which are exploited in the CMA classification. In particular, they show intricate changeovers when the wavenumber crosses the special values from Equation (20).
• The Appleton-Hartree dispersion relation is a curious, unphysical limit setting μ = 0, which gives satisfactory agreement on the high-frequency waves (and also contains some of the avoided crossings). It fails completely for pair plasmas, and misses all intricacy associated with E > 1/μ − 1 regimes.
• Faraday rotation can be meaningfully extended to propagation angles different from ϑ = 0, and the corresponding exact value of the refractive index difference Δn(ϑ, ω; E) depending on angle, frequency and E can easily be quantified and used for rotation measure computations.
Further work should discuss the full variation of the wave polarizations, based on the 6 × 6 matrix formulation exploited in Goedbloed and Poedts (2004) and Goedbloed et al. (2019), which led to the polynomial dispersion relation. Also, the effects of a warm plasma can be easily incorporated, since then a 6th order polynomial in ω2 enters, bringing in the slow MHD modes. This is left for future work.
Data Availability
The datasets generated for this study are available on request to the corresponding author.
Author Contributions
RK performed the analysis of the dispersion relation and produced the figures for this article. It is based on the general dispersion relation derived by HG, and simplified here to cold plasmas. Both authors iterated the paper and jointly improved the presentation.
Funding
This research was supported by the KU Leuven (GOA/2015-014).
Conflict of Interest Statement
The authors declare that the research was conducted in the absence of any commercial or financial relationships that could be construed as a potential conflict of interest.
Acknowledgments
RK thanks Yunnan University and Chun Xia for kind hospitality during his sabbatical stay.
Footnotes
References
Bellan, P. M. (2012). Improved basis set for low frequency plasma waves. J. Geophys. Res. 117:A12219. doi: 10.1029/2012JA017856
Damiano, P. A., Wright, A. N., and McKenzie, J. F. (2009). Properties of Hall magnetohydrodynamic waves modified by electron inertia and finite Larmor radius effects. Phys. Plasmas 16:062901. doi: 10.1063/1.3142479
Goedbloed, J. P., Keppens, R., and Poedts, S. (eds.). (2010). Advanced Magnetohydrodynamics. Cambridge, UK: Cambridge University Press.
Goedbloed, J. P., Keppens, R., and Poedts, S. (eds.). (2019). Magnetohydrodynamics of Laboratory and Astrophysical Plasmas. Cambridge, UK: Cambridge University Press.
Goedbloed, J. P., and Poedts, S. (2004). Principles of Magnetohydrodynamics. Cambridge University Press.
Ishida, A., Cheng, C. Z., and Peng, Y.-K. M. (2005). Properties of low and medium frequency modes in two-fluid plasma. Phys. Plasmas 12:052113. doi: 10.1063/1.1905604
Keppens, R., and Demaerel, T. (2016). Stability of ideal MHD configurations. I. Realizing the generality of the G operator. Phys. Plasmas 23:122117. doi: 10.1063/1.4971811
Keppens, R., and Goedbloed, H. (in press). Wave modes in a cold pair plasma: the complete phase group diagram point-of-view. J. Plasma Phys.
Stewart, G. A., and Laing, E. W. (1992). Wave propagation in equal-mass plasmas. J. Plasma Phys. 47, 295–319. doi: 10.1017/S0022377800024247
Stringer, T. E. (1963). Low-frequency waves in an unbounded plasma. J. Nuclear Ener. 5, 89–107. doi: 10.1088/0368-3281/5/2/304
Thorne, K. S., and Blandford, R. D. (2017). Modern Classical Physics: Optics, Fluids, Plasmas, Elasticity, Relativity, and Statistical Physics. Princeton, NJ: Princeton University Press.
Zhao, J. (2015). Dispersion relations and polarizations of low-frequency waves in two-fluid plasmas. Phys. Plasmas 22:042115. doi: 10.1063/1.4919257
Keywords: waves, cold plasmas, 2-fluid theory, magnetohydrodynamic, electromagnetic wave theory
Citation: Keppens R and Goedbloed H (2019) A Fresh Look at Waves in Ion-Electron Plasmas. Front. Astron. Space Sci. 6:11. doi: 10.3389/fspas.2019.00011
Received: 11 January 2019; Accepted: 12 February 2019;
Published: 04 March 2019.
Edited by:
Bo Li, Shandong University, ChinaReviewed by:
Jinsong Zhao, Purple Mountain Observatory (CAS), ChinaPaul Cally, Monash University, Australia
Copyright © 2019 Keppens and Goedbloed. This is an open-access article distributed under the terms of the Creative Commons Attribution License (CC BY). The use, distribution or reproduction in other forums is permitted, provided the original author(s) and the copyright owner(s) are credited and that the original publication in this journal is cited, in accordance with accepted academic practice. No use, distribution or reproduction is permitted which does not comply with these terms.
*Correspondence: Rony Keppens, cm9ueS5rZXBwZW5zQGt1bGV1dmVuLmJl
 Rony Keppens
 Hans Goedbloed3