 Brian C. Healy1,2,3*
- 1Brigham MS Center, Brigham and Women’s Hospital, Boston, MA, United States
- 2Department of Neurology, Harvard Medical School, Boston, MA, United States
- 3Biostatistics Center, Massachusetts General Hospital, Boston, MA, United States
There has been an important move away from the term “statistical significance” in the scientific and statistical community. The desire to “retire 0.05” is rooted in improving scientific reporting by ensuring that researchers report more information than simply whether a p-value passes a specific threshold. At the same time, the desire to stop using statistical significance has led to uncertainty regarding how to present results. In this paper, a two dimensional classification scheme using the estimated association and p-value/confidence interval is proposed to provide guidance regarding how to report results from studies.
Introduction
Many researchers have learned to use statistical significance as a benchmark when performing a data analysis. The most common approach for determination of statistical significance is to compare a p-value for a hypothesis test of no association (i.e., a “null” hypothesis) between the predictor and the outcome to a type I error rate (or alpha level) of 0.05. When the p-value is less than 0.05, the null hypothesis is rejected, and the association is deemed to be statistically significant. When the p-value is larger than 0.05, the null hypothesis is not rejected, and the association is considered not statistically significant. In addition to comparing the p-value to 0.05, statistical significance can also be assessed using a 95% confidence interval for the estimated association. If the 95% confidence interval does not include the null value, the null hypothesis is rejected because the null value is not among the set of plausible values defined by the confidence interval. If the 95% confidence interval includes the null value, the null hypothesis is not rejected because no association is among the plausible values. Further, the conclusion from the 95% confidence interval will agree with the p-value when the two are calculated using the same assumptions.
There are numerous potential problems associated with using statistical significance (1). First, statistical significance leads to an unnecessary dichotomization of results (2). The strict 0.05 threshold leads to dramatically different interpretations for studies that are quite similar in terms of the results. An unintended consequence of this dichotomization is that researchers will often try to find statistical significance so that their results are more impressive. This has led to “p-hacking,” which is when researchers try to find an analysis that has a p-value less than 0.05 (3). Second, statistical significance has been used in many disciplines as a proxy for clinical relevance, even though statistical significance alone does not provide information regarding the clinical meaningfulness of an association (4). Third, studies that show no statistically significant difference can be very different in terms of the range of plausible values, but statistical significance provides no information about these differences (5). A p-value larger than 0.05 can occur due to small sample size, large amount of variability, small true association, or a combination of these three factors, but the scientific interpretation should change based on the reason for the p-value being larger than 0.05. Fourth, reliance on statisticial significance has led to confusion regarding replication because two studies with very similar estimates of the association may have different conclusions related to statistical significance.
The American Statistical Association has advocated for a move away from 0.05 and statistical significance (6). This change will lead to better reporting of results, but it leaves researchers trying to present their results in a fair and accurate manner without the easy guide of statistical significance. In the ASA’s paper, they described how there are many things that we should not do, and the guidance regarding what to do (“Accept uncertainty, Be thoughtful, open and modest: ATOM”) is helpful (6). Unfortunately, there is still a gap in terms of what a researcher should report.
In this paper, I advocate using a classification scheme that can be used in place of statistical significance and provide examples using the traditional statistical significance threshold as well as the alternative approach. The new framework combines a classification of the estimated strength of the association with a classification of the p-value/confidence interval to provide guidance for researchers about how to report study results. Although this framework uses cut-offs for guidance, I hope that different fields will use different cut-offs to ensure that the framework can be tailored to each field.
Example study results
To motivate this discussion, I present the results from four hypothetical placebo-controlled randomized clinical trials with the estimates, 95% confidence intervals and p-values presented in Table 1. Each subject is classified as having the event of interest (“Yes”) or not having the event of interest (“No”). The corresponding 2×2 table for each of these studies is also provided. Each study has an estimated risk ratio of 0.8, but there is a large difference in the width of the confidence intervals and p-values across studies. Using statistical significance as the approach for classification (second column of Table 1), the first two studies lead to the same interpretation despite the large difference in the confidence intervals and p-values. Further, the last two studies also lead to the same interpretation despite a similarly large difference in the confidence intervals and p-values. In fact, the two studies that are the most similar in terms of the results are studies 2 and 3, but these studies result in the opposite conclusions when statistical significance is the focus of the interpretation.
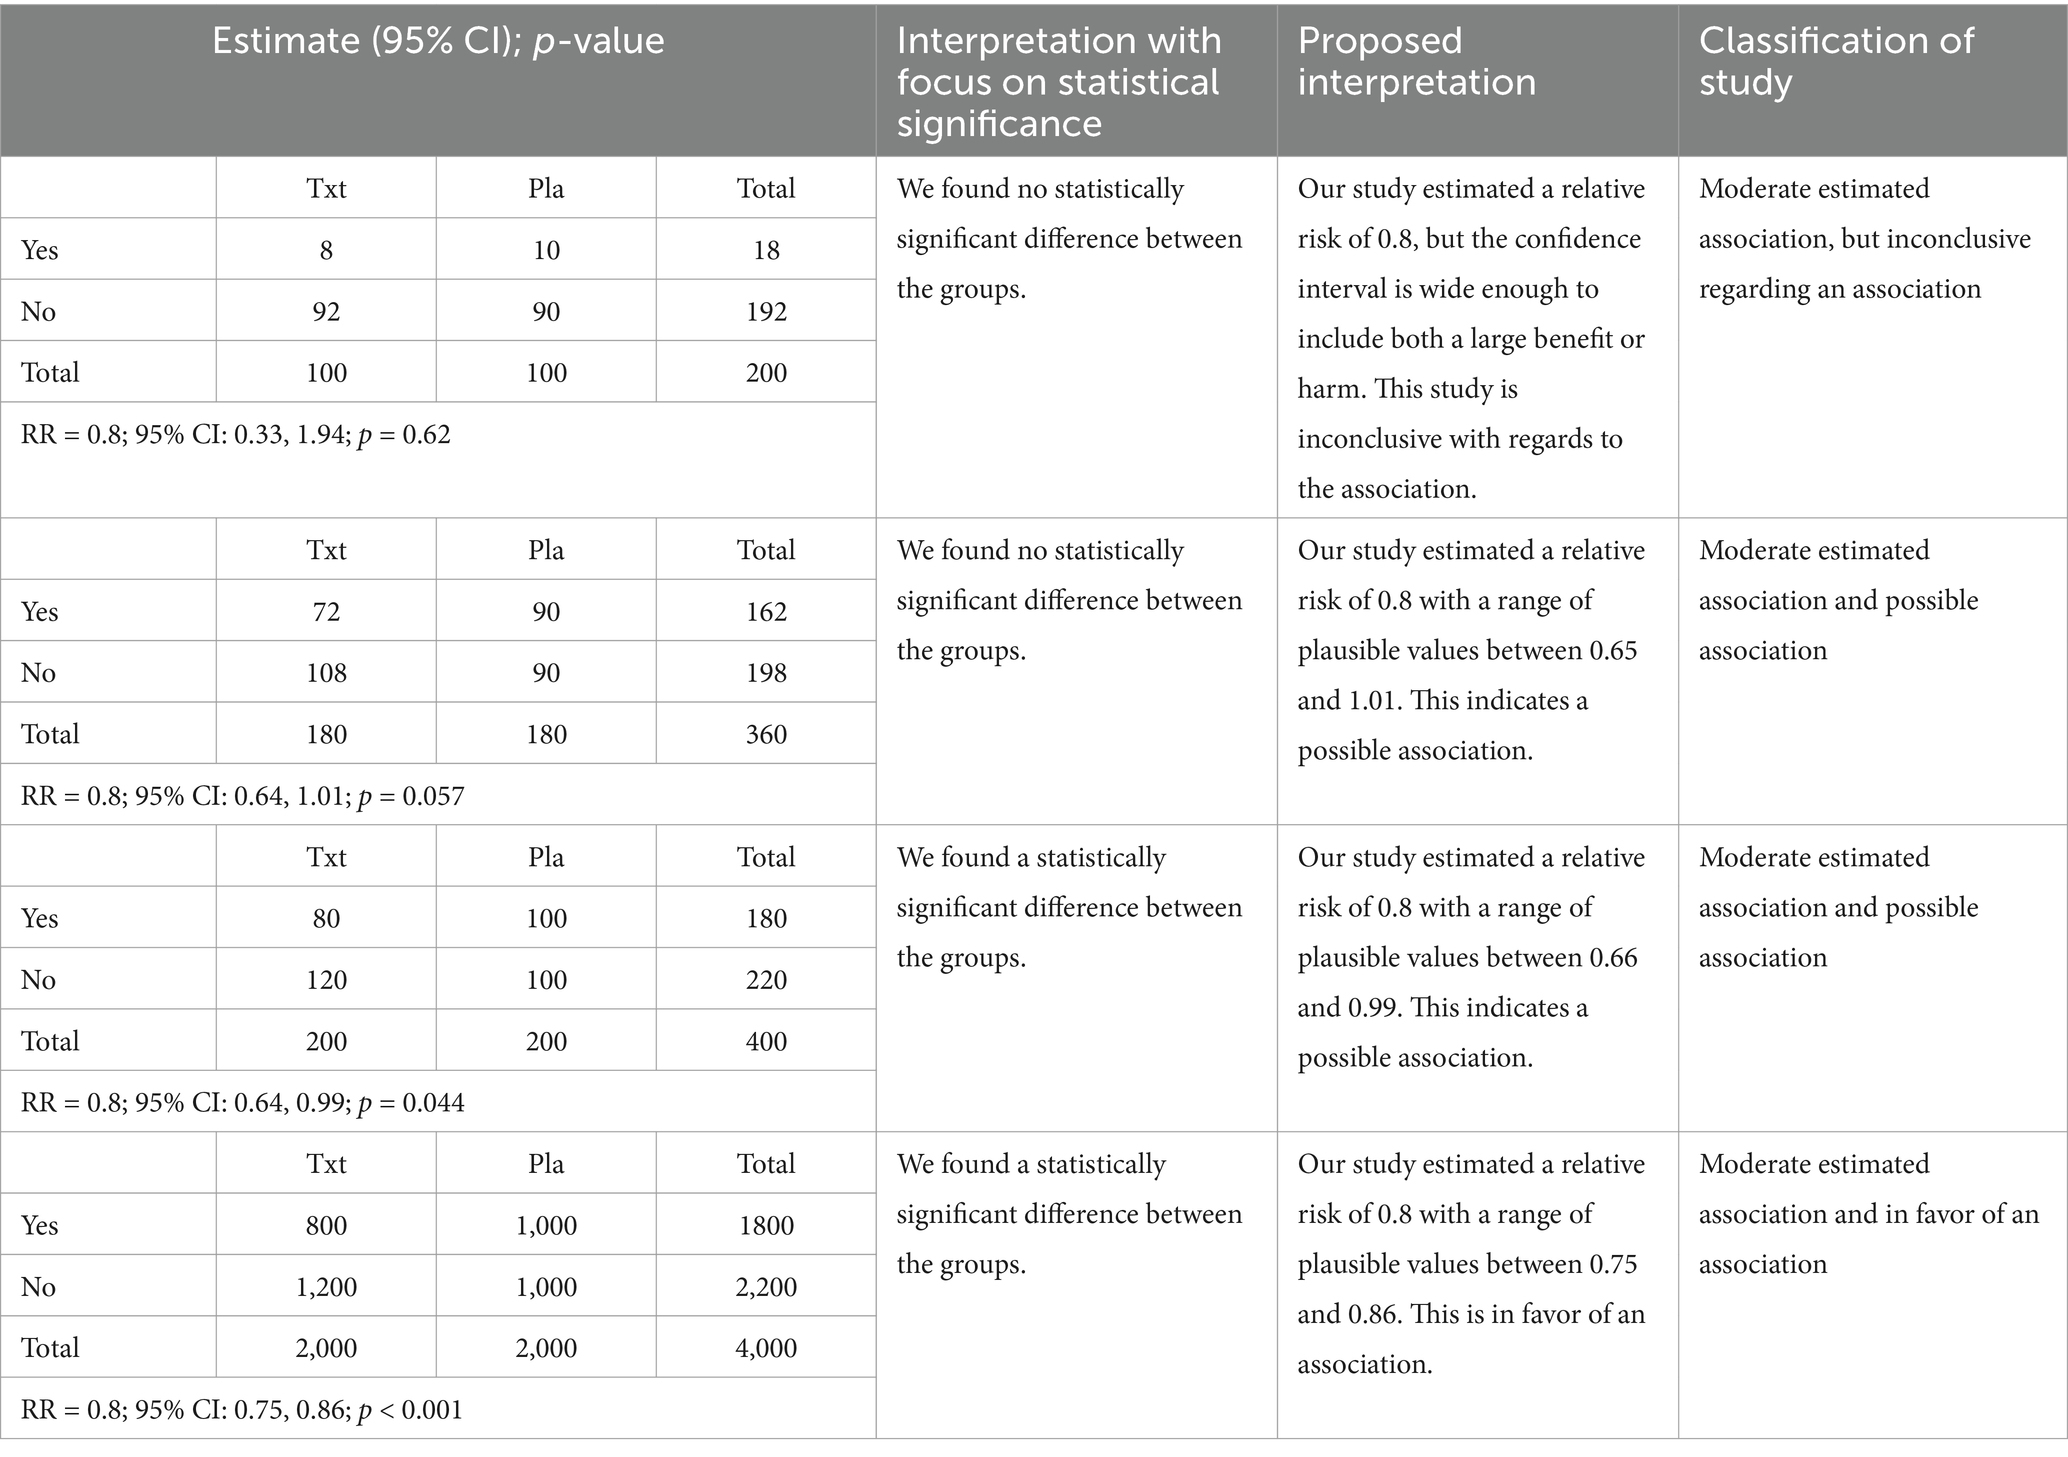
Table 1. Results from a set of studies with the traditional interpretation and the proposed interpretations.
Alternative approach for classification of study results
An alternative approach for classification of studies is provided in Figure 1. In Figure 1A, we classify the results along two dimensions using the estimated association and the p-value/confidence interval. The estimated association could be a risk ratio or risk difference with a dichotomous predictor/dichotomous outcome, a mean difference or Cohen’s d with a dichotomous predictor/continuous outcome or a Pearson’s correlation coefficient or R2 with a continuous predictor/continuous outcome. The classification of the estimated association as weak, moderate, and strong will depend on the scientific question, and I provide an example of the classification for multiple sclerosis (MS) in a subsequent section. The cells of Figure 1A have been color coded to identify the different results that might occur in a study. In addition, Figure 1B provides examples of estimates and confidence intervals that correspond to each of the cells of Figure 1A. The number and color match between the two panels of the figure to aid in connecting the parts of the figure. For each row in Figure 1B, the estimate is shown by the star, and the confidence interval is shown by the length of the line. A key aspect to note is that when a p-value and estimated association are specified in Figure 1A, there is a corresponding confidence interval that can be inferred, and an example confidence interval is provided in Figure 1B.
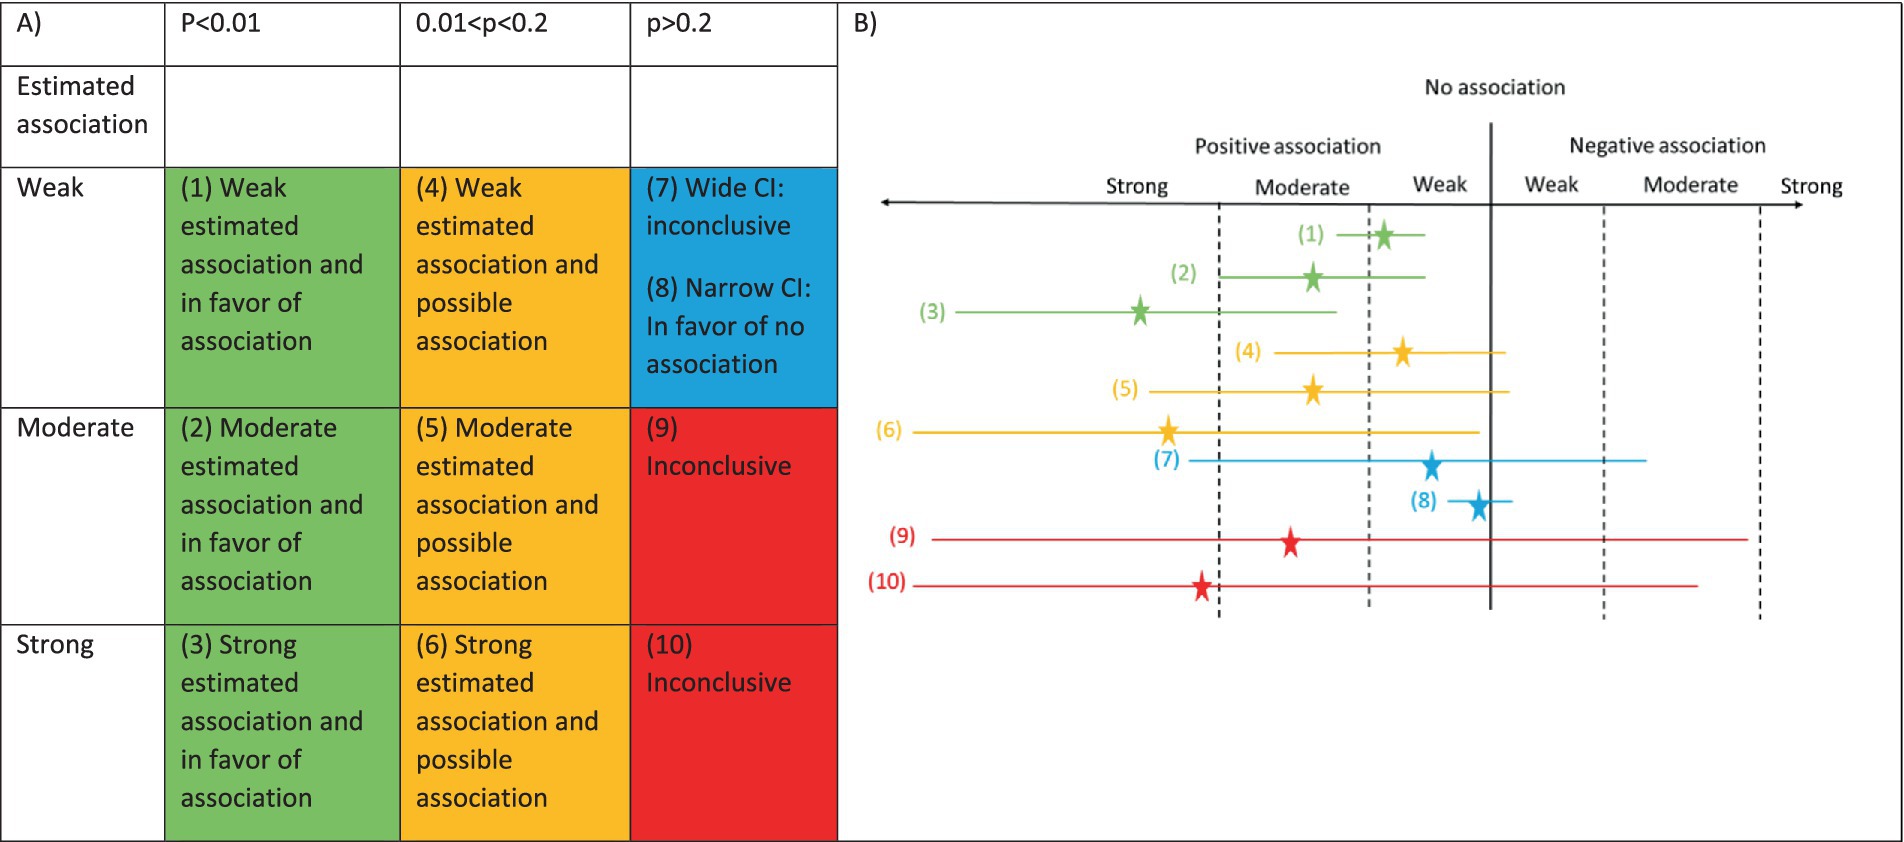
Figure 1. Classification of association and p-value. (A) Table with columns defined by p-value and rows defined by estimated association. The colors inside the table indicate the types of results that could be observed. The numbers refer to the estimates and confidence intervals in panel (B). (B) Estimate and confidence interval for 10 possible scenarios. Estimate is shown by the star. Width of the 95% confidence interval is shown by the length of the line.
In the first column of Figure 1A (green cells) and the first three estimates in Figure 1B (estimates and confidence intervals #1–3), we are focused on studies with a small p-value, but the estimated association can be weak, moderate or strong. When there is a weak association and a small p-value, the confidence interval must be narrow because we can only obtain a small p-value with a weak association if there is a narrow confidence interval (estimate and confidence interval #1). Therefore, despite the weak association, the narrow confidence interval will indicate that all the plausible values are consistent with the weak (or potentially moderate) association. For the moderate and strong associations (estimates and confidence intervals #2–3), a small p-value could occur with either a narrow or wide confidence interval, but the range of the confidence interval would indicate a likely moderate or strong association. For all of the green estimates and confidence intervals, we can rule out a negative association because a negative association is inconsistent with the respective confidence intervals.
In the second column of Figure 1A (orange cells) and next three estimates and confidence intervals in Figure 1B (estimates and confidence intervals #4–6), the p-values are between 0.01 and 0.2. The value of 0.2 was chosen for the upper limit of this interval because this is the type I error rate used in some phase II cancer clinical trials (7). In these cases, “no association” is close to the boundary of the confidence interval, either being included or not included in the confidence interval. Since “no association” is close to the boundary, the results are classified as possible. Further, the confidence interval will rule out a moderate to strong association in the opposite direction because the confidence interval will not include any values in this range.
For the third column, the estimated association impacts the interpretation more directly. When the p-value is larger than 0.2 and the estimated association is weak (blue cell of Figure 1A), we need to consider the width of the confidence interval as a third feature when determining the classification. When the confidence interval is wide, positive and negative associations will be consistent with the data so the results are inconclusive regarding the association (estimate and confidence interval #7). When the confidence interval is narrow, the range of the confidence interval will only include a weak positive or weak negative association, and this would be consistent with no or a weak association (estimate and confidence interval #8). This would be similar to an equivalence study showing that the confidence interval is fully within certain bounds, showing equivalence. When the p-value is larger than 0.2 and the estimated association is moderate or strong (red cells of Figure 1A), the confidence interval needs to be sufficiently wide that we must consider the study inconclusive. The estimates and confidence intervals #9–10 in Figure 1B show the extremely wide interval needed for a high p-value with a moderate to strong estimated association.
Once a study is classified, the third and fourth columns of Table 1 provide example language for describing the results based on the classification of the studies. The write-up for each study has two components. First, the strength of the estimated association is listed. Second, the classification of the type of association based on the p-value and confidence interval is provided.
Example for classification of estimated association dimension
The cut-offs for classification of the estimated association dimension will depend on the effect measure and application area, but these will indicate whether the point estimate indicates a strong, moderate or weak association. This classification will allow the study to describe the clinical relevance of the estimated association. To demonstrate how this approach might work in practice, I propose cut-offs for risk ratio for a treatment effect on relapses in MS, which is the most common neurologic disease among young people in the US. There are several treatments for MS that have been shown in clinical trials to reduce the relapse rate, and these treatments have been comprehensively described in several recent network meta-analyses (8, 9). Based on the 2015 network meta-analysis with relapse rate over 24 months as the outcome, the highest efficacy treatments have risk ratios of 0.6 or lower compared to placebo, and this result was confirmed in the 2018 network meta-analysis that added an additional highly effective treatment. For the other FDA-approved treatments compared to placebo with relapse rate over 24 months as the outcome, all treatments considered low efficacy fall between a risk ratio of 0.9 and 0.6. Since I will consider high efficacy treatments to have a strong effect and other treatments to have a moderate effect, I propose a risk ratio of 0.6 as the boundary between strong and moderate and a risk ratio of 0.9 as the boundary between moderate and weak. For the classifications above 1, the reciprocal of 0.9 and 0.6 are proposed (1.11 and 1.67). Using these values for the estimated association dimension, we can classify all future treatment comparisons in MS using this framework to describe the comparison of treatments. An alternative outcome measure in MS such as brain atrophy might have different estimated association cut-offs so the approach should be adjusted as appropriate.
Discussion
The proposed approach for classification of studies uses a combination of the estimated association, p-value, and confidence interval to describe the results of a study. The approach also has an easy to use visual aid that can help students taking introductory statistics courses. Despite these advantages, there are several issues with this approach that should be addressed.
Statistical significance used a single threshold applied to all scenarios. The proposed approach is classifying studies on two dimensions with ten groups. Isn’t there still a problem with thresholds?
The proposed framework uses two dimensions for classification. The p-value/confidence interval dimension is similar to statistical significance. The main advantage is that rather than describing studies as significant or not, the framework classifies studies into three groups to provide additional information regarding the range of values consistent with the data. As described in the MS example, the strength of the association dimension should be subject area specific, which allows the framework to be tailored to the scientific question. Therefore, the framework will vary based on fields to allow the classification of strong, moderate, and weak effects based on the subject area. Despite the additional flexibility of this approach, thresholds are used so some of the challenges associated using thresholds remain.
Researchers, especially in clinical trials, may prefer to keep statistical significance. How does that fit into this framework?
Authors have suggested that statistical significance and the 0.05 cut-off remains useful in certain settings, such as clinical trials (10). The proposed framework can be adjusted to accommodate statistical significance by adding a cut-off to the p-value dimension and breaking the “possible” dimension (0.01 < p < 0.2) into two parts (0.01 < p < 0.05 and 0.05 < p < 0.2). This is similar to the “statistical significance” and “trend towards statistical significance” (11).
How does this approach work in the presence of multiple comparisons?
When a study involves multiple data analyses, alternative cut-off values are required for the p-value classification, but the concept would be the same. In particular, we would classify the results from each of the multiple analyses using the alternative cut-offs based on a Bonferroni correction or other approach to handle the p-value dimension. Then, the classification of the results for each of the analyses would use the estimated association and Bonferroni corrected p-value.
How should this approach be used in terms of assessment of replication?
An important question when combining information across studies is how to determine if two studies have replicated, and classification using statistical significance often leads to confusion since the focus is the p-value rather than the estimated association. By including the magnitude of the estimated association in the approach for classification of studies, it should be easier to determine if the studies replicate. As an example, the four studies from Table 1 would not appear to replicate when using statistical significance as the benchmark, but using the proposed approach, all of the studies would be lead to the same description that there is a moderate association even though the studies had differing levels of evidence.
What about scientific areas where the classification of the estimated association is not known?
For new areas of research, the classification of the estimated association commonly used for correlation coefficients (12) or Cohen’s d (13) can be used.
How would this change impact sample size and power calculations?
One challenge in the move away from statistical significance is that sample size and power calculations for many studies use the reject/fail to reject the null hypothesis framework for calculations. The proposed framework provides a straightforward approach to handle sample size and power calculations because the researcher would specify prior to the study the classification that they would like to achieve in the study and perform the calculations accordingly. For example, if a researcher wanted to perform a study that would lead to evidence in favor of a moderate association, the alpha level and estimated association for the corresponding box in Figure 1A can be used for the calculation.
Does this approach work with absolute difference measures in addition to relative measures?
Although the motivating example used risk ratios for comparison across the studies, the same approach could be applied to risk difference or other absolute measures.
How can I use this new approach in teaching introductory statistics?
Another motivation for this approach is to provide a way for teachers of introductory statistics to replace statistical significance that is not an oversimplification. The proposed approach provides structure while focusing attention on both the estimated association and p-value/confidence interval. This will allow students to see the extension from statistical significance, which will help with learning. In addition, teachers may use the example from Table 1 as a motivation for adopting the new approach, and students may use Figure 1 as a reference in their own work.
Conclusion
The goal of this paper was to provide an easy-to-use framework for the classification of study results for researchers. The framework builds on the importance of reporting an estimate, 95% confidence interval and p-value and classifies the results using both the estimated association as well as the p-value and confidence interval. The approach is simple to use given the information provided in Figure 1 and provides researchers with the appropriate language for describing their study results.
Data availability statement
The original contributions presented in the study are included in the article/supplementary material, further inquiries can be directed to the corresponding author.
Author contributions
BH: Conceptualization, Investigation, Methodology, Project administration, Supervision, Writing – original draft.
Funding
The author(s) declare that no financial support was received for the research, authorship, and/or publication of this article.
Acknowledgments
I would like to thank Richard Born, Douglas Hayden, and Bonnie Glanz for extremely helpful comments in the development of this paper.
Conflict of interest
The author declares that the research was conducted in the absence of any commercial or financial relationships that could be construed as a potential conflict of interest.
Publisher’s note
All claims expressed in this article are solely those of the authors and do not necessarily represent those of their affiliated organizations, or those of the publisher, the editors and the reviewers. Any product that may be evaluated in this article, or claim that may be made by its manufacturer, is not guaranteed or endorsed by the publisher.
References
1. Amrhein, V, Greenland, S, and McShane, B. Scientists rise up against statistical significance. Nature. (2019) 567:305–7. doi: 10.1038/d41586-019-00857-9
2. Wasserstein, RLL, and Nicole, A. The ASA’s statement on p-values: context, process, and purpose. Am Stat. (2016) 70:129–33. doi: 10.1080/00031305.2016.1154108
3. Head, ML, Holman, L, Lanfear, R, Kahn, AT, and Jennions, MD. The extent and consequences of p-hacking in science. PLoS Biol. (2015) 13:e1002106. doi: 10.1371/journal.pbio.1002106
4. Ranganathan, P, Pramesh, CS, and Buyse, M. Common pitfalls in statistical analysis: clinical versus statistical significance. Perspect Clin Res. (2015) 6:169–70. doi: 10.4103/2229-3485.159943
5. Greenland, S, Senn, SJ, Rothman, KJ, Carlin, JB, Poole, C, Goodman, SN, et al. Statistical tests, P values, confidence intervals, and power: a guide to misinterpretations. Eur J Epidemiol. (2016) 31:337–50. doi: 10.1007/s10654-016-0149-3
6. Wasserstein, RLS, Allen, L, and Lazar, NA. Moving to a world beyond “p < 0.05”. Am Stat. (2019) 73:1–19. doi: 10.1080/00031305.2019.1583913
7. Jung, SH. Randomized phase II trials with a prospective control. Stat Med. (2008) 27:568–83. doi: 10.1002/sim.2961
8. Tramacere, I, Del Giovane, C, Salanti, G, D'Amico, R, and Filippini, G. Immunomodulators and immunosuppressants for relapsing-remitting multiple sclerosis: a network meta-analysis. Cochrane Database Syst Rev. (2015) 2015:CD011381. doi: 10.1002/14651858.CD011381.pub2
9. Lucchetta, RC, Tonin, FS, Borba, HHL, Leonart, LP, Ferreira, VL, Bonetti, AF, et al. Disease-modifying therapies for relapsing-remitting multiple sclerosis: a network Meta-analysis. CNS Drugs. (2018) 32:813–26. doi: 10.1007/s40263-018-0541-5
10. Cook, JA, Fergusson, DA, Ford, I, Gonen, M, Kimmelman, J, Korn, EL, et al. There is still a place for significance testing in clinical trials. Clin Trials. (2019) 16:223–4. doi: 10.1177/1740774519846504
12. Schober, P, Boer, C, and Schwarte, LA. Correlation coefficients: appropriate use and interpretation. Anesth Analg. (2018) 126:1763–8. doi: 10.1213/ANE.0000000000002864
Keywords: introductory statistics, reporting of results, statistical significance, p-value, confidence interval
Citation: Healy BC (2025) I know what I shouldn’t say, but what should I say? An approach to present results without statistical significance. Front. Appl. Math. Stat. 10:1487750. doi: 10.3389/fams.2024.1487750
Edited by:
Eva Cantoni, University of Geneva, SwitzerlandReviewed by:
Marcos Edgar Herkenhoff, University of São Paulo, BrazilCopyright © 2025 Healy. This is an open-access article distributed under the terms of the Creative Commons Attribution License (CC BY). The use, distribution or reproduction in other forums is permitted, provided the original author(s) and the copyright owner(s) are credited and that the original publication in this journal is cited, in accordance with accepted academic practice. No use, distribution or reproduction is permitted which does not comply with these terms.
*Correspondence: Brian C. Healy, YmNoZWFseUBtZ2guaGFydmFyZC5lZHU=