- 1Department of Mathematics, University of Gondar, Gondar, Ethiopia
- 2Department of Mathematics, Debre Berhan University, Debre Berhan, Ethiopia
- 3Department of Mathematics, Oda Bultum University, Chiro, Ethiopia
- 4Department of Mathematics, Hawassa University, Hawassa, Ethiopia
Cholera is a disease of poverty affecting people with inadequate access to safe water and basic sanitation. Conflict, unplanned urbanization and climate change all increase the risk of cholera. In this article, an optimal control deterministic mathematical model of cholera disease with cost-effectiveness analysis is developed and analyzed considering both direct and indirect contact transmission pathways. The model qualitative behaviors, such as the invariant region, the existence of a positive invariant solution, the two equilibrium points (disease-free and endemic equilibrium), and their stabilities (local as well as global stability) of the model are studied. Moreover, the basic reproduction number of the model is obtained. We also performed sensitivity analysis of the basic parameters of the model. Then an optimal control problem is designed with a control functional having five controls: vaccination, treatment, environment sanitation and personal hygiene, and water quality improvement program. We examined the existence and uniqueness of the optimal controls of the system. Through the implementation of Pontryagin's maximum principle, the characterization of the optimal controls optimality system is established. The numerical simulation results the integrated control strategies demonstrated that strategy 2, 7, and 12 are effective programs to combat cholera disease from the community. Based on the local circumstances, available funds, and resources, it is recommended to the government stakeholders and policymakers to execute any one of the three integrated intervention programs.
1 Introduction
Cholera poses a global public health concern among communicable diseases. Currently, it is still prevalent in regions affected by natural disasters, humanitarian crises, and/or low levels of hygiene across the world. It is an acute watery diarrheal disease caused by ingestion of food or water contaminated with the bacterium Vibrio cholerae [1, 39]. In endemic locations, cyclic outbreaks occur twice a year, and the disease is exceedingly virulent and rapidly fatal, posing a serious threat to public health in developing nations [26]. The World Health Organization (WHO) estimates that each year, cholera causes 1.4 − 4.3 million illnesses and 30,000–140,000 deaths globally [16]. There were about 3 million deaths from cholera epidemics globally based on trend analysis from 1990 to 2019 [16]. Cholera affects the poorest people of the world, who already have been rendered vulnerable due to conflict and poverty [25]. The current cholera outbreak occurred largely on the African continent, particularly in the sub-Saharan regions [36]. More than 14 African countries (including Nigeria, Cameroon, Democratic Republic of Congo, South Sudan, Somalia, Ethiopia, Kenya, Tanzania, Zambia, Malawi, Mozambique, Zimbabwe, South Africa, Eswatini, and Burundi) have reported cholera cases since the beginning of 2023 [21].
The transmission of cholera can occur through direct human-to-human contact as well as indirect human-to-environment contact [41]. Family members of cholera patients are particularly vulnerable to infection, potentially as a result of contaminated family water storage containers or contaminated food preparation [12, 21]. The main way that cholera is spread from the environment is through the consumption of contaminated water that harbors the Vibrio cholera bacteria. Usually, cholera bacteria are found in food or water sources that have been contaminated by a cholera patient's excreta [39]. Places with inadequate sanitation, poor hygiene, and inadequate water treatment are the most likely to contact and transmit cholera [21].
The key to controlling cholera and lowering deaths in a humanitarian setting is a complex approach that combines the use of oral cholera vaccines, quick surveillance, social mobilization, treatment, water sanitation, and hygiene [9]. In cholera outbreaks, household spraying is a commonly implemented intervention where cholera patients' homes are disinfected with chlorine, with the aim of reducing the immediate risk of cholera transmission to other household members via surfaces and/or objects contaminated with V. cholerae [20].
Epidemiologists and other researchers use mathematical modeling and numerical simulation for a scientific understanding of the dynamics and preventive method of an infectious disease, for determining sensitivities, changes of parameter values, and forecasting. They use the most recent information to extrapolate the state and progress of an outbreak and make predictions. Several mathematical models on cholera were developed by different authors. From these research findings, some of the scholars used deterministic, stochastic, and fractional models. Nyabadza et al. [31] studied the dynamics of cholera in the presence of limited resources. They showed that their model exhibits backward bifurcation and multiple equilibrium points. They also concluded that the cases of cholera infection decrease if there are a sufficient number of hospital beds. A mathematical model for the transmission of cholera dynamics with a class of quarantined and vaccination parameter as control strategies is proposed by Ezeagu et al. [17]. They reached a conclusion that effective quarantine, vaccination, and proper sanitation reduce the disease contact rates, which eliminate the spread of cholera. Onitilo et al. [32] considered an SIR-V type of infection model for cholera dynamics considering environment-to-human and human-to-human transmission. They predicted the intervention strategies without applying the optimal control theory. However, they recommended that non-governmental organizations (NGOs) and relevant authorities properly educate the public about the risks associated with swimming in drinking water sources and urinating in public. The other scholars used fractional order modeling [4, 35]. They formulated an susceptible-exposed-infected-recovered (SEIR) and studied by incorporating the saturated incidence rate into the model. From the results, they recommended that in order to stop the spread of cholera in a particular population, responsible organizations need to conduct education programs.
An area of study known as optimal control emerged in order to establish the best methods for managing dynamic systems. A few research scholars used optimal control strategies for cholera disease to minimize the number of infected individuals. Njagarah and Nyabadza [30] formulated a nine-compartment deterministic cholera model and an optimal control theory is applied to ascertain the level of effect of the controls in reducing susceptible, exposed, infected individuals and causative pathogen population. Pontryagin's maximum principle is used to prove the optimal solution of the model, and the optimal system was derived and numerically solved. Simulations were made with graphs that show the effects of the controls on susceptible, exposed, infected, and V. cholerae population. Their findings conclude that simultaneous application of the three controls can be one of the fast and effective ways of controlling cholera. If two controls are to be selected, hygiene consciousness and vaccine are the best combination. The study conducted in 2015 [30] created and examined a mathematical model for the dynamics of cholera transmission between two interconnected villages that included allowable controls. According to the findings, both impacted groups benefited from the application of controls such good sanitation, hygiene, and immunization.
Bakare and Hoskova-Mayerova [5] developed a deterministic and stochastic mathematical models of cholera transmission and control dynamics, with the aim of investigating the effect of the three control interventions against cholera transmission to find the optimal control strategies. Numerical experiments showed that to effectively control cholera transmission, mortality, and morbidity, a combination of all three control interventions (the use of hygiene promotion and social mobilization; the use of treatment by drug/oral re-hydration solution; and the use of safe water, hygiene, and sanitation) is needed. Cheneke et al. [13] presented a cholera model with fractional derivative and optimal control analysis. According to the cost-effectiveness analysis, the three or four feasible combinations of controlling measures–hygiene, vaccination, ineffective remedy, and chlorination–for cholera contamination intervention show that these three are the best combinations to control the spread of the infection.
Lemos-Paião et al. [28] proposed a mathematical model for cholera with treatment through quarantine in the Department of Artibonite (Haiti) in 2010 with an optimal control problem and analyzed, with a goal of obtaining a successful treatment through quarantine. In order to reduce the number of infectious individuals, the concentration of bacteria, and the associated costs, they recommended implementing the most effective quarantine plan.
In 2022, He and Whang [23] developed a fractional model for the transmission dynamics of cholera with an optimal strategy considering treatment, vaccination, and awareness programs to reduce the number of infections. From the numerical simulations and cost-effectiveness analysis, the results showed that the best strategy was the combination of treatment and awareness programs.
With the help of optimal control theory and actual data on cholera cases from Ethiopia's Oromia Region, the cholera dynamics model with continuous controls–which consists of two controls is theoretically studied by Berhe [7]. The author used average cost-effectiveness ratio and the incremental cost-effectiveness ratio. The use of treatment as control was found out to be the most cost-effective strategy.
We noted that none of the researches reviewed above assumed the combined effect of cholera disease transmission (direct and indirect) with explicit intervention program in the transmission dynamics of the disease considering Hollying type II functional response for infection from bacteria contaminated food or water and standard incidence rate for human to human infection and an optimal control intervention with five intervention programs. According to the optimal control model created by the previously assessed works, the researchers employed one, two, or possibly three of the intervention programs, which incorporate treatment, vaccination, awareness programs, and implementation of proper hygiene. The goal of this study is to determine the best control approach to reduce the spread of cholera, which included environmental hygiene. In this research, we used five intervention control strategies including environmental sanitation in formulating the corresponding optimal control model which was not considered in optimal control model formulation in previous research. In this article, we consider the above gaps in the development of a cholera transmission dynamics mathematical model with an optimal control strategy.
The rest of the manuscript is organized as follows: In Section 2, the full description and formulation of the model is stated. Section 3 establishes the model positivity and the invariant region. In addition, the sensitivity analysis of the parameters is demonstrated and the local and global stability of the Disease Free Equilibrium (DFE), calculations are done to determine the reproduction and disease-free numbers. Section 4 is devoted to the optimal control model formulation and its analysis. Section 5 dwells on on the numerical simulation and calibration of the model. Our conclusions and discussions are provided in Section 6.
2 Model formulation and description
We divided the population denoted by N(t) according to the infection status into S(t)- susceptible, I(t)- infected, R(t)- recovered, and H(t)- hospitalized individuals at given time t.
Moreover, C(t) is the amount of concentration of V. cholerae in an environment at time t.
The population in the susceptible compartment will be increased with a recruitment rate of Π and from recovered population at the immunity loss rate η. However, its number decreases due to natural death at a rate μ and infected compartment with a force of infection that uses standard incidence rate of infection between humans and Hollying type II functional response for food or water contaminated with bacteria, which is given by , where a is concentration of V. cholerae in the contaminated environment. The population in the infected compartment will be increased by the contact rate of λ and also its number decreases by the natural causing death rate of μ, cholera causing death rate τ, and moving to the hospitalized compartment with the treatment rate of (1 − α)ω and the remaining αω proportion get the recovered sub-population. The population in the hospitalized compartment increases from the infected compartment with the treatment rate of (1 − α)ω and decreases as a result of treatment with the recovery rate of φ and the natural causing death rate of μ. The population in the recovered compartment also increases as the recovery from the hospitalized sub-population increases at a treatment rate of φ and from infected individuals at a rate recovery αω, but its number decreases by the natural causing death rate of μ and loss of immunity at a rate of η. Infected individuals in the community shed the pathogen population of V. cholera into the aquatic environment at a rate of σ and at the rate of ϑ V. cholera pathogen population dies and leave the community. Table 1 shows the description of model parameters.
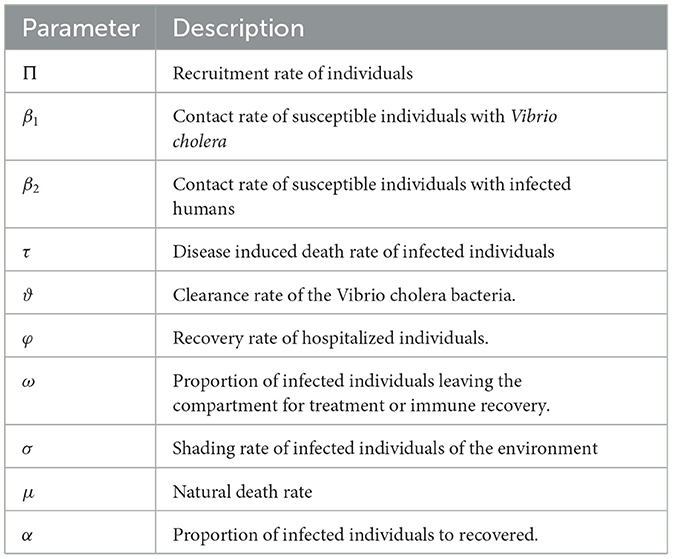
Table 1. Description of parameters of the model (1).
With regards to the above assumptions, the model is governed by the following system of differential equation:
with the initial condition
3 Model analysis
3.1 Positivity of solutions
Theorem 3.1. If S(0) > 0, I(0) ≥ 0, H(0) ≥ 0, R(0) ≥ 0, C(0) > 0 are positive in the feasible set Ω, then the solution set (S(t), I(t), H(t), R(t), C(t)) of system (1) is positive for all t ≥ 0.
Proof. We let for all ν ∈ [0, t]}. Since S0(t) > 0, I0(t) ≥ 0, H0(t) ≥ 0, R0(t) ≥ 0 and C0(t) ≥ 0, hence . If , then automatically S0(t) or I0(t) or H0(t) or R0(t)or C0(t) is equal to zero at . Taking the first equation of the model
Let , it follows that,
which can be written as
Hence,
Therefore,
From the second equation of the system (1)
Integrating both sides of this inequality and applying the technique of separation of variables along with initial condition for Equation 7 yields,
Similarly
Therefore, for all non-negative starting conditions, all solutions of system 1 remain non-negative.
3.2 Invariant region
Let us determine a region in which the solution of model 1 is bounded. For this model the total population is N(S(t), I(t), H(t), R(t)) = S(t)+I(t)+H(t)+R(t) and C(t). Then, differentiating N with respect to time we obtain:
If there is no death due to the disease, we get
Let N*(t) be the solution of the ODE in Equation 10. Thus, Equation 10 has a unique solution with initial value N*(0) and applying separation of variable on the differential equation, we get
We now apply the comparison theorem [27] on the differential Equation 11 and then N(t) ≤ N*(t). Thus,
and evaluating it as t → ∞, the population size .Therefore,
On the other hand, if the solution decrease to as t → ∞. Similarly, from the last equation of the model 1, we have
Thus
and as t → ∞, . Hence,
Hence, the invariant region and the biologically feasible region for the model 1 is given by:
Therefore, every solution of the differential equation model with initial conditions in Ω remains Ω ∀t ≥ 0.
3.3 Effective reproduction number and cholera free equilibrium point (DFE)
When there is no disease in the population, that is I = C = 0, the disease free equilibrium occur and is obtained by taking the right side of system of Equation 1 equal to zero. Therefore, the disease free equilibrium point is given by:
We calculate the effective reproduction number of the system by applying the next generation matrix method as laid out in [40]. Considering only the infective compartments in the model equations to compute as F = (I, C), then we have obtained from the system given below:
The Jacobian matrices of F and V at DFE, respectively, is given as
Then, the next generation matrix is computed by:
Therefore, the Effective reproduction number of our model is the spectral radius of the matrix and given by:
where &
is a threshold value that indicates the average number of infections brought about by a single infectious person within a susceptible population as well as the interactions between the susceptible population and the contaminated environment [40].
Theorem 3.2. The DFE point is locally asymptotically stable if and unstable if .
Proof. The Jacobian matrix, evaluated at the disease-free equilibrium E0 is:
From the Jacobian matrix we obtained some of the eigenvalues are −μ, −(μ + η) and −(μ + φ) the other eigenvalues are obtained from characteristic polynomial as
where
and
We applied Routh–Hurwitz criteria and by the principle the polynomial in Equation 18 has strictly negative real root iff ψ1 > 0, ψ2 > 0 and ψ1ψ2 > 0. We see that both ψ1 and ψ2 are positive whenever . Hence, the DFE is locally asymptotically stable if .
Theorem 3.3. The equilibrium point E0 of the model 1 is globally asymptotically stable if otherwise unstable.
Proof. The method proposed by [11] is used to analyze the global stability of the disease-free equilibrium point within the feasible region . The system 1 can be expressed in the form:
where P = (S, H, R), and M = (I, C) which represents the uninfected and infected compartments, respectively. In applying the principle [11], the DFE point of the model is guaranteed to be globally asymptotically stable if Reff < 1 (locally asymptotically stable), and conditions (C1) and (C2) are satisfied. The two conditions (C1) and (C2) are:
C1 : For , P* is globally asymptotically stable.
C2 : for .
with is M-matrix off-diagonal entries of B are non-negative, and is the set at which the system becomes feasible.
The disease-free equilibrium, , is globally asymptotically stable if R0 < 1.
From the system described by Equation 19, we obtain the following:
Based on Equation 20, we have,
The solution to Equation 21, for disease-free variables becomes, . As t goes to infinity, the values of S(t) converge to . Thus, is the globally asymptotically stable equilibrium point for Equation 21. As a result, condition C1 is satisfied.
The disease class differential equation in Equation 19 can be expressed as follows:
where
Thus, Ŵ(P, M) ≥ 0, for and . Furthermore, the nonnegativity of the off-diagonal entries implies that B is an M-matrix. This also suggests that condition C2 is satisfied. Therefore, the disease-free equilibrium is globally asymptotically stable whenever R0 < 1.
3.4 Sensitivity analysis
In this section, we have done the sensitivity analysis to identify parameters that have an impact in the transmission of cholera. We used the normalized sensitivity index definition as defined in [8] as it is done in [2, 3]. The normalized forward sensitivity index of a variable, , that depends differentiable on a parameter, p, is defined as:
for p represents all the basic parameters. Here we have . For the sensitivity index of to the parameters:
Figure 1 shows the reproduction number's sensitivity indices in relation to the basic parameters.
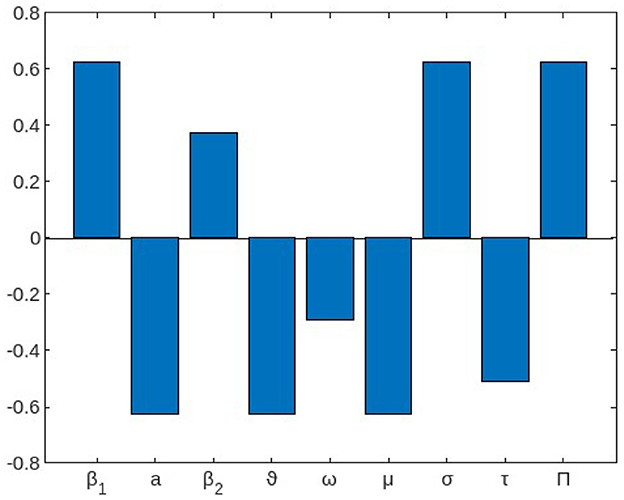
Figure 1. The local elasticity indices of with respect to parameters of the model (1).
From this result, we should work to reduce the rate of intake of V. cholera from the environment (β1) and contact with infected person (β2) as well as increasing the shading rate of the infected individuals to V. cholera in the environment(σ), which increases the reproduction number when an incremental work in their value is done while increasing those parameters with negative indices such as increasing the rate of treatment (ω) of infected individuals from cholera and increasing a mechanism of clearance rate (ϑ) of V. cholera decreases the reproduction number of cholera infection in the community.
To mitigate the transmission risk, concerted efforts should be directed toward minimizing the intake of V. cholera from the environment (β1) and limiting contact with infected individuals (β2). Simultaneously, a reduction in the prevalence of V. cholera in the environment, achievable through effective shading measures, contributes significantly to diminishing the reproduction number. Strategic interventions yielding negative impacts on the reproduction number involve enhancing the treatment rate (ω) among individuals afflicted with cholera. Additionally, augmenting the mechanism of clearance rate (ϑ) for V. cholera is identified as a pivotal parameter that decisively curtails the reproduction number.
4 The optimal control problem
In this section, we explore the dynamics of the optimal control model system utilizing the optimal control theory. Our objective is to lower the rate of cholera incidents while simultaneously lowering the expenses associated with it. Now we introduced the time dependent controls in the model 1 for the aim of controlling cholera and study the strategies that control the epidemic. We apply optimal control strategies on the model to identify the best intervention to reduce the disease in the specified time. The optimal control model is an extension of the cholera model in Equation 1 by including the following five controls defined as: (i) the use of vaccination into communities, as an effective time-dependent control measure u1; the water quality improvement program as control u2; and another preventive measure control as the implementation of proper hygiene, u3, in order to control person-to-person contact; implementation of immunity loss control effort that is treatment of the infected and hospitalized individuals denoted by u4; and sanitation of the environment denoted by u5 for the control of the disease.
After incorporating, ui, i = 1, ..., 5 in cholera model Equation 1, we obtain the following optimal control model of cholera disease:
The purpose of introducing controls in the model is to find the optimal level of the intervention strategy preferred to minimize the spread of infection and cost of implementation of the control. The control variables u1, u2, u3, u4, and u5 are minimized subject to the differential Equation 26 and formulate the objective functional as
where tf is the final time, a1, a2 and a3 are weight constants of the infected human and cholera concentration, respectively, while wi, i = 1, ..., 5, are weight constants for each individual control measures. We choose a nonlinear cost on the controls based on the assumption that the cost take nonlinear form as applied in [24, 37]. Optimal control function () need to be found such that
where U = {(u1, u2, u3, u4, u5) |ui(t) is lebesgue measurable on [0, tf], 0 ≤ ui(t) ≤ 1, i = 1, ..., 5} is the closed set.
4.1 Existence of an optimal control
Theorem 4.1. Given J(u1, u2, u3, u4, u5) subject to system Equation 26, then there exist optimal controls and them corresponding optimal solution (S*, I*, H*, R*, C*), that minimizes J(u1, u2, u3, u4, u5) over U.
Proof. To verify the following basic conditions required for the set of admissible controls U, we can use the theorem stated in [18].
H1: The set of the model state variables to the system 26 that correspond to the control functions in U is non-empty.
H2: The control set U is closed and convex.
H3: Each right hand side of the state system is continuous, is bounded above by a sum of the bounded control and the state and can be written as a linear function of u = (u1, u2, u3, u4, u5) with coefficients depending on time and the state.
H4: The integrated of the objective functional given by Equation 27 is convex.
H5: There exist constants D1, D2 > 0, and β > 1 such that
such that the integrand of the objective functional satisfies g.
The first required condition (H1) can be verified by using Picard-Lindelfs theorem stated in [15, 22]. If the solutions to the model state equations solutions are bounded, continuous and satisfies Lipschitz conditions in the model state variables, then there is a unique model solution corresponding to each admissible control U. We have proved that the total human population and the amount of concentration of V. cholerae in an environment at time t, respectively, by , and, also each of the model state variables is bounded. The model state variables are continuous and bounded. Similarly using the method applied in [14], we can prove the boundedness of the partial derivatives with respect to the state variables in the model, which establishes that the model is Lipschitz with respect to the state variables. This completes the verification that condition H1 holds.
By applying definition stated by [18], the control set U is convex and closed this proved the required condition H2. That is, consider
Moreover, for any two points y, z ∈ U such that y = (y1, y2, y3, y4, y5) and z = (z1, z2, z3, z4, z5).
Then for any λ ∈ [0, 1], it follows
This implies that the control set U is convex and closed.
Condition H3 is verified by observing the linear dependence of the model equations on the control variables (u1, u2, u3, u4, u5). To prove the boundedness, we use the method in [10]. To end this, we use the fact that the super solutions of system Equation 10 given by
The system is linear in finite time with bounded coefficients, then the supersolutions , and are uniformly bounded. Since the solution to each state equation is bounded, we see that
where M1, M2, M3, and M4 depend on the coefficients of the system. Thus, the assumption holds. Eventually, to justify the required condition H4 use definition stated in [6, 33] that says any constant, linear and quadratic functions are convex. Hence, since the integrand of the objective functional given by
is a quadratic function that is convex on U. To show the bound on L(x, u, t) we want to prove for any θ ∈ (0, 1) and u = (u1, u2, u3, u4, u5) v = (v1, v2, v3, v4, v5) are in U such that
where,
and
Now
Hence, (1 − θ)L(t, x, u) + θL(t, x, u) ≥ L(t, x, (1 − θ)u + θv) Therefore, L(t, x, u) is convex. Finally,
The after some simplification we have determined the result given by
where, , and D2 > 0, u = (u1, u2, u3, u4, u5), and β* = 2.
This completes the proved. Therefore, the optimal control u exists.
4.2 Characterization of the optimal controls
In order to create an optimality system, we need to first establish the essential requirements that the optimal control and state must meet. All of these situations derive from Pontryagin's Maximum Principle [34]. This principle converts the system of Equations 26, 27 into a problem of minimizing point-wise a Hamiltonian (M), with respect to ui(t), i = 1, ..., 5 as
where λi, i = 1, ..., 5 are the adjoint variable functions to be obtained properly by applying Pontryagin's maximal principle [34].
Theorem 4.2. For an optimal control set u1, u2, u3, u4, u5 that minimizes J over U, there is an adjoint variables, λ1, ..., λ5 that satisfy the adjoint system given by:
With transversality conditions, λi(tf) = 0, i = 1, ..., 5. Furthermore, we obtain the control set characterized by
Proof. The adjoint equation and transversality conditions are standard results obtained from Pontryagin's maximum principle [34]. We differentiate Hamiltonian with respect to states S, I, H, R, and C, respectively, and applying adjoint variable conditions, we obtain the following equations:
With transversality conditions,
Also We determined the optimal conditions using and can be written in compact notation
The optimality system is formed from the optimal control system (the state system) and the adjoint variable system by incorporating the characterized control set and initial and transversal condition.
4.3 Uniqueness of the optimality system
We obtained the uniqueness of solutions of the optimality system in Equations 26, 30 for the small time interval from the analytical boundedness of the solutions of both the state and adjoint functions and the resulting Lipschitz structure of these equations. Hence the following theorem:
Theorem 4.3. For t ∈ [0, tf], the bounded solutions to the optimality system are unique. Refer the paper [19], for the proof of the theorem.
5 Numerical simulations and discussions
We perform some numerical simulations of system 1 to support our theoretical findings. We employed Maple software for simulation of the model in Equation 1 and done with ODE45. Using the parameter values from Table 2, and the initial conditions S(0) = 1000, I(0) = 100, H(0) = 0 R(0) = 10, C(0) = 100. For model 1, we considered three different initial conditions in order to investigate our theoretical results given as follows:
IC1 : (S(0), I(0), H(0), R(0), C(0)) = (1000, 100, 10, 0,100),
IC2: (S(0), I(0), H(0), R(0), C(0)) = (1200, 200, 50, 15,200),
IC3: (S(0), I(0), H(0), R(0), C(0)) = (1500, 300, 100, 30,300).
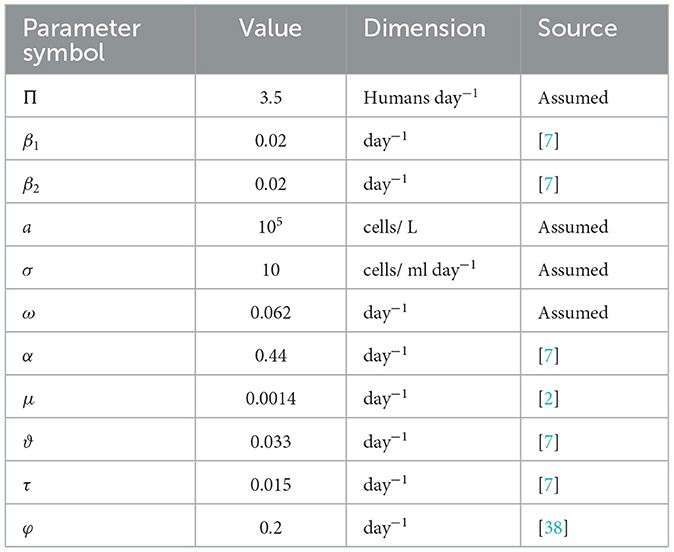
Table 2. Parameters of the model, providing their values and descriptions in Equation 1.
5.1 Numerical simulation of the model without control
Figures 2A–E demonstrate that when the susceptible individuals S(t) and H(t) get to their normal value, while I(t), R(t), C(t) approach zero as time increases for all initial conditions IC1 − IC3. This means that the disease dies out from the community. Then, the unique disease-free equilibrium is globally asymptotically stable and this result confirms Theorem 3.3.
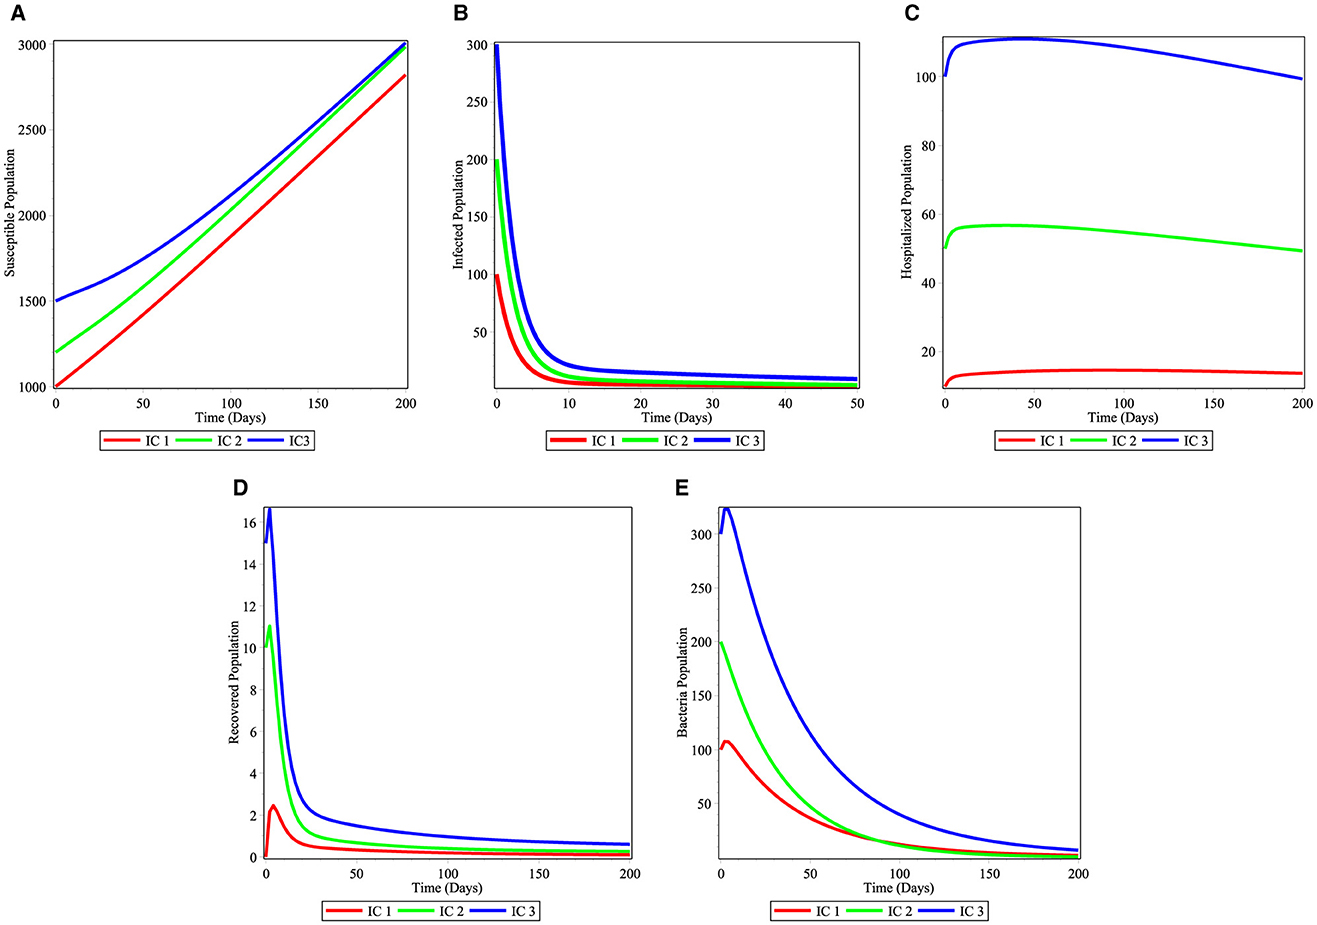
Figure 2. Simulations of the cholera model for the stability of disease free equilibrium point: (A) Susceptible individuals; (B) infected individuals; (C) hospitalized individuals; (D) recovered individuals; and (E) bacterial population.
When the basic reproduction number is calculated , the solutions of the system starting from the three initial conditions IC1 − IC3 converge to the endemic equilibrium E* = (1000, 250, 1200, 25, 800) as it is shown in the Figures 3A–E. Hence, E* exists and it is globally asymptotically stable. In this situation the disease will become endemic.
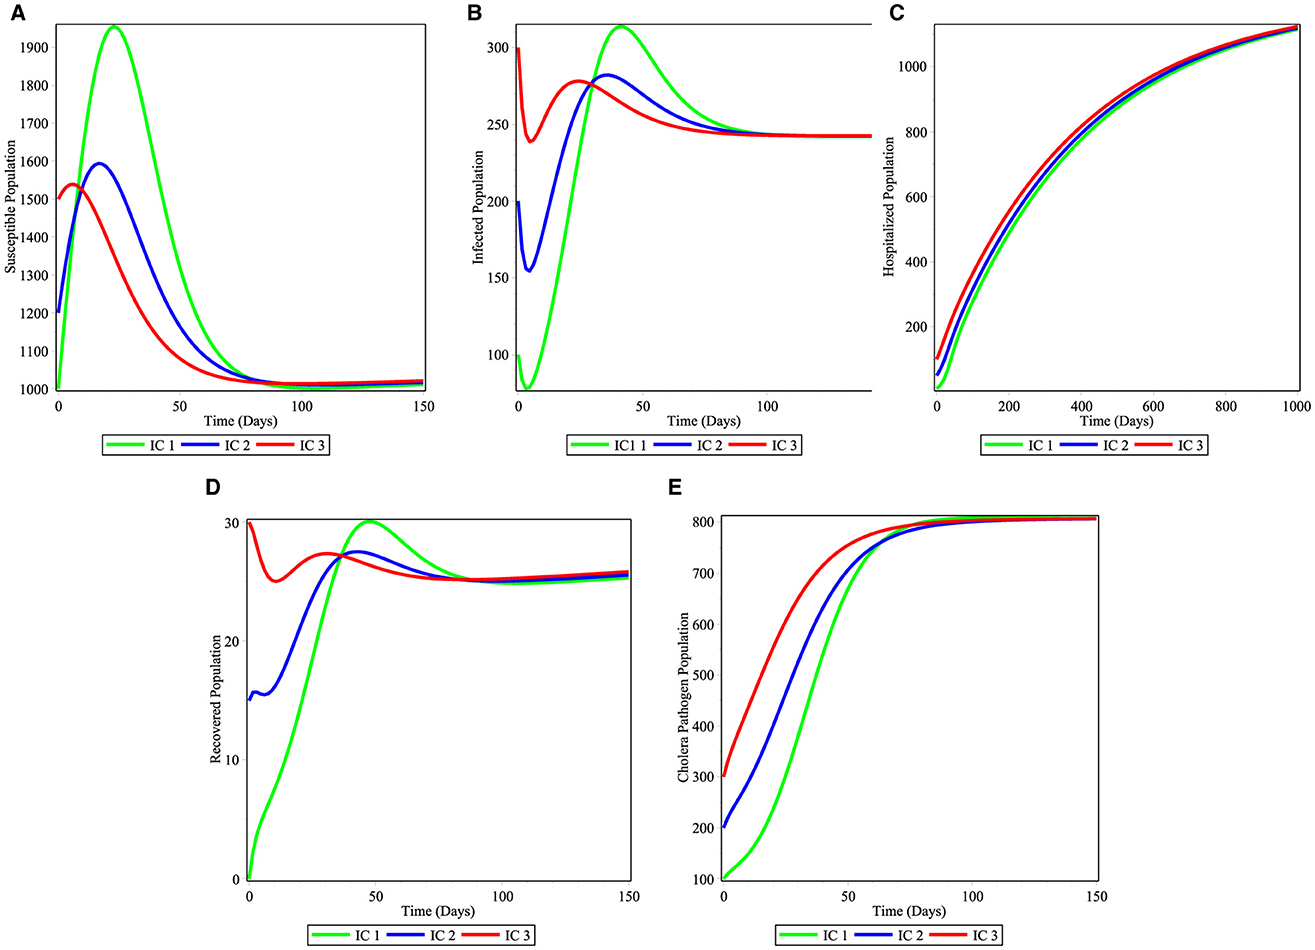
Figure 3. Simulations of the cholera model for the stability of endemic equilibrium point: (A) Susceptible individuals; (B) infected individuals; (C) hospitalized individuals; (D) recovered individuals; and (E) bacterial population.
In Figures 4A–C, we have seen the effect of varying the contact rate of susceptible individuals with the V. cholera in the environment β1. As the value of β1 increases from 0.01 to 0.04 the infected population (Figure 4A), hospitalized individuals (Figure 4B), and bacteria in the environment (Figure 4C) increases in their number as time runs. This is therefore, stakeholders should work on mechanisms to fight against to infectious disease.
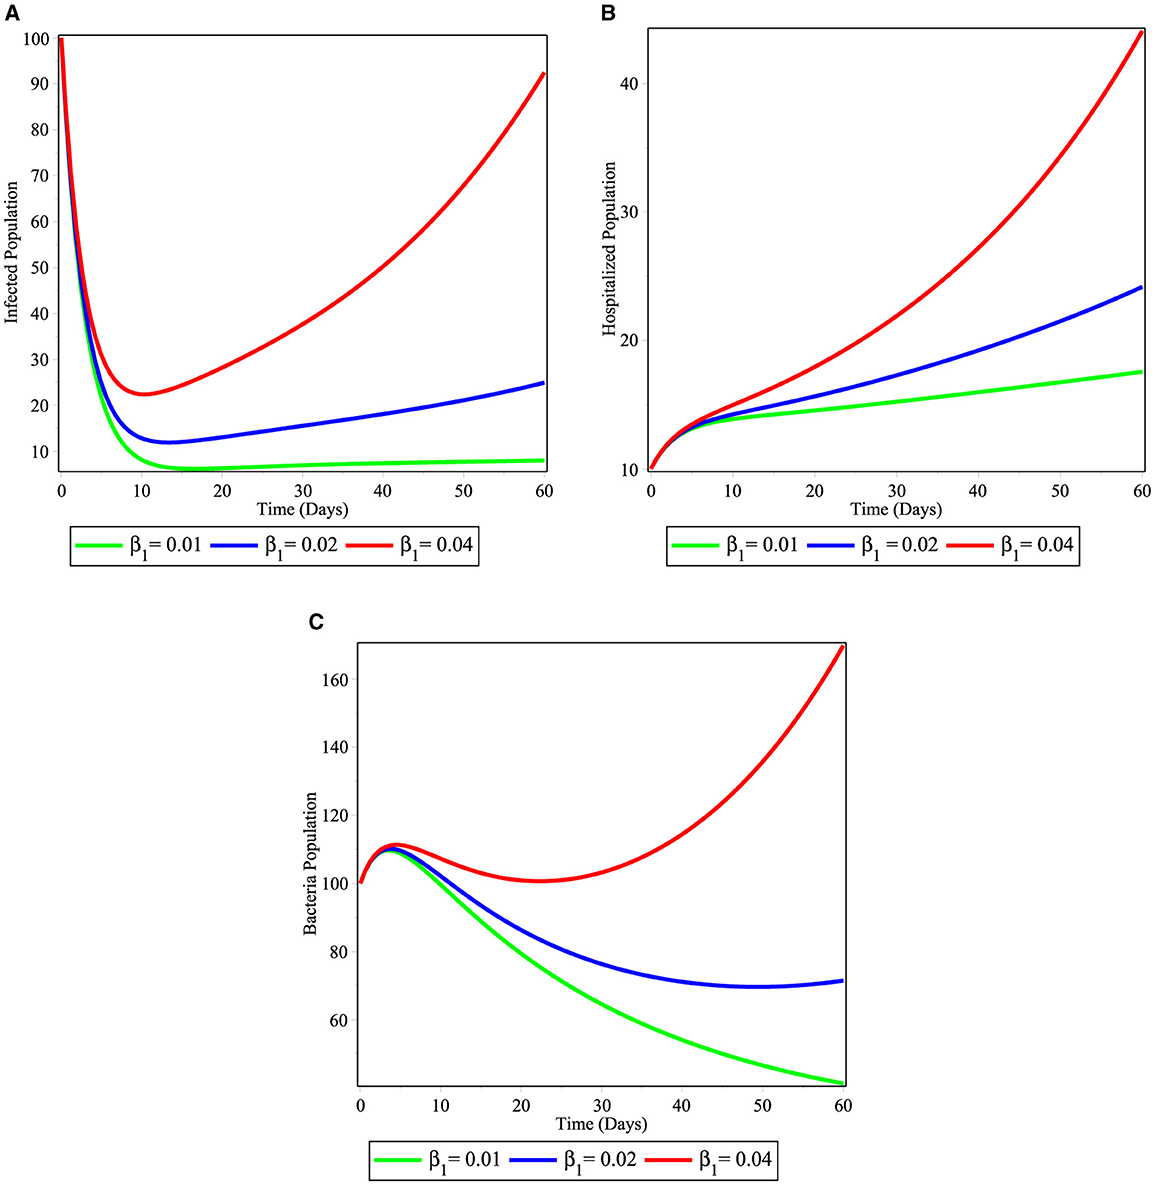
Figure 4. Simulations illustrating the changing effect of β1 on the model (2); (A) infected individuals; (B) hospitalized individuals; and (C) bacterial population.
Figures 5A–C, showed the effect of considering different value of contact rate of susceptible population with infected human population β2. We observed from the simulations that the infected population (Figure 5A), hospitalized individuals (Figure 5B), and bacteria in the environment (Figure 5C) increases in their number as time runs as the infection rate β2 varies from 0.02 to 0.08. Therefore, this requires us to work on intervention strategy in order to decrease the contact between susceptible and infectious human population in the community.
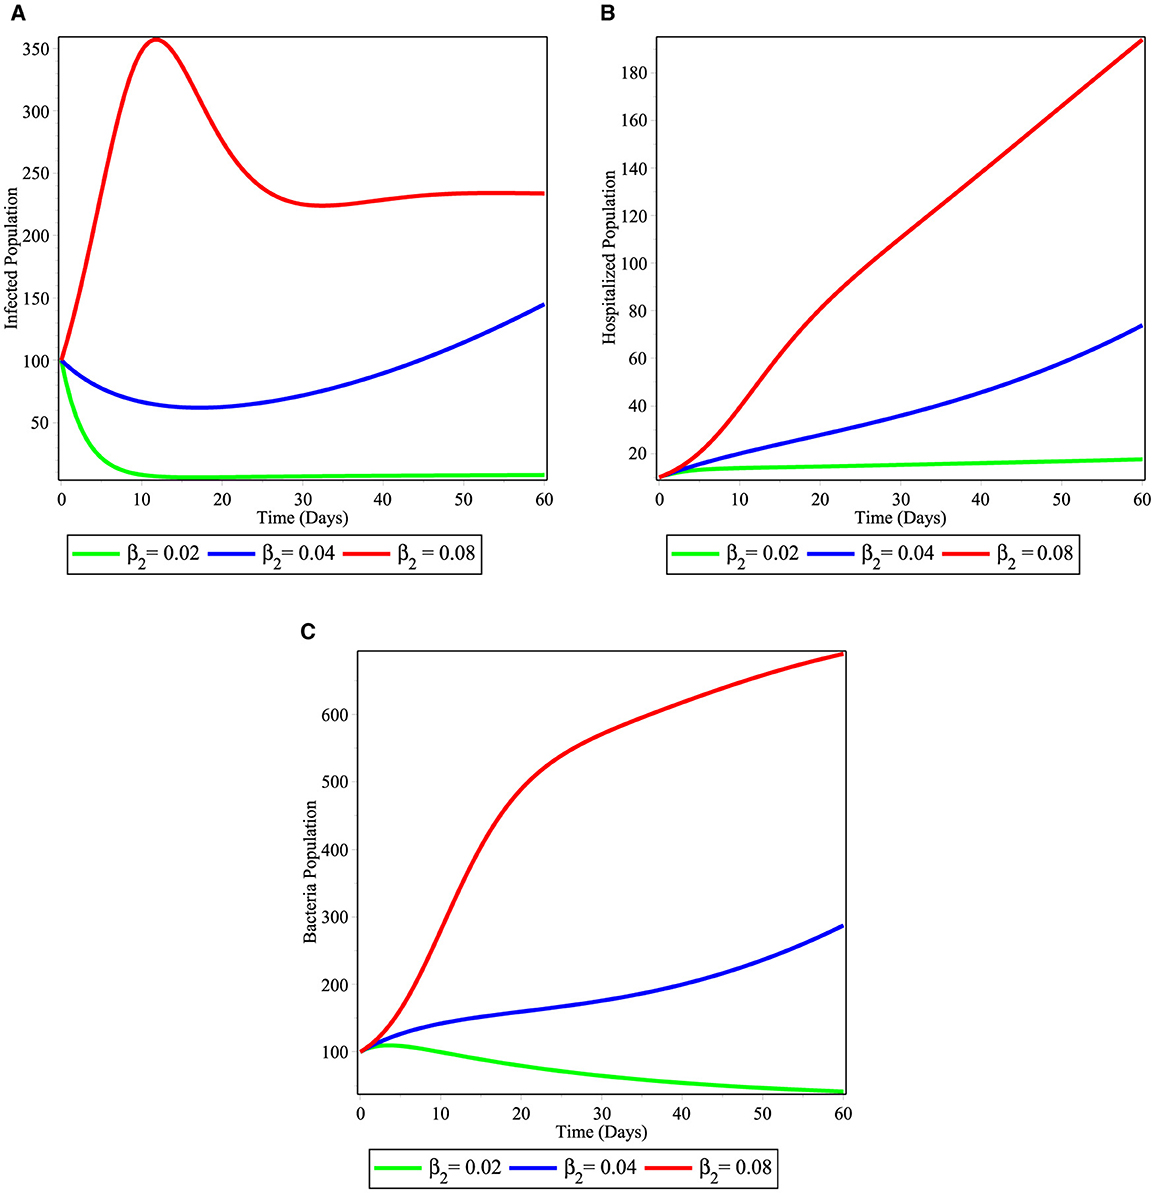
Figure 5. Simulations illustrating the changing effect of β2 on the model (2); (A) infected individuals; (B) hospitalized individuals; and (C) bacterial population.
In the Figures 6A–C, we demonstrated the significance of varying the recovery rate ω either through hospitalized treatment or through natural immunity of infected individuals in the community. From the simulation, it is observed that increasing the immunity of infected individuals reduces the number of infected individuals as shown in Figure 6A and it again decreases the number of bacterial population in the community as shown in Figure 6B. This is, therefore, bringing mechanisms that increases the immunity of the infected population is an important strategy to reduce the cholera disease from the community.
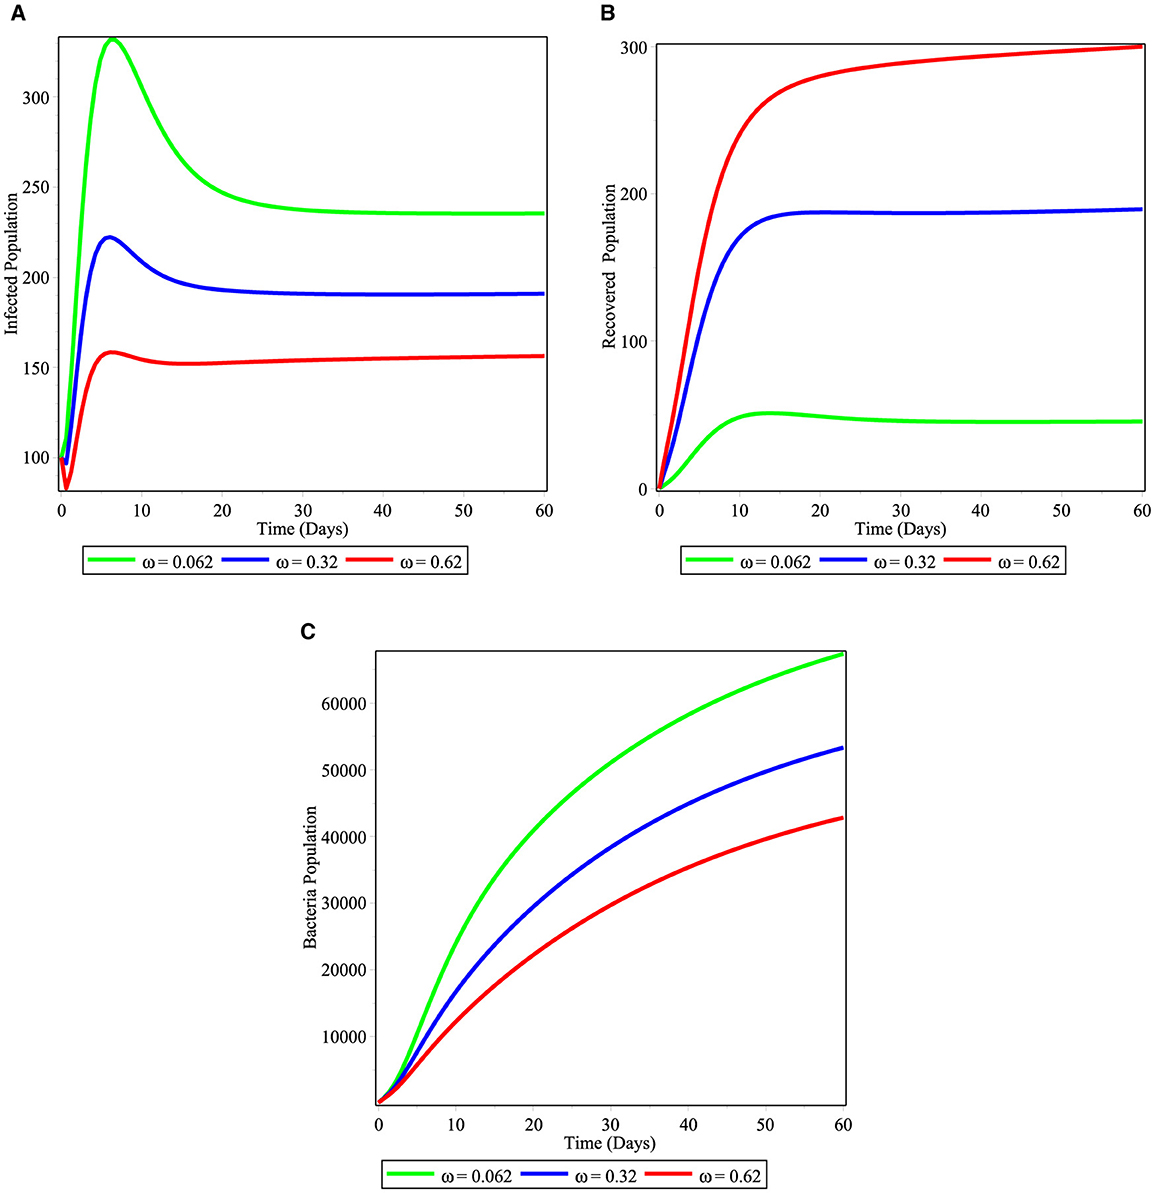
Figure 6. Simulations illustrating the changing effect of ω on the model (2); (A) infected individuals; (B) hospitalized individuals; and (C) bacterial population.
In Figures 7A–C, we showed the sensitivity of shading rate of infectious individuals to cholera pathogen in the environment σ. As the shading rate value of σ increases from 2 to 15 the cholera pathogen in the environment increases as shown in Figure 7C. This pathogen increment again increases the number of infected population as it is depicted in the Figure 7A and hospitalized populations in the Figure 7B. Therefore, it is important to reduce the shading rate of infectious individuals in the environment to reduce the disease burden in the community.
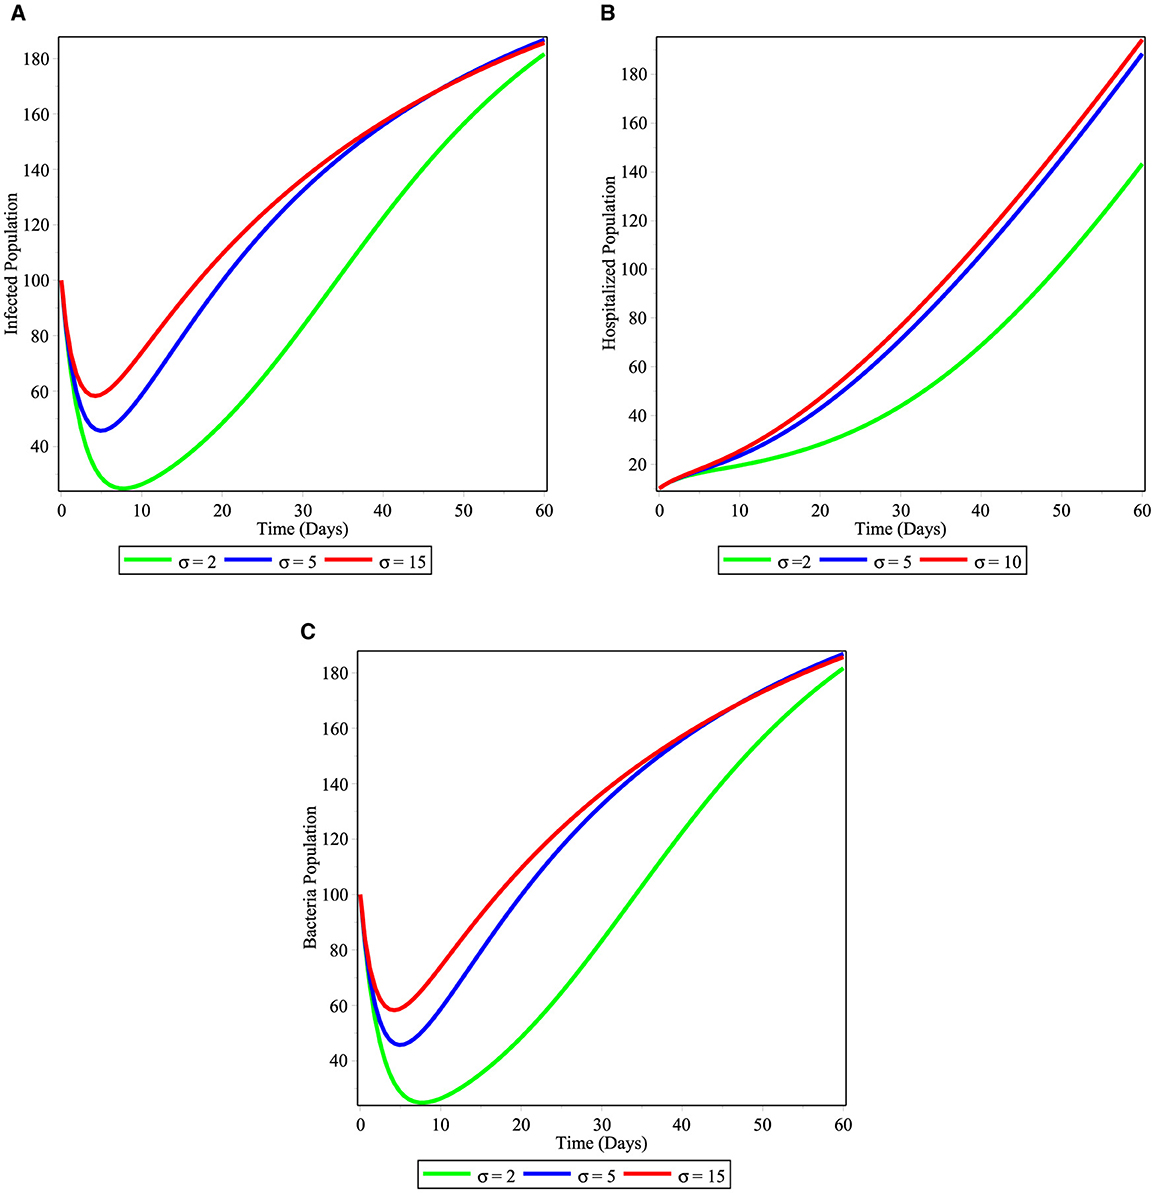
Figure 7. Simulations illustrating the changing effect of σ on the model (2); (A) infected individuals; (B) hospitalized individuals; and (C) bacterial population.
5.2 Numerical simulation of the optimal control model
To investigate the efficacy of the control measures in slowing of the progress, we compare the computational results of the autonomous model 1 with the established model (26). We accomplished this by using an iterative technique known as the forward-backward sweep method, which is based on the Matlab program's fourth-order Runge-Kutta Method (FORKM), which is explained in detail in a book by Lenhart and Workman [29]. In order to solve the state equations across the interval [0, 10] using forward FORKM, we start the process by estimating the control variables. Afterward, we use the current iteration solution of (2) to apply the backward FORKM to solve the adjoint equations. Until the necessary convergence happens, the task is repeated to modify the control values by averaging the prior value and the new value from the control characterization (Equation 32). Table 2 lists the parameter values that were used in the simulations.
A numerical demonstration of the optimal control problem solution mentioned in System 30–32 and parameters in Table 2. We investigate and compare the numerical findings about the effectiveness of controls on the spreading of cholera among communities.
(i) Scenario A (using combinations of two controls):
-Strategy 1: Applying u1 ≠ 0, u2 = 0, u3 = 0, u4 = 0, u5 ≠ 0
-Strategy 2: Applying u1 ≠ 0, u2 = 0, u3 = 0, u4 ≠ 0, u5 = 0
-Strategy 3: Applying u1 = 0, u2 ≠ 0, u3 ≠ 0, u4 = 0, u5 = 0
-Strategy 4: Applying u1 = 0, u2 = 0, u3 = 0, u4 ≠ 0, u5 ≠ 0
(ii) Scenario B (using three controls)
-Strategy 5: Applying u1 ≠ 0, u2 ≠ 0, u3 = 0, u4 = 0, u5 ≠ 0
-Strategy 6: Applying u1 ≠ 0, u2 ≠ 0, u3 ≠ 0, u4 = 0, u5 = 0
-Strategy 7: Applying u1 = 0, u2 ≠ 0, u3 ≠ 0, u4 ≠ 0, u5 = 0
-Strategy 8: Applying u1 = 0, u2 ≠ 0, u3 ≠ 0, u4 = 0, u5 ≠ 0
(iii) Scenario C (using four controls)
-Strategy 9: Applying u1 ≠ 0, u2 = 0, u3 ≠ 0, u4 ≠ 0, u5 ≠ 0
-Strategy 10: Applying u1 ≠ 0, u2 ≠ 0, u3 ≠ 0, u4 = 0, u5 ≠ 0
-Strategy 11: Applying u1 = 0, u2 ≠ 0, u3 ≠ 0, u4 ≠ 0, u5 ≠ 0
-Strategy 12: Applying u1 ≠ 0, u2 ≠ 0, u3 ≠ 0, u4 ≠ 0, u5 = 0
(iv) Scenario D (using all controls)
-Strategy 13: Using all controls means u1 ≠ 0, u2 ≠ 0, u3 ≠ 0, u4 ≠ 0, u5 ≠ 0
5.3 Scenario A: apply double controls of triple controls
Under Scenario A, we consider combinations of two controls. Numerical simulations are showed in Figures 8A–C. Figure 8A shows that controls with vaccination and treatment of cholera infected individuals (Strategy 2) and treatment of infected individuals and next chemical control on V. cholera bacterial in the environment (Strategy 4) are effective in controlling the disease at the specified time. Here Strategy 2 has a potential of decreasing the number of cholera-infected populations from the community before 4 months. Figure 8B shows that controls with vaccination and treatment effort for cholera disease (Strategy 2) decreases the number of hospitalized individuals and next to it Strategy 4 is effective in the specified time. Figure 8C shows that the Strategies 4 and 6 have more potential to decrease number of V. cholera population bacteria in the environment under the scenario A. In general, we conclude that applying an optimized controls Strategies 2 or 4 can eradicate cholera diseases from the community in a specified period of time.
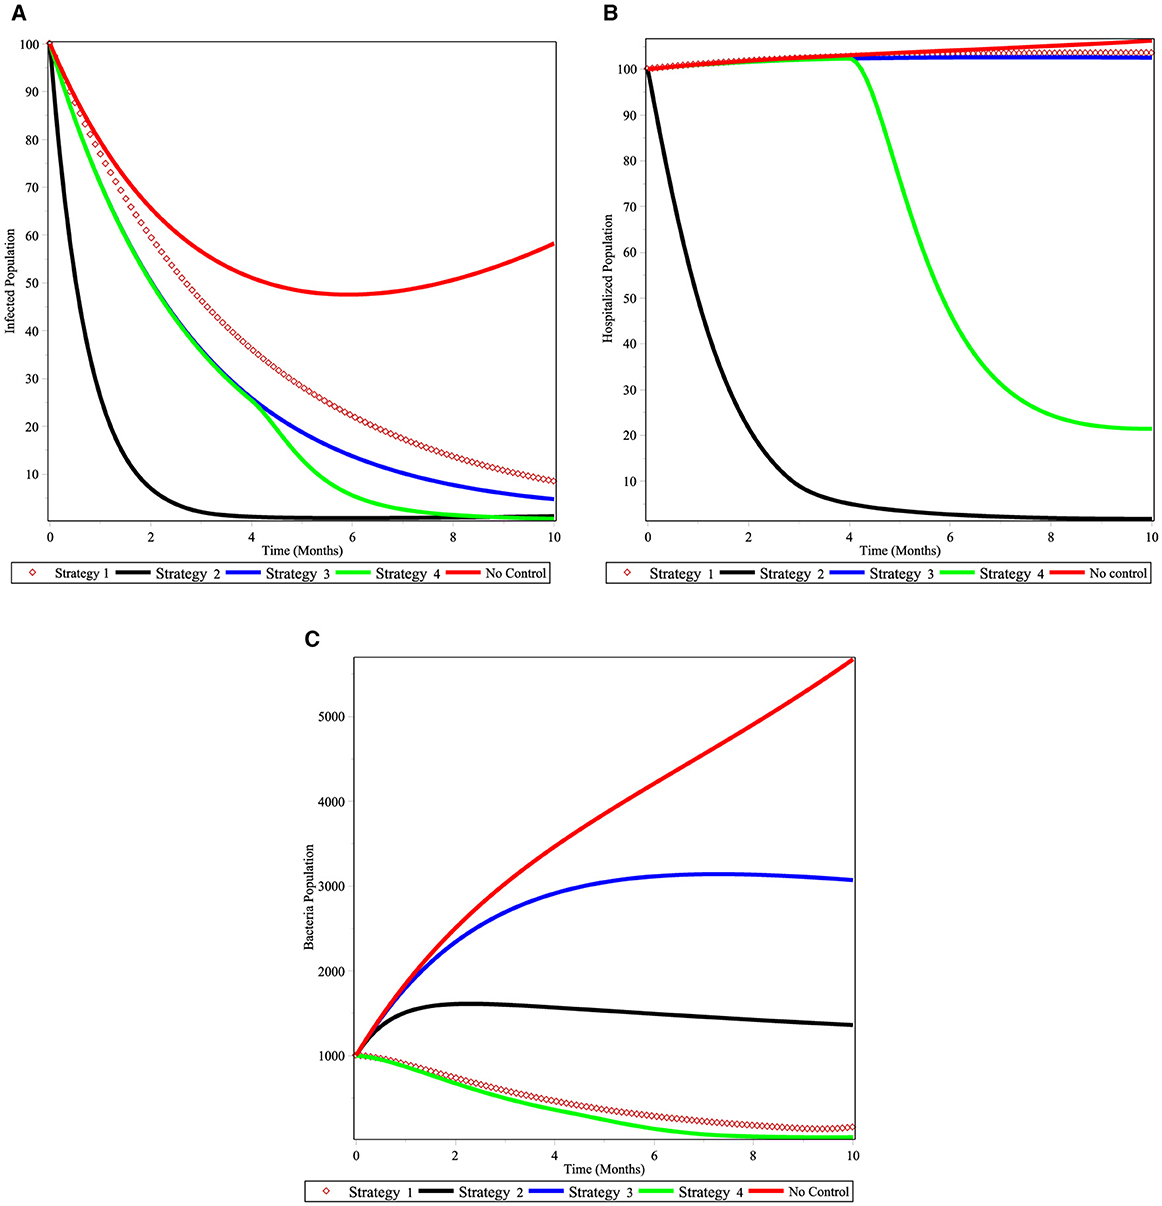
Figure 8. Simulations of the cholera model with controls for scenario A. (A) infected individuals; (B) hospitalized individuals; and (C) bacterial population.
5.4 Scenario B: apply triple controls
We examine three control combinations under Scenario B. In Figures 9A–C, numerical simulations are displayed. Figure 9A demonstrates that strategies 7, which involve prevention strategies for susceptible population and treatment of cholera-infected people, are successful in controlling the disease within the allotted period. Here, Strategy 5 may be able to reduce the community's cholera-infected individuals using vaccination, prevention of susceptible and V.cholera strategies, and application of chemical control V. cholera population. From the Figure 9B shows that controls with prevention strategies for susceptible population and treatment of cholera-infected people is effective for decreasing hospitalized population and next to it, strategy 5 is effective in controlling the disease at a specified time. Figure 9C shows that the Strategies 7, 5, and 8 have more potential to decrease number of V. cholera population in the environment under the scenario B. In general, we conclude that applying an optimized control strategy 7 can eradicate cholera in a specified time.
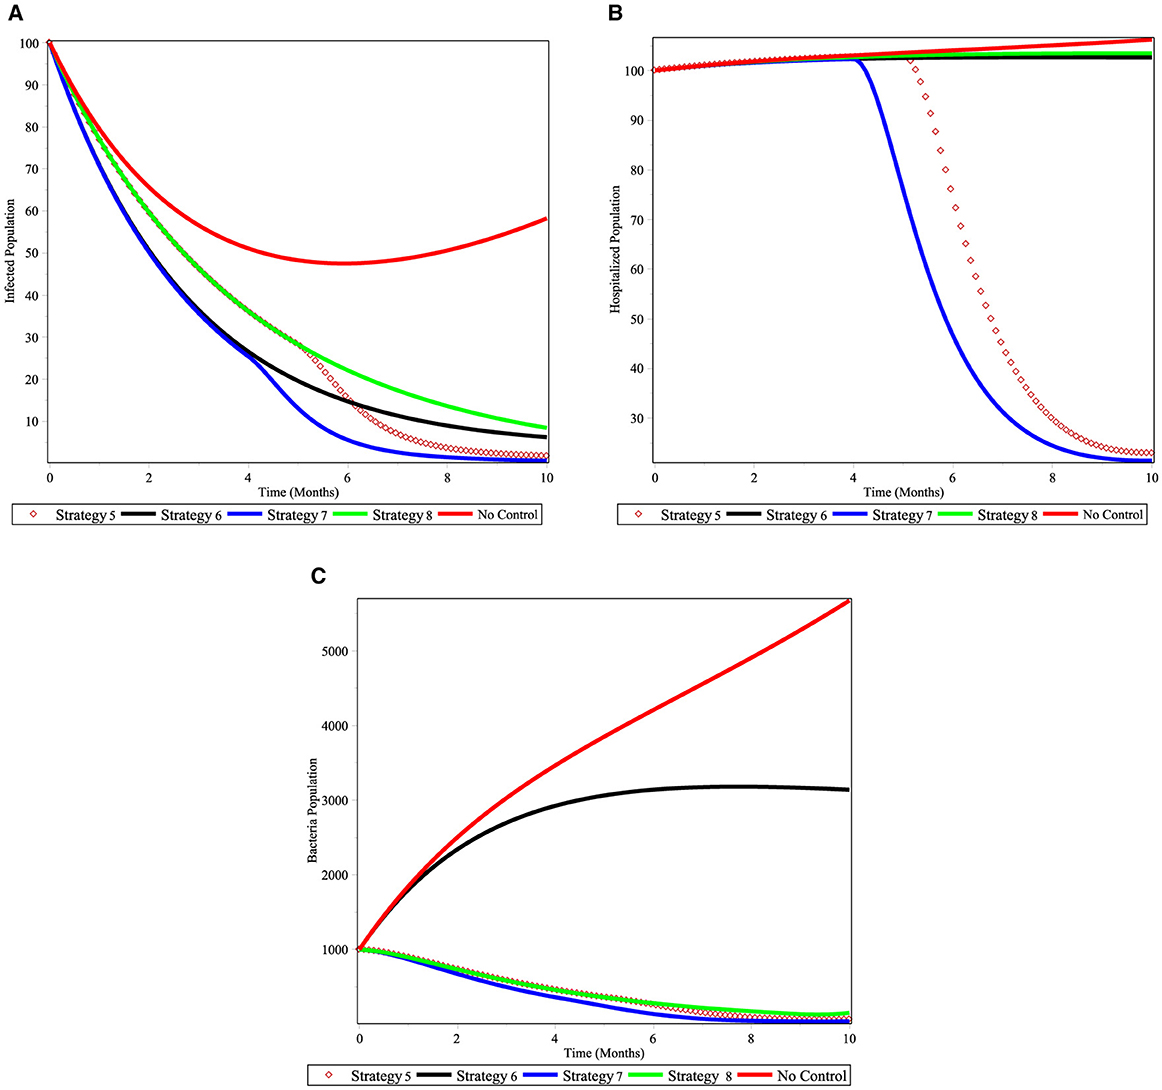
Figure 9. Simulations of the cholera model with controls for scenario B. (A) infected individuals; (B) hospitalized individuals; and (C) bacterial population.
5.5 Scenario C: apply quadruplet controls
Under Scenario C, we look at four different control combinations. Numerical simulations are shown in Figures 10A–C. As seen in Figure 10A, approach 12, which focuses on vaccination prevention and treatment control, together optimize the objective function that reduces the cholera-infected patients, is an optimal effective strategy in controlling the disease within the given time frame. Next to this, Strategy 11 may be able to lower the number of cholera-infected people in the community. Figure 10B shows that hospitalized population decreases with the use of strategy 12 and next to it strategy 11 is effective in controlling the hospitalized population at a specified time. Figure 10C shows that the Strategies 11, 10, and 9 have more potential to decrease number of V. cholera population bacterial in the environment under the scenario C. In general, we conclude that applying an optimized control strategies 11 and 12 have a good approach in reducing the number of cholera infected populations in a specified period of time.
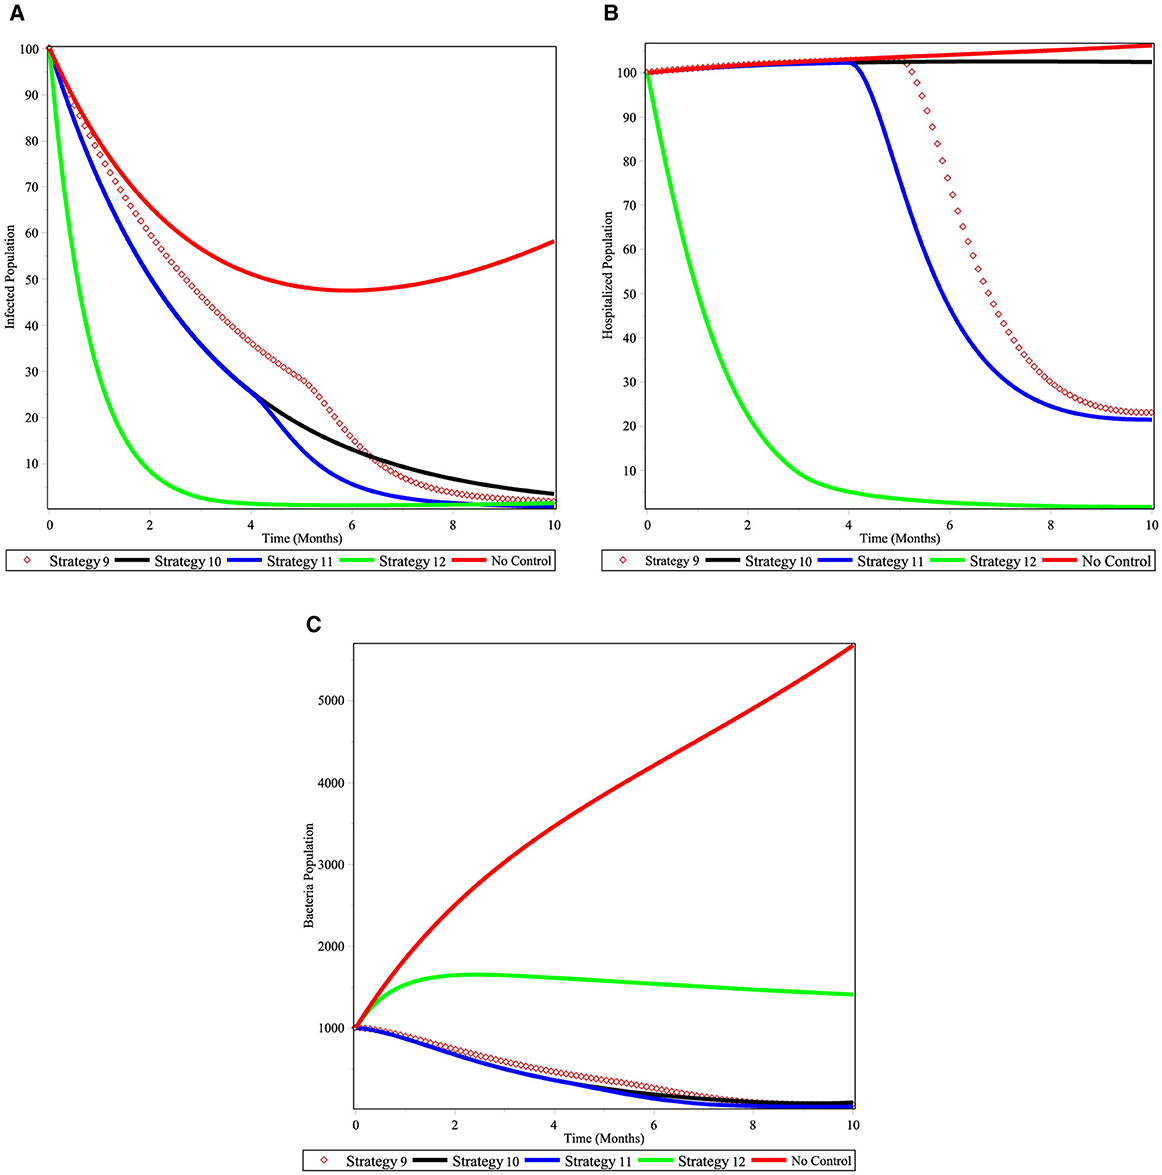
Figure 10. Simulations of the cholera model with controls for scenario C. (A) infected individuals; (B) hospitalized individuals; and (C) bacterial population.
5.6 Scenario D: apply quintuple controls
Under this scenario, we determined the difference between the compartment with control and without control. We considered all controls at the same time. Figure 11A shows that cholera-infected individuals is rapidly decreased when we apply all the controls. Also Figure 11B displays cholera-hospitalized individuals is eradicated in a short time if we apply all controls. From the Figure 11C, we can see that as V. cholrea populations with controls are dramatically decreased.
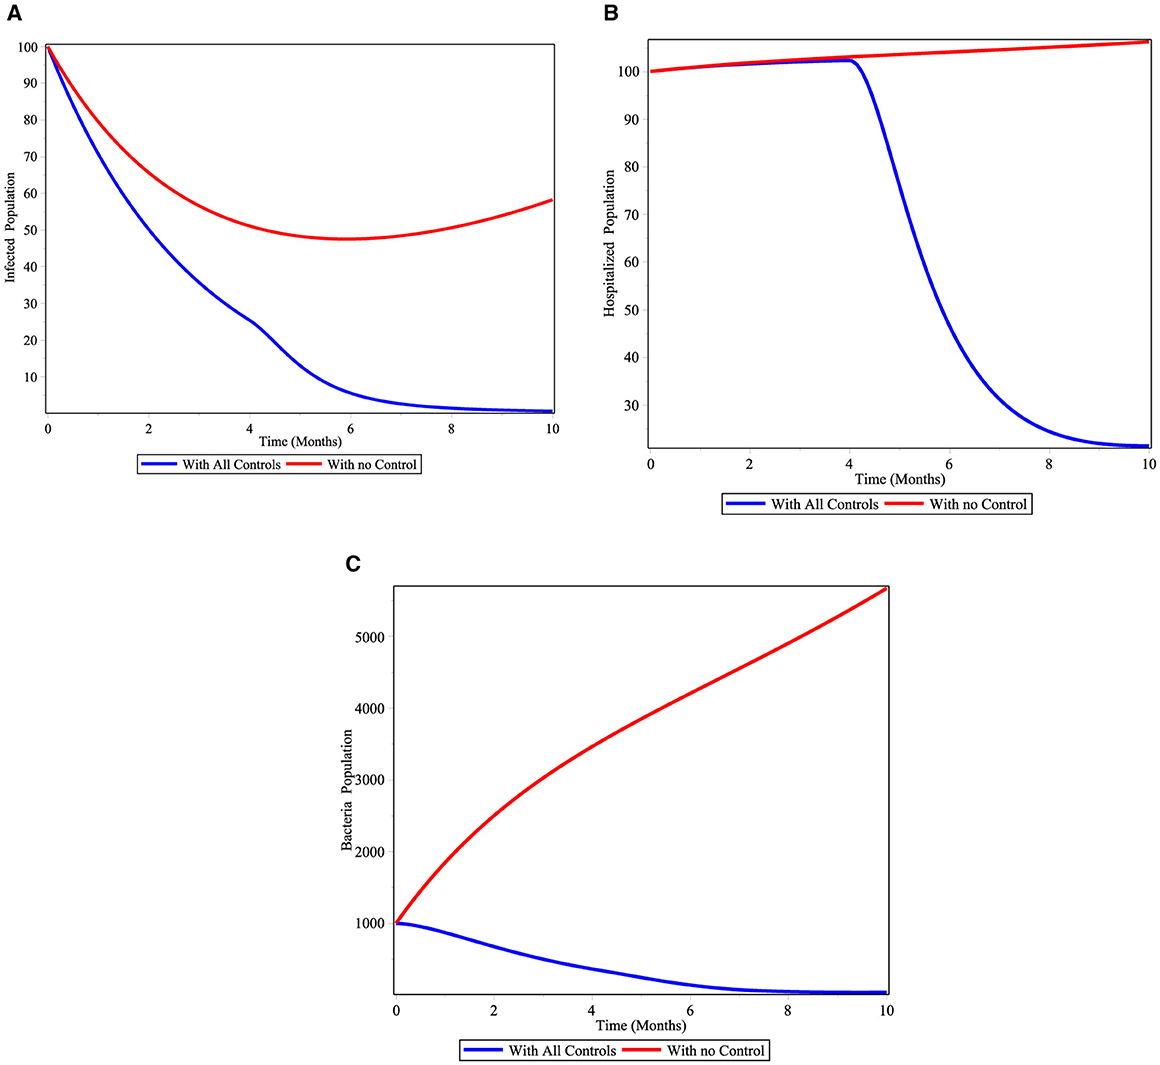
Figure 11. Simulations of the cholera model with controls for scenario D. (A) infected individuals; (B) hospitalized individuals; and (C) bacterial population.
A two control at a time, a combination of three controls at a time, and a combination of four controls at a time, lastly we applied all five control variables. Several combinations of the control variables are compared to determine which combination is most effective in the fight against cholera infection in the community.
The numerical simulation under Figure 12 shows the comparison of the optimal integrated strategies from Scenario A to Scenario D in controlling the cholera disease in the population. Figure 12A shows that strategies 2, 7, and 12 are effective in reducing the infected individuals from the disease and these strategies also give the same effect on the hospitalized individuals as shown in Figure 12B. From Figure 12C, the bacterial population reduced better when we use all the control interventions. In order to tackle cholera infections in the community, the three intervention programs shown in the aforementioned scenarios are the most effective.
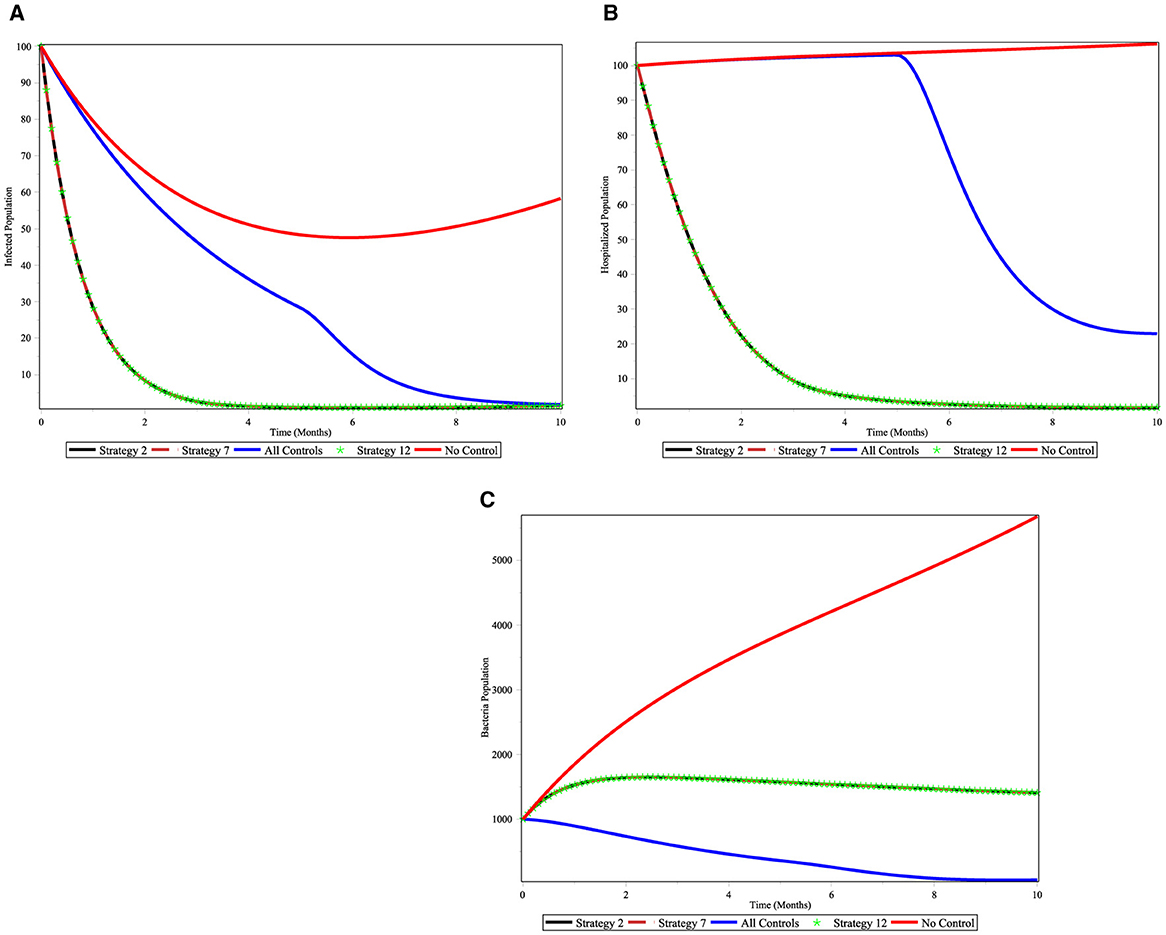
Figure 12. Simulations of comparison of the optimal integrated strategies from scenario A to scenario D, (A) infected individuals; (B) hospitalized individuals; and (C) bacterial population.
6 Discussions and conclusions
The developed deterministic mathematical model of cholera disease dynamics considered both direct and indirect contact transmission pathways, encompassing five compartments: susceptible humans, infectious humans, hospitalized humans, recovered humans, and the V. cholera pathogen in the environment. The qualitative behaviors of the model, including the invariant region, and the existence of a positive invariant solution were studied. Additionally, the basic reproduction number of the model was obtained, providing insights into the potential for disease spread. The stability of disease-free equilibrium point were checked and it is locally asymptotically stable if , this result agrees with the works of [4, 23, 31]. The disease-free equilibrium point is also globally asymptotically stable and this finding is similar with the results in [38].
Furthermore, the study incorporated sensitivity analysis and numerical simulations to enhance our understanding of the model's dynamics. The investigation extended to an optimal control problem, exploring strategies for reducing the number of infected and pathogenic populations while minimizing implementation costs. The optimal control functional involved five controls: vaccination, treatment, environmental sanitation, personal hygiene, and the use of clean treated water.
The existence of optimal controls for the system was demonstrated and the optimal controls were represented in terms of solutions to the optimality system. This comprehensive analysis contributes valuable insights into potential strategies for cholera disease control and prevention. The numerical results reveal that strategy 2 (combined application of vaccination and treatment) from this integrated intervention program the application of vaccination was recommended by the work of [36] and the other component of strategy 2 is the application of treatment intervention agrees with the work of Berhe [7] who uses two interventions: treatment and sanitation. The recommended treatment only is effective. Our results coincide with the treatment intervention proposed by Lemos-Paião et al. [28]. However, they used treatment intervention only for to examine cholera disease control. However, the research work done by He and Wang [23] did not recommend the vaccination intervention even though they recommend treatment intervention with awareness program. Most of the time, a single interventions is not recommended, we recommend strategy 2 in order to reduce the prevalence of cholera disease from the community. The other effective integrated intervention programs to tackle the cholera outbreak is Strategy 7 (the combined application of water quality improvement program, proper hygiene with implementation of treatment to the infected individuals). This integrated intervention agreed with the results of the research work done by He and Wang [23] where they recommend treatment and awareness programs to reduce cholera outbreak in a community. The other significant integrated management approaches designed to tackle the spread of cholera is Strategy 12 (application of vaccination, application of water quality improvement program, proper hygiene with implementation of treatment). This result agrees with the work done in Bakare and Hoskova-Mayerova [5] who recommend strategy 12 except vaccination program, which is due to the reason that they do not propose as an intervention program in their optimal control model. The other works that support intervention program 12 were the work done in [1, 13]. We observed that the alternative intervention Strategy 12 includes environmental sanitation.
6.1 Conclusions
The exploration of an optimal control problem offered practical insights into the implementation of interventions to mitigate cholera's impact. The identified optimal controls, including vaccination, treatment, sanitation, hygiene, and water quality improvement, underscore the multifaceted approach required for effective cholera management. The research provides a comprehensive framework for informing decision-makers and public health practitioners in the development of effective cholera control strategies.
Therefore, the findings of the research advised government stakeholders and policymakers should implement any of the three integrated intervention programs based on the local contexts, budget, and resources present with them.
Data availability statement
The original contributions presented in the study are included in the article/supplementary material, further inquiries can be directed to the corresponding author.
Author contributions
HA: Conceptualization, Formal analysis, Methodology, Project administration, Validation, Visualization, Writing – original draft, Writing – review & editing. ST: Conceptualization, Formal analysis, Investigation, Methodology, Supervision, Validation, Visualization, Writing – original draft, Writing – review & editing. BK: Conceptualization, Formal analysis, Investigation, Methodology, Supervision, Validation, Visualization, Writing – original draft, Writing – review & editing. KM: Conceptualization, Formal analysis, Investigation, Methodology, Supervision, Validation, Visualization, Writing – original draft, Writing – review & editing.
Funding
The author(s) declare that no financial support was received for the research, authorship, and/or publication of this article.
Acknowledgments
We would like to express our heartfelt appreciation to the reviewers for their constructive comments.
Conflict of interest
The authors declare that the research was conducted in the absence of any commercial or financial relationships that could be construed as a potential conflict of interest.
Publisher's note
All claims expressed in this article are solely those of the authors and do not necessarily represent those of their affiliated organizations, or those of the publisher, the editors and the reviewers. Any product that may be evaluated in this article, or claim that may be made by its manufacturer, is not guaranteed or endorsed by the publisher.
References
1. Abubakar SF, Ibrahim M. Optimal control analysis of treatment strategies of the dynamics of cholera. J Optimiz. (2022) 2022:2314104. doi: 10.1155/2022/2314104
2. Alemneh HT, Belay AM. Modelling, analysis, and simulation of measles disease transmission dynamics. Discr Dyn Nat Soc. (2023) 2023:9353540. doi: 10.1155/2023/9353540
3. Alemneh HT, Melese ZT. Modeling, Analyzing and Simulating the Dynamics of Tuberculosis-Covid-19 Co-infection. New Delhi: Taru Publications.
4. Baba IA, Humphries UW, Rihan FA. A well-posed fractional order cholera model with saturated incidence rate. Entropy. (2023) 25:360. doi: 10.3390/e25020360
5. Bakare EA, Hoskova-Mayerova S. Optimal control analysis of cholera dynamics in the presence of asymptotic transmission. Axioms. (2021) 10:60. doi: 10.3390/axioms10020060
6. Barbu V, Precupanu T. Convexity and Optimization in Banach Spaces. New York, NY: Springer Science & Business Media (2012).
7. Berhe HW. Optimal control strategies and cost-effectiveness analysis applied to real data of cholera outbreak in Ethiopia's Oromia region. Chaos Solit Fract. (2020) 138:109933. doi: 10.1016/j.chaos.2020.109933
8. Blower SM, Dowlatabadi H. Sensitivity and uncertainty analysis of complex models of disease transmission: an HIV model, as an example. Int Stat Rev. (1994) 62:229–43. doi: 10.2307/1403510
9. Buliva E, Elnossery S, Okwarah P, Tayyab M, Brennan R, Abubakar A. Cholera prevention, control strategies, challenges and World Health Organization initiatives in the Eastern Mediterranean Region: a narrative review. Heliyon. (2023) 9:e15598. doi: 10.2139/ssrn.4268747
10. Burden TN, Ernstberger J, Fister KR. Optimal control applied to immunotherapy. Discrete Cont Dyn Syst Ser B. (2004) 4:135–46. doi: 10.3934/dcdsb.2004.4.135
11. Castillo-Chavez C, Blower S, van den Driessche P, Kirschner D, Yakubu AA. Mathematical Approaches for Emerging and Reemerging Infectious diseases: Models, Methods, and Theory. Vol 126. New York, NY: Springer Science & Business Media (2002).
12. Challa JM, Getachew T, Debella A, Merid M, Atnafe G, Eyeberu A, et al. Inadequate hand washing, lack of clean drinking water and latrines as major determinants of cholera outbreak in Somali region, Ethiopia in 2019. Front Public Health. (2022) 10:845057. doi: 10.3389/fpubh.2022.845057
13. Cheneke KR, Rao KP, Edessa GK. Fractional derivative and optimal control analysis of cholera epidemic model. J Math. (2022) 2022:1–17. doi: 10.12737/1855784
15. Coddington EA, Levinson N, Teichmann T. Theory of Ordinary Differential Equations. New York, NY: American Institute of Physics (1956).
16. Davis WW, Mohammed Y, Abdilahi I, Kim S, Salah AA, McAteer J, et al. Food as a driver of a cholera epidemic in Jijiga, Ethiopia—June 2017. Am J Trop Med Hyg. (2023) 108:963–7. doi: 10.4269/ajtmh.22-0734
17. Ezeagu NJ, Togbenon HA, Moyo E. Modeling and analysis of cholera dynamics with vaccination. Am J Appl Math Stat. (2019) 7, 1–8. doi: 10.12691/ajams-7-1-1
18. Fleming WH, Rishel RW. Deterministic and stochastic optimal control. Appl Math. (1976) 1:1–19. doi: 10.1007/978-1-4612-6380-7_1
19. Fister KR, Lenhart S, McNally JS. Optimizing chemotherapy in an HIV model. Electron J Differ Eq. (1998) 1998:1–12.
20. Gallandat K, Huang A, Rayner J, String G, Lantagne DS. Household spraying in cholera outbreaks: insights from three exploratory, mixed-methods field effectiveness evaluations. PLoS Negl Trop Dis. (2020) 14:e0008661. doi: 10.1371/journal.pntd.0008661
21. Erkyihun GA, Asamene N, Woldegiorgis AZ. The threat of cholera in Africa. Zoonoses. (2023) 42:1–6. doi: 10.15212/ZOONOSES-2023-0027
22. Grass D, Caulkins JP, Feichtinger G, Tragler G, Behrens DA. Optimal Control of Nonlinear Processes. Berlino: Springer (2008).
23. He Y, Wang Z. Stability analysis and optimal control of a fractional cholera epidemic model. Fract Fract. (2022) 6:157. doi: 10.3390/fractalfract6030157
24. Hugo A, Makinde OD, Kumar S, Chibwana FF. Optimal control and cost effectiveness analysis for Newcastle disease eco-epidemiological model in Tanzania. J Biol Dyn. (2017) 11:190–209. doi: 10.1080/17513758.2016.1258093
25. Ilic I, Ilic M. Global patterns of trends in cholera mortality. Trop Med Infect Dis. (2023) 8:169. doi: 10.3390/tropicalmed8030169
26. Koelle K. The impact of climate on the disease dynamics of cholera. Clin Microbiol Infect. (2009) 15:29–31. doi: 10.1111/j.1469-0691.2008.02686.x
27. Lakshmikantham V, Leela S, Martynyuk AA. Stability Analysis of Nonlinear Systems. New York, NY: Springer (1989).
28. Lemos-Paião AP, Silva CJ, Torres DF. An epidemic model for cholera with optimal control treatment. J Comp Appl Math. (2017) 318:168–80. doi: 10.1016/j.cam.2016.11.002
29. Lenhart S, Workman JT. Optimal Control Applied to Biological Models. London: Chapman and Hall/CRC (2007).
30. Njagarah JBH, Nyabadza F. Modelling optimal control of cholera in communities linked by migration. Comp Math Methods Med. (2015) 2015:898264. doi: 10.1155/2015/898264
31. Nyabadza F, Aduamah JM, Mushanyu J. Modelling cholera transmission dynamics in the presence of limited resources. BMC Res Notes. (2019) 12:475. doi: 10.1186/s13104-019-4504-9
32. Onitilo S, Usman M, Daniel D, Odule T, Sanusİ. Modelling the transmission dynamics of cholera disease with the impact of control strategies in Nigeria. Cankaya Univ J Sci Eng. (2023) 20:35–52.
35. Rosa S, Torres DF. Fractional-order modelling and optimal control of cholera transmission. Fract Fract. (2021) 5:261. doi: 10.3390/fractalfract5040261
36. Sun GQ, Xie JH, Huang SH, Jin Z, Li MT, Liu L. Transmission dynamics of cholera: Mathematical modeling and control strategies. Commun Nonlinear Sci Numer Simul. (2017) 45:235–44. doi: 10.1016/j.cnsns.2016.10.007
37. Tilahun GT, Makinde OD, Malonza D. Co-dynamics of pneumonia and typhoid fever diseases with cost effective optimal control analysis. Appl Math Comput. (2018) 316:438–59. doi: 10.1016/j.amc.2017.07.063
38. Tilahun GT, Woldegerima WA, Wondifraw A. Stochastic and deterministic mathematical model of cholera disease dynamics with direct transmission. Adv Differ Eq. (2020) 2020:1–23. doi: 10.1186/s13662-020-03130-w
39. Usmani M, Brumfield KD, Jamal Y, Huq A, Colwell RR, Jutla A. A review of the environmental trigger and transmission components for prediction of cholera. Trop Med Infect Dis. (2021) 6:147. doi: 10.3390/tropicalmed6030147
40. Van den Driessche P, Watmough J. Reproduction numbers and sub-threshold endemic equilibria for compartmental models of disease transmission. Math Biosci. (2002) 180:29–48. doi: 10.1016/S0025-5564(02)00108-6
Keywords: cholera, Vibrio cholerae, stability analysis, optimal control theory, numerical simulation
Citation: Alemneh HT, Teklu SW, Kotola BS and Mekonen KG (2024) Investigation of an optimal control strategy for a cholera disease transmission model with programs. Front. Appl. Math. Stat. 10:1462701. doi: 10.3389/fams.2024.1462701
Received: 10 July 2024; Accepted: 30 September 2024;
Published: 28 October 2024.
Edited by:
Joseph Malinzi, University of Eswatini, EswatiniReviewed by:
Hatson John Boscoh Njagarah, Botswana International University of Science and Technology, BotswanaAkanni John Olajide, KolaDaisi University, Nigeria
Copyright © 2024 Alemneh, Teklu, Kotola and Mekonen. This is an open-access article distributed under the terms of the Creative Commons Attribution License (CC BY). The use, distribution or reproduction in other forums is permitted, provided the original author(s) and the copyright owner(s) are credited and that the original publication in this journal is cited, in accordance with accepted academic practice. No use, distribution or reproduction is permitted which does not comply with these terms.
*Correspondence: Haileyesus Tessema Alemneh, aGFpbGEudGVzc2VtYUBnbWFpbC5jb20=
 Haileyesus Tessema Alemneh
 Shewafera Wondimagegnhu Teklu2
 Kassahun Getnet Mekonen