 Gili Hochman1†Einat Shacham-Shmueli2†Tchia Heymann1Stephen Raskin2
 Svetlana Bunimovich-Mendrazitsky1*
- 1Department of Mathematics, Ariel University, Ariel, Israel
- 2Sheba Medical Center, Tel Hashomer, Israel
Colorectal cancer (CRC) is one of the most common causes of cancer-related mortality worldwide. Most cases of deaths result from metastases, assumed to be shed, in many cases, before disease detection. Providing reliable predictions of the metastases' growth pattern may help planning treatment. Available mathematical tumor growth models rely mainly on primary tumor data, and rarely relate to metastases growth. The aim of this work was to explore CRC lung metastases growth patterns. We used data of a metastatic CRC patient, for whom 10 lung metastases were measured while untreated by seven serial computed tomography (CT) scans, during almost 3 years. Three mathematical growth models—Exponential, logistic, and Gompertzian—were fitted to the actual measurements. Goodness of fit of each of the models to actual growth was estimated using different scores. Factors affecting growth pattern were explored: size, location, and primary tumor resection. Exponential growth model demonstrated good fit to data of all metastases. Logistic and Gompertzian growth models, in most cases, were overfitted and hence unreliable. Metastases inception time, calculated by backwards extrapolation of the fitted growth models, was 8–19 years before primary tumor diagnosis date. Three out of ten metastases demonstrated enhanced growth rate shortly after primary tumor resection. Our unique data provide evidence that exponential growth of CRC lung metastases is a legitimate approximation, and encourage focusing research on short-term effects of surgery on metastases growth rate.
Significance
Providing reliable predictions of the metastases' growth pattern using mathematical models may help determining the optimal treatment plan that fits a given patient best and maximizes the probability of cure.
Introduction
Colorectal cancer (CRC) is one of the most common causes of cancer-related morbidity and mortality worldwide. Most cases of deaths result from development of metastatic disease [1]. CRC has a slow natural history (i.e., development of disease) that provides a great opportunity for early detection and prevention strategies. Surgery is the main curative treatment, but despite complete resection of the primary tumor, metastatic disease might develop in a significant number of patients [2].
The exact dynamics of tumor and metastasis formation is not well-established. It is assumed that many (if not most) of metastases are shed before primary tumor is even detectable [1, 3, 4]. Hence, preventing metastases growth by adjuvant or perioperative treatments is indicated in many cases after resection of primary tumor [5, 6]. Providing reliable predictions of the metastases' growth pattern using mathematical models may help determining the optimal treatment plan.
Growth laws of primary tumors are thoroughly investigated [7, 8], however, not many mathematical models are dealing with metastases growth dynamics in humans. Many of the mathematical models for primary tumor growth are based on fitting in-vivo data to relatively simple growth models, such as exponential, logistic, Gompertzian, or power law [9, 10], and models for metastases dynamics rely on the same laws. The Gompertzian law is considered most reliable, because it was found that generally, doubling time of tumors usually decreases with time. Nevertheless, the assumption of exponential growth is preferred over logistic or Gompertzian because it includes one less parameter, which reduces the degree of freedom in the model, consequently reducing the difficulty in getting numerical convergence with limited amount of data. Hence, exponential law is often assumed, at least for the first period of growth [10–12]. However, this assumption is hard to prove in vivo, since there are very few available data of untreated metastases growth in humans. Moreover, diversity between patients, and between metastases of the same patient, further increases the challenge when trying to find growth patterns that can be used as predictors.
Here, we describe a CRC patient with 10 lung metastases, for which uncommon data of in vivo growth over time is available. The metastases were followed and measured—while untreated—for over 2 years. Our aims were:
◦ To describe metastases growth pattern and decide which of the three models—Gompertzian, exponential, logistic—fits best.
◦ To determine whether factors such as location and size of metastases have an effect on growth pattern and rate.
◦ To estimate natural history of the disease (i.e., time of onset of metastases).
Materials and Methods
Data
A 65 years old patient was diagnosed with rectal cancer TNM stage [13] T3N0 (and colon polyp containing superficial cancer TNM stage T1N0). A CT scan at the time of first diagnosis showed also 8 mm nodules in the lungs. A PET-CT scan did not show FDG uptake in these nodules, which may have implied that these nodules are not malignant. Fifty-four days after first diagnosis, the primary tumor in rectum (and colonic polyp) were resected. On post-surgery follow up, six additional CT scans were conducted, roughly every 6 months, in which 10 lung metastases were evidently growing. During this time period systemic treatment (chemotherapy, targeted treatment) was offered, but not administered, because of personal preference of the patient. The measured volumes of metastases at these seven timepoints (marked as W1–W7) are reported in Table 1. See Figure S1 for examples of CT tomographic images and Figure S2 for illustration of the locations of all diagnosed metastases (marked #1–#10) in the lungs.
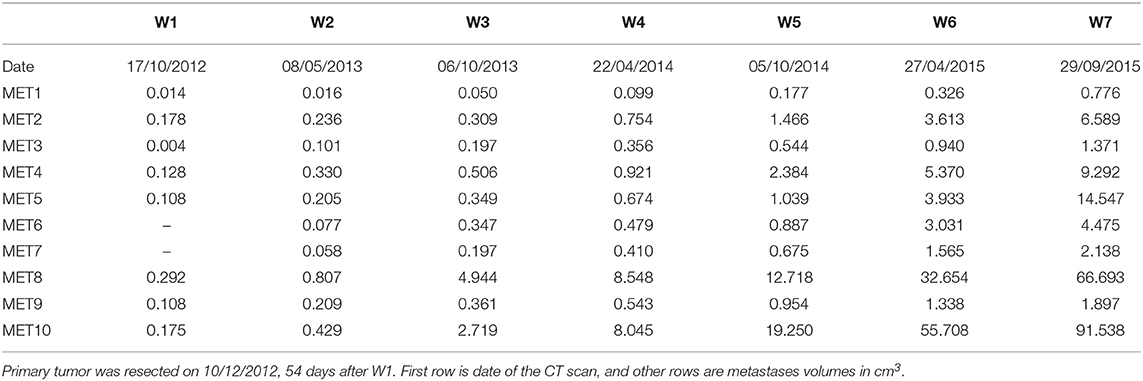
Table 1. Metastases sizes measured by CT scans of the patient, at different times marked W1–W7.
Modeling
Based on the data available, we wanted to set a growth model (exponential, Gompertzian, or logistic) for each of the 10 metastases, and assess the values of growth rate parameters.
Exponential growth was modeled by the equation:
where Ψ(t) is the metastasis volume at time t, counted from the day of primary tumor resection, is the size of metastasis at t = 0, and λ is the growth rate parameter.
Logistic growth was modeled by the equation:
where Θ(t) is metastasis volume at time t, is the size of metastasis at t = 0, Klogistic is the limiting tumor size—carrying capacity, and r is a rate parameter.
Gompertzian growth was modeled by:
where Φ(t) is metastasis volume at time t, is the size of metastasis at t = 0, Kgomp is the limiting tumor size and β is a rate parameter.
Direct fit of the data, by numerical minimization of the sum of squared errors (SSE) was done for each of the metastases separately, to optimize the parameter values for each of the three equations: and λ in Equation (1), , Klogistic, and r in Equation (2) and , Kgomp and β in Equation (3). Specifically, the minimization was done for errors of the model predictions of the log-volume of tumor size:
where Yi is the observed metastasis volume at time ti and f(ti, p) is predicted metastasis volume at the same time, as calculated by each of the model Equations (1)–(3), depending on the estimated parameters vector p. The minimization procedure was performed using the Matlab functions lsqnonlin and nlinfit.
The fit was done for each metastasis using data of all available measurements in time, including at time W1, conducted 54 days before resection. Indeed, the growth law and rate may change between W1 and W2 due to the resection, however we assumed that the time between W1 and resection time was short enough that it would change the measure only slightly, within the measurement error.
Goodness of Fit Analysis
Different criteria for the goodness of fit were compared, in order to determine the best growth model for each of the metastases, and the reliability of the estimated parameter values [10, 14]. For this purpose, the root of mean square of errors (RMSE) was calculated for each of the three models that were fitted to each of the 10 metastases.
where SSE is defined by Equation (4). The MSE is normalized to the number of measurements (n) available for the specific metastasis, and to the number of model parameters (P), to enable fair comparison between exponential model (where P = 2) and the other models (where P = 3).
Another criterion used for the goodness of fit of predicted curves to the data was the adjusted coefficient of determination:
where , and is the time average of the observed log-volumes measured at all n time-points. This metric quantifies how much of the variability in the data is described by the model, as the denominator is proportional to the data variance. In this case, R2 is adjusted to the number of measurements (n) and number of model parameters (P).
To quantify the reliability of the estimated parameter values, the variance-covariance matrix of parameters was calculated, in the context of non-linear least squares regression:
where J is the Jacobian of the model as a function of the parameters vector p: . pj is the jth element of p. The variance of an estimated parameter pj is defined by the diagonal element of the covariance matrix, Covjj. This is a measure of the sensitivity of model prediction to the estimated value of the parameter pj.
Evaluation of Metastases' Natural History
After the best fitted models are chosen, and their reliability is established, the fitted models can be used to estimate the time of onset of metastasis. For this purpose, the fitted curve with estimated parameters for each metastasis k was extrapolated backwards to determine the time of onset of metastasis (Tk), defined as time of appearance of the first malignant cell, adopting the evaluation of 10−9 cm3 for the volume of a single tumor cell. For example, in case of an exponential model the value for Tk was derived from . This method was also used to assess the time of metastasis' size reaching to the threshold enabling detection by CT scan (Dk), approximated as 0.002 cm3.
Results
Fitting and Comparing Growth Models
For every one of the metastases, values for the parameters of each of the three growth models examined were fitted to the dataset of all available measurements at times W1–W7. Metastases #6 and #7 were not detectable at W1 timepoint (see Table 1). For metastasis #3, the measure at W1 was omitted from the fit since it was very small—close to the limit of detection. The parameters' optimal values, as well as different scores for goodness of fit (see section Materials and Methods), are presented in Tables 2, 3. In general, all growth models provided good fit for most of metastases, as their predicted curves are within or close to the measurement error bounds (Figure 1). This accuracy reflects in the adjusted R squared values (Table 3) which are almost all >0.94. unlike R2, the SSE and RMSE values are not normalized to variability of observed values. Hence, comparing SSE or RMSE values of different metastases would reflect the variability in absolute values of metastases volumes: metastases that grow to high volumes would have higher SEE and RMSE values. However, their values can be used to compare between goodness of fit of different growth models for the same metastasis, as detailed bellow.
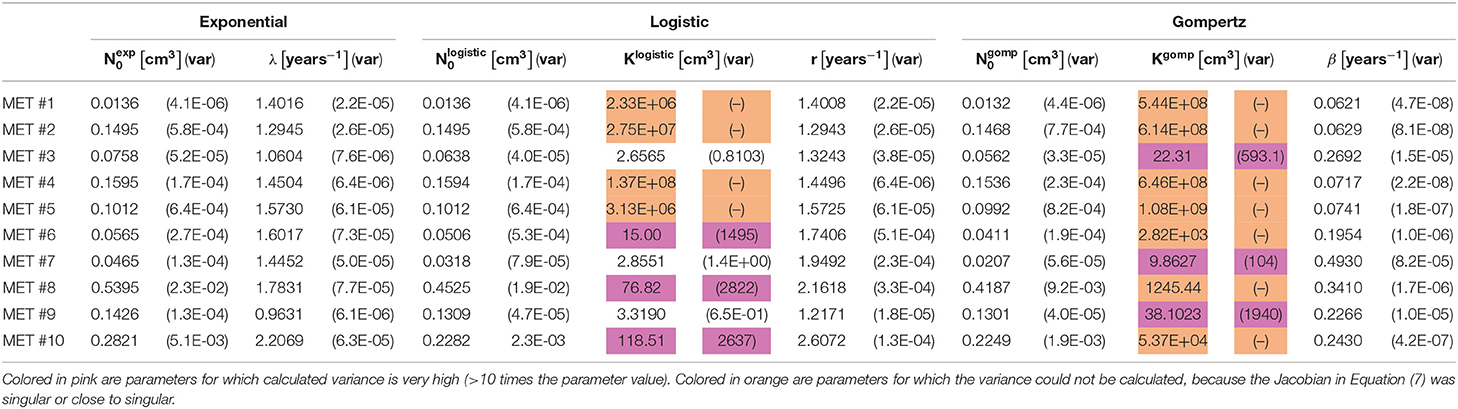
Table 2. Values of estimated optimal parameters, for each of the 10 observed metastases, for the three fitted models (see Equations 1–3), along with their variance (see Equation 7) presented in parentheses.
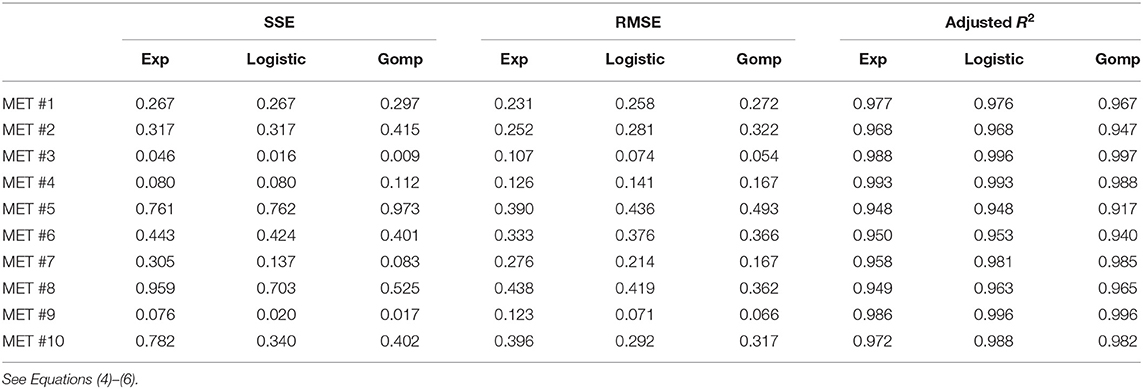
Table 3. Different measures of the goodness of fit, for each of the 10 observed metastases, for the three fitted models.
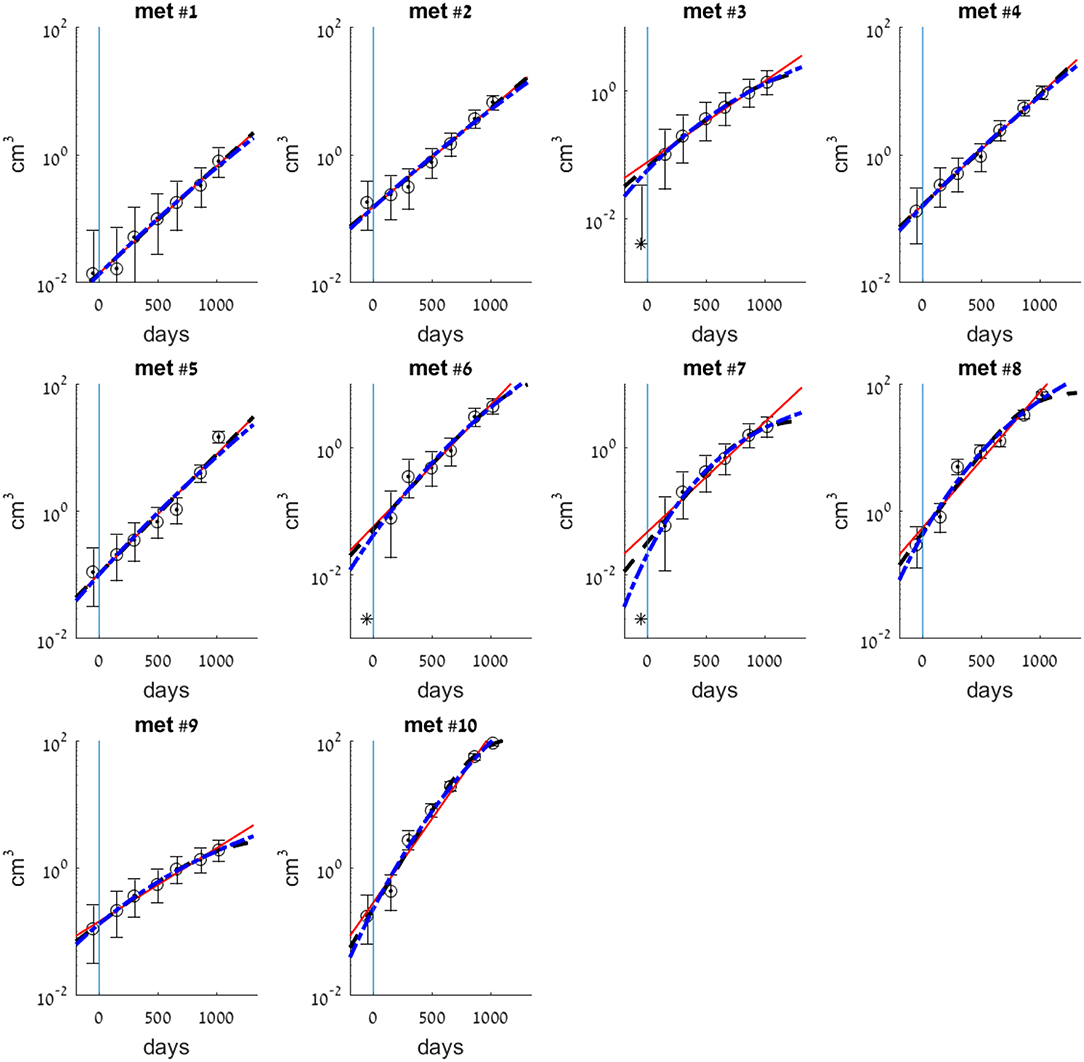
Figure 1. Exponential (smooth red line), logistic (dashed black line), and Gompertzian (dashed-dotted blue line) growth law fits for each of the 10 metastases. Model parameters were fitted to observed volumes of metastases as measured by CT scans at times W1–W7 (see Table 1). Circles are clinical measurements that models were fitted to. Asterisk at time W1 (t = 54 days) in met #3 is detected size, that was not used for the fit. Asterisks in mets #6 and #7, which were not detected at time W1, mark detection limit 0.002 cm3. Vertical line at t = 0 marks the day of primary tumor resection.
For metastases numbered 1, 2, 4, 5, comparing goodness of fit of the three models shows that the exponential model demonstrated the closet prediction to actual growth measurements for these metastases in all three scores (see Table 3). Logistic and Gompertzian models converged with extremely high values of carrying capacity parameter K (marked orange in Table 2), which means that they essentially degenerate into exponent. The variance of K could not be calculated in those cases, because the Jacobian was singular or close to singular, i.e., curve fit does not depend on the value of K. This may point on redundancy in these models.
For metastases numbered 6, 8, 10 the exponential fit scores were inferior than those of the other two models. However, Gompertzian fit has the same problem of parameter redundancy, where curve fit does not depend on the value of K (marked orange in Table 2). The logistic fit is also not reliable in these cases, since the variance of the parameter K is very large, 10–100 times its value (marked pink in Table 2). Hence, in these metastases, exponential model is also the preferable one.
For metastases 3, 7, 9 the logistic curve seems reliable, and it has better scores than exponential. However, these metastases are very small in size hence measurement error is relatively large, and exponential curve is also within this error. Gompertzian fit is not reliable from the same reasons mentioned above for other metastases.
For all metastases described above, it seems that using exponential approximation for the growth law is a good enough approximation, at least for a range of 2 years from the time of primary tumor detection and resection (for the first timepoints of measure W1–W5, or W2–W5 for metastases #3, #6, and #7).
Variability of Growth Rates of Metastases
Looking at the fitted exponential model parameters, the value of exponent of the growth rate λ (see Equation 1) is in the same order of magnitude for all metastases, and its value is estimated to be the average of their fitted values: 1.48 years−1, with standard deviation of 0.34 years−1 (Table 2). Their distribution (assumed to be normal) is presented in Figure 2A. Note, that the metastases most distant from this mean value are #9 and #10, which are both located in the left lung, while all other metastases are in the right lung. Other than that, no relation was found between fitted growth rates to the metastasis location in the lungs, nor to its size at the time of detection. The distribution of initial metastases sizes (at time W1), and the lack of correlation to growth rate λ can be seen in Figure 2B. The similarity of exponential growth rates of metastases can be also seen in Figure 3A, where fitted models for all metastases are presented on the same graph (note that the figure is presented in log-scale, and volumes are also normalized to the initially detected volume, at time W1).
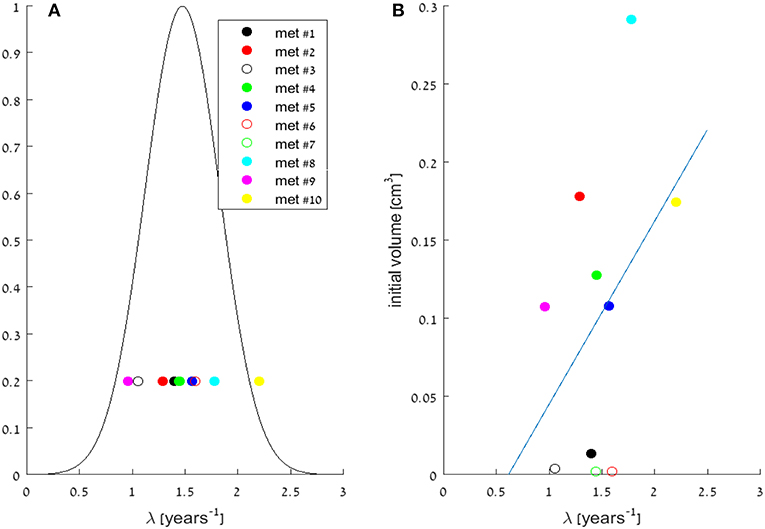
Figure 2. (A) Distribution of the growth rate parameter λ in the fitted exponential models for the 10 metastases. Circles are the specific values of λ, for all metastases (as detailed in Table 2), and a gaussian curve is presented, assuming normal distribution around the mean value: 1.48 years−1, with standard deviation of 0.34 years−1. (B) Scattering of the growth rate parameter λ vs. initial metastases' volumes, measured at time W1. Circles are the specific values, for all metastases, and a linear model trendline of their correlation is presented. No significant correlation was observed (correlation coefficient 0.43).
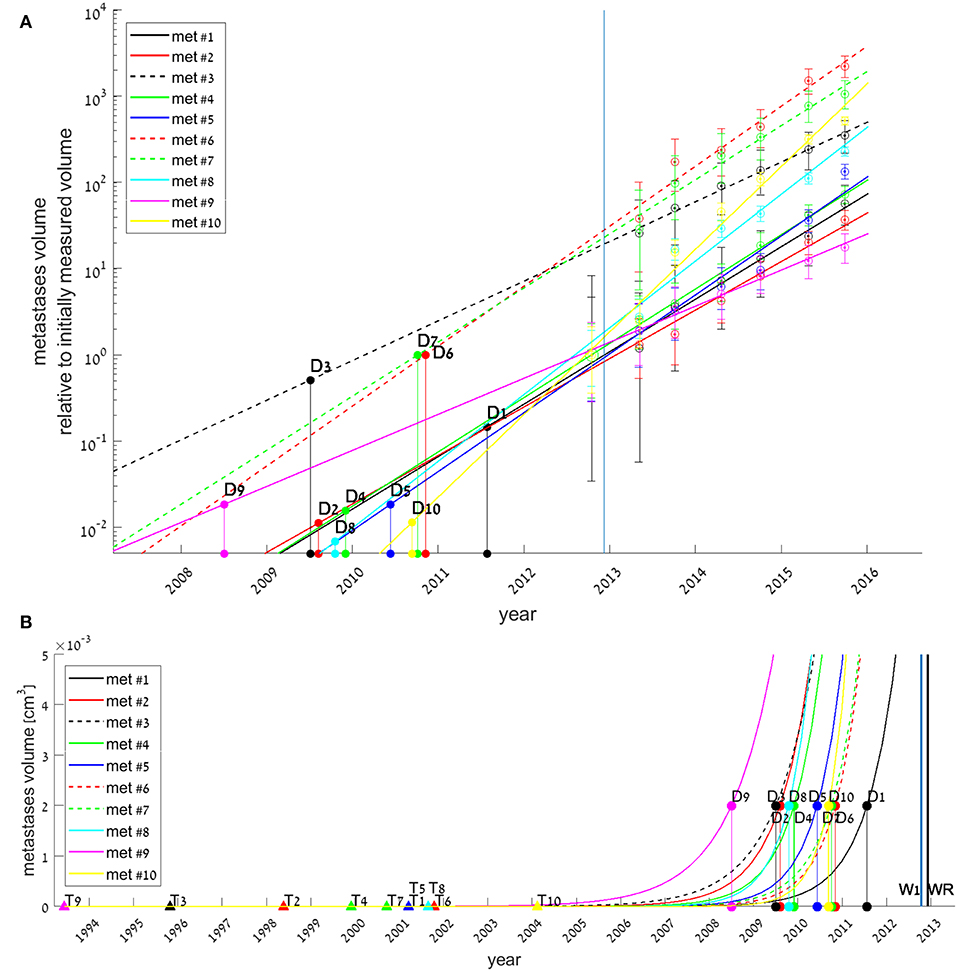
Figure 3. Exponential growth law fits for all 10 metastases (colored lines), with estimated date for each metastasis onset (filled triangles, marked by Tk for each metastasis #k), and estimated date for its earliest possible detection (filled circles, Dk). Tk and Dk values were extrapolated from the fitted models, assuming growth rates did not change since metastasis' onset. In (A), measured volumes are normalized to each metastasis initial volume at time W1. Early growth of metastasis (<0.005 cm3) is not presented, hence Tk values are not shown. In (B), early growth of metastasis is presented, and the whole timeline of the disease natural history is shown. Blue and black vertical lines represent the days of disease detection (W1) and of primary tumor resection (WR), respectively.
Metastases' Natural History
If we assume each metastasis has followed the same growth law since its formation, then for each metastasis k the onset time (i.e., time of emergence of the first malignant clonogenic cell,) TK, could be estimated. The earliest possible detection time (i.e., time of metastasis' size reaching to the threshold enabling detection by CT scan,) Dk, could also be evaluated. These evaluations were obtained by extrapolating backwards of the fitted exponential growth model, assuming growth rate was the same through all the time of metastasis' existence. Results, presented in Figure 3, show that according to the model, all metastases were formed 8–19 years before primary tumor was detected (Figure 3B), however, earliest possible time on which they could be detected, assuming detection limit is 0.002 cm3, was years later −1–5 years before primary tumor detection (This can be seen in Figure 3B, and more clearly in Figure 3A).
For metastases #3, #6, and #7, the fitted models imply that they have reached detection limit 3–4 years before primary detection time (see Figure 3A), and were far larger than this threshold at the day of disease detection (see smooth lines compared to the asterisks in corresponding subplots in Figure 1). This result stands in contrast with the fact that they were not observed at the CT done on primary tumor detection (timepoint W1). We assume that these metastases were either undetectable because their size was bellow detection limit, or small enough to be missed at the scan, i.e., their size was above detection limit but close to it. Either way, for these metastases it seems that growth law was not the same all the time; it was dramatically changed in the 6 months between W1 and W2, the beginning of the period for which exponential curve was well-fitted. The enhanced growth rate for these metastases between W1 and W2 was evaluated by assuming exponential growth and fitting it to these two timepoints (taking maximal possible metastasis size at W1, when it was not detectable, as 0.002 cm3). Results showed its minimal possible value was 5.85, 6.55, and 6.05 years−1 for metastases #3, #6, and #7, respectively. This is at least four times higher than the growth rate at the following period of time, between W2 and W7 (Table 2). For all other metastases, the exponential curve is well-fitted to the measure at W1, which means that the exponential growth rate remained the same.
Discussion
Understanding metastases growth is crucial for treating cancer patients. However, little is known about the dynamics of untreated metastases, because such dynamical data in humans are rare. In this paper, we used rare data of a metastatic CRC patient, for which CT measurements of growth of 10 untreated lung metastases during 3 years are available. We aimed to examine the common hypothesis that metastases growth rate can be approximated as exponential. Our results showed that all the metastases could be regarded as growing exponentially, at least for the first 2 years after disease detection and primary tumor resection. Logistic and Gompertzian growth models were also examined, but in most cases, they are overfitted and could not be used.
In addition, we found evidence that the exponential growth curve does not always demonstrate the closet prediction to actual growth measurements throughout all the follow-up time period. That was true for the first time period after primary tumor resection. Our results imply that some of the metastases (#3, #6, and #7) grew more rapidly between the time of first diagnosis and shortly after primary tumor surgery, while during the period of the next 2 years the growth rate was exponential with a constant, slower rate. This result is supported by literature describing implications of surgery on metastases growth rate, especially in the short term. There is emerging evidence that the stress response caused by surgery as well as anesthesia and analgesia may promote growth of pre-existing micro-metastasis [5, 15–18]. Such post-surgery metastatic acceleration (PSMA) might be related to surgical stress through several mechanisms, such as suppression of anti-tumor immune response, stimulatory effects on tumor cells, and activation of the coagulation system [5, 16–19]. There are mathematical models that assume PSMA is caused by removal of the suppression that the primary tumor induces on metastases, through systemic inhibition of angiogenesis [15, 20, 21]. This mechanism may explain changes in growth rate between the time before primary resection and the time after it (which was not examined in this work), but it does not explain the change in the growth rate during the period after resection, i.e., in the first month after resection compared to the next following years. Our results show that the most significant impact of surgery is in the short term, at least for some of the metastases. It implies that other mechanisms, which decay shortly after surgery, for example—increased angiogenesis factors production due to wound healing [22], are dominant and should be investigated.
For the period of 6 months up to 2–3 years after surgery, all the metastases could be modeled as exponentially growing. The value of the growth rate parameter λ (see Equation 1) is quite similar for all of them, with a mean value of 1.5 years−1. Based on these results, we can assume that exponential growth assumption is legitimate for most of metastases. Moreover, it is reasonable to assume a single value for the growth rate parameter that would fit all metastases found at the same site, as done in some mathematical models [11, 23]. No relation was found between fitted growth laws or rates to the metastases sizes or locations within the lungs.
A timeline of disease progression was constructed and estimated that onset of metastases occurred 8–19 years before primary tumor was detected (Figure 3B), and that they grew slowly and became detectable several years later. This was done by backwards extrapolation of the exponential fitted curves, assuming that growth rates before and after resection were the same. However, if we assume that the growth rate was faster—or at least not slowed—after surgery, then the real inception time was no later (and possibly earlier) than at the estimated times shown in Figure 3B. This result reinforces the notion that metastases were formed many years before detection of primary tumor [1, 5, 12]. The growth dynamics of metastases before primary tumor resection may be further investigated by applying a natural history model on this patient's data, developed by Hanin et al. [23]. As validated here, we can use this model under the assumption of exponential growth after resection, with one value for the growth rate parameter for all metastases.
It is well-known that great variability exists between different primary tumors, between different patients with the same primary tumor and even between metastases at different locations in the same patient [24–26]. The main limitation of this work is that it is based on data of a single patient with rectal cancer metastatic to lungs. Different growth patterns might apply to other sites of metastases or to other primary tumors. Also, all measurements are prone to minute deviation errors especially when millimetric lesions are measured on a bidimensional CT scan. It would be interesting to analyze in the same way data of other patients with measurable metastases either in the lungs or other sites, either from CRC or other primary tumors. Another limitation is the fact that metastases were measured along 3 years period only. The dynamics of metastases growth before first diagnosis and more than 3 years after primary tumor resection are lacking. Hence other factors that could influence growth patterns in time are beyond the scope of this case.
In summary, our unique and uncommon data provide firm evidence that exponential growth model demonstrated precise prediction to actual growth measurements of CRC lung metastases, at least for a limited time period, starting half a year after surgery until about 2 years afterwards. In addition, the results imply that growth rate of some metastases might accelerate shortly after primary tumor surgery, getting more moderated later. These results encourage further research of the suggested mechanisms for metastases growth acceleration caused by short-term effects of surgery, and of the effects of adjuvant treatment in this period of time.
Data Availability Statement
The datasets generated for this study are available on request to the corresponding author.
Ethics Statement
Written informed consent was not obtained from the individual(s) for the publication of any potentially identifiable images or data included in this article.
Author Contributions
SB-M designed research. GH and TH performed research. SB-M and GH contributed analytic tools. SB-M, GH, and ES-S analyzed data. SR measured metastases. ES-S and GH wrote the paper.
Conflict of Interest
The authors declare that the research was conducted in the absence of any commercial or financial relationships that could be construed as a potential conflict of interest.
Supplementary Material
The Supplementary Material for this article can be found online at: https://www.frontiersin.org/articles/10.3389/fams.2019.00056/full#supplementary-material
Figure S1. CT images from dates W2–5. The metastases are marked by arrows.
Figure S2. A scheme based on the CT scans, showing locations of all 10 diagnosed metastases in the lungs.
References
1. Hanahan D, Weinberg RA. Hallmarks of cancer: the next generation. Cell. (2011) 144:646–74. doi: 10.1016/j.cell.2011.02.013
2. Stein U, Schlag PM. Clinical, biological, and molecular aspects of metastasis in colorectal cancer. In: Dietel M, Berlin E, editors. Targeted Therapies in Cancer. Heidelberg: Springer (2007). p. 61–80.
3. Fisher B, Montague E, Redmond C, Barton B, Borland D, Fisher ER, et al. Comparison of radical mastectomy with alternative treatments for primary breast cancer: a first report of results from a prospective randomized clinical trial. Cancer. (1977) 39:2827–39. doi: 10.1002/1097-0142(197706)39:6<2827::AID-CNCR2820390671>3.0.CO;2-I
4. Siegel RL, Miller KD, Fedewa SA, Ahnen DJ, Meester RGS, Barzi A, et al. Colorectal cancer statistics, 2017. CA Cancer J Clin. (2017) 67:177–93. doi: 10.3322/caac.21395
5. Retsky M, Demicheli R, Hrushesky W, Baum M, Gukas I. Surgery triggers outgrowth of latent distant disease in breast cancer: an inconvenient truth? Cancers. (2010) 2:305–37. doi: 10.3390/cancers2020305
6. Horowitz M, Neeman E, Sharon E, Ben-Eliyahu S. Exploiting the critical perioperative period to improve long-term cancer outcomes. Nat Rev Clin Oncol. (2015) 12:213–26. doi: 10.1038/nrclinonc.2014.224
7. Kozusko F, Bajzer Z. Combining gompertzian growth and cell population dynamics. Math Biosci. (2003) 185:153–67. doi: 10.1016/S0025-5564(03)00094-4
8. Brú A, Albertos S, Subiza JL, García-Asenjo JL, Brú I. The universal dynamics of tumor growth. Biophys J. (2003) 85:2948–61. doi: 10.1016/S0006-3495(03)74715-8
9. Rodriguez-Brenes IA, Komarova NL, Wodarz D. Tumor growth dynamics: insights into evolutionary processes. Trends Ecol Evol. (2013) 28:597–604. doi: 10.1016/j.tree.2013.05.020
10. Benzekry S, Lamont C, Beheshti A, Tracz A, Ebos JML, Hlatky L, et al. Classical mathematical models for description and prediction of experimental tumor growth. PLoS Comput Biol. (2014) 10:e1003800. doi: 10.1371/journal.pcbi.1003800
11. Hanin L, Bunimovich-Mendrazitsky S. Reconstruction of the natural history of metastatic cancer and assessment of the effects of surgery: gompertzian growth of the primary tumor. Math Biosci. (2014) 247:47–58. doi: 10.1016/j.mbs.2013.10.010
12. Hanin L, Seidel K, Stoevesandt D. A ‘universal' model of metastatic cancer, its parametric forms and their identification: what can be learned from site-specific volumes of metastases. J Math Biol. (2016) 72:1633–62. doi: 10.1007/s00285-015-0928-6
13. Mahul LRM, Amin B, Edge S, Greene FL, Byrd DR, Brookland RK, et al. AJCC Cancer Staging Manual. New York, NY: Springer Science+Business Media (2017).
14. Richter PH. Estimating errors in least-squares fitting. Telecommun Data Acquis Prog Rep. (1995) 42:107–36.
15. Benzekry S, Gandolfi A, Hahnfeldt P. Global dormancy of metastases due to systemic inhibition of angiogenesis. PLoS ONE. (2014) 9:26–30. doi: 10.1371/journal.pone.0084249
16. Pinson H, Cosyns S, Ceelen WP. The impact of surgical resection of the primary tumor on the development of synchronous colorectal liver metastasis: a systematic review. Acta Chir Belg. (2018) 118:203–11. doi: 10.1080/00015458.2018.1446602
17. Behrenbruch C, Shembrey C, Paquet-Fifield S, Mølck C, Cho HJ, Michael M, et al. Surgical stress response and promotion of metastasis in colorectal cancer: a complex and heterogeneous process. Clin Exp Metastasis. (2018) 35:333–45. doi: 10.1007/s10585-018-9873-2
18. Demicheli R, Retsky MW, Hrushesky WJM, Baum M, Gukas ID. The effects of surgery on tumor growth: a century of investigations. Ann Oncol. (2008) 19:1821–28. doi: 10.1093/annonc/mdn386
19. Zheng J, Jia L, Mori S, Kodama T. Evaluation of metastatic niches in distant organs after surgical removal of tumor-bearing lymph nodes. BMC Cancer. (2018) 18:1–13. doi: 10.1186/s12885-018-4538-8
20. Benzekry S, Lamont C, Barbolosi D, Hlatky L, Hahnfeldt P. Mathematical modeling of tumor–tumor distant interactions supports a systemic control of tumor growth. Cancer Res. (2017) 77:5183–93. doi: 10.1158/0008-5472.CAN-17-0564
21. Hanin L, Rose J. Suppression of metastasis by primary tumor and acceleration of metastasis following primary tumor resection: a natural law? Bull Math Biol. (2018) 80:519–39. doi: 10.1007/s11538-017-0388-9
22. Maida V, Ennis M, Kuziemsky C, Corban J. Wounds and survival in cancer patients. Eur J Cancer. (2009) 45:3237–44. doi: 10.1016/j.ejca.2009.05.014
23. Hanin L, Rose J, Zaider M. A stochastic model for the sizes of detectable metastases. J Theor Biol. (2006) 243:407–17. doi: 10.1016/j.jtbi.2006.07.005
24. Franko J, Shi Q, Meyers JP, Maughan TS, Adams RA, Seymour MT. Prognosis of patients with peritoneal metastatic colorectal cancer given systemic therapy: an analysis of individual patient data from prospective randomised trials from the Analysis and Research in Cancers of the Digestive System (ARCAD) database. Lancet Oncol. (2016) 17:1709–19. doi: 10.1016/S1470-2045(16)30500-9
25. Riihimaki M, Hemminki A, Sundquist J, Hemminki K. Patterns of metastasis in colon and rectal cancer. Sci Rep. (2016) 6:1–9. doi: 10.1038/srep29765
Keywords: lung metastases, mathematical growth models, exponential growth, logistic growth, gompertzian growth, primary tumor resection
Citation: Hochman G, Shacham-Shmueli E, Heymann T, Raskin S and Bunimovich-Mendrazitsky S (2019) Metastases Growth Patterns in vivo—A Unique Test Case of a Metastatic Colorectal Cancer Patient. Front. Appl. Math. Stat. 5:56. doi: 10.3389/fams.2019.00056
Received: 03 July 2019; Accepted: 22 October 2019;
Published: 12 November 2019.
Edited by:
Doron Levy, University of Maryland, College Park, United StatesReviewed by:
Spyros K. Stamatelos, Sanofi, United StatesElisa Domínguez-Hüttinger, National Autonomous University of Mexico, Mexico
Copyright © 2019 Hochman, Shacham-Shmueli, Heymann, Raskin and Bunimovich-Mendrazitsky. This is an open-access article distributed under the terms of the Creative Commons Attribution License (CC BY). The use, distribution or reproduction in other forums is permitted, provided the original author(s) and the copyright owner(s) are credited and that the original publication in this journal is cited, in accordance with accepted academic practice. No use, distribution or reproduction is permitted which does not comply with these terms.
*Correspondence: Svetlana Bunimovich-Mendrazitsky, c3ZldGxhbmFidUBhcmllbC5hYy5pbA==
†These authors have contributed equally to this work