
95% of researchers rate our articles as excellent or good
Learn more about the work of our research integrity team to safeguard the quality of each article we publish.
Find out more
REVIEW article
Front. Anim. Sci. , 06 February 2025
Sec. Animal Breeding and Genetics
Volume 6 - 2025 | https://doi.org/10.3389/fanim.2025.1508081
 H. Wilmot1,2*†‡
 N. Gengler2‡
With the purpose to organize methodologies found in (recent) papers focusing on the development of genomic breed/population assignment tools, this review proposes to highlight good practice for the development of such tools. After an appropriate quality control of markers and the building of a representative reference population, three main steps can be followed to develop a genomic breed/population assignment tool: 1) The selection of discriminant markers, 2) The development of a model that allows accurate assignment of animals to their breed/population of origin, the so-called classification step, and, 3) The validation of the developed model on new animals to evaluate its performances in real conditions. The first step can be avoided when a mid- or low-density chip is used, depending on the methodology used for assignment. In the case selection of SNPs is necessary, we advise the use of one stage methodologies and to define a threshold for this selection. Then, machine learning can be used to develop the model per se, based on the selected or available markers. To tune the model, we recommend the use of cross-validation. Finally, new animals, not used in the first two steps, should be used to evaluate the performances of the model (e.g., with balanced accuracy and probabilities), also in terms of computation time.
During the last decades, there has been a lot of studies aiming to assign animals to their breed/population of origin based on genotypes. The development of a tool of this kind relies on three main steps: 1) The selection of markers, useful to assign animals to their breed/population; 2) The classification, i.e., the development of a model that allows to accurately assign animals to their breed/population of origin, and 3) The validation of the developed model on new animals to evaluate its performances in routine conditions. However, the first and second steps, or the second and third steps, are often confused in papers. Studies can also tend to skip the last step. A wide variety of strategies have also been applied for each of the three steps. The advent of machine learning techniques adds another level of complexity for developing genomic breed/population assignment tools. All these events lead to the need for guidelines for developing tools for breed/population assignment. Therefore, the objective of this review is to summarize main strategies found in the literature for breed/population assignment and to give good practice to develop a genomic model for breed/population assignment.
Before diving into the topic of breed/population assignment models by themselves, it is first important to define the “breed” and “population” concepts as they are used in this review. The population concept is defined in a broad sense, representing any stratified structure within an animal species. In that sense, a population can be a breed. In this review, we use the definition of breed as in the point 2 of Article 2 of the European regulation 2016/1012 where ‘ “Breed” means a population of animals sufficiently uniform to be considered distinct from other animals of the same species by one or more groups of breeders which have agreed to enter those animals in breeding books with details of their known ascendants for the purpose of reproducing their inherited characteristics by way of reproduction, exchange and selection within the framework of breeding program”. Based on this definition, breeds mainly have an administrative meaning.
If the definition of the studied breed or population sticks to the observed stratification within a species or a breed, then it is possible to develop a breed/population assignment model. The more the definition of the studied breed or population fits the observed stratification, the more the developed model will be able to correctly assign animals to their breed/population. In that case, classification methods are used, i.e., categories (breeds or populations) are defined by the researcher and a model is built to correctly classify animals into these defined categories. If the researcher wants to investigate the stratification existing within a species/breed, then clustering methods are preferred. It means that categories are not known a priori in that case.
Now that we have introduced the concepts of breeds and populations, we can develop main applications of breed assignment tools (in the field of animal breeding) and population assignment tools (mostly in the field of ecology and wildlife preservation).
As we have already explained, genomic breed assignment tools can be the first step to investigate genomic diversity of breeds (Nikolic et al., 2009; Gaspar et al., 2023; Hayah et al., 2023) by the use of clustering methods. It helps to unravel stratification within a species, a breed or even populations within a breed. Several elements can explain the observed stratification such as: animal breeding management, legislation for registry in the breeding book, mating choices, selection of animals, exchanges of animals and semen across countries, farms or institutions. A very commonly performed clustering study is the estimation of admixture within breeds and, from this, to derive migration events. This kind of study is often made with STRUCTURE (Pritchard et al., 2000) and ADMIXTURE (Alexander et al., 2009) software. Based on results obtained in clustering, the objective can then be to estimate the proportion of crossbreeding in an animal and which proportion of the genome belongs to each of the studied breeds (Frkonja et al., 2012; Huang et al., 2014; He et al., 2018). For this purpose, classification methods are usually not suitable anymore and regression is preferred. This is detailed in section 8 of this paper.
Assignment to a breed can be necessary to perform genetic or genomic evaluations (Gebrehiwot et al., 2021). In this regard, breeds can be genetic groups as defined by Westell et al. (1988) in the mixed model equations. Estimations of (genomic) estimated breeding values [(G)EBV] can also be based on breed proportions. Some examples are the use of breed base representation (i.e., breed proportions) to weight within-breed GEBVs by VanRaden et al. (2020) or custom-made marker effects based on the breed of origin of alleles (Sevillano et al., 2017).
Genomic breed assignment tools also have special applications for endangered breeds like checking and maintaining the breed purity (Hulsegge et al., 2019). Regarding article 19 of the EU Regulation 2016/1012 on Animal Breeding, animals from an endangered breed can be registered in the breeding book of their respective breed based on rules defined by breeding societies. In the case of missing pedigree, a genomic breed assignment tool can be the only way to guarantee these registrations, and even more when cryobank-stored samples like embryos, germplasm, ova, sperm and blood, with no phenotypes allowing breed assignment, are available (Iquebal et al., 2014). Genomic breed assignment tools should then complement assignment based on phenotypes, when available, as the appreciation of these phenotypes is highly subjective (Baumung et al., 2006).
To allow registration in the breeding book, parentage assignment can also be a solution. For example, in extensive farming, where there is natural service conditions, the sire can be unknown (Connolly et al., 2014). To allow parentage assignment, the methodology must be unambiguous, i.e., one parent per sex is assigned to the animal with missing parents. One common way to define parentage is by counting the number of opposing homozygotes. For example, Gebrehiwot et al. (2021) used a SNP panel with high minor allele frequency and they assigned parents when there was less than 1% of opposing homozygotes.
For tracking (i.e., to follow a food product from farm to fork) and tracing (i.e., determine exactly the origin of a food product) labeled breed-derived products with high added value, breed assignment tools are very convenient, as illustrated by the different tools developed to trace meat products from different cattle breeds (Dalvit et al., 2008b, 2008a; Dimauro et al., 2013). Finally building a web source with genotypes of animals from the reference population can avoid biopiracy (Iquebal et al., 2014).
As for domestic populations, assignment tools allow to study the diversity of wild populations and their stratification. For these populations, geographical (Safran et al., 2016), ecological and biological barriers, e.g. subtypes with specialized ecological niches, anatomic incompatibilities leading to the impediment of reproduction (Johannesson et al., 2010), different routes of migration (Scordato et al., 2020) or temporal isolation (Hendry and Day, 2005), can lead to stratification. Because of these different barriers breaking the assumption of panmixia, the dispersal of wild populations can be a topic of interest. Practically, this leads to the study of the migrant proportion in a population/individual (Waser and Strobeck, 1998; Castric and Bernatchez, 2004) or of the sex-biased dispersal (Dallimer et al., 2002). In the context of invasive species, population assignment tools can also help to determine the origin of the pest (Cornuet et al., 1999). Finally, another very important application is the detection of living beings or products originating from poaching (Cornuet et al., 1999; Primmer et al., 2000).
Whatever the targeted application, there are several conditions that allow an eased development of a performant genomic breed/population assignment model. It must be highlighted that these different conditions are not independent from each other.
1. The number of training samples in the reference population, i.e., the population used to train the breed/population assignment model (Cornuet et al., 1999; Negrini et al., 2009; Bertolini et al., 2015). Usually studies use as many samples as possible to perform the breed/population assignment. Actually, the most important is not only the number of training samples but how well they represent the genetic diversity within the population or the breed. The number of training samples needed also has to be related to the level of differentiation existing between the different breeds/populations. Giving a rule of thumb to determine the necessary number of training samples is difficult because it depends on several elements, as the other conditions listed in this section. However, Connolly et al. (2014) recommended to use 400-500 animals in the reference population when the breeds are closely related and 50-100 animals when they are distant. They however did not specify what close or distant breeds were. Actually, in papers, a wide range of number of animals per breed/population are used in reference populations, e.g., 19 to 85 individuals per breed in Negrini et al. (2008) or 480 to 1042 individuals per breed in Dimauro et al. (2013).
2. The genetic heterogeneity existing in each of the population/breed to differentiate (Rosenberg et al., 2001; Bjørnstad and Røed, 2002; Hulsegge et al., 2019). The presence of heterogeneity in one population/breed and animals carrying atypical genotypes make the assignment more difficult. Of course, this is even more true if the different populations/breeds are less differentiated.
3. The number of populations/breeds to be differentiated (Campbell et al., 2003; Putnová and Štohl, 2019). It is easier to properly assign few breeds because it is easier to find patterns of differentiation, i.e., that the number of SNPs to be used for assignment decreases. For example, in Wilmot et al. (2023b), the aim was to differentiate three breeds and these three same breeds were also to be differentiated among nine other breeds in Wilmot et al. (2022). Comparing both studies, it was indeed observed that the number of SNPs to be used for differentiation decreased from 2,005 to an average of 805 across repetitions when the number of breeds decreased. However, in these studies, the decrease of the number of SNPs might also be (partially) due to an increased number of samples, representing better the genomic diversity of the different breeds.
4. The level of genetic differentiation between populations/breeds (Campbell et al., 2003; Putnová and Štohl, 2019; Gebrehiwot et al., 2021). Under the assumption of the same number of breeds/populations, the higher the level of genetic divergence is, the easier it is to assign animals to their population/breed.
5. The number of markers. Studies often tend to use as many markers as they can in order to correctly assign animals to their breed or population (Dimauro et al., 2013). The objective is then to find the optimal number of markers to reach a certain level of correct assignment (Judge et al., 2017). However, using more and more markers does not always lead to better performances of the genomic breed assignment model as can be seen in Wilmot et al. (2022). It is well known that having more variables than number of samples has a negative effect on classification models, which is referred as the curse of dimensionality (Gaspar and Breen, 2019). Then, similar to the number of samples, the most important is not the number of markers but their discriminatory power (Roques et al., 1999). Logically, markers that have segregating alleles between breeds/populations or that have extreme allele frequencies (AF) are useful for breed assignment (Campbell et al., 2003). Before the advent of SNP genotyping, in the context of the origin of human populations, the use of private alleles (Neel, 1973) was also recommended. However, as SNPs are biallelic, it is rare to find alleles that exist only in one of the breeds/populations to be differentiated.
Based on the chosen classification methodology (Wilkinson et al., 2011), the number of breeds/populations to be differentiated and their genetic divergence, the optimized number of markers to reach a threshold of correct assignment might be (very) different, especially if the used markers are SNPs. The pruning of SNPs in linkage disequilibrium was found to have an effect only on the number of selected SNPs and not on the percentage of correct assignment (Lewis et al., 2011). The density of the chip is also an important factor shaping the number of selected SNPs. Because of lower ascertainment bias, high density chips allow better performances of breed assignment models (Judge et al., 2017). This is also related to the fact that there is a wider choice of SNPs to be selected in higher density chips.
There are two main types of quality control (QC). The first one is performed on individuals and is often limited to animal call-rate because researchers have usually a set of known reliable samples from previous studies or because the number of available samples is limited (e.g., in endangered breeds). The use of all available samples when developing a genomic breed assignment tool can also allow to be closer to in routine circumstances. The second type of QC is the one made on markers and can encompass a wide range of criteria.
Most of the time, animal call-rate is the only QC performed on individual samples as it allows to discard samples with a high percentage of missing values (e.g., 10% as in Hulsegge et al., 2019; Gebrehiwot et al., 2021). It might also be interesting to remove samples with Mendelian errors when pedigree is available and reliable.
Another important point when building the reference population is, whenever the genotyped population size is high enough, to ensure a balanced representation of the different families by keeping only one animal’s sample in groups of highly related animals (Baumung et al., 2006). The objective here is to have a good representation of the within- breed/population diversity and to have animals that are less related as possible in the reference population.
Removal of outliers has also been recommended by several studies (e.g., Cornuet et al., 1999). However, it is sometimes hard to define which animals are really outliers (e.g., due to crossbreeding) or if they simply show a different, uncommon genotype. If the genotype is rare but not due to crossbreeding, it is better to include it in the reference population to have a better representation of the breed/population’s genomic diversity. A last good practice for building the reference population, even if not directly related to QC, is to use animals that were recorded in the breeding book (Negrini et al., 2009).
To conclude, we suggest to use animals that are recorded in the breeding book (Negrini et al., 2009) and for which genotypes are available with a good call-rate (e.g., at least 90% as in Hulsegge et al., 2019 and Gebrehiwot et al., 2021). If the size of the population allows it, less related animals should be selected to allow a good representativity of the breed (Baumung et al., 2006). For this same purpose, we recommend to keep animals with atypical genotypes as long as they are purebred.
The SNPs being the most widely used markers currently, we decided to focus on good practice for their QC in this section. Even if the step of selection of SNPs can be by-passed by some studies, QC of SNPs is always done. Similar to animal call-rate, SNP call-rate is the most performed QC as it allows to get rid of less reliable SNPs (Lewis et al., 2011; Frkonja et al., 2012; Dimauro et al., 2013; Huang et al., 2014; Bertolini et al., 2015; Judge et al., 2017; Kumar et al., 2019; Gebrehiwot et al., 2021; Manzoori et al., 2023; Zhao et al., 2023; Hayah et al., 2023; Jasielczuk et al., 2024). Other common and useful practices are the removal of unmapped SNPs (Dimauro et al., 2013; Bertolini et al., 2015; Judge et al., 2017; Gebrehiwot et al., 2021; Jasielczuk et al., 2024) and of SNPs located on heterosomes (Dimauro et al., 2013; Bertolini et al., 2015; Zhao et al., 2023; Jasielczuk et al., 2024). Except if the purpose is to study sex-biased dispersal, the removal of heterosomic SNPs is very important as the genomic breed/population assignment model must not be sex biased. It can also be recommended to remove monomorphic SNPs (Frkonja et al., 2012; Dimauro et al., 2013), particularly when they are monomorphic for all breeds/populations to differentiate (Wilmot et al., 2022), because these SNPs do not add any useful information for assignment (Smouse et al., 1982) or, even worse, they add noise. Some studies also used thresholds of GT score (Hulsegge et al., 2013; Jasielczuk et al., 2024), GC score (Hulsegge et al., 2013; Gebrehiwot et al., 2021; Jasielczuk et al., 2024), minor allele frequency (Dimauro et al., 2013; Hayah et al., 2023; Jasielczuk et al., 2024) and/or Hardy-Weinberg equilibrium (Frkonja et al., 2012; Dimauro et al., 2013; Judge et al., 2017; Jasielczuk et al., 2024) for QC of SNPs. Wilmot et al. (2022) demonstrated that discarding SNPs with deviation from Hardy-Weinberg equilibrium did not have any effect on the performance of breed assignment models. This has to be further validated by new studies as it might depend on the studied breeds and the chosen methodology/model of assignment.
Besides QC per se, imputing missing SNPs is also a matter of importance as the chosen methodology of assignment might not allow any missing values in samples. For this purpose, several strategies were implemented in studies. The genotype found to be the most frequent within the breed/population can be used for imputation (Dimauro et al., 2013; Bertolini et al., 2015). Instead of imputing all individuals, both from the reference and the validation population, together, Gaspar and Breen (2019), in the context of genetic ancestry of human populations, recommended to impute individuals to be tested one by one, based on the reference population. We can apply this in the context of breed/population assignment. It is indeed better to impute animals to be tested in a second step, after the imputation of all reference animals. Otherwise, there can be an upward bias in the performance of the developed breed/population assignment model. The Beagle software (Browning and Browning, 2007), based on a haplotype-cluster model, is very commonly used for imputation of missing values (Hulsegge et al., 2019). Paschou et al. (2007) imputed human genotypes using a least-squares regression-based technique (Alter et al., 2000). Because they did not implement this strategy separately for each of the studied populations but for all of them together, the imputed genotypes can be less differentiated across the different populations than they truly are. Nonetheless, an all-breed/population imputation can be seen as a mean to discard less reliable SNPs in the step of selection of markers.
To conclude, we suggest to use the following SNP QC: high call-rate (e.g., 95% as in Hulsegge et al., 2013), polymorphic mapped SNPs on autosomes (Dimauro et al., 2013) with GT score higher than 0.55 and GC score higher than 0.2 (Hulsegge et al., 2013). We do not recommend to discard SNPs with low minor allele frequency as they contain important source of variation among breeds. If the chosen methodology does not allow any missing SNPs, we suggest to do the imputation for each breed separately (if the size of the sample of genotyped animals allows it) and to impute validation animals one by one, in a separate step, based on the reference population (Wilmot et al., 2022). This paves the way for the next step: selection of markers.
As we highlighted in the previous section, the selection of markers is not a mandatory step for developing a breed/population assignment model and all the available markers can be used for this purpose. Why therefore did some studies still decide to select markers?
1. It can increase the performance of prediction (Wilkinson et al., 2011; Pasupa et al., 2020) by removing markers that are correlated to others (referring to collinearity of variables) and by that mean decreasing the noise the model has to deal with. Reducing the number of used markers can also reduce the risk of overfitting which can be related to the curse of dimensionality, i.e., number of markers being notably higher than the number of genotypes. The main purpose of the step of selection of markers is therefore simply to detect the best set of predictors for breed/population classification. When the markers are SNPs, this best set of predictors can bear the following names: Breed-Informative SNPs (Bertolini et al., 2015; Schiavo et al., 2020; Kumar et al., 2021; Hayah et al., 2023), Ancestry Informative SNPs (Lewis et al., 2011) or, very simply, Informative SNPs (Judge et al., 2017; Bertolini et al., 2018; Hulsegge et al., 2019; Moradi et al., 2021; Jasielczuk et al., 2024). Other names can be used for the selected panel of markers.
2. It can decrease the computation time (Kwak and Choi, 2002). This assumption is however very dependent on the used methodology and the size of selected panels.
3. The cost of the routine use of the breed/population assignment tool can also decrease as low and mid density chips are less expensive than high density chips or whole genome sequencing. However, nowadays, the use of high density chips is more and more common as their cost is constantly decreasing. Developing a customized SNP chip for breed assignment purposes can also involve important financial resources.
One important drawback of the step of the selection of markers is that the genomic breed/population assignment model might not be sustainable in the long (or even the short) run. In the specific case of SNPs, this is because SNP chips are regularly updated and selected SNPs might not be found on these new SNP chips. This is true even if the genomic breed/population assignment model is based on a subset of SNPs overlapping several chips. Considering this problem, why not simply using all the available SNPs, potentially at the overlap of several SNP chips? Wilmot et al. (2023b) showed it was possible to have similar performances of assignment with and without selection of SNPs, avoiding overfitting and the curse of dimensionality by summarizing SNP information in a few variables (the mean and the standard deviation of the relationships) to be used for the genomic breed assignment model. The computation time was therefore not compromised, even for training the model. A suggestion would therefore be to keep all available SNPs to build the breed/population assignment model and then to regularly update the reference population by removing animals genotyped with older chips and adding recently genotyped ones.
The step of selection of markers can therefore be avoided when mid density SNP chips are used but probably not for higher density chips or whole genome sequencing as noise, curse of dimensionality and computer time will strongly increase in that case. There is however a lack of study about this topic.
Now that we have discussed if it is useful to select markers, let us see how we can practically do this. The selection of markers often presupposes the use of an indicator to decide which marker to keep and which one to discard. The most common type of indicators rely on AF. For example, global and pairwise Fst (Wilkinson et al., 2011; Frkonja et al., 2012; Hulsegge et al., 2013; Judge et al., 2017; He et al., 2018; Zhao et al., 2023; Jasielczuk et al., 2024), the difference of AF (Wilkinson et al., 2011; Hulsegge et al., 2013; Judge et al., 2017; Gebrehiwot et al., 2021; Zhao et al., 2023; Jasielczuk et al., 2024) or their combination (Judge et al., 2017) have been common indicators for selection of SNPs. Recently, more refined and sophisticated techniques have been added to the list of means to select SNPs. One can cite PCA (Wilkinson et al., 2011; Hayah et al., 2023), multivariate canonical discriminant analysis (Dimauro et al., 2013), artificial neural network (Iquebal et al., 2014; Manzoori et al., 2023) or random forest (Wilmot et al., 2022). To make the selection of SNPs even more complex, these different indicators can also be combined in multiple stages (Bertolini et al., 2015, 2018; Hulsegge et al., 2019; Pasupa et al., 2020; Wilmot et al., 2022). Even if multiple stages are used to select SNPs, it does not necessarily mean that there is no collinearity anymore in the selected set. Authors propose some strategies to solve this issue. Judge et al. (2017) suggested to define blocks of SNPs within each chromosome and then to select the best n SNPs within each block. Hulsegge et al. (2013) and Kumar et al. (2019) used linkage disequilibrium as a filter in the panel of selected SNPs to remove correlated SNPs. Another suggestion to remove SNPs in collinearity is by systematic selection of every ith SNP as Frkonja et al. (2012) did.
Besides the important question of the indicator (or their combination) to be used to select markers, the issue is now to decide how many markers have to be selected. Again, there is no consensus in the literature about this question. Some authors preferred to select an arbitrary number of markers (Bertolini et al., 2018; He et al., 2018; Hulsegge et al., 2019; Jasielczuk et al., 2024). It was also advocated to test different panel sizes to estimate which one gives the most performant model, e.g., by incrementation (Judge et al., 2017). Another way to estimate the panel size is to define a percentage of correct assignment to be reached and select the markers that allow this percentage of correct assignment (Wilkinson et al., 2011; Manzoori et al., 2023). A last way to define the number of markers is by setting a threshold to the chosen indicator. As an example, Wilmot et al. (2022) defined different thresholds for each indicator they used for selection of SNP markers, leading to 64 different SNP panels to be tested.
In studies, the classification step is not always clearly distinguished from the selection of markers, mostly when they are based on the same method. The main purpose of the classification step is to train the model on the reference population to achieve the best performance. Recently, more and more studies have used machine learning techniques for classification which involves tuning of hyperparameters. A cross-validation (CV) is a very common way to tune hyperparameters. The reference population is first divided in n folds. Each fold is successively used for internal validation, i.e., for evaluating the model, while the others, n-1 folds, are used for building the model. This whole process of random division can also be repeated, referring then to repeated CV. Therefore, the performances in CV is the average of 1-the conditional error rate across the number of folds repeated n times. We then choose hyperparameters that allow the best average performance.
Similar to the step of selection of markers, very different methods can be used for classification. It is difficult to draw conclusions regarding the best classification method because the number of breeds to differentiate, their differentiation level or the SNPs selected (and how they were selected) differ from one study to the other. Moreover, the validation step is sometimes skipped in studies, making the comparison even more difficult, and, most of the time, studies did not compare different methodologies of assignment. However, Wilmot et al. (2022) found out that the nearest shrunken centroids and partial-least squares discriminant analysis gave better global accuracy of assignment than random forest and support vector machine (respectively 97.33%, 98.22%, 88.79% and 75.08% in CV in the best cases). Zhao et al. (2023) compared the k-nearest neighbours, the random forest and the support vector machine techniques and suggested to combine all of these to obtain better accuracy (higher than 99% in their study). Historically, breed/population assignment models were based on microsatellites and likelihood of the genotype to belong to the population based on the distribution of AF (Paetkau et al., 1995; Bjørnstad and Røed, 2002). In a recent study, Manzoori et al. (2023) showed that this methodology was less performant than the artificial neural networks (70% vs 93% of correct assignment). Bayesian approaches were later slowly preferred to likelihood techniques (e.g., Negrini et al., 2009). However, Dalvit et al. (2008a) had quite poor accuracy with Bayesian approaches (only 52.5% of animals with at least 90% of probability were correctly assigned). This is similar to Baumung et al. (2006) who had 66% of correct assignment for one of the sheep breeds to be assigned. On the other hand, Putnová and Štohl (2019) had better performances with Bayesian approaches than with random forest and support vector machine, demonstrating once again the difficulty of proving one classification methodology as the best. Machine learning techniques have then been preferred to traditional Bayesian methods. Dimauro et al. (2013) used the canonical discriminant analysis for breed assignment, which is similar to the partial least squares-discriminant analysis as it also makes a linear combination of variables. They could achieve 100% of accuracy, without validation though, and the analysis was done chromosome by chromosome, which can be avoided by other methodologies. Another used machine learning technique is random forest. It is a pretty intuitive method of classification, easy to tune and that handles well the high number of variables related to genotyping. Even if some studies found almost perfect global accuracies with random forest (Bertolini et al., 2015, 2018), the study of Wilmot et al. (2022) demonstrated it was not the most performant, which was probably related to the higher number of breeds to differentiate in their study. In recent years, artificial neural networks have gained popularity in the scientific community. However, their application in population/breed assignment is probably not easy when using SNPs as the number of nodes per layer can then be incredibly high, which increases the computation cost. One solution is to apply a very stringent SNP selection: Manzoori et al. (2023) obtained a global accuracy of 93% with 110 SNPs when using deep neural networks. Other classification methodologies can be directly based on distances or relationships, which are probably easier to interpret. Using the 5 nearest neighbors, Lewis et al. (2011) could achieve almost 100% of accuracy, without validation. Similarity matrices have recently been designed (Varga et al., 2022; Perfilyeva et al., 2024) for dog breeds’ assignment. The genomic relationship matrix can also be a method of choice for breed/population assignment. It summarizes the information of the genotypes and therefore avoids the curse of dimensionality. When combined with support vector machine, Wilmot et al. (2023b) obtained 96% of validation global accuracy, based on 200 resamples. This global accuracy percentage was statistically similar to their previously best found model in Wilmot et al. (2022), based on the nearest shrunken centroids method. If not applied directly on genotypes but on average and standard deviation of relationships, the support vector machine methodology can therefore be useful for breed/population assignment, even if its hyperparameters are less easy to tune, especially when the kernel is not linear. However, Pasupa et al. (2020) had a global accuracy of 95.66% using linear or radial support vector machine for assignment of pig breeds. Based on all these examples, we can say that the best classification methodology is case specific. We therefore suggest to use a machine learning technique, properly tuned, validated and using appropriate performance indicators (described in sections 9 and 10 of this review) for a performant breed/population assignment.
Developing a model for detection of crossbred and breed proportions can be a difficult task as it relies on the definition given for a crossbred. Even if there are cases where breeds and lines are clearly defined and registered in pedigree records, the fact is that local breeds often lack complete pedigree and therefore breed compositions. Knowing that these breeds were often admixed for their maintenance, it makes the definition of purebred and crossbred very uneasy in this case. Therefore, for local breeds, it is rather difficult to define a threshold under which animals are predicted as crossbred based on false positives and false negatives as suggested by Hulsegge et al. (2019).
The most straightforward manner to estimate breed proportions is by regressing genotypes on AF (Kuehn et al., 2011; Huang et al., 2014; Funkhouser et al., 2017; He et al., 2018; Calus et al., 2022). Partial least squares or least absolute shrinkage and selection operator (LASSO) variable selection are sometimes used to improve the prediction of the breed composition (Frkonja et al., 2012). The ADMIXTURE software has also been commonly used for breed composition, each defined cluster being related to an existing breed (Gobena et al., 2018; He et al., 2018; Gebrehiwot et al., 2021; Calus et al., 2022). However, in some cases, even if the number of clusters is tuned to be equal the number of breeds to differentiate, each defined cluster is not necessarily related to an existing breed (Wilmot et al., 2023a). Bayesian models have also been used to predict the breed composition. VanRaden et al. (2020) considered breeds as continuous variables, animals being purebred having a phenotype of 100 for this breed and 0 for others. He used a genomic evaluation model implemented in the BayesA algorithm (VanRaden, 2008) to predict the breed composition. This method is suitable when all the breeds at the origin of the studied crossbreds have been sampled or for composite breeds considered as purebred (e.g., Ayrshire). Similarly the BayesB algorithm has also been used (Meuwissen et al., 2001) for breed composition prediction (Frkonja et al., 2012). Another strategy for breed composition that deserves attention is the BOA model developed by Vandenplas et al. (2016) that uses phased haplotypes. A similar algorithm, also based on phased haplotypes, was also developed by Weldrufael et al. (2024).
Using methodologies based on distances for breed composition is less practical because there is a need to translate probabilities to breed proportions, which is not always straightforward. Which probability threshold to consider an animal as crossbred? Relationships between breed proportions, e.g., 87.5% to be considered purebred (Hulsegge et al., 2019), and predicted probabilities should be established. Moreover, the relationships of the different breeds should be considered when establishing these thresholds. A small and significant probability to belong to another closely related breed might not be considered as crossbreeding in opposition to a small, but significant, probability to belong to a more distant breed. It seems therefore more straightforward to use the strategies described in the previous paragraph for breed composition.
The objective of the validation step is simply to estimate how the model would perform in routine, i.e., with new animals, not used for the selection of markers and the training of the classification model. The trained model is therefore applied on these new animals and the performance of the model evaluated. Once again, this step does not often appear in studies (for example not in Roques et al., 1999; Lewis et al., 2011; Dimauro et al., 2013; He et al., 2018; Kumar et al., 2019) and, if so, is often quite confused with the step of classification (e.g., Wilkinson et al., 2011). Therefore, the CV for hyperparameters tuning or selection of markers should not be used to assess the model performance in the meantime. It is of main importance to clearly distinguish the steps of classification and validation to avoid to overfit the designed model for breed/population assignment. As we already highlighted, it is also of main importance to not use validation animals for the step of selection of markers because it can lead to an upward bias in the performance evaluation when validation animals are tested. This was demonstrated in the context of human populations by Smouse et al. (1982). Campbell et al. (2003) left aside one animal to be assigned when computing AF (“leave-one-out”), which is already an improvement compared to using all animals for all steps of development of a breed assignment model. Huang et al. (2014) used purebred animals and others with unknown breed composition for validation purposes. In this case, it is difficult to evaluate accurately the performance of the model and the use of crossbreds with known breed composition should obviously be favored like in Gebrehiwot et al. (2021).
The best advice is therefore to put apart a proportion of the available genotypes for validation purposes only. This needs to be the standard for the design of a breed/population assignment model. Studies can randomly choose 10% (Bertolini et al., 2015, 2018) or 20% (Iquebal et al., 2014) of the samples to evaluate the model in validation. A good practice according to Nadeau and Bengio (2003) is to have classification sets that are 5 to 10 times bigger than validation sets. New samples of purebreds and/or crossbreds can also be used (Padilla et al., 2009; Kuehn et al., 2011; Frkonja et al., 2012; Hulsegge et al., 2013, 2019; Judge et al., 2017). Especially for endangered breeds, as the number of available samples can be limited, the simulation of purebred (Dalvit et al., 2008a), or even crossbreds (Funkhouser et al., 2017), also when estimating the breed of origin of alleles (Weldrufael et al., 2024), can be a solution for validation. Another important element to look at in the validation step is how the model behaves when breeds that were not used for developing the model are tested (Funkhouser et al., 2017; Hulsegge et al., 2019).
Whether it is for the classification or the validation step, the evaluation of the breed/population assignment model should rely on a (or several) performance indicator(s). There is therefore not a unique way to evaluate the performance of a model. Here are some of the most common performance measures:
1. The most basic performance measure is the percentage of correct assignment, i.e., the global accuracy (Baumung et al., 2006; Negrini et al., 2008; Lewis et al., 2011; Iquebal et al., 2014; Bertolini et al., 2015, 2018; Hulsegge et al., 2019; Putnová and Štohl, 2019).
2. The sensitivity which is the percentage of correct assignment for each of the breeds/populations to be differentiated and its corollary, specificity, which is the percentage of animals not from a specific breed/population that are indeed not assigned to this breed/population (Negrini et al., 2008; Wilmot et al., 2022, 2023b; Jasielczuk et al., 2024).
3. The balanced accuracy is weighting the different breeds/populations according to their number of samples when computing accuracy (Brodersen et al., 2010). It can therefore also be seen as the average of breed/population sensitivities. The balanced accuracy should be more widely used to evaluate breed/population assignment models as it summarizes very well their average performance while considering disparities in breed/population performances and therefore replaces the combined use of global accuracy, sensitivity and specificity.
4. Probabilities of assignment (Paetkau et al., 1995; Jasielczuk et al., 2024) are another important indicator for evaluation of performances. The highest probability of the genotype to belong to a breed/population can be used for breed/population assignment. However, that means that very low probabilities can lead to assignment to a specific breed and the more breeds/populations to differentiate, the more there is a chance that this happens. One solution is to use a threshold of probability (Dalvit et al., 2008a) or log likelihood ratios of the probability to be assigned (Wilkinson et al., 2011; Hulsegge et al., 2013; Manzoori et al., 2023) to make the decision about the predicted breed/population. A drawback is that if none of the probabilities reaches the threshold, then the animal is left unassigned. Probabilities can also be used to estimate breed proportions of crossbreds. However, the relationship between probabilities and breed proportions can sometimes be difficult to estimate as we have already highlighted. It is not because the probability of an animal to belong to a breed equals 87.5% that this animal has a breed proportion of 87.5% for this breed. In brief, breed probabilities and proportions are not strictly equivalent.
5. Finally, for crossbreds, it is common to estimate the correlation between the predicted and the real breed proportions, the latter being estimated for example based on pedigree or the full set of markers (Kuehn et al., 2011; Frkonja et al., 2012; Funkhouser et al., 2017; Judge et al., 2017; Gobena et al., 2018; Gebrehiwot et al., 2021). The root mean square error can also be valuable for the evaluation of genomic breed assignment in the case of crossbreds.
The main problem when evaluating models based on one random sample of validation animals is that the performance of the model is based on this unique random partition to reference and validation populations. This means that a model can appear the best just by chance. If the number of samples is high enough, it is then very simple to subsample the dataset in different samples of the same size and then randomly sample again in a reference and validation population each of these subsamples. We can then use a classical paired Student’s T-test or non-parametric paired tests like Wilcoxon signed ranked or Friedman test (Demšar, 2006) on the average performance of models to evaluate which one is the best. However, for local and endangered breeds, with limited number of samples by definition, it is most of the time not possible to obtain independent datasets.
Wilmot et al. (2023b) used an adapted paired Student’s T-test, based on the equation of Bouckaert and Frank (2004) to compare the global accuracy, sensitivity and specificity of four different models. The use of an adapted Student’s T-test was necessary because the validation was made on 200 random resamples. In that case, the use of classical Student’s T-test is strongly discouraged because the assumption of independence of observations is violated (Dietterich, 1998). Another solution adopted by Wilmot et al. (2023b) is the use of a Bootstrap confidence interval. The main strength of a Bootstrap confidence interval is that it does not rely on any assumption, making it very suitable for any case of comparison of methodologies (Brownlee, 2019).
We can find other strategies in the literature to overcome the issue of the dependence of observations happening when there is resampling. For each pair of models to compare, one can use a McNemar’s test (McNemar, 1947), based on a contingency table of the number of accordant and discordant results between models. The objective of the test is to detect significant differences of discordant results between the models. The main limitation of the McNemar’s test is that it can only be used when there are only two breeds or populations to be differentiated. Dietterich (1998) recommended to use a two folds CV, repeated 5 times, and then the adapted Student’s T-test for evaluation of models. However, if there is already a need to use CV for the tuning of hyperparameters, this means that a nested CV should be used, which is a bit trickier to implement.
Finally, a last indicator to consider to evaluate performance of breed/population assignment model is the training time and the time to assign each animal to its breed/population in validation (or in routine). The most important is to limit the latest as the model should be able to quickly assign new animals with a high accuracy to their breed/population of origin in routine. In opposition, the training is only done once in a while to update the model and it is not an issue if it takes more time than routine tests. Of course, it is also less important to have a short validation or test time if there are few animals to be tested in a routine basis. Therefore, what is considered a reasonable computation time for training or for in routine tests depends on the context, that is, needs for updating the model and number of animals to be assigned in routine.
There are three main steps, that should be clearly distinguished, for the development of a breed/population assignment model: selection of markers, classification and validation. These steps are summarized in Figure 1, along with complementary steps, considering SNPs as the used markers. If the first step should be skipped or not depends on the chosen methodology and the density of genotyping. To select markers, a QC must be first performed to eliminate less reliable and less informative markers. A methodology should then be chosen, as well as a threshold, to indicate if the marker should be kept or not. Pruning of markers in linkage disequilibrium can be done to avoid collinearity and limit noise in the model. The step of classification is nowadays mostly done with machine learning techniques. The CV can be used to tune hyperparameters of the model, based on the reference population. The reference population should consist of animals with high call-rate, that are less related as possible and representative of the breed diversity. In this regard, atypical animals are very interesting to build the reference population. Then, for the validation step, we strongly recommend to use animals that were not used in previous steps, purebred but also crossbreds, as well as animals from new breeds/populations. To evaluate the model, both in classification and validation steps, we recommend the use of balanced accuracy as it accounts for the sample size of each breed/population, and of probabilities of assignment. It can also be useful to define a minimum probability under which animals are considered unassigned. If possible, the available genotypes can be subsampled to repeat the evaluation of the model and reduce bias due to partition. Otherwise, statistical tests for resampling can be used. Another important aspect to look at is the computation time to assign new animals so that the tool can be used in routine.
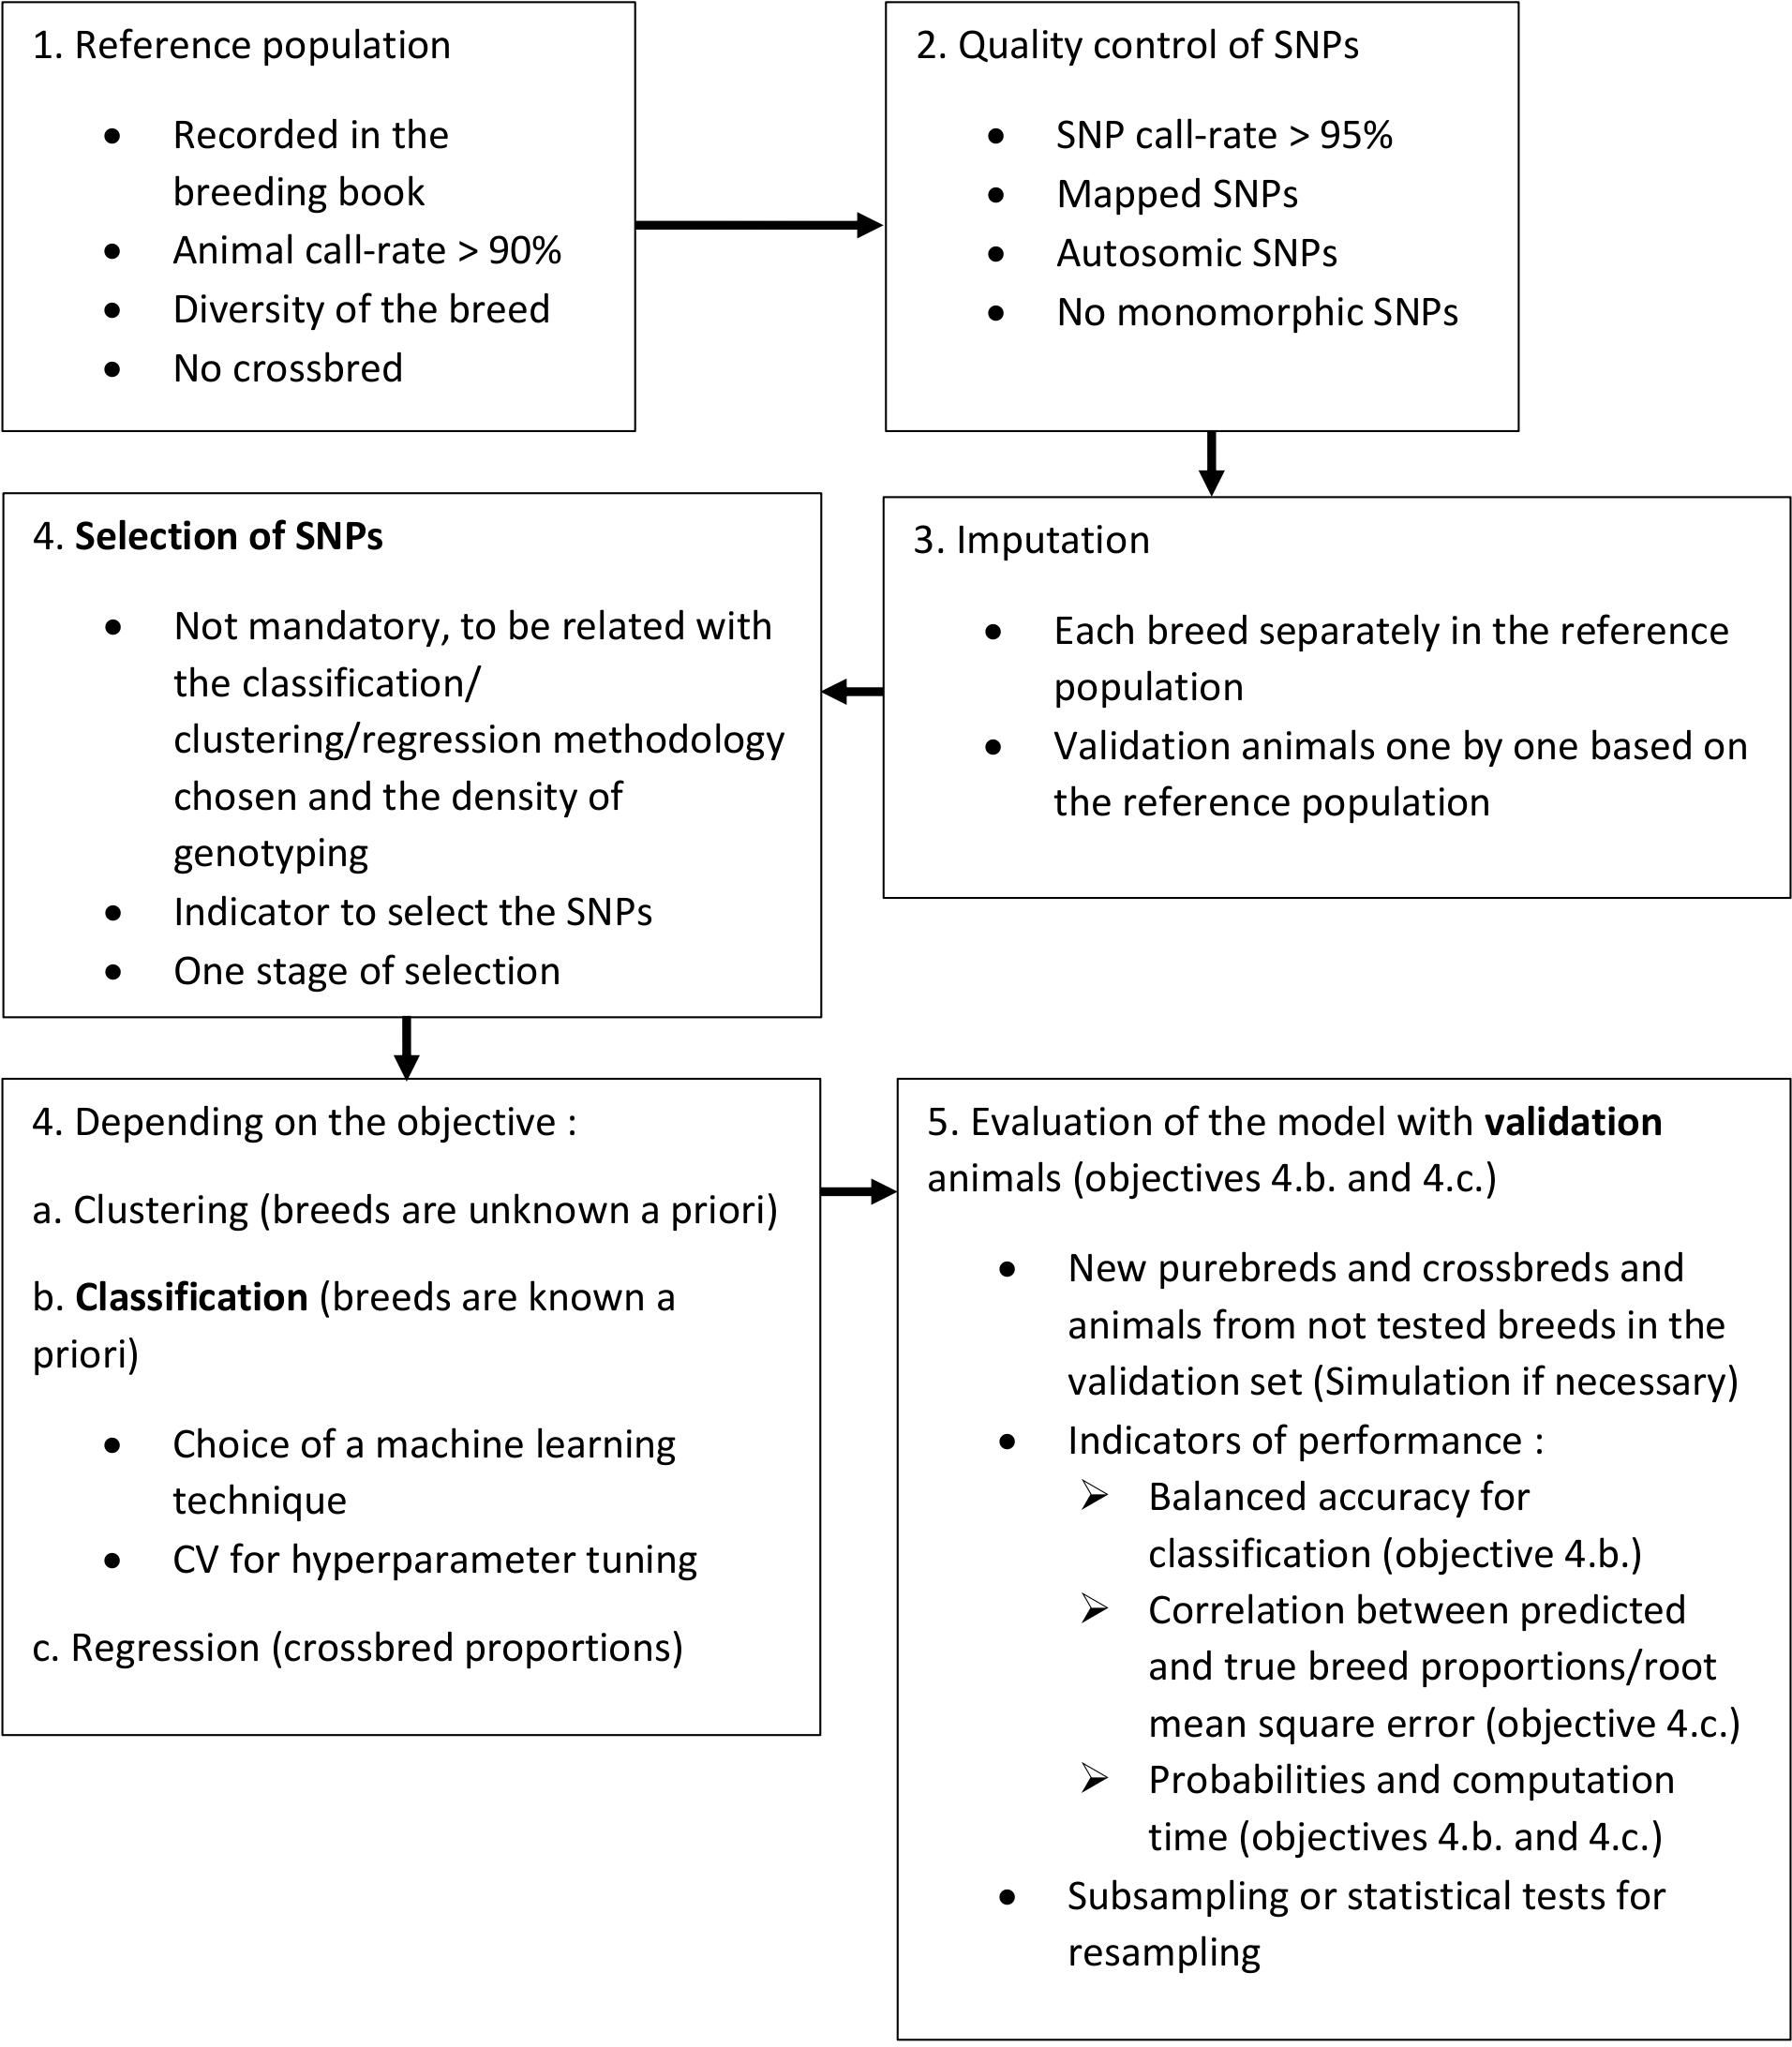
Figure 1. Work flow for good practice for breed assignment. In bold, main steps for breed assignment.
HW: Conceptualization, Investigation, Writing – original draft. NG: Supervision, Writing – review & editing.
The author(s) declare that financial support was received for the research, authorship, and/or publication of this article. H. Wilmot, as a former Research Fellow and N. Gengler, as a former Senior Research Associate, acknowledge the support of the Fonds de la Recherche Scientifique – FNRS (Brussels, Belgium). The Walloon Government (Service Public de Wallonie – Direction Générale Opérationnelle Agriculture, Ressources Naturelles et Environnement, SPW-DGARNE; Namur, Belgium) is acknowledged for its financial support. The authors gratefully acknowledge the support of the project 'Rotbunt DN' funded under the European Innovation Partnership (EIP Agri) Schleswig-Holstein, Germany, through the European Agricultural Fund for Rural Development (EAFRD).
This paper was adapted from the Chapter 4 of the doctoral thesis of H. Wilmot: “Supporting the management and diversity of local breeds through the use of genomic tools” Available at: https://hdl.handle.net/2268/309315.
The authors declare that the research was conducted in the absence of any commercial or financial relationships that could be construed as a potential conflict of interest.
The author(s) declared that they were an editorial board member of Frontiers, at the time of submission. This had no impact on the peer review process and the final decision.
The author(s) declare that no Generative AI was used in the creation of this manuscript.
All claims expressed in this article are solely those of the authors and do not necessarily represent those of their affiliated organizations, or those of the publisher, the editors and the reviewers. Any product that may be evaluated in this article, or claim that may be made by its manufacturer, is not guaranteed or endorsed by the publisher.
AF, allelic frequency; CV, cross-validation; (G)EBV, (genomic) estimated breeding value; QC, quality control; SNP, single nucleotide polymorphism.
Alexander D. H., Novembre J., Lange K. (2009). Fast model-based estimation of ancestry in unrelated individuals. Genome Res. 19, 1655–1664. doi: 10.1101/gr.094052.109
Alter O., Brown P. O., Botstein D. (2000). Singular value decomposition for genome-Wide expression data processing and modeling. Proc. Natl. Acad. Sci. U. S. A. 97, 10101–10106. doi: 10.1073/pnas.97.18.10101
Baumung R., Cubric-Curik V., Schwend K., Achmann R., Sölkner J. (2006). Genetic characterisation and breed assignment in Austrian sheep breeds using microsatellite marker information. J. Anim. Breed. Genet. 123, 265–271. doi: 10.1111/j.1439-0388.2006.00583.x
Bertolini F., Galimberti G., Calò D. G., Schiavo G., Matassino D., Fontanesi L. (2015). Combined use of principal component analysis and random forests identify population-informative single nucleotide polymorphisms: Application in cattle breeds. J. Anim. Breed. Genet. 132, 346–356. doi: 10.1111/jbg.12155
Bertolini F., Galimberti G., Schiavo G., Mastrangelo S., Di Gerlando R., Strillacci M. G., et al. (2018). Preselection statistics and Random Forest classification identify population informative single nucleotide polymorphisms in cosmopolitan and autochthonous cattle breeds. Animal 12, 12–19. doi: 10.1017/S1751731117001355
Bjørnstad G., Røed K. H. (2002). Evaluation of factors affecting individual assignment precision using microsatellite data from horse breeds and simulated breed crosses. Anim. Genet. 33, 264–270. doi: 10.1046/j.1365-2052.2002.00868.x
Bouckaert R. R., Frank E. (2004). “Evaluating the Replicability of Significance Tests for Comparing Learning Algorithms,” in Advances in Knowledge Discovery and Data Mining. 8th Pacific-Asia Conference, PAKDD 2004, Vol.3056 pp. 3–12 (Sydney: Springer).
Brodersen K. H., Ong C. S., Stephan K. E., Buhmann J. M. (2010). “The balanced accuracy and its posterior distribution,” in 2010 20th International Conference on Pattern Recognition. (New York City: IEE)3121–3124. doi: 10.1109/ICPR.2010.764
Browning S. R., Browning B. L. (2007). Rapid and accurate haplotype phasing and missing-data inference for whole-genome association studies by use of localized haplotype clustering. Am. J. Hum. Genet. 81, 1084–1097. doi: 10.1086/521987
Brownlee J. (2019). Statistical significance tests for comparing machine learning algorithms. Mach. Learn. Mastery. Available at: https://machinelearningmastery.com/statistical-significance-tests-for-comparing-machine-learning-algorithms/ (Accessed June 14, 2023).
Calus M. P. L., Henshall J. M., Hawken R., Vandenplas J. (2022). Estimation of dam line composition of 3-way crossbred animals using genomic information. Genet. Sel. Evol. 54, 1–11. doi: 10.1186/s12711-022-00728-4
Campbell D., Duchesne P., Bernatchez L. (2003). AFLP utility for population assignment studies: Analytical investigation and empirical comparison with microsatellites. Mol. Ecol. 12, 1979–1991. doi: 10.1046/j.1365-294X.2003.01856.x
Castric V., Bernatchez L. (2004). Individual assignment test reveals differential restriction to dispersal between two salmonids despite no increase of genetic differences with distance. Mol. Ecol. 13, 1299–1312. doi: 10.1111/j.1365-294X.2004.02129.x
Connolly S., Fortes M., Piper E., Seddon J., Kelly M. (2014). “10th World Congress of Genetics Applied to Livestock Production,” in Determining the number of animals required to accurately determine breed composition using genomic data (American Society of Animal Science, Vancouver (Canada).
Cornuet J. M., Piry S., Luikart G., Estoup A., Solignac M. (1999). New methods employing multilocus genotypes to select or exclude populations as origins of individuals. Genetics 153, 1989–2000. doi: 10.1093/genetics/153.4.1989
Dallimer M., Blackburn C., Jones P. J., Pemberton J. M. (2002). Genetic evidence for male biased dispersal in the red-billed quelea Quelea quelea. Mol. Ecol. 11, 529–533. doi: 10.1046/j.0962-1083.2001.01454.x
Dalvit C., De Marchi M., Dal Zotto R., Gervaso M., Meuwissen T., Cassandro M. (2008a). Breed assignment test in four Italian beef cattle breeds. Meat Sci. 80, 389–395. doi: 10.1016/j.meatsci.2008.01.001
Dalvit C., Marchi M. D., Targhetta C., Gervaso M., Cassandro M. (2008b). Genetic traceability of meat using microsatellite markers. Food Res. Int. 41, 301–307. doi: 10.1016/j.foodres.2007.12.010
Demšar J. (2006). Statistical comparisons of classifiers over multiple data sets. J. Mach. Learn. Res. 7, 1–30.
Dietterich T. G. (1998). Approximate statistical tests for comparing supervised classification learning algorithms. Neural Comput. 10, 1895–1923. doi: 10.1162/089976698300017197
Dimauro C., Cellesi M., Steri R., Gaspa G., Sorbolini S., Stella A., et al. (2013). Use of the canonical discriminant analysis to select SNP markers for bovine breed assignment and traceability purposes. Anim. Genet. 44, 377–382. doi: 10.1111/age.12021
Frkonja A., Gredler B., Schnyder U., Curik I., Sölkner J. (2012). Prediction of breed composition in an admixed cattle population. Anim. Genet. 43, 696–703. doi: 10.1111/j.1365-2052.2012.02345.x
Funkhouser S. A., Bates R. O., Ernst C. W., Newcom D., Steibel J. P. (2017). Estimation of genome-wide and locus-specific breed composition in pigs. Transl. Anim. Sci. 1, 36–44. doi: 10.2527/tas2016.0003
Gaspar H. A., Breen G. (2019). Probabilistic ancestry maps: A method to assess and visualize population substructures in genetics. BMC Bioinf. 20, 1–11. doi: 10.1186/s12859-019-2680-1
Gaspar D., Usié A., Leão C., Guimarães S., Pires A. E., Matos C., et al. (2023). Genome-wide assessment of the population structure and genetic diversity of four Portuguese native sheep breeds. Front. Genet. 14. doi: 10.3389/fgene.2023.1109490
Gebrehiwot N. Z., Strucken E. M., Marshall K., Aliloo H., Gibson J. P. (2021). SNP panels for the estimation of dairy breed proportion and parentage assignment in African crossbred dairy cattle. Genet. Sel. Evol. 53, 1–18. doi: 10.1186/s12711-021-00615-4
Gobena M., Elzo M. A., Mateescu R. G. (2018). Population structure and genomic breed composition in an Angus-Brahman crossbred cattle population. Front. Genet. 9. doi: 10.3389/fgene.2018.00090
Hayah I., Talbi C., Chafai N., Houaga I., Botti S., Badaoui B. (2023). Genetic diversity and breed-informative SNPs identification in domestic pig populations using coding SNPs. Front. Genet. 14. doi: 10.3389/fgene.2023.1229741
He J., Guo Y., Xu J., Li H., Fuller A., Tait R. G., et al. (2018). Comparing SNP panels and statistical methods for estimating genomic breed composition of individual animals in ten cattle breeds. BMC Genet. 19, 56. doi: 10.1186/s12863-018-0654-3
Hendry A. P., Day T. (2005). Population structure attributable to reproductive time: Isolation by time and adaptation by time. Mol. Ecol. 14, 901–916. doi: 10.1111/j.1365-294X.2005.02480.x
Huang Y., Bates R. O., Ernst C. W., Fix J. S., Steibel J. P. (2014). Estimation of U.S. yorkshire breed composition using genomic data. J. Anim. Sci. 92, 1395–1404. doi: 10.2527/jas.2013-6907
Hulsegge B., Calus M. P. L., Windig J. J., Hoving-Bolink A. H., Maurice-van Eijndhoven M. H. T., Hiemstra S. J. (2013). Selection of SNP from 50K and 777K arrays to predict breed of origin in cattle. J. Anim. Sci. 91, 5128–5134. doi: 10.2527/jas.2013-6678
Hulsegge I., Schoon M., Windig J., Neuteboom M., Hiemstra S. J., Schurink A. (2019). Development of a genetic tool for determining breed purity of cattle. Livest. Sci. 223, 60–67. doi: 10.1016/j.livsci.2019.03.002
Iquebal M. A., Ansari M. S., Sarika S., Dixit S. P., Verma N. K., Aggarwal R. A. K., et al. (2014). Locus minimization in breed prediction using artificial neural network approach. Anim. Genet. 45, 898–902. doi: 10.1111/age.12208
Jasielczuk I., Gurgul A., Szmatoła T., Radko A., Majewska A., Sosin E., et al. (2024). The use of SNP markers for cattle breed identification. J. Appl. Genet. 65 (3), 575–589. doi: 10.1007/s13353-024-00857-0
Johannesson K., Panova M., Kemppainen P., André C., Rolan-Alvarez E., Butlin R. K. (2010). Repeated evolution of reproductive isolation in a marine snail: Unveiling mechanisms of speciation. Philos. Trans. R. Soc B Biol. Sci. 365, 1735–1747. doi: 10.1098/rstb.2009.0256
Judge M. M., Kelleher M. M., Kearney J. F., Sleator R. D., Berry D. P. (2017). Ultra-low-density genotype panels for breed assignment of Angus and Hereford cattle. Animal 11, 938–947. doi: 10.1017/S1751731116002457
Kuehn L. A., Keele J. W., Bennett G. L., McDaneld T. G., Smith T. P. L., Snelling W. M., et al. (2011). Predicting breed composition using breed frequencies of 50,000 markers from the US Meat Animal Research Center 2,000 bull project. J. Anim. Sci. 89, 1742–1750. doi: 10.2527/jas.2010-3530
Kumar H., Panigrahi M., Chhotaray S., Pal D., Bhanuprakash V., Saravan K. A., et al. (2019). Identification of breed-specific SNP panel in nine different cattle genomes. Biomed. Res. 30, 78–81, 145473. doi: 10.35841/biomedicalresearch.30-18-1195
Kumar H., Panigrahi M., Saravanan K. A., Parida S., Bhushan B., Gaur G. K., et al. (2021). SNPs with intermediate minor allele frequencies facilitate accurate breed assignment of Indian Tharparkar cattle. Gene 777. doi: 10.1016/j.gene.2021.145473
Kwak N., Choi C. H. (2002). Input feature selection for classification problems. IEEE Trans. Neural Networks 13, 143–159. doi: 10.1109/72.977291
Lewis J., Abas Z., Dadousis C., Lykidis D., Paschou P., Drineas P. (2011). Tracing cattle breeds with principal components analysis ancestry informative SNPs. PloS One 6, e18007. doi: 10.1371/journal.pone.0018007
Manzoori S., Farahani A. H. K., Moradi M. H., Kazemi-Bonchenari M. (2023). Detecting SNP markers discriminating horse breeds by deep learning. Sci. Rep. 13, 1–14. doi: 10.1038/s41598-023-38601-z
McNemar Q. (1947). Note on the sampling error of the difference between correlated proportions or percentages. Psychometrika 12, 153–157. doi: 10.1007/BF02295996
Meuwissen T. H. E., Hayes B. J., Goddard M. E. (2001). Prediction of total genetic value using genome-wide dense marker maps. Genetics 157, 1819–1829. doi: 10.1093/genetics/157.4.1819
Moradi M. H., Khaltabadi-Farahani A. H., Khodaei-Motlagh M., Kazemi-Bonchenari M., Mcewan J. (2021). Genome-wide selection of discriminant SNP markers for breed assignment in indigenous sheep breeds. Ann. Anim. Sci. 21, 807–831. doi: 10.2478/aoas-2020-0097
Nadeau C., Bengio Y. (2003). Inference for generalization error. Mach. Learn. 52, 239–281. doi: 10.1023/A:1024068626366
Neel J. V. (1973). Private genetic variants and the frequency of mutation among South American Indians. Proc. Natl. Acad. Sci. U. S. A. 70, 3311–3315. doi: 10.1073/pnas.70.12.3311
Negrini R., Nicoloso L., Crepaldi P., Milanesi E., Colli L., Chegdani F., et al. (2009). Assessing SNP markers for assigning individuals to cattle populations. Anim. Genet. 40, 18–26. doi: 10.1111/j.1365-2052.2008.01800.x
Negrini R., Nicoloso L., Crepaldi P., Milanesi E., Marino R., Perini D., et al. (2008). Traceability of four European Protected Geographic Indication (PGI) beef products using Single Nucleotide Polymorphisms (SNP) and Bayesian statistics. Meat Sci. 80, 1212–1217. doi: 10.1016/j.meatsci.2008.05.021
Nikolic N., Park Y.-S., Sancristobal M., Lek S., Chevalet C. (2009). What do artificial neural networks tell us about the genetic structure of populations? The example of European pig populations. Genet. Res. (Camb). 91, 121–132. doi: 10.1017/S0016672309000093
Padilla J.Á., Sansinforiano E., Parejo J. C., Rabasco A., Martínez-Trancón M. (2009). Inference of admixture in the endangered Blanca Cacereña bovine breed by microsatellite analyses. Livest. Sci. 122, 314–322. doi: 10.1016/j.livsci.2008.09.016
Paetkau D., Calvert W., Stirling I., Strobeck C. (1995). Microsatellite analysis of population structure in Canadian polar bears. Mol. Ecol. 4, 347–354. doi: 10.1111/j.1365-294X.1995.tb00227.x
Paschou P., Ziv E., Burchard E. G., Choudhry S., Rodriguez-Cintron W., Mahoney M. W., et al. (2007). PCA-correlated SNPs for structure identification in worldwide human populations. PloS Genet. 3, 1672–1686. doi: 10.1371/journal.pgen.0030160
Pasupa K., Rathasamuth W., Tongsima S. (2020). Discovery of significant porcine SNPs for swine breed identification by a hybrid of information gain, genetic algorithm, and frequency feature selection technique. BMC Bioinf. 21, 216. doi: 10.1186/s12859-020-3471-4
Perfilyeva A., Mussabayev R., Bespalova K., Kuzovleva Y., Sergey B., Begmanova M., et al. (2024). Advanced median-based genetic similarity analysis in Kazakh Tazy dogs: A novel approach for breed conformity assessment. bioRxiv. doi: 10.1101/2024.03.19.585659
Primmer C. R., Koskinen M. T., Piironen J. (2000). The one that did not get away: Individual assignment using microsatellite data detects a case of fishing competition fraud. Proc. R. Soc B Biol. Sci. 267, 1699–1704. doi: 10.1098/rspb.2000.1197
Pritchard J. K., Stephens M., Donnelly P. (2000). Inference of population structure using multilocus genotype data. Genetics 155, 945–959. doi: 10.1093/genetics/155.2.945
Putnová L., Štohl R. (2019). Comparing assignment-based approaches to breed identification within a large set of horses. J. Appl. Genet. 60, 187–198. doi: 10.1007/s13353-019-00495-x
Roques S., Duchesne P., Bernatchez L. (1999). Potential of microsatellites for individual assignment: The North Atlantic redfish (genus Sebastes) species complex as a case study. Mol. Ecol. 8, 1703–1717. doi: 10.1046/j.1365-294X.1999.00759.x
Rosenberg N. A., Burke T., Elo K., Feldman M. W., Freidlin P. J., Groenen M. A. M., et al. (2001). Empirical evaluation of genetic clustering methods using multilocus genotypes from 20 chicken breeds. Genetics 159, 699–713. doi: 10.1093/genetics/159.2.699
Safran R. J., Scordato E. S. C., Wilkins M. R., Hubbard J. K., Jenkins B. R., Albrecht T., et al. (2016). Genome-wide differentiation in closely related populations: the roles of selection and geographic isolation. Mol. Ecol. 25, 3865–3883. doi: 10.1111/mec.13740
Schiavo G., Bertolini F., Galimberti G., Bovo S., Dall’olio S., Nanni Costa L., et al. (2020). A machine learning approach for the identification of population-informative markers from high-throughput genotyping data: Application to several pig breeds. Animal 14 (2), 223–232. doi: 10.1017/S1751731119002167
Scordato E. S. C., Smith C. C. R., Semenov G. A., Liu Y., Wilkins M. R., Liang W., et al. (2020). Migratory divides coincide with reproductive barriers across replicated avian hybrid zones above the Tibetan Plateau. Ecol. Lett. 23, 231–241. doi: 10.1111/ele.13420
Sevillano C. A., Vandenplas J., Bastiaansen J. W. M., Bergsma R., Calus M. P. L. (2017). Genomic evaluation for a three-way crossbreeding system considering breed-of-origin of alleles. Genet. Sel. Evol. 49, 1–14. doi: 10.1186/s12711-017-0350-1
Smouse P. E., Spielman R. S., Park M. H. (1982). Multiple-locus allocation of individuals to groups as a function of the genetic variation within and differences among human populations. Am. Nat. 119, 445–463. doi: 10.1086/283925
Vandenplas J., Calus M. P. L., Sevillano C. A., Windig J. J., Bastiaansen J. W. M. (2016). Assigning breed origin to alleles in crossbred animals. Genet. Sel. Evol. 48, 1–22. doi: 10.1186/s12711-016-0240-y
VanRaden P. M. (2008). Efficient methods to compute genomic predictions. J. Dairy Sci. 91, 4414–4423. doi: 10.3168/jds.2007-0980
VanRaden P. M., Tooker M. E., Chud T. C. S., Norman H. D., Megonigal J. H., Haagen I. W., et al. (2020). Genomic predictions for crossbred dairy cattle. J. Dairy Sci. 103, 1620–1631. doi: 10.3168/jds.2019-16634
Varga L., Edviné E. M., Hudák P., Anton I., Pálinkás-Bodzsár N., Zsolnai A. (2022). Balancing at the borderline of a breed: A case study of the hungarian short-haired vizsla dog breed, definition of the breed profile using simple SNP-based methods. Genes (Basel). 13, 2022. doi: 10.3390/genes13112022
Waser P. M., Strobeck C. (1998). Genetic signatures of interpopulation dispersal. Trends Ecol. Evol. 13, 43–44. doi: 10.1016/s0169-5347(97)01255-x
Weldrufael B., Houaga I., Gaynor C. R., Gorjanc G., Hickey J. M. (2024). Accurate determination of breed origin of alleles in a simulated smallholder crossbred dairy cattle population. bioXriv. doi: 10.1101/2024.04.12.589204
Westell R. A., Quaas R. L., Van Vleck L. D. (1988). Genetic groups in an animal model. J. Dairy Sci. 71, 1310–1318. doi: 10.3168/jds.S0022-0302(88)79688-5
Wilkinson S., Wiener P., Archibald A. L., Law A., Schnabel R. D., McKay S. D., et al. (2011). Evaluation of approaches for identifying population informative markers from high density SNP Chips. BMC Genet. 12, 45. doi: 10.1186/1471-2156-12-45
Wilmot H., Bormann J., Soyeurt H., Hubin X., Glorieux G., Mayeres P., et al. (2022). Development of a genomic tool for breed assignment by comparison of different classification models - Application to three local cattle breeds. J. Anim. Breed. Genet. 139, 40–61. doi: 10.1111/jbg.12643
Wilmot H., Druet T., Hulsegge I., Gengler N., Calus M. P. L. (2023a). Estimation of inbreeding, between-breed genomic relatedness and definition of sub-populations in red-pied cattle breeds. Animal 17, 100793. doi: 10.1016/j.animal.2023.100793
Wilmot H., Niehoff T., Soyeurt H., Gengler N., Calus M. P. L. (2023b). The use of a genomic relationship matrix for breed assignment of cattle breeds: comparison and combination with a machine learning method. J. Anim. Sci. 101, 1–9. doi: 10.1093/jas/skad172
Keywords: breed composition, classification, clustering, admixture, purebred, crossbred
Citation: Wilmot H and Gengler N (2025) Good practice for assignment of breeds and populations—a review. Front. Anim. Sci. 6:1508081. doi: 10.3389/fanim.2025.1508081
Received: 08 October 2024; Accepted: 13 January 2025;
Published: 06 February 2025.
Edited by:
Luca Fontanesi, University of Bologna, ItalyReviewed by:
Jose Bento Sterman Ferraz, University of São Paulo, BrazilCopyright © 2025 Wilmot and Gengler. This is an open-access article distributed under the terms of the Creative Commons Attribution License (CC BY). The use, distribution or reproduction in other forums is permitted, provided the original author(s) and the copyright owner(s) are credited and that the original publication in this journal is cited, in accordance with accepted academic practice. No use, distribution or reproduction is permitted which does not comply with these terms.
*Correspondence: H. Wilmot, aGVsZW5lLndpbG1vdEB1Z2EuZWR1
†Present address: H. Wilmot, Department of Animal and Dairy Science, University of Georgia, Athens, GA, United States
‡ORCID: H. Wilmot, orcid.org/0000-0002-1075-088X
N. Gengler, orcid.org/0000-0002-5981-550
Disclaimer: All claims expressed in this article are solely those of the authors and do not necessarily represent those of their affiliated organizations, or those of the publisher, the editors and the reviewers. Any product that may be evaluated in this article or claim that may be made by its manufacturer is not guaranteed or endorsed by the publisher.
Research integrity at Frontiers
Learn more about the work of our research integrity team to safeguard the quality of each article we publish.