 Dorra Gharbi1,2,3*†
 Frank Harald Neumann3*†
 Keneilwe Podile3
 Marinda McDonald4,†Jo-hanné Linde3Megan Frampton4,5Jennifer Leigh Liebenberg3,†Sarel Cilliers3Tshiamo Mmatladi3Phumelele Nkosi3Keamogestswe Paledi3
 Stuart Piketh3,†
 Jurgens Staats6,†Roelof P. Burger3,†Henno Havenga3,†Rebecca M. Garland7,†Petra Bester8,†
 Pedro Humberto Lebre9,†
 Cristian Ricci8,†
- 1Institute of Plant Sciences, University of Bern, Bern, Switzerland
- 2Oeschger Centre for Climate Change Research, University of Bern, Bern, Switzerland
- 3Unit for Environmental Sciences and Management, Faculty of Natural and Agricultural Science, North-West University, Potchefstroom, South Africa
- 4The Allergy Clinic, Blairgowrie, South Africa
- 5Department of Paediatrics & Child Health, Faculty of Health Sciences, School of Clinical Medicine, Rahima Moosa Mother & Child Hospital, University of the Witwatersrand, Johannesburg, South Africa
- 6Faculty of Health Sciences, North-West University, Potchefstroom, South Africa
- 7Department of Geography, Geoinformatics and Meteorology, University of Pretoria, Pretoria, South Africa
- 8Africa Unit for Transdisciplinary Health Research, North-West University, Potchefstroom, South Africa
- 9Centre for Microbial Ecology and Genomics, University of Pretoria, Pretoria, South Africa
Background: Data on allergic rhinitis and respiratory health metrics are limited for South Africa, with grass pollen as a key outdoor aeroallergen. Exotic trees such as plane trees and ragweed produce highly allergenic pollen, dominating indigenous trees and weeds. Pollen allergy prevalence data is lacking in cities of North-West province such as Potchefstroom.
Objectives: This study aimed to (i) assess the prevalence of allergies to major aeroallergens, including Poaceae (grasses), Cupressus/Hesperocyparis (cypresses), Platanus (plane tree), Ulmus (elm), Quercus (oak), Betula (birch), Olea (olive), Artemisia (sagebrush), Amaranthus (amaranth), Plantago (plantain), Morus (mulberry), and Ambrosia (ragweed), along with fungal spores such as Alternaria, Cladosporium, and Penicillium/Aspergillus, and (ii) investigate the monthly incidence of major aeroallergens and reactivity levels in sensitized adults in Potchefstroom.
Methods: Skin prick tests (SPTs) were performed on 202 adults aged 18–64 years with confirmed allergic symptoms during a field campaign at North-West University (NWU)'s Potchefstroom campus. A test panel of grass, weed, tree, and fungal spore extracts previously identified via aerobiological monitoring was used. Symptom scores were recorded using ISAAC questionnaires; Spearman's statistical correlation between symptom frequency and monthly aeroallergen concentrations were analyzed.
Results: Among the participants, 184 (91%) exhibited positive SPT reactions: 104 (57%) are monosensitized to pollen, 45 (24%) to fungal spores, and 35 (19%) are polysensitized. Aeroallergen prevalence was higher in females (73%) than in males (27%). The most common pollen allergens were Cynodon dactylon (Bermuda grass) (85%), Zea mays (maize) (46%), Platanus spp. (plane tree) (35%), and Ulmus campestris (field elm) (33%). Among fungal spores, Alternaria was the most common (93%), followed by Cladosporium (27%). A significant and positive statistical correlation was found between allergic rhinitis symptoms and monthly pollen concentrations of Betula, Morus, Platanus, and Quercus.
Discussion & Conclusion: This pilot study linked aeroallergens detected in Potchefstroom with allergy profiles of local residents. The findings highlight the need for more comprehensive regional studies that integrate allergen testing with aerobiological data. Raising awareness and implementing health strategies are essential for managing allergic rhinitis in South Africa. More affordable and available SPTs kits, adapted to allergy prevalence in South Africa, are strongly suggested.
Introduction
The prevalence of allergic conditions is rising in both developed and developing countries (1). Asthma incidence rates are 1%–20%, those of allergic rhinitis range from 1% to 18%, and of skin allergies from 2% to 10% in various populations (2).
Since allergic sensitization patterns differ globally; it is mandatory to understand local sensitization patterns for inhalant allergens for better diagnosis and management of patients. Recent data reported that the prevalence of allergic rhinitis (AR) prevalences in three African countries (Algeria, Egypt, and Nigeria), ranged from 3.6% to 22.8% (1). Overall, limited and inconsistent data on the increase of AR in Africa exist (1). An estimated asthma prevalence rate between 6% and 12%, with national estimates ranging from 2% to 53% is reported for Africa (3).
Research has identified house dust mites (Dermatophagoides spp.) as a major factor contributing to the increasing prevalence of allergies for Africa (4). Several studies have reported other causes, such as food allergies and sensitization to biological inhalant allergens such as animal dander (5, 6).
Principal bio-pollutants i.e., pollen grains from anemophilous plants, including trees, grasses, and weeds, as well as fungal spores are dominant outdoor aeroallergens (7). Exposure to these aeroallergens leads to allergic symptoms, ranging from seasonal rhinoconjunctivitis to severe asthma (8).
Most of the research on pollen aerobiology and related health outcomes has been concentrated in the northern hemisphere, particularly in North America and Europe, due to the greater availability of researchers, funding, and advanced infrastructure in these regions (9). In contrast, there is limited data on the incidence of allergies linked to aerospora spectra in Africa, including Southern Africa, and the Global South in general.
From an ecological perspective, unique flora with high biodiversity occurs in nine biomes in southern Africa (10), together with a widespread occurrence of northern hemisphere allergenic plant species introduced as ornamentals, crops or weeds (11). Each biome has a distinct climate and flora and includes, subsequent to indigenous vegetation, alien plants from Europe, North and South America and Australasia (12).
Aerospora diversity is correlated with specific allergy patterns, creating challenges such as (i) the interpolation and extrapolation of aerobiological data from one biome to another (13) and (ii) the determination of potential health outcomes of pollen exposure across South Africa's varied phytogeographical and climatic regions (14).
Climate change presents an additional challenge in integrating and comparing pollen aerobiology measurements across southern African locations to assess current impacts and identify regions at heightened risk (15). Pollen seasons are starting earlier and lasting longer, with higher pollen production, concentration, and allergenicity. Plants are also shifting poleward and upward in mountainous regions (16).
Since 1947, these insights have highlighted early challenges in understanding pollen disorders, or pollinosis, among several South African medical practitioners (17). Ordman (18) communicated that pollinosis in South Africa was predominantly linked to the inhalation of grass pollen, which typically is released during summer. For example, pollen grains of subtropical Stenotaphrum secundatum (buffalo grass) are the primary aeroallergens in the Western Cape province of South Africa (19).
A regional study conducted across four South African provinces on 6,775 participants found that Bermuda grass (Cynodon dactylon) has the highest frequency of positive SPT reactions, with rates of 31% (Gauteng), 30% (Western Cape), 29% (North-West), and 24% (Eastern Cape) (20). The high occurrence of aeroallergens in different regions of South Africa has been confirmed by the South African Pollen Monitoring Network (SAPNET) (14).
Assessing the health impacts of pollen exposure in different regions of South Africa is crucial (13), especially for the local population and sporting events (21). This includes understanding how environmental conditions affect athlete health and performance in events such as long-distance running, cycling, and triathlons (21).
Since 2022, when pollen monitoring was extended to North-West province, an increasing number of research outputs regarding atmospheric pollen load, seasonality, and related health impacts have occurred (22, 23). Potchefstroom, a city experiencing steady growth, was selected as the ninth pollen monitoring location for SAPNET. The area falls within the temperate Grassland Biome, which is characterized by plains with few trees and shrubs, although patches of savanna exist within city limits (23).
No prior research has investigated the prevalence and characteristics of AR in Potchefstroom. A recent publication highlighted local aerospora diversity and its ecological and allergenic significance (23). In this comprehensive study, a detailed the first qualitative and quantitative analysis of aerial pollen spectra during a 13 months period for Potchefstroom underlines that the dominant pollen types originated from Eurasian and North American neophytic trees such as cypress (Cupressus sempervirens, Hesperocyparis arizonica), plane tree (Platanus acerifolia), pine (Pinus spp.), olive (Olea europaea), mulberry (Morus alba, Morus nigra), birch (mostly Betula pendula), oak (mostly Quercus robur), and ash (predominantly Fraxinus excelsior). More importantly, the presence of strongly allergenic pollen produced by the North American invader Ambrosia sp. (ragweed) attracted the attention of aerobiologists and allergologists (23, 24).
Recently, a multidisciplinary team of aerobiologists, air quality scientists, clinicians, public health experts, and biostatisticians designed a research project to link aerobiological data to allergenicity, addressing knowledge gaps related to pollen rain and its health impacts. The project was funded by the Grand Challenges Canada (GCC) and South African Medical Research Council (SAMRC). The multidisciplinary approach encompassed aerobiological sampling using volumetric spore traps, meteorological data, a health survey via the standard International Study of Asthma and Allergies in Childhood (ISAAC) questionnaire (25), and Skin prick tests (SPTs) as a standard diagnostic test using pollen or fungi allergen extracts (26).
The structured mutivariate measurement parameters were used as independant variables to map the incidence of airborne pollen profiles allergen with focusing on asthma, AR, and eczema, seasonal differences, and exposure to allergenic aerospora in the Vaal Airshed Priority Area (VTAPA). VTAPA is an area in South Africa affected by air pollution at a globally significant level (27). Potchefstroom was selected for comparison as a nearby city in the same biome (Grassland with patches of savanna as described in Neumann et al. (23) and under similar climatic conditions but outside VTAPA.
This study is the first to report sensitization to grass, weed, and tree pollen species and fungal spores in Potchefstroom, South Africa. The results provide essential information about pollen and fungal types sensitization that can be applied to improve the diagnosis of allergic rhinitis and asthma in South Africa and review the testing aeroallergen panel of South African allergic working groups (SAARWG). In the present study, we aimed to identify and analyze the characteristics of a population with an incidence of allergic pollen species to establish a prototype of the regional incidence of seasonal pollen and associated respiratory diseases.
Materials and methods
Study site
The study was conducted in Potchefstroom (26˚ 42' 53” S; 27˚ 05' 49” E), a city in JB Marks Municipality, North-West Province (28). Potchefstroom is home to the largest campus of North-West University (NWU), which significantly influences the city's economy, culture, and social dynamics. The city covers an area of c. 55 km2 with a total of 201,000 residents (2024) (23).
The regional climate is characterized by summer rainfall with a mean average rainfall ranging between a maximum of >100 mm in December and January and <10 mm in June and August (29). The mean temperature fluctuates between c. 22°C in January, and >10°C -with common frost- in June/July (29).
Potchefstroom is situated along the Grassland Biome-Savanna Biome ecotone at the confluence of three vegetation units, namely the Rand Highveld Grassland, Carletonville Dolomite Grassland and Andesite Mountain Bushveld (10, 23) (Figure 1). These vegetation units include indigenous trees, such as Searsia spp. (karree tree), Combretum spp. (bushwillow), and African acacias (Vachellia spp., Senegalia spp.) (compare Neumann et al. (23).
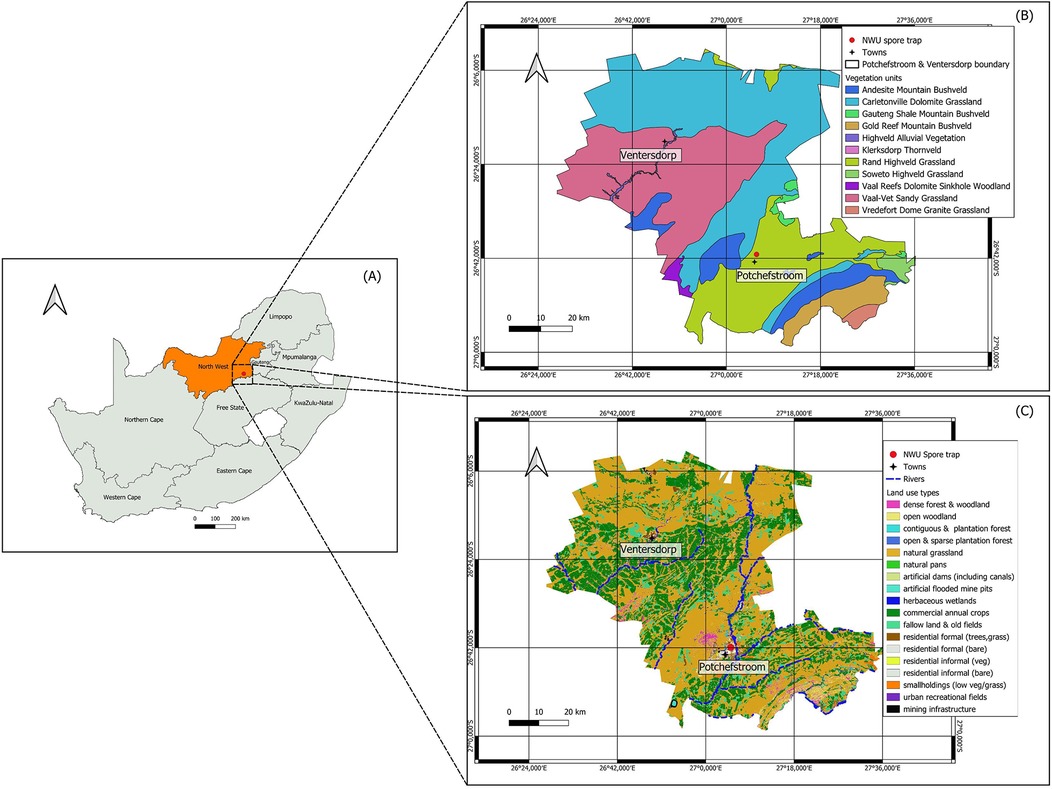
Figure 1. Geographical description of (A) the study area, (B) vegetation units, and (C) land use in the city of Potchefstroom.
All vegetation units have been altered and fragmented due to agriculture, forestry, urban development, and mining (Figure 1). Consequently, Potchefstroom hosts many exotic trees such as Quercus spp. (oaks), Betula spp. (birch), Ulmus parvifolia (Chinese elm), Cupressus spp./Hesperocyparis spp. (Cupressaceae, cypresses), Platanus spp. (plane trees), Morus alba (white mulberry), Morus nigra (black mulberry), as well as weeds such as Ambrosia spp. (ragweed), and Plantago spp. (plantain) (23). Grasses include—next to indigenous grasses belonging to the genera Eragrostis (lovegrass), Panicum (panicgrass), Cynodon (Bermuda grass) – many exotic Poaceae such as Pennisetum clandestinum (Kikuyu grass) (23).
Aerobiological sampling
Aerospora monitoring, following SAPNET protocol, was conducted using a standard device 7-day Hirst-type volumetric spore trap (VPPS 2000 spore trap, Lanzoni s.r.l.), and set up at NWU, Potchefstroom campus, at a level of 12 m above ground in January 2023 (Figure 1) as part of the SAPNET monitoring initiative across South African cities (13). Aerospora monitoring was conducted continuously between January and December 2023, following the minimum requirements of the international requirement of aerobiology sampling (30). The sampler operates at a flow rate of 10 L/min, with the intake orifice aligned with the wind. Particles are collected on a glycerine jelly-coated plastic band around a drum, which moves at 2 mm/hour via a clockwork mechanism. Once a week, the adhesive tape is replaced, and the segments for each day are mounted on microscope slides and analyzed under a light microscope (×400). The monthly pollen index (pollen grains/m3) was calculated from the daily average airborne pollen concentrations for all major taxa contributing >1% of the annual pollen index. To compare the frequency of allergenic symptoms occurrence with aerospora temporal variation, we selected dominant pollen types based on our first insights into the pollen spectrum description of Potchefstroom (23). In addition, we included three fungal spores of the genera Alternaria, Cladosporium and Aspergillus/Penicillium, which were identified as dominant fungal spores in the North-West province of South Africa (31) and monthly spores indexes were calculated (fungal spores/m3). Due to technical issues with the sampler and data gaps in 2024, we chose to use the dataset from January 2023 to December 2023 to create a more comprehensive profile of the aerospora spectrum in Potchefstroom and evaluate the sensitization profile of recruited participants (compare Neumann et al. (23).
ISAAC questionnaires
To determine the prevalence of airborne allergens, with an emphasis on asthma, allergic rhinitis, and eczema, among individuals residing in the city of Potchefstroom, the symptoms questionnaire was adapted from the International Study of Asthma and Allergies in Childhoods (ISAAC) (25). Local allergologists and family physicians and, members of the research team, revised standardized ISAAC questionnaire, incorporating a few adjustments to the original questionnaire including the following enquiries: Has a professional doctor confirmed your disease conditions? Which month of the year do you experience blocked nose, watery and itchy eyes?
After receiving approval from NWU's Health Research Ethics Committee (HREC), informed consent and approval for participation in the study questionnaire and SPTs were obtained from the volunteers' participants from 21 to 26 October 2024. The sample comprises male and female students from different ethnicities living near or on NWU Potchefstroom campus. The collected information about adult symptoms was correlated with the average pattern of airborne pollen and fungal spore seasonality in Potchefstroom's atmosphere from 2022 to 2023.
Skin prick test
Before performing the procedure, a total of 202 volunteers' participants were screened for allergic rhinitis and/or asthma symptoms and for the intake of antihistamines and other medications that may inhibit the SPT results between. All volunteers' participants with antihistamine intake from seven days prior until the day of SPT were excluded. Participants with uncontrolled allergic rhinitis and/or asthma symptoms were exempted from SPTs. Pollen extracts purchased from Immunospec (Spain) includes allergens from Poaceae: Cynodon dactylon (Bermuda grass), Lolium perenne (ryegrass), Zea mays (maize), six mix grasses (Poa pratensis (Kentucky Blue), Festuca pratensis (meadow fescue), Dactylis glomerata (orchard grass), Phleum pretense (Timothy), Holcus lanatus (Yorkshire frog), Cupressaceae: Hesperocyparis arizonica (Arizona cypress), Fagaceae: Quercus robur (English oak), Platanaceae: Platanus sp. (plane tree), Ulmaceae: Ulmus campestris (field elm), Moraceae: Morus alba (white mulberry), Betulaceae: Betula verrucosa (silver birch), Oleaceae: Olea sp. (olive tree), weed mix (Artemisia sp. (wormwood), Chenopodium sp. (goosefoot), Salsola sp. (saltwort), Plantago sp. (plantain)), Asteraceae: Ambrosia sp. (ragweed), fungal spores including Aspergillus fumigatus, Alternaria alternata, Penicillium notatum, and Cladosporium herbarum. Due to lack of standardization and ambiguity common names for fungi are not provided here (compare (32).
SPTs were performed by three medical professionals with expertise in allergology and immunology on the participant's forearm with a standardized solution of allergens and no adverse events were reported. A mean wheal diameter of 3 mm or greater was used to indicate the presence of specific IgE in the allergen tested. Monosensitization was defined as a single sensitivity to one allergen and polysensitization was defined as a response to at least two or more allergens.
The demographic variables and characterization of the participants with sensitivity (n = 184) are shown in Figure 2. Among the patients with sensitivity, 27% were male and 73% female, with an age range of 18–64 years and a mean of 29 years.
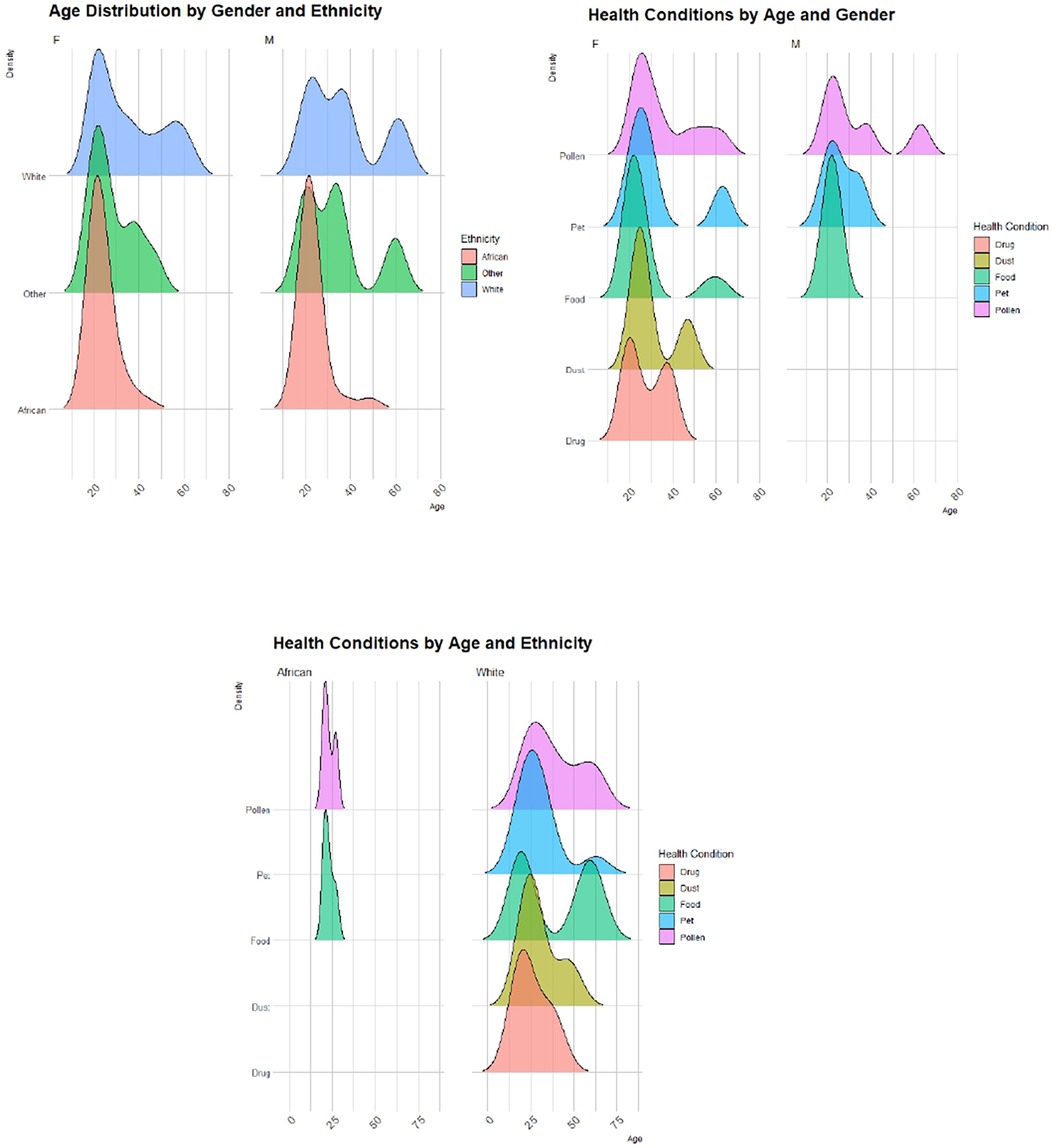
Figure 2. Demographic characteristics of patients with aeroallergen-positive SPT reactivity. *others: Colored and not specified.
Statistical analysis
The data visualization and statistical analyses were performed using IBM Statistical Package for Social Sciences software SPSS (Version 29.0.2.0, released 2023, Armonk, NY: IBM Corp). Spearman's correlation explored the prevalence of symptoms and their relationship with aerospora particle levels from January to December 2023. Pearson's Chi-square tests examined associations between demographic characteristics (gender and ethnicity) and SPT results. Age parameters were excluded from the Chi-square analysis due to homogeneity of variance (highest tested participants with age group 18–25 years) linked to the characterization of the study locality on a university campus. Ethnicity was categorized as “African”, “White”, or “Other”, with smaller groups such as colored and not specified combined into “Other”. The SPT reactions were classified as positive or negative. Participants who did not exhibit a positive reaction to the positive control test were not considered in the Chi-Square tests. For all analyses, a p-value (p < 0.05) was considered statistically significant.
Results
Aerobiological data
Table 1 illustrates the monthly variation in pollen counts for the dominant tree, grass, and weed taxa from January 2023 to December 2023. Grass pollen concentrations peaked in March (331 pollen grains/m3). Ambrosia (ragweed) pollen exhibited high concentrations during March (140 pollen grains/m3) and April (149 pollen grains/m3). Tree pollen, including that of Cupressaceae (cypresses), showed a notable monthly concentration peak in August (357 pollen grains/m3), followed by increased monthly values of Platanus (plane) (506 pollen grains/m3) and Morus (mulberry) (219 pollen grains/m3) in September. Ulmus (elm) pollen was highest in December (595 pollen grains/m3). In contrast to pollen, fungal spores showed a stable pattern throughout the year, with peaks occurring in March for Cladosporium (35,202 spores/m3) and Alternaria (2,387 spores/m3), and in July for Penicillium and Aspergillus (193 spores/m3).
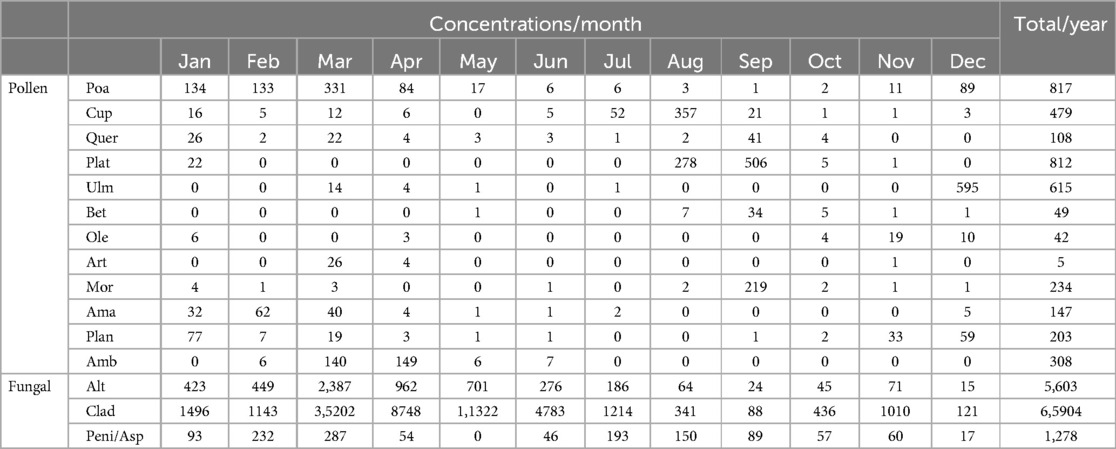
Table 1. Monthly concentrations of common airborne pollen (pollen grains/m3) and fungal spores (fungal spores/m3) (January 2022-December 2023). Poa: Poaceae (grasses); Cup: Cupressaceae (cypresses); Quer: Quercus (oak); Plat: Platanus (plane); Ulm: Ulmus (elm); Bet: Betula (birch), Ole: Olea (olive); Art: Artemisia (sagebrush); Ama: Amaranthus (amaranth); Plan: Plantago (plantain); Mor: Morus (mulberry), Alt: Alternaria, Clad: Cladosporium; Peni: Penicillium; Asp: Aspergillus.
Prescreening questionnaire response
The prevalence rates of asthma, AR, and eczema are shown in Supplementary Table S1. According to the ISAAC questionnaires that included self-reported symptoms, a total of 27 participants (13%) were confirmed to have asthma, 85 participants (42%) had allergic symptoms (e.g., skin itching, and runny nose) and 54 participants (27%) had urticaria. In assessing the severity of asthma, AR, and eczema symptoms, 29 (14%), 176 (87%), and 39 (19%) participants experienced wheezing attacks, sneezing, and eczematous skin rash, respectively, in the past 12 months. Regarding sleep disturbances, 11 participants (3%) were awake more than once a week due to wheezing attacks, and 12 participants (6%) experienced an itchy rash during one or more nights per week while sleeping over the past 12 months. Furthermore, 14 (7%) participants reported physician-diagnosed chronic respiratory diseases and 42 (21%) reported asthma.
Overall of sensitized participants
A total of 24% (45) of the participants had positive sensitization to fungi and 57% (104) to pollen; 19% (35) had positive reactions to both pollen and fungal spores. 19 participants had a positive SPT to one aeroallergen compared to 88 participants that assessed the prevalence to more than two aeroallergens. A total of 13 (12%) participants were monosensitized to one pollen allergen. While a total of 33 (73%) participants were monosensitized to one fungal spore type. Figure 3 shows the overall results of positive SPT reactions for all the aeroallergen panels tested. A significantly higher percentage of allergic reactions was observed for the grass pollen (46%) than for tree pollen (30%). In contrast, fewer participants reacted to fungi (24%).
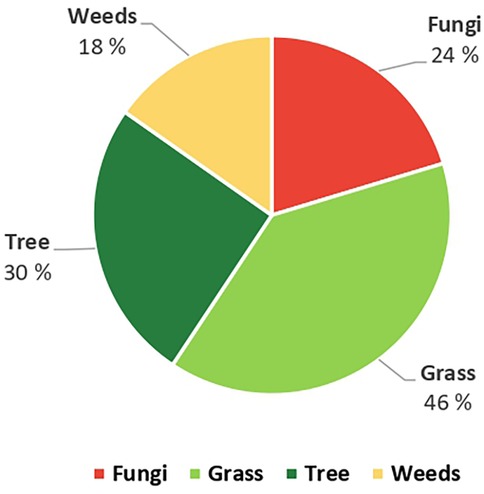
Figure 3. Total positive SPT reactions to pollen and fungal aeroallergens in Potchefstroom.
Figure 4 illustrates the frequency of patients who tested positive for SPTs in response to tree, grass, and weed categories of allergen pollen extracts. Among the tree category, Platanus (plane) pollen allergen extract had the highest frequency rate of positive SPT results (36 patients, 35%), followed by Ulmus (elm) (34 patients, 33%) and Olea (olive) (25 patients, 24%). Among the grass pollen extracts category, Cynodon dactylon (Bermuda grass) allergen showed higher positive results (88 patients, 85%) compared to the allergen of Zea mays (maize) pollen, which had 48 patients (46%). Among participants who tested positive for pollen sensitivity, 21 (20%) reacted to the weed mix pollen: Artemisia (sagebrush), Chenopodium (goosefoot), Salsola (saltwort), and Plantago (plantain), whereas 19 (18%) exhibited sensitivity to Ambrosia (ragweed) pollen. Regarding fungal the spores category, the highest sensitivity frequency was observed to Alternaria (93%), followed by Cladosporium (27%).
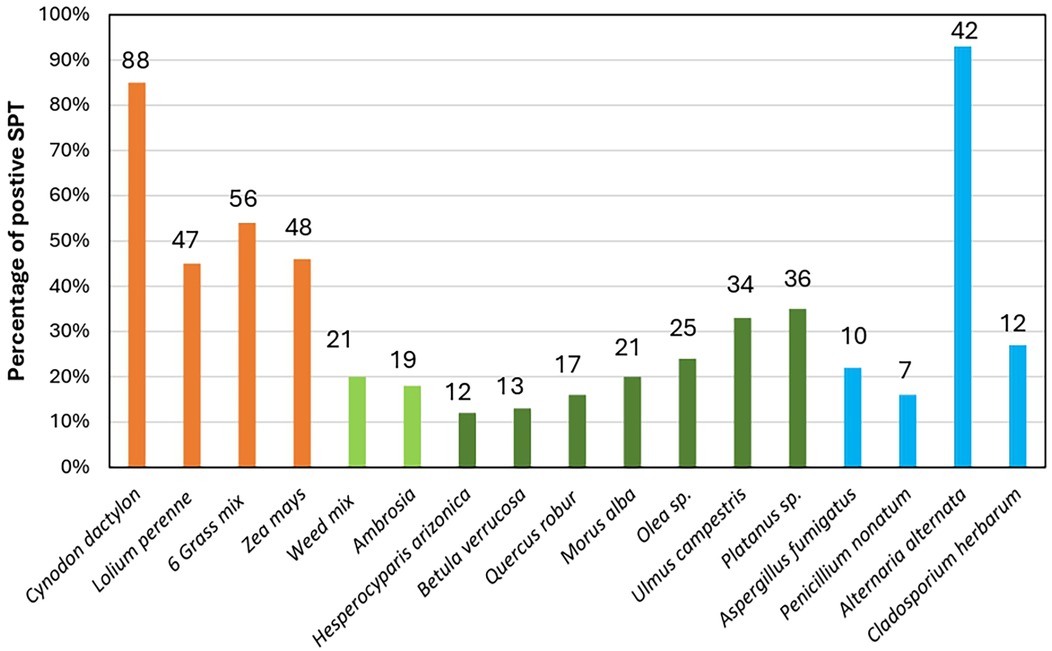
Figure 4. Percent (bars height) and frequency of positive sensitization rates (numbers in the top of bars) of participants in response to individual aeroallergens. *6 Grass mix: Poa pratensis (Kentucky bluegrass), Festuca prantesis (meadow fescue), Dactylis glomereta, (orchardgrass), Phleum pratense (Timothy grass), Holcus lanatus (Yorkshire fog), * Weed mix: (Artimisia (sagebrush), Chenopodium (goosefoot), Salsola (saltwort), Plantago (plantain).
Relationship between symptoms and monthly aeroallergens concentrations
Figure 5 compares the monthly frequency of seasonal allergic rhinitis symptoms with the dynamics of airborne pollen and fungal spore counts. Following the dominant airborne pollen distribution described above (Table 1), almost all study participants reported allergic health conditions (blocked noses) throughout the year and exacerbation during the spring months (August, September, and October) in parallel with the increased monthly pollen concentrations of Cupressaceae, Morus, and Platanus and less frequent during summer months (January to April) with increased Poaceae and Ambrosia pollen loads (Figure 5). For fungal spores, there is no direct correlation between symptom conditions and the highest concentrations of Cladosporium fungal spores (Figure 5). Moreover, the statistical correlations between Cupressaceae, Morus, Platanus, Poaceae and Ambrosia pollen concentrations and actual symptoms reported by participants were analyzed (Supplementary Table S2).
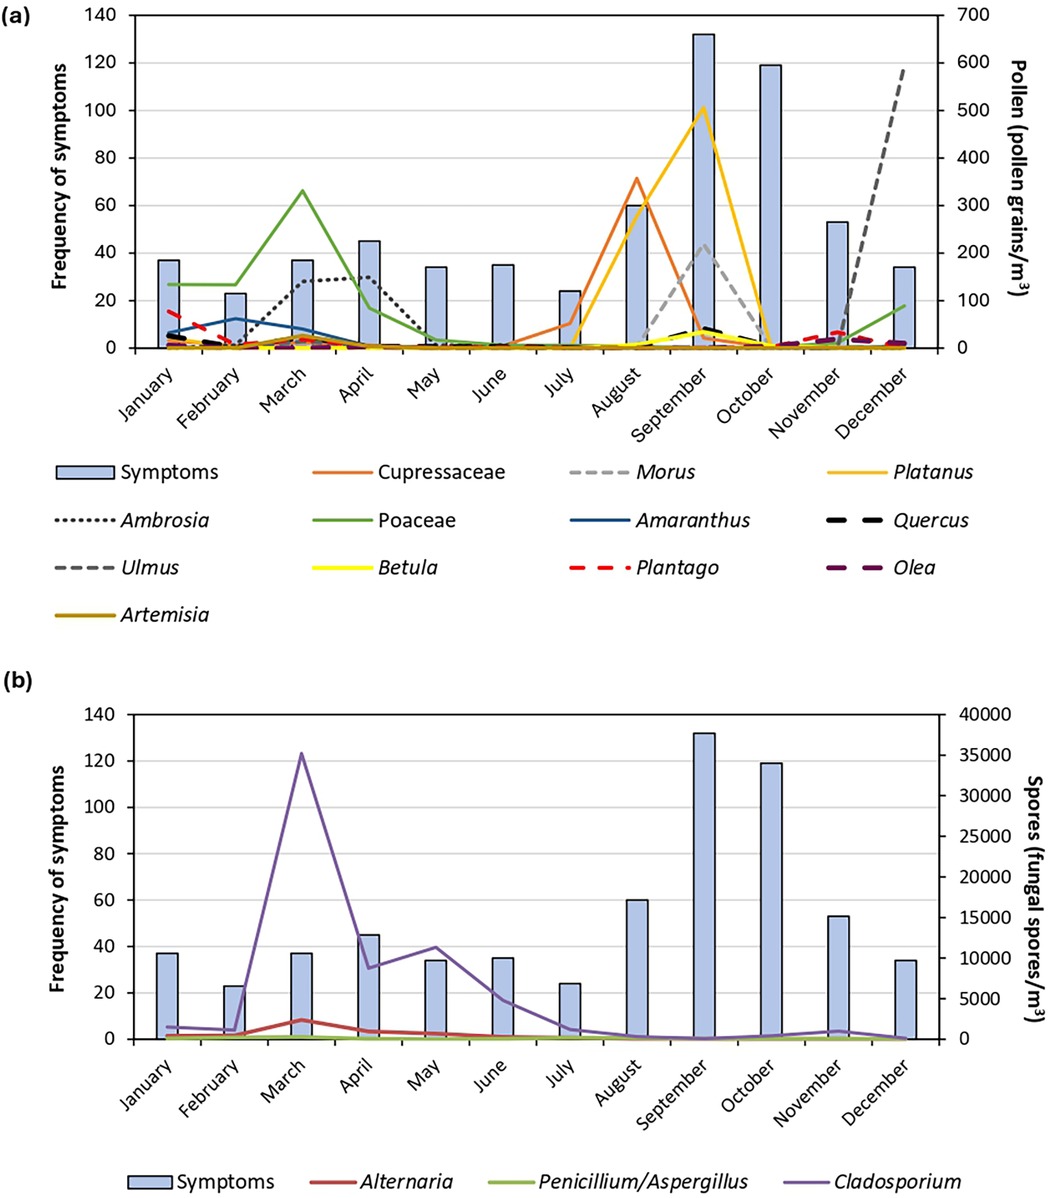
Figure 5. Association between the frequency of induced allergic symtomps and seasonal airborne (a) pollen and (b) fungal spores monthly concentrations. *Common names of taxa provided in text.
To investigate the relationship between each individual aeroallergen and allergic rhinitis symptoms, Spearman's rank correlation coefficients were calculated (Table 2). Symptom prevalence was positively correlated with the following pollen concentrations: Betula (birch), Morus (mulberry), Platanus (plane), and Quercus (oak).
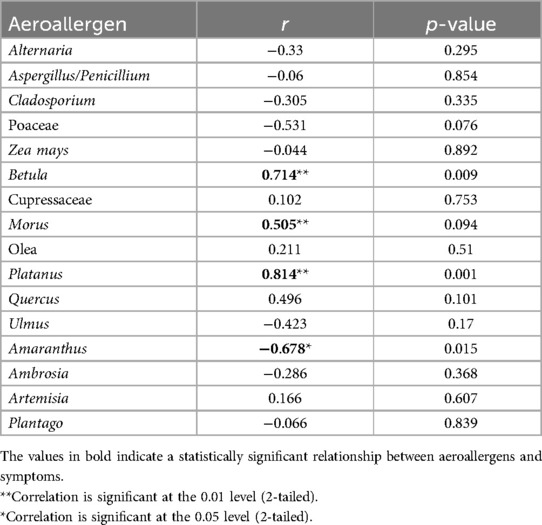
Table 2. Spearman's correlation coefficient results for symptoms vs. aeroallergens concentrations.
SPTs vs. gender and ethnicity
Pearson's Chi-square test results suggest a significant association between gender and SPT results for the three allergens, namely Platanus (plane), Olea (olive) and Betula (birch). Furthermore, regarding the association between ethnicity and SPT results, two allergens showed a significant association at : Platanus (plane tree) and Cupressaceae (cypresses). If a significance level of is chosen, two more allergens display significance, namely Lolium sp. (ryegrass) and the 6-grass mix,which are significantly associated with the SPT results and ethnicity. The results of the Chi-Square test are provided in Supplementary Table S3.
Discussions
Generally, aerospora components are not universally distributed and do not possess the same allergenic impact on humans everywhere while climate change further exacerbates this variability (33). The occurrence of pollen allergies is influenced by local vegetation, the duration of allergen exposure due to different seasonalities, genetic predispositions to respiratory allergies, and other factors, such as increased urbanization, air pollution, and antibiotic usage (34). It is well-documented that inhalation of allergic pollen grains causes clinical symptoms of respiratory diseases (34). Evidence of high sensitization rates to Poaceae, especially Cynodon dactylon (Bermuda grass) have been documented in numerous countries such as Argentina (35), and Philippines (36), and African countries such as Madagascar (37), Zimbabwe (38), Uganda, Kenya, and Ethiopia (39), where the impact of climate change is expected to intensify grass pollen production and the burden of allergic diseases (15). In contrast, sensitization rates to other pollen types are less commonly reported across Africa, with the majority of reports coming from southern African countries (1).
The high cost of these standardized commercial extracts and allergy diagnosis tests discourages many individuals from being diagnosed in most African countries including, South Africa (40). In the case of the national reported prevalence rate, respiratory health metrics data were only available for patients with access to private healthcare and the data may not be representative of patients from disadvantaged backgrounds. SPT testing data could not be compared between all existing pollen or fungal spores aeroallergens and across all regions, as some SPT allergen profiles differ regionally. Furthermore, the imported pollen extracts do not always align with the local plants found in these regions, limiting their ability to precisely identify the specific sources of sensitization. As a result, these tests typically provide only a general overview of sensitization rather than an accurate local assessment. The diagnosis of sensitivity and specificity of standardized allergen extract mediated SPT testing are limited primarily to larger towns and cities in South Africa (41).
Recommendations regarding prevailing aeroallergens and a panel of IgEs were established in 2014 and were subsequently modified by the Allergic Rhinitis Diagnostic Working Group (ARDWG). In 2023, the ARDWG provided up-to-date testing recommendations on the panel of indoor/outdoor aeroallergens as the first-line appropriate diagnosis for South Africa, including house dust mites (HDM) (Dermatophagoides pteronissinus [Der p] and farinae [Der f]), cats, dogs, moulds (including Alternaria, and Aspergillus), and outdoor allergens (Lolium sp. (ryegrass), Cynodon dactylon (Bermuda grass), Platanus sp. (plane), and Cupressaceae (Cypresses)). ARDWG recommends that, considering that pollen data are not yet comprehensive for all areas across South Africa based on early pollen monitoring data (14) and the SAPNET website (https://pollencount.co.za), other allergenic pollens, such as those from trees and weeds, may be significant in specific regions, and a local common aeroallergen should be considered (41).
In this study, we analyzed the sensitization profile of adults living in Potchefstroom. A new emphasis on allergen evidence risk exposure was discussed and established with local health providers, following the first report of common pollen and fungal spore spectrum and abundance variation during a continuous aerobiological monitoring year January 2023–December 2023 (23). A screening of sensitization profiles to grass, trees, weeds, and fungi using standard aeroallergen extracts was conducted in subjects with self-reported allergic disease and asthma symptoms. In Potchefstroom, the positive sensitization pattern shows that grass accounted for the highest positive rate at 46%, followed by tree pollen (30%), fungal spores (24%), and weed pollen (18%).
Grasses are reported as major pollen allergens in many subtropical and temperate climate regions (42). In previous associated clinical research studies, grass pollen has been identified as a major aeroallergen responsible for upper airway allergic diseases in South Africa, with an early significant report by Ordman (17). South Africa has >967 indigenous Poaceae species and 115 naturalized species, including cultivated varieties such as Pennisetum clandestinum (Kikuyu grass), Cynodon dactylon (Bermuda grass), and Lolium perenne (ryegrass). The latter have been introduced with exception of indigenous Cynodon dactylon and are widespread, e.g., at the Cape Peninsula (43) and beyond. Visser et al. (44) mentioned at least 256 alien grass species of which 37 became invasive. A retrospective review of allergy testing data collected at AMPATH, private pathology provider in South Africa, covering the period from 1 January 2016 to 31 December 2017, analyzed SPT profiles from allergy clinics in four provinces. The findings revealed high sensitization rates to grass pollen (20). Cynodon dactylon (Bermuda grass) is a prominent allergen with positive sensitization rate of 30% in Western Cape, 31% in Gauteng, 29% in North West, 24% in Mpumalanga and Eastern Cape, while lower sensitization was recorded in KwaZulu Natal (15%) (20).
Cynodon dactylon (Bermuda grass) showed 84.6% of a positive reaction potentially favoring an increase in the allergy sensitization profile of tested participants, higher than obtained in other South African regions. It is essential to highlight that from a geographical point of view, Potchefstroom is located in a region where Grasslands and Savannas are the dominant biomes and grasses are ubiquitous (10). In Potchefstroom, the flowering periods of grasses are noteworthy [Table 1 and Figure 5 (23)]. Grass was the dominant pollen detected throughout the year, presenting a long pollen season, with the season peaking throughout summer (from December) until autumn (April) and a second peak in November (23). Because of the long grass flowering season, grass pollen allergy symptoms may be experienced for up to 10 months of the year (45), resulting in a high prevalence of persistent symptoms caused by pollen allergens (41).
Generally, grass pollen grains in Potchefstroom show a high daily mean concentration (23). The European Academy of Allergy and Clinical Immunology (EAACI) suggests that a grass pollen count of 50 pollen grains/m3 evokes allergic symptoms in individuals sensitized to pollen (46). Threshold values of 10 pollen grains/m3 and 12 pollen grains/m3 of grass pollen concentration were reported for emergency visits and hospital admissions occurrences (47).
Rooyen et al. (20) reports pollen from Zea mays (maize) as a significant allergen for individuals in areas where this species is cultivated, such as Gauteng (35%), North-West (25%), and Mpumalanga (19%). Zea mays pollen has been identified as a significant aeroallergen, with sensitization reported in 42.6% of atopic children, as noted by Mercer and van Niekerk (1991) using SPTs, 2% (48) in Free State using ImmunoCAP radioallergosorbent, and 56% in Bloemfontein (48) results of SPT to Zea mays (maize) pollen extract. A similar pattern was observed in our study; notably a high sensitization rate to Zea mays (maize) (46.2%). Zea mays pollen was not detected during pollen monitoring in Potchefstroom. While Zea mays pollen is large and heavy and consequently travels shorter distances than other grass pollen grains (49), its aerobiological dispersal remains a testable hypothesis (50).
Zea mays (var. indurata or mays) (white maize) is a vital field crop in South Africa, serving as the primary staple food for much of the population, especially among low-income households (51). Maize has been identified as an allergen for many patients who developed allergic respiratory symptoms after occupational exposure to Zea mays pollen and presented a history of grass pollen allergy (52). Cross-reactivity between Zea mays (maize) and Cynodon dactylon (Bermuda grass) pollen has been suggested due to their closer genetic relationship compared to Lolium sp. (rye grass pollen) (53, 54). This indicates that some patients might be primarily sensitized to maize pollen, making it a potentially significant allergen in the region. Van Rooyen et al. (20) highlight the need for a maize-specific IgE allergen component to identify such patients accurately.
Previous reports on outdoor allergens and environmental health exposure in South Africa, mainly in the Western Cape (55, 56), Free State (57) and Gauteng (20) confirm that hay fever and seasonal conjunctivitis associated with grass pollen are more prevalent than those linked to tree and weed pollen, in contrast to the patterns observed in Europe (58). Allergies to pollen of exotic trees such as Quercus (oak), Platanus (plane tree), Cupressaceae (cypress family), and Olea (olive) were identified for South Africa (45, 58) and are supported by aerobiological studies (14). Olea which includes both indigenous and exotic taxa- were causing most of the allergic reactions in alignment with the highly abundant pollen of those taxa in spore traps in Gauteng (Pretoria, Johannesburg) (14). Olea europaea L. subsp. africana [(Mill.) P.S.Green] (wild olive), Olea capensis (L.) (ironwood), Olea exasperata (Jacq.) (sand olive) are indigenous to South Africa (59). The latter two taxa are restricted to the Cape although O. capensis also grows in other South African provinces but not in North-West (59). The European olive, Olea europaea (L.) (common olive), is planted as a fruit tree at the Cape and as an ornamental tree throughout the subcontinent (23, 60).
South African urban green infrastructures, including in Potchefstroom, are characterized by the abundance of allergenic alien tree species introduced from the northern hemisphere as ornamental trees, including Cupressus spp. (cypresses), Platanus spp. (plane trees), Pinus spp. (pines), Olea europaea subsp. europaea (European olive), and Quercus spp. (oaks) (11, 23), and highly allergenic invasive ragweed, i.e., Ambrosia artemisiifolia (common ragweed) and Ambrosia trifida (giant ragweed) (24). Their abundance and marked allergenicity confirm the cause of pollinosis symptoms, illustrating an important issue in the South African environment.
Our study provides insights for northwestern South Africa and specifically for the Potchefstroom, by facilitating the first multi-centre research data collection. This includes accelerated recruitment of atopic population and the examination of tree and weed allergen positivity rates, previously unreported. A high prevalence of sensitization to Platanus (plane) (35%), Ulmus (elm) (33%), Olea (olive) (24%) and Morus (mulberry) (20%) pollen extract, in addition to Ambrosia (ragweed) (18%) was noted. This is in good agreement in respect to pollens of Platanus (plane), Olea (olive), and Morus (mulberry), in comparison to aerobiological data from other sites in the Grassland and the savanna, such as Kimberley, Bloemfontein, Johannesburg and Pretoria (14). A possible explanation for this observation in Potchefstroom is the strong correlation between pollen load and land cover taxa distribution in Potchefstroom. Potchefstroom is characterized by neophytic trees such as Platanus acerifolia (London plane), Morus alba (white mulberry), Ulmus parvifolia (Chinese elm), and Ulmus americana (American elm) which are found along roadsides, in parks, and in gardens (23).
The contribution of fungal spores to allergy symptom profiles among residents was observed, with a high SPT prevalence for Alternaria (93%) and Cladosporium (27%) and a high occurrence of Alternaria and Cladosporium spores especially in March-May (Figure 5). Alternaria is recognized globally as one of the main fungal aeroallergens (61). Earlier allergy studies in South Africa, based on SPT data provided by a laboratory, identified Alternaria as predominant fungal sensitizer. These studies were conducted in Cape Town (55) and the Free State (62). Our findings support previous tests on the effect on lung function of fungal spores amongst school children in the Western Cape, where Alternaria and Cladosporium were isolated as severe allergens, but fungal spores were only monitored during summer and winter (63, 64).
The allergenicity of most fungal spores remains poorly understood, although their high presence in aerobiological monitoring (65) shows a weak correlation with sensitization patterns (66, 67). Notably, when fungal spores from aerobiological surveys are compared with SPT or specific IgE test results, their rankings may not always align. Although daily fungal spore levels did not exceed the low category on the Burge scale defining the allergy risk levels based on aerospora concentrations (68), these spores may still exhibit allergenic potential.
The statistical correlation analysis conducted between allergic symptoms and various monthly concentrations of airborne pollen types revealed a significant association between Betula (birch), Morus (mulberry), Platanus (plane), and Quercus (oak) pollen and symptoms among the participants of the current study (Supplement Table S3). The scarcity of correlations between the other pollen types and symptoms reported may be attributed to low pollen concentrations in the region or to threshold levels required to trigger associated symptoms (69, 70). Becker et al. (47) highlight that population sensitivity to pollen is influenced by local vegetation. They concluded that, when a plant species is prevalent in a particular geographical area, the population tends to tolerate higher concentrations of its pollen before experiencing symptoms. Several potential confounders could affect the relationship between pollen exposure and allergy, including weather, climate, environmental conditions, and human activities, which have a significant impact on the amount and diversity of pollen (71, 72). Factors linked positively or negatively to pollen exposure might lead to misleading associations. Air pollution, more common in industrial and highly polluted areas, has been shown to potentially enhance the effects of certain aeroallergens, thereby increasing the prevalence or severity of allergic rhinitis and asthma (73, 74). It appears unlikely that high pollen exposure directly raises the risk of developing allergic rhinoconjunctivitis or asthma, although it can provoke symptoms in susceptible individuals (75). The associations between atmospheric pollen load and allergy-triggered symptoms observed in this study were weak (Supplement Table S2). This suggests that pollen exposure may have little to no influence on the prevalence of atopic diseases in the residents of Potchefstroom.
ISAAC also screens for allergic rhinitis, and it is possible that patients may be sensitized to other common aeroallergens, such as house dust mites, insects (e.g., cockroaches), and pets (e.g., cats and dogs). In cases of local allergic rhinitis, patients may still have a true allergy, even if their allergy tests return negative results (76).
Moreover, since pollen counts fluctuate annually, relying on data from a single year may diminish the analysis's sensitivity. To create robust pollen calendars, a five-year cycle is recommended. Careful thought should also be given to the sensitization among races groups and gender.
The negative relation between adjustment for the self allergy symptom severity report obtained through the ISAAC questionnaire vs. monthly aeroallergen pollen load vs. sensitization is best explained by psychological factors of the participants overrating the intensity of their symptoms. Most participants did not have any previous knowledge about allergenic rhinitis and related symptoms. Similar studies found that reported symptom severity of allergic rhinitis did not correlate with weal size for any of the aeroallergens tested or with the number of positive responses on SPT but rather to psychological factors of hypochondriasis and somatic awareness (76).
A significant association between gender (male vs. female) and sensitization to aeroallergens, particularly a higher sensitization for the exotic tree pollen Platanus, Olea, and Betula among females. Similar findings have been reported in a previous study linked to the same project conducted in Vanderbijlpark, a polluted and highly instrustalized area within Gauteng province, with higher positive rates of pollen sensitization among females compared to males (77). Further, Jensen-Jarolim & Untersmayr (78), support the gender-associated sensitization evidence, through the key factors of mechanistic involvement of sex hormones in immune responses. Additionally, a significant association was observed between Platanus, Cupressaceae, Lolium, and a six-grass mix with ethnicity.
Regarding allergen-specific susceptibility related to ethnicity, evidence of racial differences in allergic sensitization among adults living in Vanderbijlpark was observed (77). Similarly, Wegienka et al. (79) highlighted racial differences in allergic sensitization among various racial groups. However, the underlying sources of these disparities remain unclear but might be influenced by factors such as genetics, socioeconomic status (e.g., income, education), and environmental conditions (e.g., particulate matter in quantity and type). Further research is needed to investigate combinations of factors including allergen-specific susceptibility vs. race or gender host susceptibility.
This study is limited by: a. short aerobiological dataset; b. this is the first population based study to evaluate the aeroallergen exposure in Potchefstroom; all participants were recruited from a university setting, which may not fully represent the demographic and/or socio-economic composition or occupational exposure patterns of the general population in this city. c. Skin prick testing is a specialized skill that requires both time and trained personnel to carry out effectively. Because of this, the number of SPTs tests we were able to perform was limited. In total, we could only complete 202 tests due to the time-intensive nature of the procedure and the scarcity of skilled personnel required to administer it (one doctor per day).
A first case study is reported here as part of an ongoing pilot research project that will include, in a later stage, individuals from the general public in terms of age distribution and socio-economic background. As a result, the findings should be interpreted with caution when considering their applicability to the wider community. Future studies should aim to include a more diverse sample to enhance generalizability; d. SPTs were conducted for the first time on participants without any previous knowledge on aeroallergen diversity and exposure health issues, e. as a consequence of d., participants frequently provide inaccurate self-reports on the monthly frequency of associated symptoms throughout the year.
Conclusions & outlook
• This research study represent the first attempt of SPT series conducted in Potchefstroom, a small, rapidly growing city in the North-West province. These tests highlighted the significant role of allergens from exotic trees and weeds.
• Poaceae allergens, such as those from Cynodon dactylon (indigenous Bermuda grass), were found to be particularly important, with clear evidence of sensitization to grasses. To assess the alignment between SPT results and aerobiological data, it is important to note that, from a morphological perspective, differentiating Poaceae pollen under light microscopy is limited and requires improvement, such as through the integration of genetic studies (DNA barcoding) (80). This will enhance our understanding of grass pollen allergenicity.
• For the first time, sensitization to Ambrosia sp. (ragweed from North America) was documented for South Africa using SPTs. This taxon, present with several species in South Africa, is currently spreading and needs to be closely monitored and further investigated regarding its allergic potential (24).
• Additionally, the prevalence of fungal spores, most importantly Cladosporium, emerged as highly significant. DNA studies might enhance species-level knowledge in urban environments (81).
• The study underscored the need for local monitoring of certain allergenic pollen types, such as Zea mays (maize), which are currently underrepresented in aerobiological studies due to maize pollen grains being weakly reflected in spore traps. Spore traps lower to the ground, e.g., at 2 m height, might address this crucial lack of information.
• We suggest making SPTs, which are often not affordable for many South Africans, budget-friendly and promote SPTs being conducted in other regions in the country and across Africa.
Data availability statement
The raw data supporting the conclusions of this article will be made available by the authors, without undue reservation.
Ethics statement
The studies involving humans were approved by Health Research Ethics Committee (HREC) and the Faculty of Natural and Agricultural Sciences Research Ethics Committee (FNASREC) at NWU NWU approved the study (Ethics Number: NWU-00061-24-S1) on July 3, 2024. The studies were conducted in accordance with the local legislation and institutional requirements. The participants provided their written informed consent to participate in this study. Written informed consent was obtained from the individual(s) for the publication of any potentially identifiable images or data included in this article.
Author contributions
DG: Conceptualization, Data curation, Formal analysis, Funding acquisition, Investigation, Methodology, Project administration, Resources, Software, Supervision, Validation, Visualization, Writing – original draft, Writing – review & editing. FN: Conceptualization, Data curation, Formal analysis, Funding acquisition, Investigation, Methodology, Project administration, Resources, Software, Supervision, Validation, Visualization, Writing – original draft, Writing – review & editing. KP: Data curation, Formal analysis, Project administration, Writing – original draft. MM: Data curation, Formal analysis, Methodology, Supervision, Writing – review & editing. J-hL: Data curation, Formal analysis, Investigation, Methodology, Writing – review & editing. MF: Data curation, Investigation, Methodology, Writing – review & editing. JL: Data curation, Formal analysis, Methodology, Software, Writing – review & editing. SC: Validation, Investigation, Writing – original draft, Writing – review & editing. TM: Data curation, Investigation, Software, Writing – review & editing. PN: Data curation, Formal analysis, Writing – review & editing. KP: Data curation, Formal analysis, Writing – review & editing. SP: Resources, Supervision, Validation, Visualization, Writing – review & editing. JS: Data curation, Formal analysis, Investigation, Methodology, Writing – review & editing. RB: Investigation, Methodology, Validation, Writing – review & editing. HH: Validation, Writing – review & editing. RG: Methodology, Validation, Writing – review & editing. PB: Investigation, Methodology, Supervision, Validation, Writing – review & editing. PL: Validation, Writing – review & editing. CR: Conceptualization, Formal analysis, Validation, Writing – review & editing.
Funding
The author(s) declare that financial support was received for the research and/or publication of this article. The project “Exposure to biological allergens and air pollutants under climate change conditions within low-income communities in South Africa” (ST-POC-2312-61906) has been funded by a grant provided by GCC and SAMRC. Open access funding by University of Bern.
Acknowledgments
We thank the staff and students on NWU Potchefstroom campus for their assistance during the SPT. We thank our funders (GCC, and SAMRC) for making this research possible through their generous support.
Conflict of interest
The authors declare that the research was conducted in the absence of any commercial or financial relationships that could be construed as a potential conflict of interest.
Generative AI statement
The author(s) declare that no Generative AI was used in the creation of this manuscript.
Publisher's note
All claims expressed in this article are solely those of the authors and do not necessarily represent those of their affiliated organizations, or those of the publisher, the editors and the reviewers. Any product that may be evaluated in this article, or claim that may be made by its manufacturer, is not guaranteed or endorsed by the publisher.
Supplementary material
The Supplementary Material for this article can be found online at: https://www.frontiersin.org/articles/10.3389/falgy.2025.1568669/full#supplementary-material
References
1. Savouré M, Bousquet J, Jaakkola JJ, Jaakkola MS, Jacquemin B, Nadif R. Worldwide prevalence of rhinitis in adults: a review of definitions and temporal evolution. Clin Transl Allergy. (2022) 12(3):e12130. doi: 10.1002/clt2.12130
2. Gutowska-Ślesik J, Samoliński B, Krzych-Fałta E. The increase in allergic conditions based on a review of literature. Adv Dermatol Allergol. (2023) 40(1):1–7. doi: 10.5114/ada.2022.119009
3. Adeloye D, Chan KY, Rudan I, Campbell H. An estimate of asthma prevalence in Africa: a systematic analysis. Croat Med J. (2013) 54(6):519–31. doi: 10.3325/cmj.2013.54.519
4. Ndjindji OM, Rogombe SM, Bissiengou PM, Mveang-Nzoghe A, Leboueny M, Mbina O, et al. Allergen sensitization and polysensitization pattern of adults and children in an urban sub-saharan African setting (Libreville, Gabon). J Allergy Clin Immunol: Global. (2023) 2(1):23–9. doi: 10.1016/j.jacig.2022.10.005
5. Levin ME, Botha M, Basera W, Facey-Thomas HE, Gaunt B, Gray CL, et al. Environmental factors associated with allergy in urban and rural children from the South African food allergy (SAFFA) cohort. J Allergy Clin Immunol. (2020) 145(1):415–26. doi: 10.1016/j.jaci.2019.07.048
6. Pfavayi LT, Sibanda EN, Mutapi F. The pathogenesis of fungal-related diseases and allergies in the African population: the state of the evidence and knowledge gaps. Int Arch Allergy Immunol. (2020) 181(4):257–69. doi: 10.1159/000506009
7. Burge HA, Rogers CA. Outdoor allergens. Environ Health Perspect. (2000) 108(suppl 4):653–9. doi: 10.1289/ehp.00108s4653
8. Bousquet J, Anto JM, Bachert C, Baiardini I, Bosnic-Anticevich S, Walter Canonica G, et al. Allergic rhinitis. Nat Rev Dis Primers. (2020) 6(1):95. doi: 10.1038/s41572-020-00227-0
9. Buters JT, Antunes C, Galveias A, Bergmann KC, Thibaudon M, Galán C, et al. Pollen and spore monitoring in the world. Clin Transl Allergy. (2018) 8:1–5. doi: 10.1186/s13601-018-0197-8
10. Rutherford MC, Mucina L, Powrie LW. Biomes and bioregions of Southern Africa. In: Mucina L, Rutherford MC, editors. The Vegetation of South Africa, Lesotho and Swaziland. Pretoria, South Africa: South African National Biodiversity Institute (2009). p. 30–51.
11. Gharbi D, Neumann FH, Cilliers S, Cornelius S, Viviers J, Drewes E, et al. Allergenic tree pollen in Johannesburg and Cape Town as a public health risk: towards a sustainable implementation framework for South African cities. Discov Sustain. (2023) 4(1):32. doi: 10.1007/s43621-023-00151-9
12. Henderson L. Invasive, naturalized and casual alien plants in Southern Africa: a summary based on the Southern African plant invaders atlas (SAPIA). Bothalia. (2007) 37(2):215–48. doi: 10.4102/abc.v37i2.322
13. Ajikah L, Neumann FH, Berman D, Peter J. Aerobiology in South Africa: a new hope!. S Afr J Sci. (2020) 116(7-8):1–4. doi: 10.17159/sajs.2020/8112
14. Esterhuizen N, Berman DM, Neumann FH, Ajikah L, Quick LJ, Hilmer E, et al. The South African pollen monitoring network: insights from 2 years of national aerospora sampling (2019–2021). Clin Transl Allergy. (2023) 13(11):e12304. doi: 10.1002/clt2.12304
15. Davies JM, Berman D, Beggs PJ, Ramón GD, Peter J, Katelaris CH, et al. Global climate change and pollen aeroallergens: a southern hemisphere perspective. Immunol Allergy Clin. (2021) 41(1):1–6. doi: 10.1016/j.iac.2020.09.002
16. Beggs PJ, Clot B, Sofiev M, Johnston FH. Climate change, airborne allergens, and three translational mitigation approaches. EBioMedicine. (2023) 1:93. doi: 10.1016/j.ebiom.2023.104478
17. Ordman D. Pollinosis in South Africa: a study of seasonal hay-fever. S Afr Med J. (1947) 21(2):38–48.20295110
18. Ordman D. Seasonal respiratory allergy and the associated pollens in South Africa. S Afr Med J. (1963) 37(13):321–5.13940280
19. Prescott RA, Potter PC. Allergenicity and cross-reactivity of Buffalo grass (Stenotaphrum secundatum). S Afr Med J. (2001) 91(3):237–43.11291423
20. Van Rooyen C, Van den Berg S, Becker PJ, Green RJ. Allergic sensitisation in South Africa: exploring regional variation in sensitisation. S Afr Med J. (2020) 110(7):686–90.32880348
21. Havenga H, Gharbi D, Sewry N, Language B, Neumann FH, Finch JM, et al. Healthy environments for athleTes (HEAT): environmental conditions along a 90 km ultra-marathon event, South Africa. Int J Biomeorol. (2024) 13:1–5. doi: 10.1007/s00484-024-02703-8
22. Gharbi D, Vanker A, Garland RM, Peter J. The intersection between air quality aerobiology and asthma in South Africa-could green spaces help? Curr Allergy Clin Immunol. (2023) 36(3):2–6.
23. Neumann FH, Gharbi D, Ajikah L, Scott L, Cilliers S, Staats J, et al. Ecological and allergenic significance of atmospheric pollen spectra from a grassland-savanna ecotone in north west province, South Africa. Palynology. (2025) 49(2):1347–54. doi: 10.1080/01916122.2024.2411234
24. Gharbi D, Berman D, Neumann FH, Hill T, Sidla S, Cillers SS, et al. Ambrosia (ragweed) pollen—a growing aeroallergen of concern in South Africa. World Allergy Organ J. (2024) 17(12):101011. doi: 10.1016/j.waojou.2024.101011
25. Asher ME, Keil U, Anderson HR, Beasley R, Crane J, Martinez F, Mitchell EA, Pearce N, Sibbald B, Stewart A W. (1995). International study of asthmaand allergies in childhood (ISAAC): rationale andmethods. Eur Respir J. 1995; 8(3): 483–91. doi: 10.1183/09031936.95.08030483
26. Gupta N, Agarwal P, Sachdev A, Gupta D. Allergy testing—an overview. Indian Pediatr. (2019) 56:951–7. doi: 10.1007/s13312-019-1652-x
27. Moreoane L, Mukwevho P, Burger R. The quality of the first and second vaal triangle airshed priority area air quality management plans. Clean Air J. (2021) 31(2):1–4. doi: 10.17159/caj/2020/31/2.12178
28. Masenya HL, Molepo JN. Amalgamation of the South African municipalities: a case of JB marks local municipality. J Public Adm. (2020) 55(3):412–26.
29. Du Plessis H, Byrne MJ, Van den Berg J. Distribution and host plant range of nysius natalensis evans (Hemiptera: orsillidae) in the sunflower production area of South Africa. Afr Entomol. (2007) 15(2):310–8. doi: 10.4001/1021-3589-15.2.310
30. Galán C, Smith M, Thibaudon M, Frenguelli G, Oteros J, Gehrig RE, et al. EAS QC working group. Pollen monitoring: minimum requirements and reproducibility of analysis. Aerobiologia. (2014c) 30:385–95. doi: 10.1007/s10453-014-9335-5
31. Ajikah LB, Roffe SJ, Neumann FH, Bamford MK, Esterhuizen N, Berman D, et al. Meteorological influences on airborne pollen and spores in Johannesburg (gauteng), South Africa. Aerobiologia. (2023) 39(3):363–88. doi: 10.1007/s10453-023-09799-2
32. De Hoog GS, Guarro J, Gene J, Figueras MJ. Atlas of Clinical Fungi. 2nd ed. Utrecht: Centraalbureau voor Schimmelcultures (2011).
33. Singh AB, Kumar P. Climate change and allergic diseases: an overview. Front Allergy. (2022) 3:964987. doi: 10.3389/falgy.2022.964987
34. Murrison LB, Brandt EB, Myers JB, Hershey GK. Environmental exposures and mechanisms in allergy and asthma development. J Clin Investig. (2019) 129(4):1504–15. doi: 10.1172/JCI124612
35. Ramon GD, Barrionuevo LB, Viego V, Vanegas E, Felix M, Cherrez-Ojeda I. Sensitization to subtropical grass pollens in patients with seasonal allergic rhinitis from Bahia Blanca, Argentina. World Allergy Organ J. (2019) 12(9):100062. doi: 10.1016/j.waojou.2019.100062
36. Punay J, Lucas MF, Arpon IM, Jalbuena Q, Albano PM, Sabit M. Sensitisation profile to pollen allergens of selected grass and tree species in Filipino communities. Grana. (2024) 63(1):52–66. doi: 10.1080/00173134.2024.2316045
37. Sénéchal H, Ramamonjisoa ZR, Andrianarisoa AC, Rakotoarimanana VM, Sutra JP, Peltre G. Allergy to pollen of six common grasses in the highlands of Madagascar. Curr Allergy Clin Immunology. (2013) 26(4):184.
38. Sibanda EN. Inhalant allergies in Zimbabwe: a common problem. Int Arch Allergy Immunol. (2003) 130(1):2–9. doi: 10.1159/000068377
39. Kwizera R, Wadda V, Mugenyi L, Aanyu-Tukamuhebwa H, Nyale G, Yimer G, et al. Skin prick reactivity among asthmatics in east Africa. World Allergy Organ J. (2020) 13(6):100130. doi: 10.1016/j.waojou.2020.100130
40. Green RJ. Barriers to optimal control of asthma and allergic rhinitis in South Africa. Curr Allergy Clin Immunol. (2010) 23(1):8–11.
41. Richards GA, McDonald M, Gray CL, De Waal P, Friedman R, Hockman M, et al. Allergic rhinitis: review of the diagnosis and management: south African allergic rhinitis working group. South Afr Gen Pract. (2023) 4(4):124–36. doi: 10.36303/SAGP.0124
42. D’Amato G, Cecchi L, Bonini S, Nunes C, Annesi-Maesano I, Behrendt H, et al. Allergenic pollen and pollen allergy in Europe. Allergy. (2007) 62(9):976–0. doi: 10.1111/j.1398-9995.2007.01393.x
43. Fish L, Mashau AC, Moeaha MJ, Nembudani MT. Identification guide to Southern African grasses: an identification manual with keys, descriptions and distributions. In: Strelitzia 36. Pretoria, South Africa: South African National Biodiversity Institute (2015).
44. Visser V, Maitre D, Wilson JR, Nänni I, Canavan K, Canavan S, et al. Grasses as invasive plants in South Africa revisited: patterns, pathways and management. Bothalia Afr Biodivers Conserv. (2017) 47(2):1–29. doi: 10.4102/abc.v47i2.2169
45. Potter PC, Cadmant A. Pollen allergy in South Africa. Clin Exp Allergy. (1996) 26(12). doi: 10.1111/j.1365-2222.1996.tb00535.x
46. Pfaar O, Bastl K, Berger U, Buters J, Calderon MA, Clot B, et al. Defining pollen exposure times for clinical trials of allergen immunotherapy for pollen-induced rhinoconjunctivitis–an EAACI position paper. Allergy. (2017) 72(5):713–22. doi: 10.1111/all.13092
47. Becker J, Steckling-Muschack N, Mittermeier I, Bergmann KC, Böse-O’Reilly S, Buters J, et al. Threshold values of grass pollen (Poaceae) concentrations and increase in emergency department visits, hospital admissions, drug consumption and allergic symptoms in patients with allergic rhinitis: a systematic review. Aerobiologia. (2021) 37:633–62. doi: 10.1007/s10453-021-09720-9
48. Mercer MJ, van der Linde GP, Joubert G. Rhinitis (allergic and non-allergic) in an atopic pediatric referral population in the Grasslands of Inland South Africa. Ann Allergy Asthma Immunol. (2002) 89:503–512.5. doi: 10.1016/S1081-1206(10)62089-3
49. Seedat RY, Rautenbach J, Steenkamp G, Venter J, Joubert G. Allergen sensitivities of patients with allergic rhinitis presenting to the Ent Clinic at Universitas Academic Hospital. Curr Allergy Clin Immunol. (2006) 19(3):130–2.
50. Raynor GS, Ogden EC, Hayes JV. Dispersion and deposition of corn pollen from experimental sources 1. Agron J. (1972) 64(4):420–7. doi: 10.2134/agronj1972.00021962006400040004x
51. Vogler A, Wettstein-Bättig M, Aulinger-Leipner I, Stamp P. The airborne pollen flow of maize (Zea mays L.) in a multi-crop designed field plot. Agric Meteorol. (2009) 149(10):1776–80. doi: 10.1016/j.agrformet.2009.05.008
52. Abidoye BO, Mabaya E. Adoption of genetically modified crops in South Africa: effects on wholesale maize prices. Agrekon. (2014) 53(1):104–23. doi: 10.1080/03031853.2014.887907
53. Damialis A, Konstantinou GN. Cereal pollen sensitisation in pollen allergic patients: to treat or not to treat? Eur Ann Allergy Clin Immunol. (2011) 43(2):36.21608371
54. Weber RW. Patterns of pollen cross-allergenicity. J Allergy Clin Immunol. (2003) 112(2):229–39. doi: 10.1067/mai.2003.1683
55. Hrabina M, Jain K, Gouyon B. Cross-reactivity between pollen allergens from common pooideae grasses and cultivated cereals. Clin Exp Allergy Rev. (2008) 8(1):18–20. doi: 10.1111/j.1472-9733.2008.00128.x
57. Potter PC, Berman D, Toerien A, Malherbe D, Weinberg EG. Clinical significance of aero-allergen identification in the western cape. S Afr MedJ. (1991) 79(2):80–4.
58. Seedat RY. Environmental control of outdoor allergens. Curr Allergy Clin Immunol. (2019) 32(1):12–4.
59. Potter PC. Common indoor and outdoor aero-allergens in South Africa. CME SA J CPD. (2010) 28(9):426–32.
60. Coates Palgrave M. Keith Coates Palgrave Trees of Southern Africa. 3rd ed. Cape Town: Struik (2002).
61. Cariñanos P, Marinangeli F. An updated proposal of the potential allergenicity of 150 ornamental trees and shrubs in Mediterranean cities. Urban for Urban Green. (2021) 63:127218. doi: 10.1016/j.ufug.2021.127218
62. Bousquet J, Heinzerling L, Bachert C, Papadopoulos NG, Bousquet PJ, Burney PG, et al. Practical guide to skin prick tests in allergy to aeroallergens. Allergy. (2012) 67(1):18–24. doi: 10.1111/j.1398-9995.2011.02728.x
63. Joubert G. Allergen sensitivities of patients with allergic rhinitis presenting to the ENT Clinic, Universitas Academic Hospital. Curr Allergy Clinical Immunol. (2006) 19(3):130–2.
64. Olaniyan T, Jeebhay M, Röösli M, Naidoo R, Baatjies R, Künzil N, et al. A prospective cohort study on ambient air pollution and respiratory morbidities including childhood asthma in adolescents from the western cape province: study protocol. BMC Public Health. (2017) 17(1):712. doi: 10.1186/s12889-017-4726-5
65. Olaniyan T, Dalvie MA, Röösli M, Naidoo RN, Künzli N, de Hoogh K, et al. Short term seasonal effects of airborne fungal spores on lung function in a panel study of schoolchildren residing in informal settlements of the western cape of South Africa. Environ Pollut. (2020) 260:114023. doi: 10.1016/j.envpol.2020.114023
66. Anees-Hill S, Douglas P, Pashley CH, Hansell A, Marczylo EL. A systematic review of outdoor airborne fungal spore seasonality across Europe and the implications for health. Sci Total Env. (2022) 818:151716. doi: 10.1016/j.scitotenv.2021.151716
67. Kasprzyk I, Worek M. Airborne fungal spores in urban and rural environments in Poland. Aerobiologia. (2006) 22:169–76. doi: 10.1007/s10453-006-9029-8
68. Atkinson RW, Strachan DP, Anderson HR, Hajat S, Emberlin J. Temporal associations between daily counts of fungal spores and asthma exacerbations. Occup Environ Med. (2006) 63(9):580–90. doi: 10.1136/oem.2005.024448
70. Lisitsyna OV, Giesecke T, Hicks S. Exploring pollen percentage threshold values as an indication for the regional presence of major European trees. Rev Palaeobot Palynol. (2011) 166(3-4):311–24. doi: 10.1016/j.revpalbo.2011.06.004
71. Tegart LJ, Johnston FH, Borchers Arriagada N, Workman A, Dickinson JL, Green BJ, et al. ‘Pollen potency’: the relationship between atmospheric pollen counts and allergen exposure. Aerobiologia. (2021) 37(4):825–41. doi: 10.1007/s10453-021-09726-3
72. Damialis A, Traidl-Hoffmann C, Treudler R. Climate change and pollen allergies. In: Marselle MR, Stadler J, Korn H, Irvine KN, Bonn A, editors. Biodiversity and Health in the Face of Climate Change. Cham: Springer (2019). p. 47–66.
73. Berger M, Bastl M, Bouchal J, Dirr L, Berger U. The influence of air pollution on pollen allergy sufferers. Allergologie Select. (2021) 5:345. doi: 10.5414/ALX02284E
74. D’Amato G, D’Amato M. Climate change, air pollution, pollen allergy and extreme atmospheric events. Curr Opin Pediatr. (2023) 35(3):356–61. doi: 10.1097/MOP.0000000000001237
75. Guryanova SV, Finkina EI, Melnikova DN, Bogdanov IV, Bohle B, Ovchinnikova TV. How do pollen allergens sensitize? Front Mol Biosci. (2022) 9:900533. doi: 10.3389/fmolb.2022.900533
76. Luyten A, Bürgler A, Glick S, Kwiatkowski M, Gehrig R, Beigi M, et al. Ambient pollen exposure and pollen allergy symptom severity in the EPOCHAL study. Allergy. (2024) 79:1908–20. doi: 10.1111/all.16130
77. Gharbi D, Neumann FH, Staats J, McDonald M, Linde JH, Mmatladi T, et al. Prevalence of aeroallergen sensitization in a polluted and industrialized area: a pilot study in South Africa’s vaal triangle. Environ Monit Assess. (2025) 197(3):1–5. doi: 10.1007/s10661-025-13718-y
78. Jensen-Jarolim E, Untersmayr E. Gender-medicine aspects in allergology. Allergy. (2008) 63(5):610–5. doi: 10.1111/j.1398-9995.2008.01645.x
79. Wegienka G, Johnson CC, Zoratti E, Havstad S. Racial diferences in allergic sensitization: recent fndings and future directions. Curr Allergy Asthma Rep. (2013) 13(3):255–61. doi: 10.1007/s11882-013-0343-2
80. Frisk CA, Adams-Groom B, Smith M. Isolating the species element in grass pollen allergy: a review. Sci Total Env. (2023) 883:163661. doi: 10.1016/j.scitotenv.2023.163661
81. Núñez A, Amo de Paz G, Ferencova Z, Rastrojo A, Guantes R, García AM, et al. Validation of the hirst-type spore trap for simultaneous monitoring of prokaryotic and eukaryotic biodiversities in urban air samples by next-generation sequencing. Appl Environ Microbiol. (2017) 83(13):e00472–17. doi: 10.1128/AEM.00472-17
Keywords: aeroallergens, skin prick tests, respiratory diseases, Potchefstroom, pollens, fungi, South Africa
Citation: Gharbi D, Neumann FH, Podile K, McDonald M, Linde J-h, Frampton M, Liebenberg JL, Cilliers S, Mmatladi T, Nkosi P, Paledi K, Piketh S, Staats J, Burger RP, Havenga H, Garland RM, Bester P, Lebre PH and Ricci C (2025) Exposure to outdoor aerospora and associated respiratory health risks among adults in Potchefstroom, North-West province, South Africa. Front. Allergy 6:1568669. doi: 10.3389/falgy.2025.1568669
Received: 30 January 2025; Accepted: 17 March 2025;
Published: 15 April 2025.
Edited by:
Paola Lorena Smaldini, CONICET Instituto de Estudios Inmunológicos y Fisiopatalógicos (IIFP), ArgentinaReviewed by:
Pawel Bogawski, Adam Mickiewicz University in Poznań, PolandAlejandra Goldman, Universidad Nacional de General San Martín, Argentina
Albeiro Marrugo Padilla, University of Cartagena, Colombia
Copyright: © 2025 Gharbi, Neumann, Podile, McDonald, Linde, Frampton, Liebenberg, Cilliers, Mmatladi, Nkosi, Paledi, Piketh, Staats, Burger, Havenga, Garland, Bester, Lebre and Ricci. This is an open-access article distributed under the terms of the Creative Commons Attribution License (CC BY). The use, distribution or reproduction in other forums is permitted, provided the original author(s) and the copyright owner(s) are credited and that the original publication in this journal is cited, in accordance with accepted academic practice. No use, distribution or reproduction is permitted which does not comply with these terms.
*Correspondence: Dorra Gharbi, ZG9ycmEuZ2hhcmJpQHVuaWJlLmNo; Frank Harald Neumann, RnJhbmsuTmV1bWFubkBud3UuYWMuemE=
†ORCID:
Dorra Gharbi
orcid.org/0000-0003-3013-6876
Frank Harald Neumann
orcid.org/0000-0002-3620-2742
Marinda McDonald
orcid.org/0000-0002-5348-3849
Jennifer Leigh Liebenberg
orcid.org/0000-0002-3811-4957
Stuart Piketh
orcid.org/0000-0002-2804-879X
Jurgens Staats
orcid.org/0000-0003-1314-0961
Roelof P. Burger
orcid.org/0000-0002-4359-4588
Henno Havenga
orcid.org/0000-0002-9238-0295
Rebecca M. Garland
orcid.org/0000-0002-1855-8622
Petra Bester
orcid.org/0000-0002-8440-7638
Pedro Humberto Lebre
orcid.org/0000-0002-6483-0340
Cristian Ricci
orcid.org/0000-0003-4113-8682