 Lawrence Aula
 Amanda C. Easterly2
 Cody F. Creech
- 1Panhandle Research, Extension, and Education Center, Department of Agronomy and Horticulture, University of Nebraska-Lincoln, Scottsbluff, NE, United States
- 2High Plains Agricultural Laboratory, Department of Agronomy and Horticulture, University of Nebraska-Lincoln, Sidney, NE, United States
Making the best use of limited precipitation in semi-arid dryland cropping systems is important for crop production. Tillage practices may influence how this precipitation is utilized to predict winter wheat grain yield (Triticum aestivum L.). This study examined how tillage practices influence winter wheat grain yield prediction accuracy using precipitation received at three different periods of the season. Data were obtained from the period of 1972 to 2010 from a long-term tillage experiment. The study was designed as a winter wheat-fallow experiment. Each phase of the winter wheat-fallow rotation was present each year. The trial was set up as a randomized complete block design with three replications. Tillage treatments included no-till (NT), stubble mulch (SM), and moldboard plow (MP). Feed-forward neural network and multiple linear regression (ordinary least squares) were used to fit models under each tillage practice. No-till had the highest yield prediction accuracy with a root mean square error (RMSE) of 0.53 Mg ha-1 and accounted for 81% of the variability in grain yield. Stubble mulch had an RMSE of 0.55 Mg ha-1 and explained 73% of the variability in yield. Stubble mulch and NT were more accurate in yield prediction than MP which had an RMSE of 0.77 Mg ha-1 and accounted for 53% of the variability in yield. The multiple linear regression model was less accurate than the feed-forward neural network model since it had at least 0.30 Mg ha-1 more RMSE and accounted for only 5-8% of the variability in yield. Relative RMSE classified all neural network models as fair (21.6-27.3%) while linear regression models for the different tillage practices was classified as poor (33.3-43.6%), an illustration that the neural network models improve yield prediction accuracy. This study demonstrated that a large proportion of the variability in grain yield may be accounted for under NT and SM systems when using precipitation as predictors with neural networks.
Introduction
Wheat (Triticum aestivum L.) is highly significant in the global crop production system that it occupies 19.3% of the total global crop production area (Dhillon et al., 2019). It provides a substantial portion of the total calories (19%) consumed worldwide (Shiferaw et al., 2013). This means it is a crop that is subject to numerous research efforts needed to attain sustainable production for meeting the rising global food demand associated with the growth in human population (Barrett, 2021). Understanding factors that influence wheat production is, therefore, key to achieving the sustainability of the wheat production systems. Winter wheat yield potential is one variable that is studied to aid in making appropriate crop management decisions (Colaço and Bramley, 2019; Zhang et al., 2019; Marszalek et al., 2022). This is, for instance, used as a basis to make a recommendation for nitrogen application whether preplant (yield goal) or in-season (Dahnke et al., 1988; Raun et al., 2002). The more accurately a yield potential is estimated, the higher the likelihood that a sound management decision is made.
In recent decades, much attention has been given to the use of technology to predict yield potential. This includes the use of satellites and proximal remote sensing instruments such as GreenSeeker (Filippi et al., 2019; Kamir et al., 2020; Gómez et al., 2021). At the heart of these approaches, are spectral reflectance measurements collected at specific electromagnetic wavelengths. These measurements are further transformed to normalized difference vegetation index (NDVI) or in-season estimated yield (INSEY) or other indices to predict yield potential with or without other predictors (Raun et al., 2001; Gómez et al., 2021). This can account for up to 88% of the variability in winter wheat grain yield (Yunus and Polat, 2022). More predictors improve the accuracy with which the algorithms can predict grain yield potential (Colaço and Bramley, 2019). However, with more predictors, there is an increased likelihood of overfitting the model and careful selection of the features needs to be undertaken (James et al., 2021) to increase the yield prediction accuracy.
Precipitation and other climate variables are often recommended to be used alongside other predictors to improve yield prediction accuracy (Filippi et al., 2019; Aula et al., 2021). Although precipitation at specific growth or reproductive stages may have a strong linear relationship with grain yield when fit using ordinary least squares (Hatfield and Dold, 2018), the entire growing season precipitation may have a poor relationship with grain yield. For instance, Camara et al. (2003) showed that annual and seasonal precipitation in Oregon had a positive linear relationship with grain yield but that precipitation accounted for only 5.9-14.2% of the variability in grain yield. Since it is possible that this is an R2 generated by fitting a model to the entire data set (unsplit into training and validation set), the R2 obtained using a test data could be lower than the 5.9-14% highlighted above. Relatedly, Omara et al. (2020) conducted a study in Oklahoma and found seasonal precipitation to account for about 25% of the variability in grain yield at the highest nitrogen rate when evaluated using a linear regression model. As this was also not validated, the amount of variability explained by the model could be lower than the R2 obtained during model calibration. A poor relationship has also been observed specifically between precipitation during the reproductive stage and wheat grain yield but with precipitation having more effect on grain yield during the vegetative stage (Yu et al., 2014). Nonetheless, this study did not indicate the magnitude with which precipitation accounted for the variability in grain yield. Considering that the relationship between seasonal precipitation and grain yield may be low, it may seem counterintuitive to use seasonal precipitation as a sole predictor of winter wheat grain yield potential. However, with advances in machine learning techniques (James et al., 2021), it may be possible to explore the non-linear relationship between precipitation and grain yield with increased prediction accuracy. Wallach et al. (2006) noted that capturing the non-linearities in models aids our understanding of agricultural systems much better. Additionally, precipitation at specific periods of the year or different growth stages may influence winter wheat grain yield differently and could be used as separate features for predicting winter wheat grain yield. Feng et al. (2018) found indices based on rainfall during specific months of the season to be important variables that should be included in the model for predicting winter wheat grain yield. In order to make the best use of such predictors, feed-forward neural network – a deep learning algorithm – capable of detecting nonlinearities in responses of interest with more accuracy could be deployed (James et al., 2021). The algorithm has the potential to detect complex patterns in the data for improved prediction accuracy (Khodayar et al., 2021) and this could be further explored in agriculture for a more accurate yield prediction, an important option for a more precise recommendation of crop nutrients, particularly nitrogen. Despite its long existence among the statistical community, this deep learning approach only regained more prominence in the scientific communities after 2010 (James et al., 2021). As a result, its exploration in yield prediction could offer a new tool in the scientific toolbox for improving crop production efficiency. This study aims to understand if tillage practices, that is, no-till (NT), stubble mulch (SM), and moldboard plow (MP), influence winter wheat grain yield prediction accuracy when using feed-forward neural network and compare the results to models built using multiple linear regression approach with precipitation as the predictors. No-till and SM are known to store extra moisture in the soil (Lyon et al., 1998). This takes place, particularly during the 14-month fallow phase leading to an improvement in soil water and precipitation storage efficiency under NT (35%) relative to MP (20%) (Tanaka and Anderson, 1997; Nielsen and Vigil, 2010). Although this moisture hardly makes the yield associated with NT to be substantially larger than that of MP and SM (Lyon et al., 1998), it is uncertain if a model built under such a system can outperform a model built under other tillage practices. The study hypothesizes that NT and SM will result in models with a higher grain yield prediction accuracy than a model built using data derived from the MP system under a dryland cropping system. Furthermore, feed-forward neural network will build a model with higher prediction accuracy than multiple linear regression approach. Tang et al. (2022) used a similar approach in a dryland cropping system and found the neural network using various climate variables to reduce errors in yield prediction by as much as 502 kg ha-1 when compared to least absolute shrinkage and selection operator (LASSO), a conservative linear model. This is illustrative of the potential benefit of this approach in improving grain yield prediction.
The objective of this work was to evaluate differences in the prediction accuracy of models built under different tillage practices that take precipitation at specific periods of the season as features for predicting grain yield.
Materials and methods
Site characteristics, experimental design, and crop management
The experiment was conducted at the High Plains Agricultural Laboratory (41°15’29.0”N 103°00’41.0”W) located in Sidney, Nebraska. The soil at the experimental site is classified as Duroc loam with 0-1% slopes (Fine-silty, mixed, superactive, mesic Pachic Haplustolls) (Soil Survey Staff). The experiment was established in 1970 as a randomized complete block design.
The experiment consisted of three tillage treatments - no-till (NT), stubble mulch (SM), and moldboard plow (MP). The fourth and last treatment in this experiment was maintained as native sod. Sod plots have never been tilled or planted with any crop since the inception of the experiment. Because it has been retained as native prairie grassland, it was excluded from this research and analysis. With SM, the soil was tilled to a depth of 10-15 cm using 90-150 cm V-Blades (Fenster and Peterson, 1979). The operation was done two to four times with the first operation reaching a depth of 10-15 cm while subsequent operations had the tillage depths reduced gradually. This tillage practice retains crop residues on the soil surface, thus, conserving soil and water (Fenster, 1961). An additional one to two operations were carried out using a rotary rodweeder. For the MP, tillage was carried out in spring of the fallow period to a depth of 15 cm. A field cultivator was used to perform two to three operations. Lastly, a rotary rodweeder was used to perform one to two operations (Fenster and Peterson, 1979). No-till plots were managed using herbicides and planting was done using a NT drill having single disk John Deere openers. Roundup [N-(phosphonomethyl) glycine)] and 2,4 D LV 6 (2,4-Dichlorophenoxy acetic acid, 2-ethylhexyl ester) were used to manage weeds during the fallow phase. The herbicides were applied 2-3 times a year at the rate recommended by each manufacturer. During the wheat phase, Beyond (ammonium salt of imazamox: 2-[4,5-dihydro-4-methyl-4-(1-methylethyl)5-oxo-1H-imidazol-2-yl]-5-(methoxymethyl)-3-pyridinecarboxylic acid) and 2,4D LV6 were applied once a year in spring.
Each of the three treatments had three replicates. Each experimental unit measured 8.5 m × 45.5 m and randomly received one of the three treatments within each block.
The experiment was set up as a winter wheat-fallow. Each phase of the winter wheat-fallow was present each year, meaning that when one phase was under winter wheat, the other phase was undergoing fallowing and vice versa. The experiment was established under a dryland cropping system, implying that no supplementary irrigation was applied for crop uptake in each year of experimentation. Experimental units did not receive nutrients of any kind for the entire length of the experiment.
More details about this experiment are contained in articles written by Fenster and Peterson (1979) and Peterson et al. (2012).
Winter wheat was planted in September and harvested in July of each cropping season. The grain moisture content was adjusted to 125 g kg-1. For this study, grain yield was obtained from the period of 1972 to 2010. This was because the period after 2010 saw the experiment modified by splitting the experimental units into two equal parts and assigned either intermittent tillage or NT treatment. This meant that SM was discontinued even though the baseline data for that treatment will continue to be helpful to understand how a shift from SM to NT or intermittent tillage (IT) could affect soil and crop response variables. Because of IT, plow schedule was amended to take place once every six years. As a result, data from 2011 to date was not included in this analysis. Precipitation data was also obtained for the same duration (1972-2010) from the weather station located near the site. Precipitation totals received during the season were split into three periods, that is, September – December, January – April, and May – July. It was precipitation at each of these phases that were used as a predictor during model calibration and validation.
Model calibration, evaluation, and data visualization
Model calibration and evaluation were conducted using R (R Core Team, 2022). R was implemented in RStudio (RStudio Team, 2022). The feed-forward neural network, a deep learning technique, was used to fit the models. A single-layer neural network was applied in the model calibration and validation (Figure 1; equation 1). The data was split into training and test sets. Test data constituted a third of the data. A training set was used to calibrate the model while the test set was used for validating the neural network model. The architecture and functionality of the neural network model were developed based on procedures highlighted by James et al. (2021). The input layer was constituted by three features, that is, precipitation from September to December, precipitation from January to April, and precipitation from May to July. The hidden layer was set at K hidden units equal to 50 and the non-linear activation function was specified as a rectified linear unit (ReLU). Stochastic gradient descent with a batch size of 50 for 300 epochs, and 10% dropout regularization was used for fitting the models. The function ‘callback_early_stopping()’ was used to stop training the model if mean square error did not improve for 20 epochs. Regularization was applied using L2 norm regularizer with a multiplier of 0.001 to make weak signals have weight of nearly zero. Tidyverse (Wickham et al., 2019), keras (Allaire and Chollet, 2022), ggpmisc (Aphalo, 2021), and readxl (Wickham and Bryan, 2019) packages were utilized during model fitting and data visualization. A multiple linear regression (ordinary least squares) model was also fit with precipitation at different periods used as predictors of grain yield (equation 2). Models using neural network and ordinary least squares fitting procedures were also implemented across tillage practices, that is, the data sets from separate tillage practices were merged (combined tillage) and each model type was fit to the data to evaluate models’ performance across tillage practices.
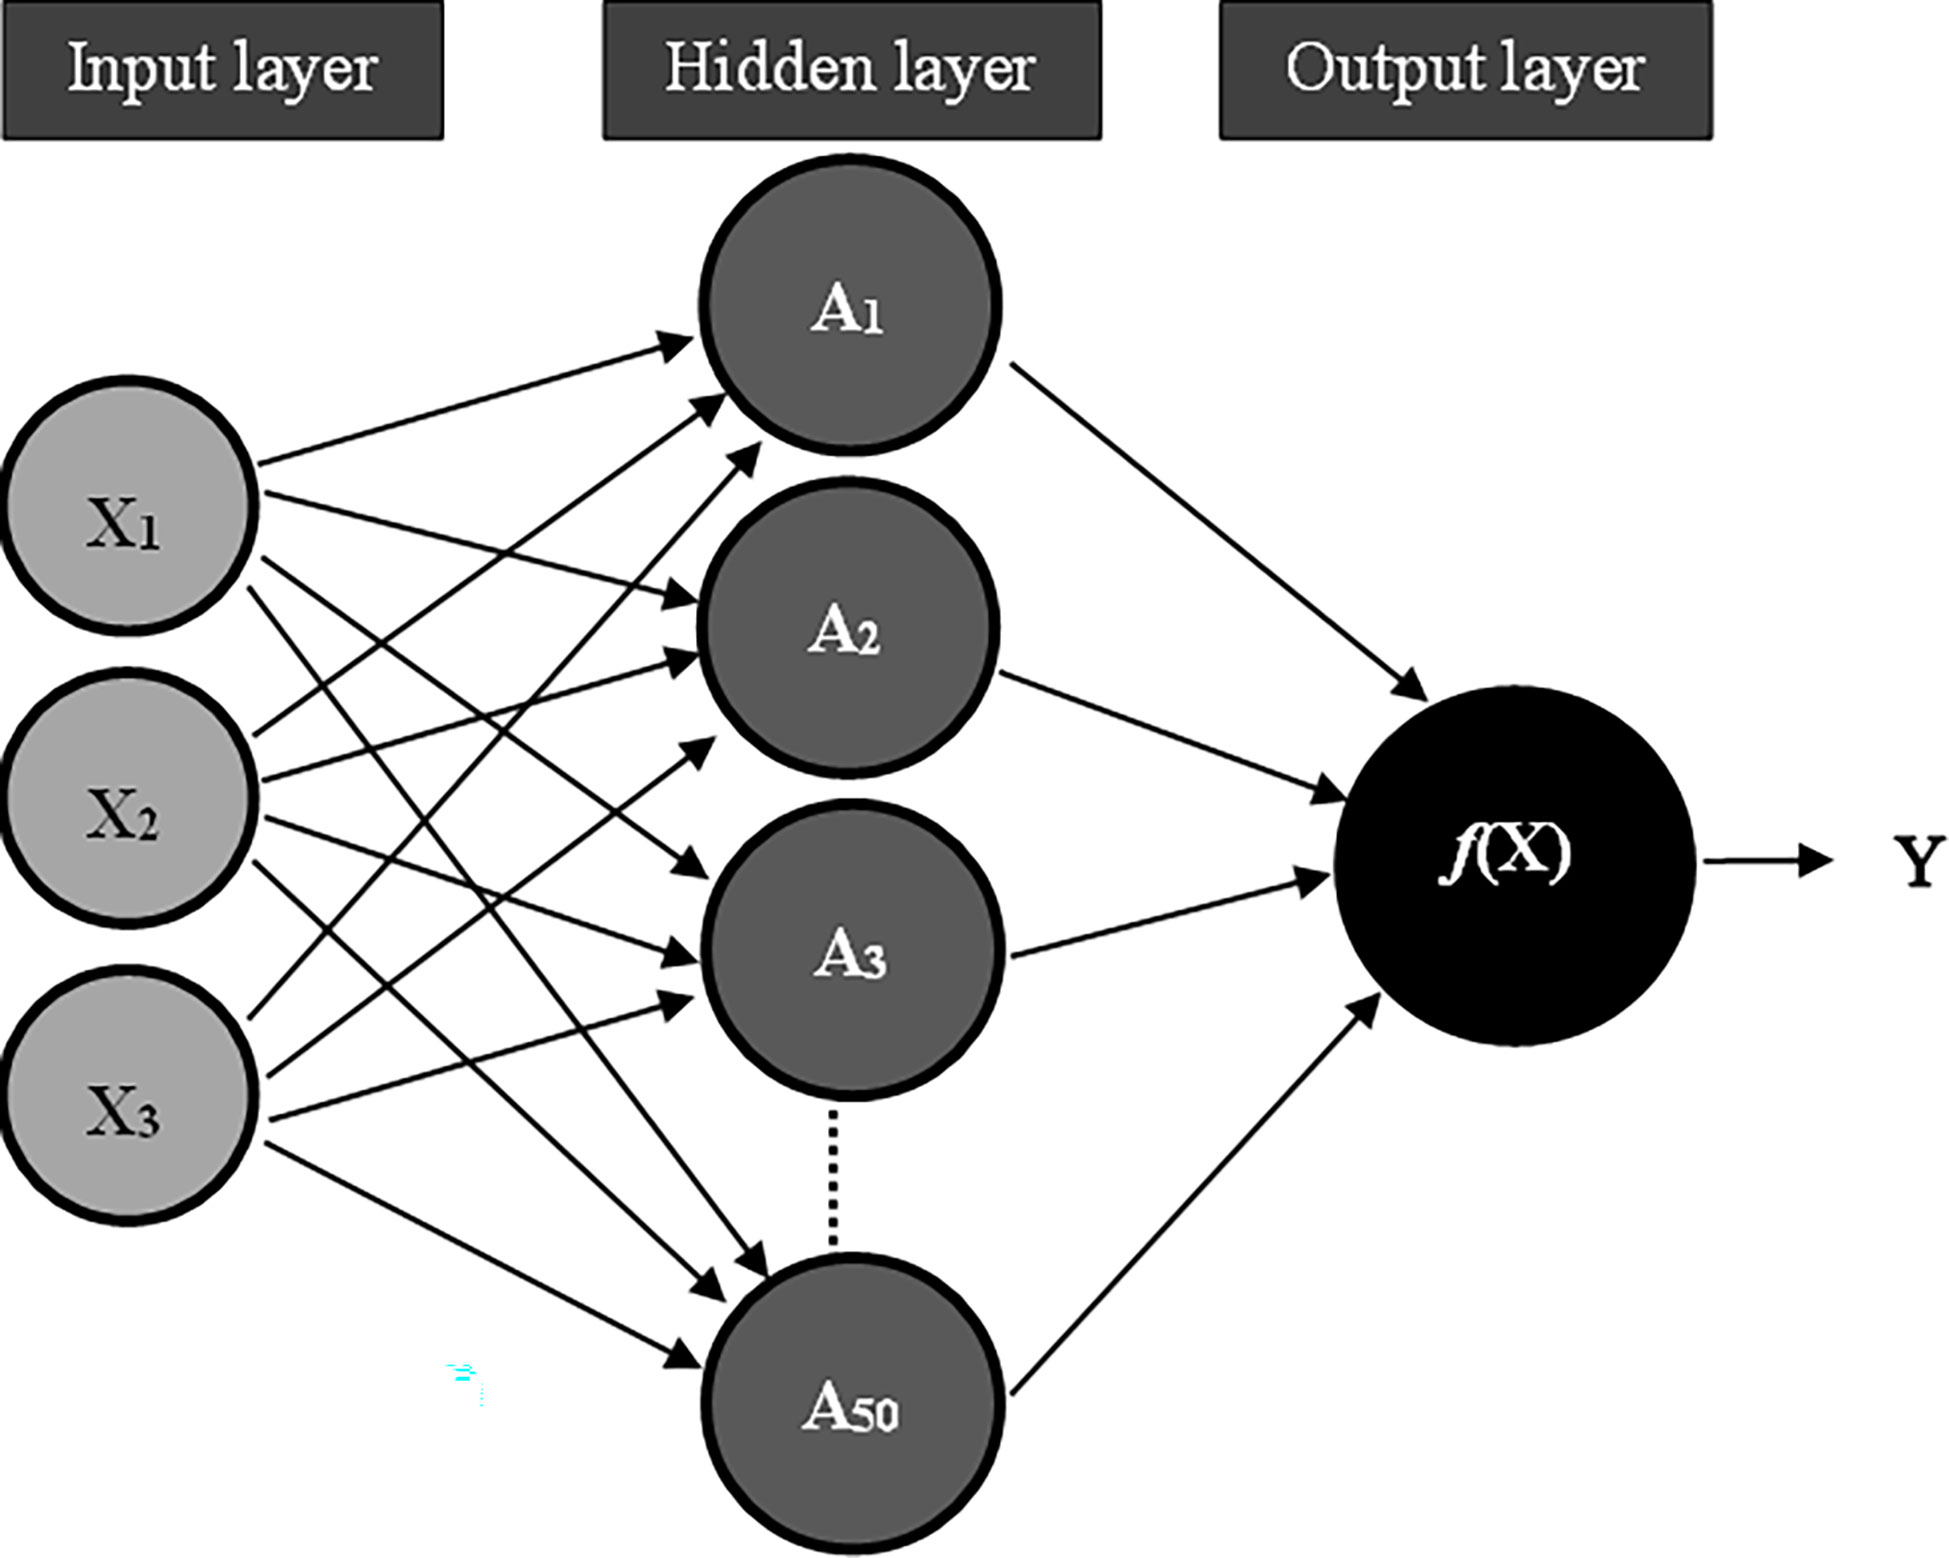
Figure 1 The architecture of a single layer neural network used in this study with illustration adopted with modification from James et al. (2021). X1, X2, and X3 represent rainfall from September to December, rainfall from January to April, and rainfall from May to July respectively. A1, A2,…, A50 represent activations Ak for the nonlinear transformations of linear combinations of inputs. The function f(X) was solved using activations Ak from the hidden layer as inputs to predict an observation, Y.
Cross-validation was used to evaluate the performance of the models under different tillage practices. Root mean square error (RMSE), relative RMSE (rRMSE), and coefficients of determination (R2) from validation of the models using test data were reported. The performance of a model was considered excellent, good, fair and poor if rRMSE <10%, 10%<rRMSE<20%, 20%<rRMSE<30% and rRMSE >30% respectively (Despotovic et al., 2016). Validation of multiple linear regression models was done using k-fold cross-validation approach with k = 10. The boot package (Canty and Ripley, 2021) was used to compute test mean square error by applying cv.glm() function. The model evaluation matrices (R2 and RMSE) above were extracted using the function ‘postResample()’ within the caret package (Kuhn, 2022). Relative RMSE was obtained by using the function gofRRMSE() from the ehaGoF package (Eyduran, 2020). These were then compared among the different tillage practices to determine which model used precipitation more efficiently to explain variability in winter wheat grain yield. Additional comparison was made between models built using multiple linear regression and nonlinear feed-forward neural network. A more comprehensive detail of the procedures and R scripts applied in this work is contained in a book written by James et al. (2021). In their procedures implemented in R using keras package, splitting the data into two sets meant that the neural network used a validation set approach. But because the k-fold cross-validation leads to a better bias-variance tradeoff (James et al., 2021), we used it for multiple linear regression to improve the model’s performance in yield prediction.
Where f(X) is a function used for prediction, β0 and βk are coefficients to be estimated from the training data. Akrepresents the transformation of the initial or original three predictors constituting the input layer. K = 1, 2,…, 50.
Where β0, β1, β2, and β3 are coefficients to be estimated from the training set, X1 to X3are the three predictors, that is precipitation from September to December, precipitation from January to April, and precipitation from May to July, respectively. ϵ is the random error.
We also used data from this site collected in April 2022 to compute saturated hydraulic conductivity to provide additional information why differences may exist among models built under different tillage practices. Stubble mulch tillage was not included in this analysis since its experimental units were replaced by NT and IT. However, only data from experimental units that retained the original treatments prior to modification in 2010/2011 season was used in this computation. Estimated marginal means was calculated using emmeans package (Lenth, 2022) after fitting a linear mixed model using lme4 package (Bates et al., 2015) with replication treated as a random effect while tillage was handled as a fixed effect. The mean difference was obtained using the glht() function within the multcomp package (Hothorn et al., 2008) piped to the summary() function.
Data normality and heteroscedasticity or non-constant variances of the error term were tested using functions shapiro.test() (Shapiro-Wilk normality test) and ncvTest() (non-constant variance test) within the car package respectively. In brief, the assumption of a constant variance of the error term was observed for each tillage practice and the combined data (Table 1). The assumption of normality of the data was observed with only NT.
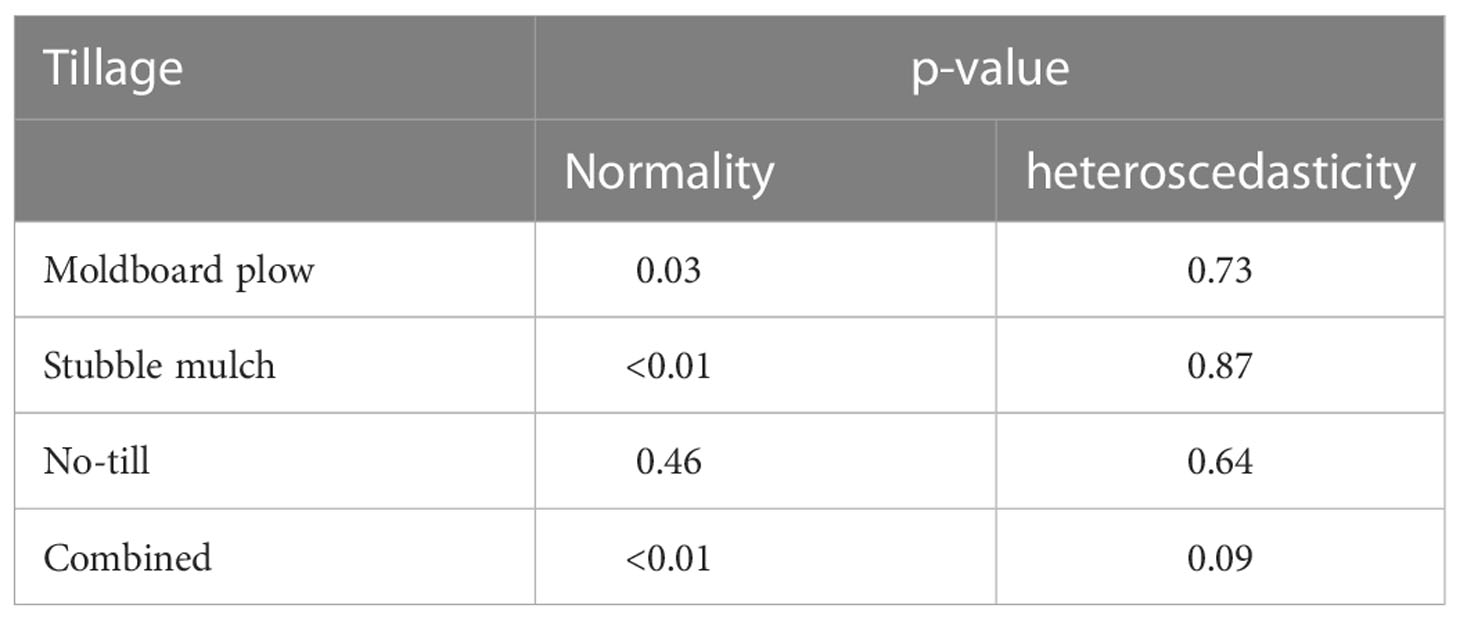
Table 1 Test for normality and heteroscedasticity (non-constant variances of the error term) in the data for the different tillage practices.
Results
The study investigated how tillage practices influenced winter wheat yield prediction with precipitation at three different periods of the growing season using feed-forward neural network and multiple linear regression approaches.
With the feed-forward neural network, winter wheat yield prediction accuracy was highest under NT. The model developed and validated under this tillage practice had an RMSE of 0.53 Mg ha-1 (Table 2). This model accounted for 81% of the variability in winter wheat grain yield (Table 2; Figure 2A). With 0.48 Mg ha-1 more RMSE, the multiple linear regression (ordinary least squares) approach was much less accurate than the neural network (Table 2). The proportion of yield variance that was accounted for by the linear regression model was 8% (Figure 3A). Further, 21.6% rRMSE reported with the neural network was 18.7% lower than the rRMSE attained with the linear regression model (Table 2).
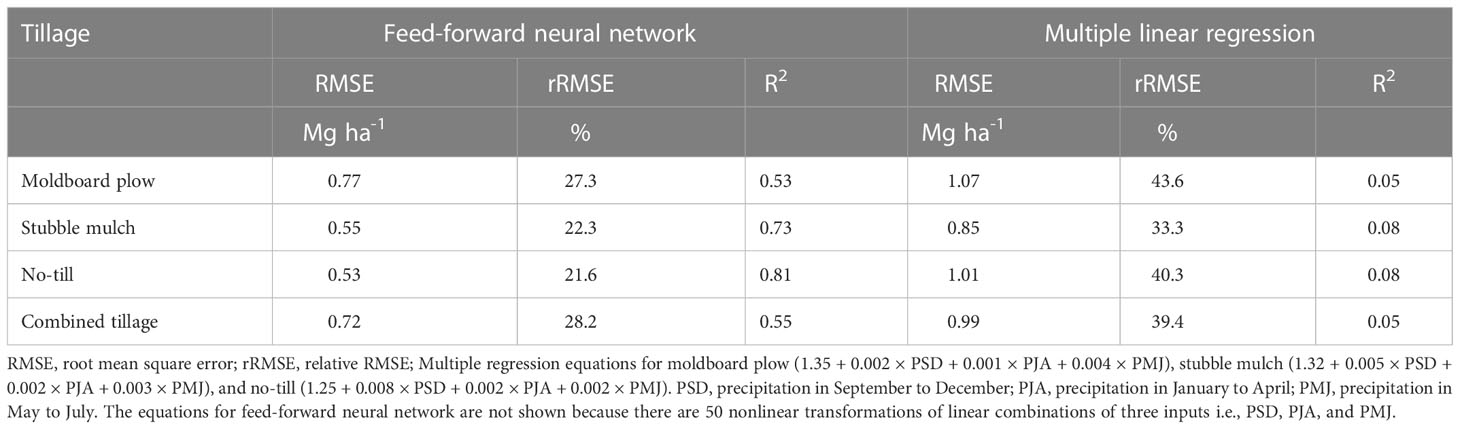
Table 2 Performance of models fit using feed-forward network and multiple linear regression on test data sets.
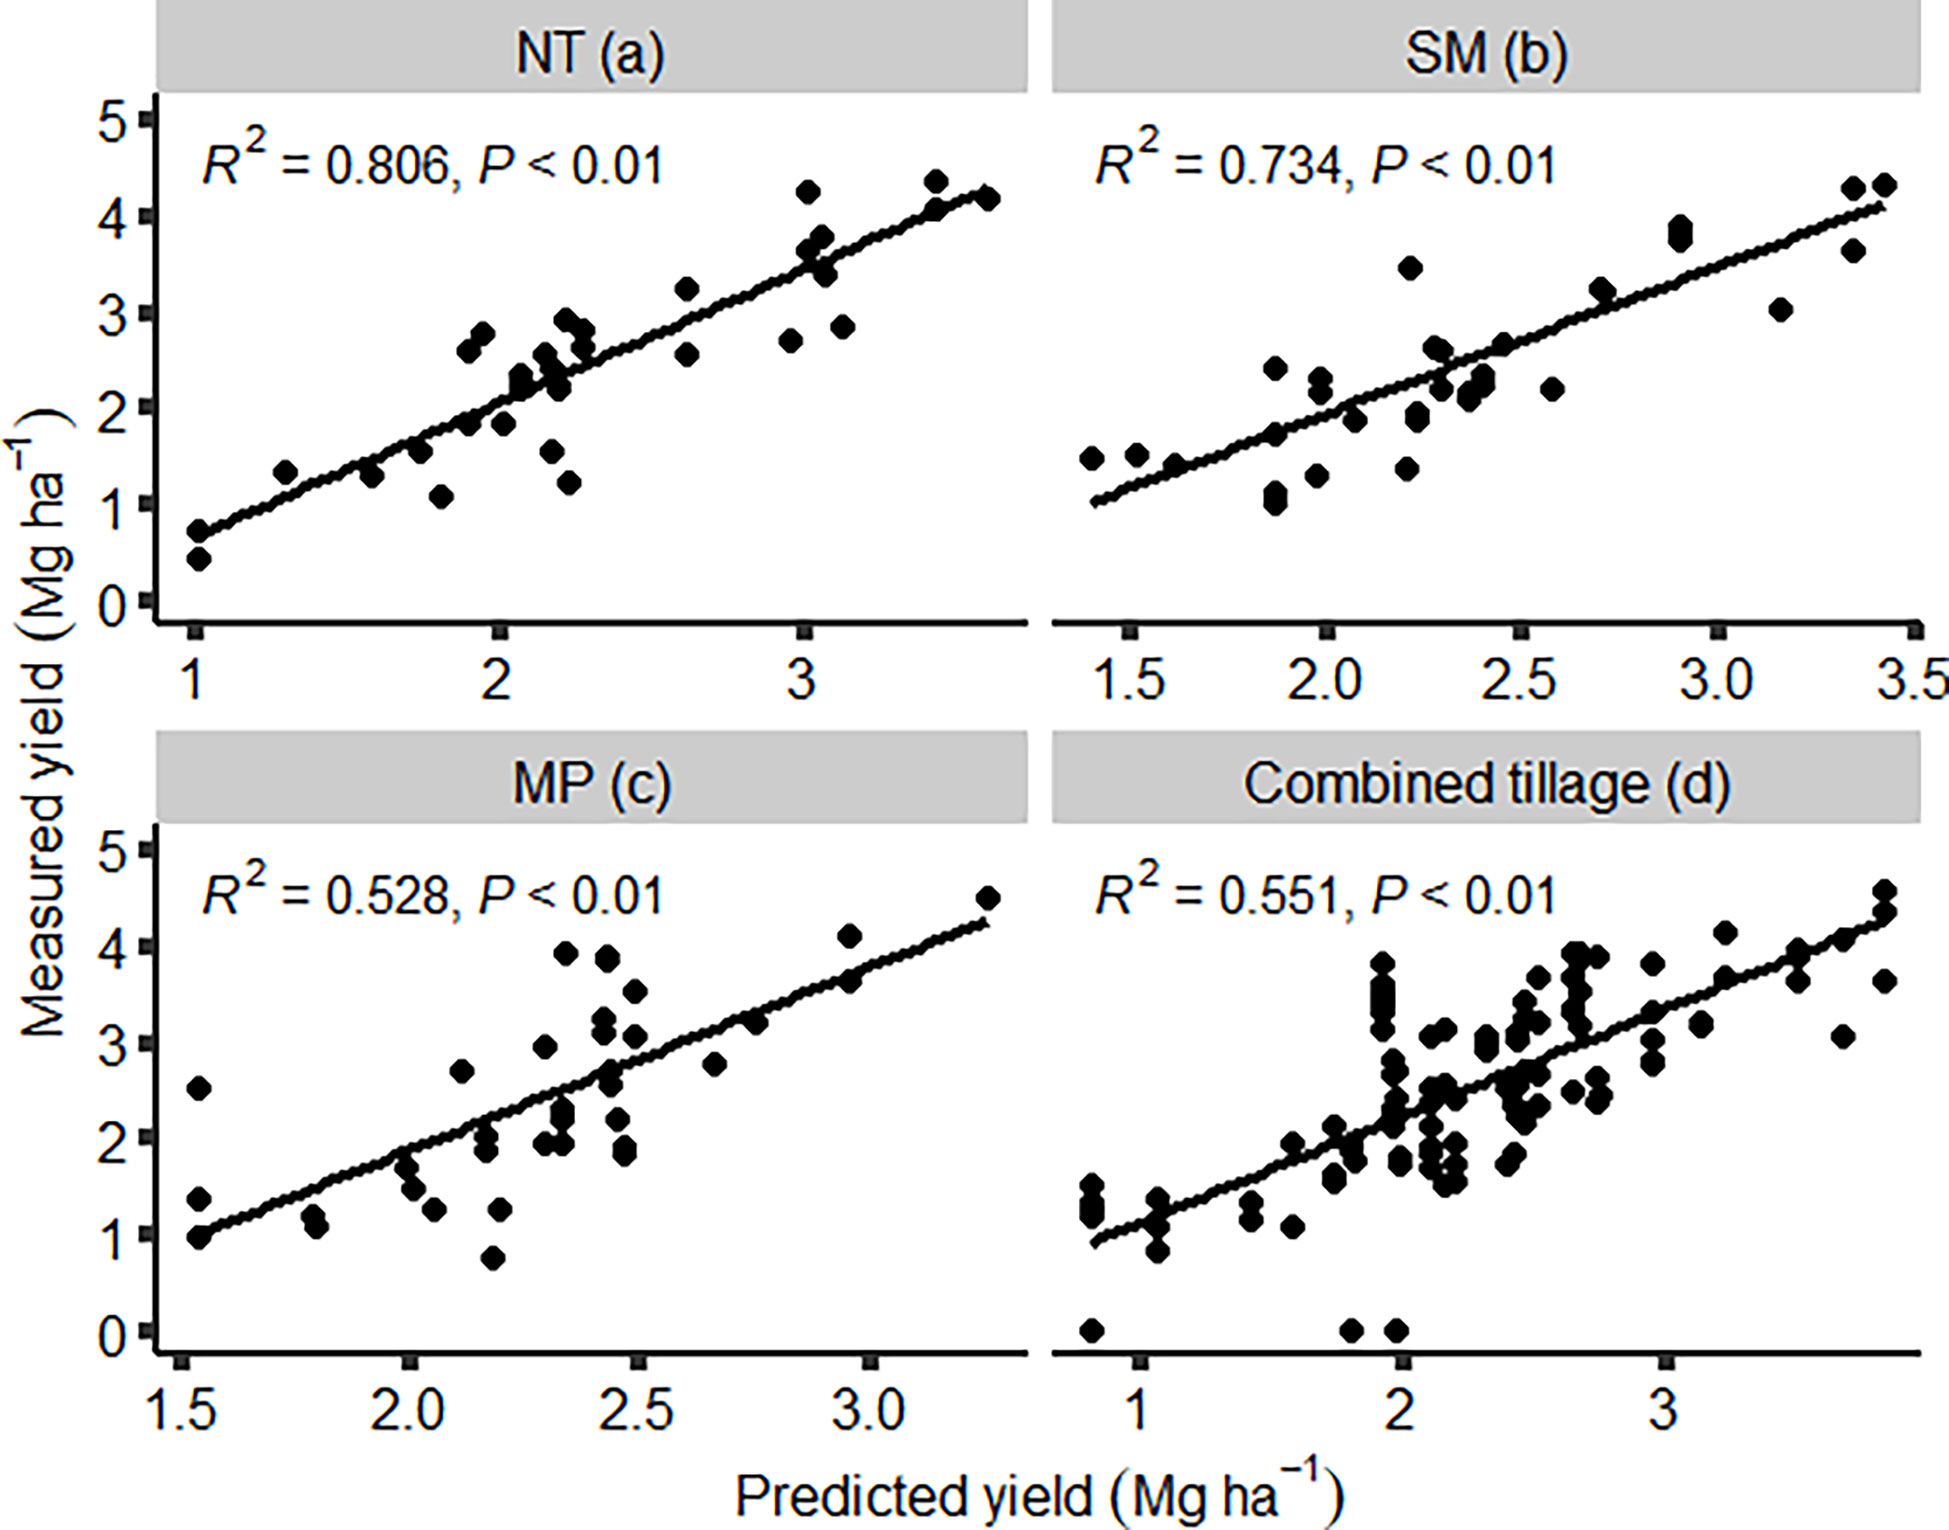
Figure 2 The relationship between predicted grain yield and measured grain yield for winter wheat. The prediction was done by fitting and validating a feed-forward neural network model under different tillage practices using precipitation received at three different periods of the season. The tillage practices were NT (A), SM (B), MP (C), and combined tillage (D). NT, no-till; SM, stubble mulch; MP, moldboard plow.
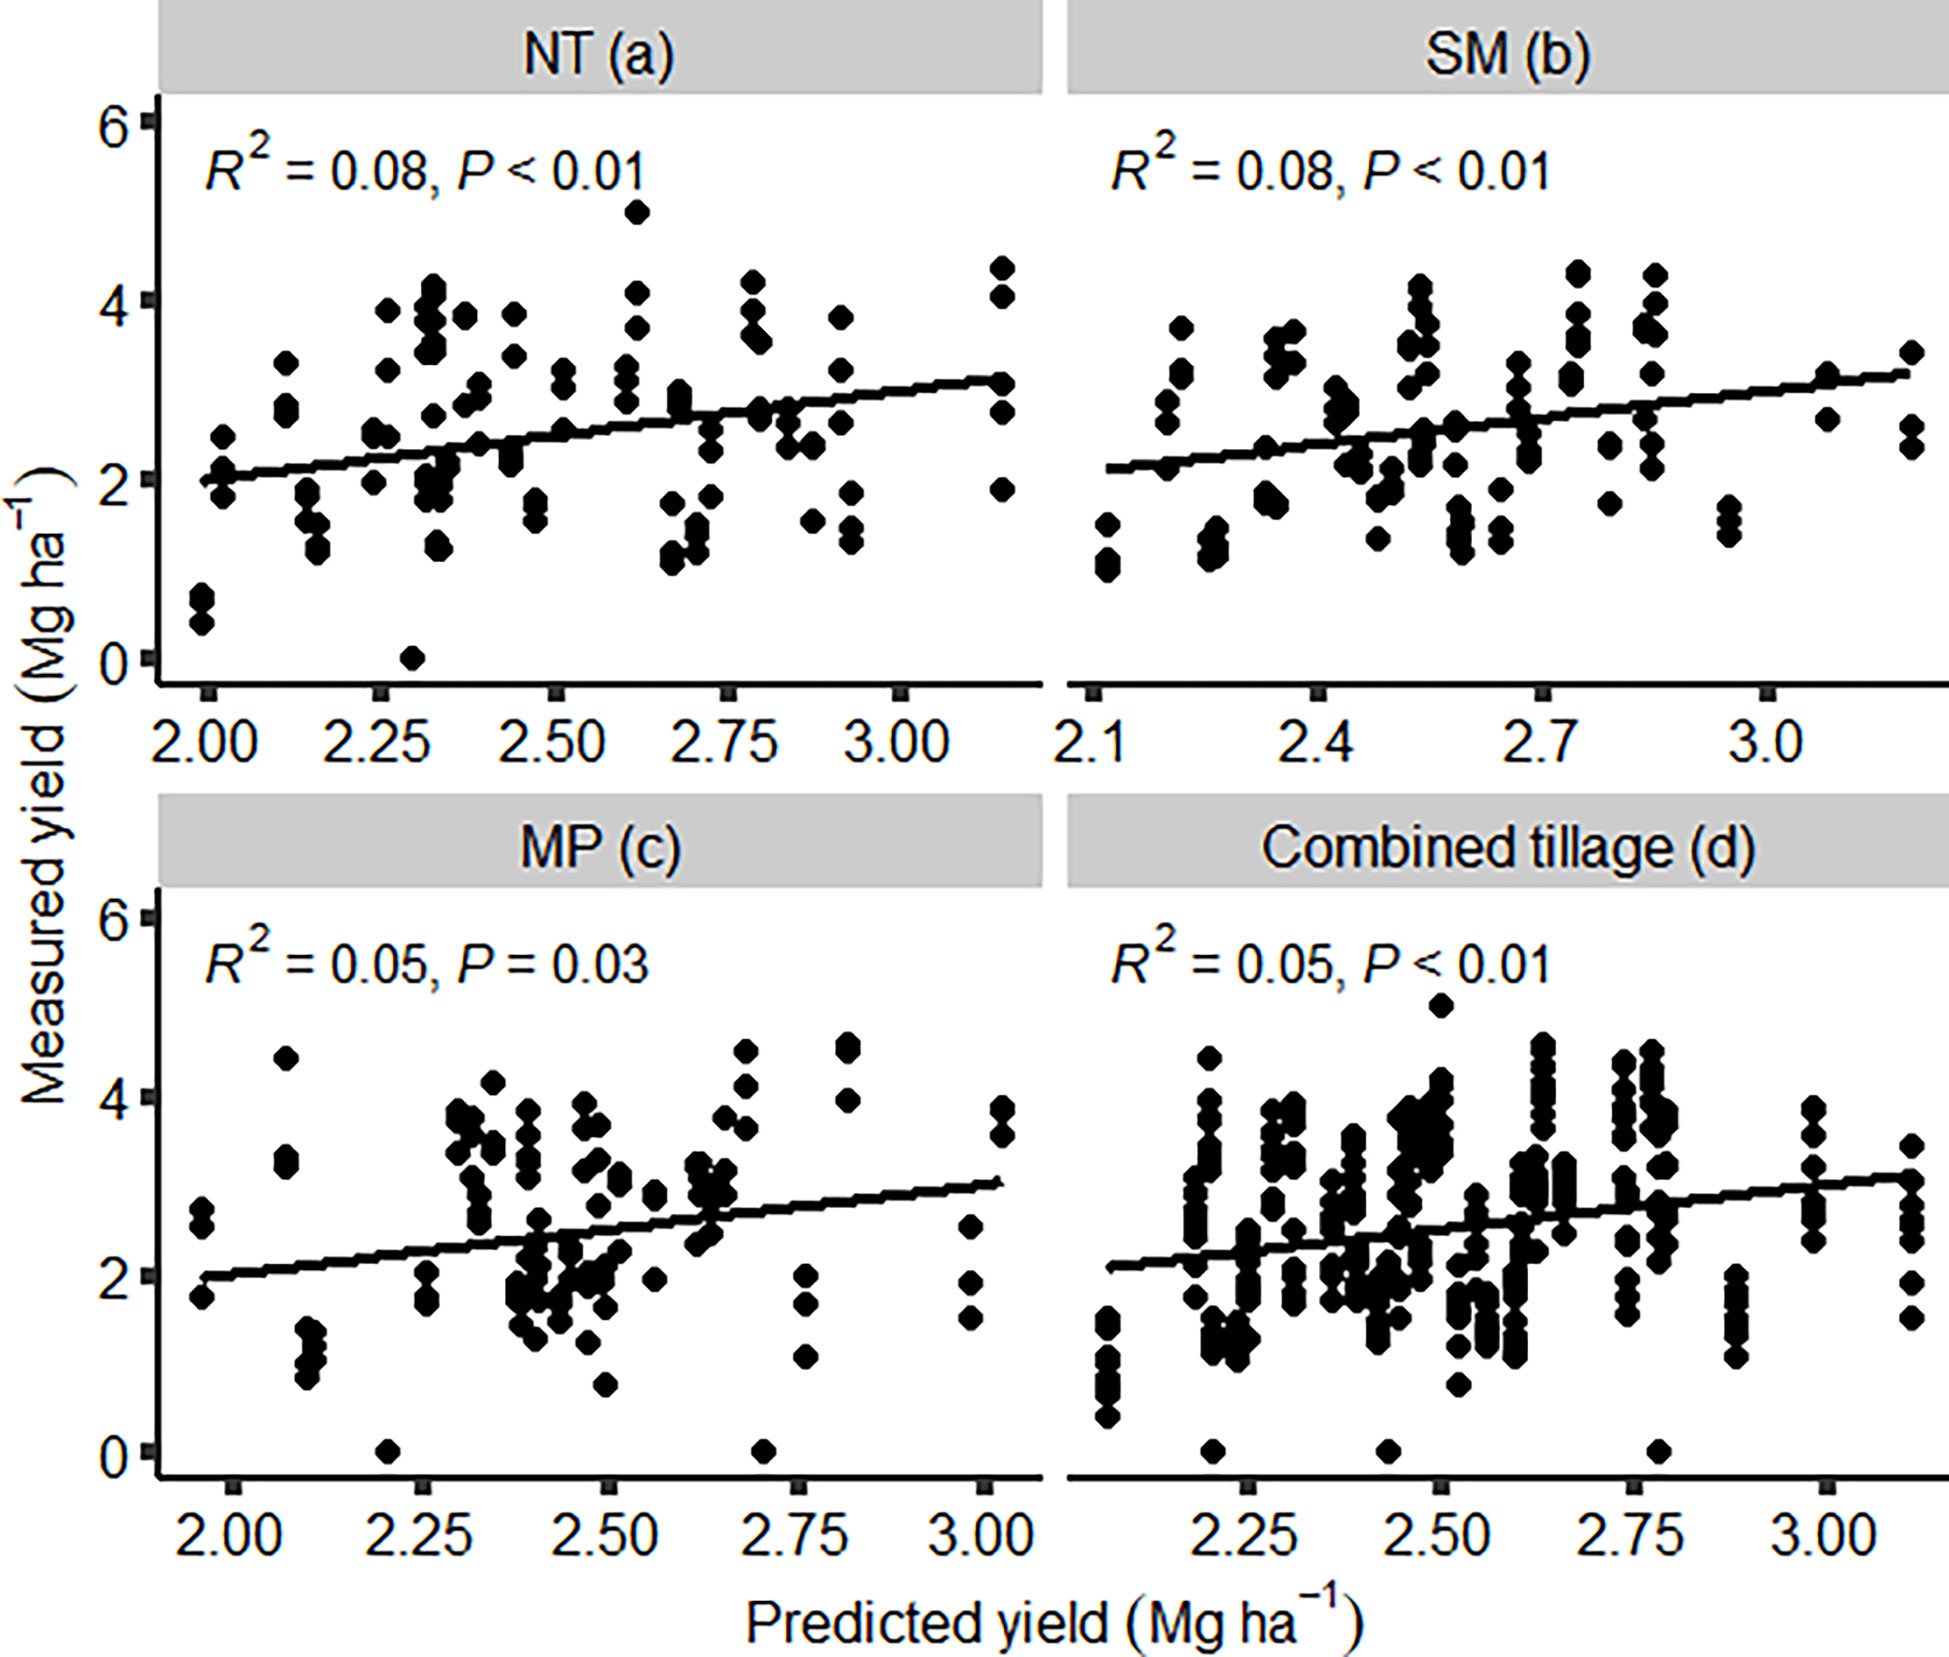
Figure 3 The relationship between predicted and measured winter wheat grain yield under different tillage practices with yield predicted using precipitation received at three different periods of the season by fitting and validating a multiple linear regression model. The tillage practices were NT (A), SM (B), MP (C), and combined tillage (D). k-fold cross-validation (k = 10) was used to evaluate model performance. NT, no-till; SM, stubble mulch; MP, moldboard plow.
Stubble mulch tillage had the second highest yield prediction accuracy with an RMSE of 0.55 Mg ha-1 and rRMSE of 22.3% (Table 2). Under this tillage practice, precipitation accounted for 73% of the variability in winter wheat grain yield (Figure 2B). With this tillage practice, yield prediction was less accurate by about 20 kg ha-1 when compared to NT neural network model. This may suggest that yield prediction under both tillage practices using precipitation may not differ drastically in their accuracies. Under the same tillage practice (SM), linear regression model applied to the same data demonstrated lower yield prediction accuracy than the feed-forward neural network model. The model was less accurate in predicting winter wheat grain yield by 0.3 Mg ha-1 than the neural network (Table 2) and explained only 8% of the variability in grain yield (Figure 3B). Additionally, the model had an rRMSE of 33.3%, illustrating that its ability to predict winter wheat grain yield is poor.
Yield prediction accuracy was lowest under MP with the feed-forward neural network model using precipitation to predict yield that was off the observed yield by 0.77 Mg ha-1 (Table 2). This was associated with an rRMSE of 27.3% (Table 2). About 53% of the variability in winter wheat grain yield was explained under this tillage system (Figure 2C). Relative to the model under SM, this represented a decrease in yield prediction accuracy since the model under MP had 0.22 Mg ha-1 more RMSE than under SM. As a result, the neural network model performed poorly in predicting grain yield under MP. Similarly, neural network model under NT resulted into more accuracy than the counterpart under MP. Under MP, neural network model had more variability in its yield prediction because of the additional 0.24 Mg ha-1 its RMSE contained compared with the NT neural network model. However, this model had more accuracy in yield prediction when compared to a model calibrated and validated using multiple linear regression. Although the neural network model predicted yield that was off the observed yield by 0.77 Mg ha-1, the linear regression model was off by an additional 0.30 Mg ha-1. The rRMSE associated with this model was 43.6%, making yield prediction under this system poor (Table 2).
When evaluated using data from all the tillage practices, feed-forward neural network explained 55% of the variability in winter wheat grain yield (Figure 2D). The model had an RMSE of 0.72 Mg ha-1, a value that differed from that of MP by 50 kg ha-1 (Table 2). The model performed poorly in predicting grain yield in years where the observed grain yield was zero (Figure 2D). This model also had a rRMSE of 28.2%, a figure close to making the model poor in predicting winter wheat yield (Table 2). This could be because zero yield was not selected by the algorithm to calibrate the model, making it perform poorly in predicting such observed yields in the test data set. This also suggests that the kind of observed data that feeds into the model calibration might influence the predictive capability of the model. Combining data under different tillage practices and using precipitation at different periods of the season as predictors did not lead to a large improvement in yield prediction accuracy under MP. This was because the difference in RMSE between of MP and combined tillage model was about 50 kg ha-1 (Figure 2D). This was reaffirmed using rRMSE where MP and combined tillage had an rRMSE value of 27.3 and 28.2% respectively (Table 2). However, the RMSE of combined tillage model was more than that of SM and NT by at least 170 kg ha-1 (Figure 2D). Fitting the multiple linear regression model to the data obtained across tillage practices, had an RMSE of 0.99 Mg ha-1 and this was higher than that of feed-forward neural network by 0.27 Mg ha-1, further illustrating the potential advantage of neural network over the linear model (Figure 3). This linear regression model was categorized as poor in its prediction of winter wheat grain yield since it had an rRMSE of 39.4%, a value higher than that of a similar model using neural network model by 11.2% (Table 2).
Discussion
Using the feed-forward neural network, yield prediction accuracy was improved under SM and NT relative to MP due to lower RMSE and high R2 values. However, normalizing the RMSE into rRMSE suggests that all models for the different tillage practices led to a fair yield prediction accuracy with a range of 21.6 to 27.3% with NT having the lowest rRMSE and MP system exhibiting the highest rRMSE. In contrast, multiple linear regression model (ordinary least squares), had an rRMSE ranging from 33.3% with NT to 43.6% with MP. This means that using ordinary least squares to predict yield using seasonal precipitation led to a poor yield prediction across the tillage practices. This was further reaffirmed by the 39.4% rRMSE for the ordinary least squares model to 28.2% rRMSE associated with the neural network model fit to the entire data sets (combined tillage). This is even though precipitation is the primary limiting factor affecting crop production under dryland cropping systems (Whitman and Meyer, 1990) where grain yield would – at least in theory – be expected to relate highly and linearly with seasonal precipitation.
The definitive reason why neural network models outperformed ordinary least squares is not fully known to us. However, neural network models may be able to detect patterns in the data in a manner that is beyond the power of ordinary least squares (Abiodun et al., 2018). James et al. (2021) highlighted the powerfulness of neural network models to detect non-linearities in the data associated with agricultural systems (Wallach et al., 2006) for an accurate prediction of a dependent variable of interest. This is possibly because of the non-linear transformation of a linear combination of inputs which allowed the neural network to detect non-linearities (James et al., 2021) in grain yield response to precipitation.
Although our study did not investigate soil fertility and health indicators, the ability of the neural network model to account for more variability in winter wheat grain yield under NT could be attributed to its unique features of conserving soil moisture, enhancing soil fertility and soil quality. In furtherance of this idea, we analyzed soil saturated hydraulic conductivity (Ksat) data collected from the same experiment modified in 2010/2011 and found that NT had the highest Ksat (3.3 cm hr-1) while MP system had 56% lower Ksat(Table 3). This means an increased quantity of precipitation water infiltrated NT system than it did with MP, potentially leading to more water stored in the soil pore spaces.
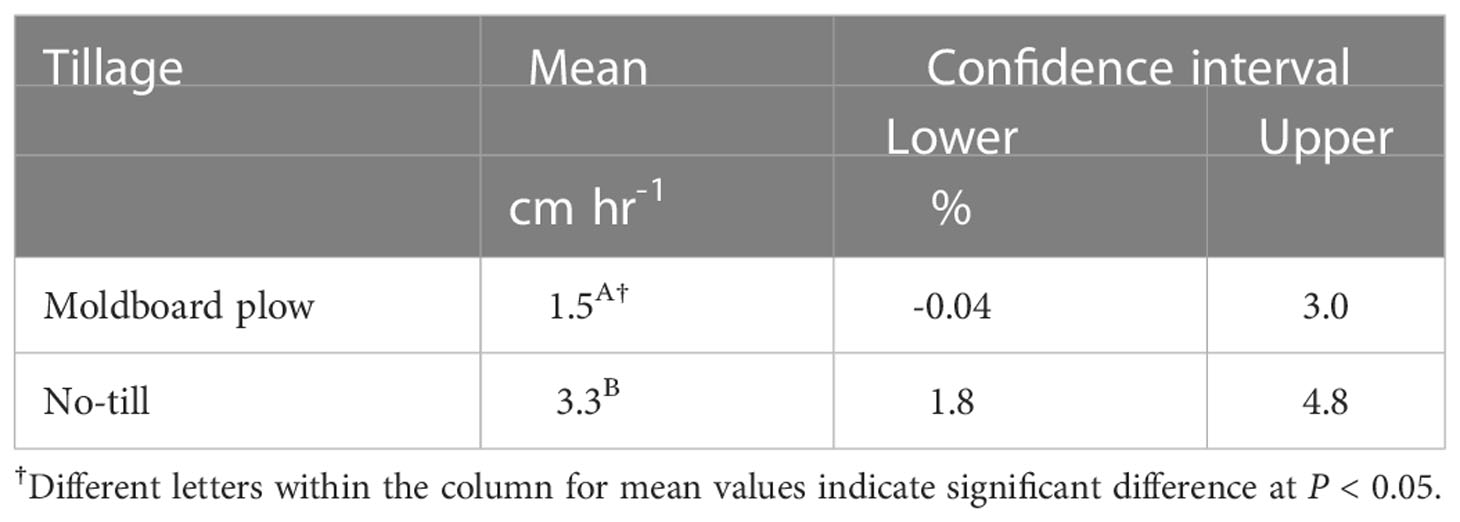
Table 3 Soil saturated hydraulic conductivity for the moldboard plow and no-till at the long-term tillage experiment (phase C) that was modified in 2010/2011 season.
This capability to explain a large proportion of the variability in winter wheat grain yield was also observed under SM system. Using a one-way disc tiller, rodweeder, blade, sweep, or chisel plow, this system cuts roots of weeds from underground to cause minimum disturbance to the soil surface and in the process, retains some standing residues on the soil surface, making it possible to sustain some of the benefits associated with NT (Fenster, 1961).
Contrastingly, plowing exposes the soil surface to the effect of wind erosion – a common problem within the study region (Lyon et al., 1998) – which may cause disintegration of soil structure allowing pore spaces to be filled with the particles disassociated from soil aggregates. This may lower the infiltration of water into the soil (Table 3) and cause some of the rainwater to be lost through evaporation (Fuentes et al., 2003; Guan et al., 2015; Ray et al., 2015). This could lower the ability of models associated with this system to account for more variability in grain yield. Neural network models under NT system may have better chances of accounting for more yield variability than MP because of improved soil structure, soil organic matter, aggregate stability, porosity, and bulk density and soil porosity (Lyon et al., 1998; Liu et al., 2015) (Shaver et al., 2002). This extra soil moisture may explain why crops are reported to transpire more and produce more photosynthates under NT and SM systems of semi-arid environment (Peng et al., 2019). Our study adds to a body of knowledge that precipitation plays a pivotal role in yield prediction (Feng et al., 2018) and high variability in climate features may increase yield variability over time (Ray et al., 2015). Other scholars have shown that soil water explained a significant portion of the variations in grain yield (Schillinger et al., 2008; Basso et al., 2009). This is an indication that practices that increase retention of water in the root zone may account for more of the variations in grain yield.
With an rRMSE rating of fair (Despotovic et al., 2016), the feed-forward neural network models could be further improved possibly by incorporating other key predictors in the model. Other artificial intelligent methods such as bagging, random forests, boosting, and/or Bayesian additive regression trees, and support vector machine could also be used to evaluate the strengths and/or weaknesses of the feed-forward neural network to predict winter wheat grain yield. As this study was done under a dryland cropping system, a different conclusion may be reached in regions that receive sufficient rainfall or supplementary irrigation.
Conclusion
The study demonstrated that feed-forward neural network model was more accurate in predicting winter wheat grain yield under NT and SM systems. This is illustrated by the larger proportions of variance accounted for under these systems, that is, 73 and 81% for SM and NT respectively when compared to 53% under MP system. This was possibly because of improved soil water storage resulting from a large proportion of water from precipitation conserved under these systems when compared to more intensive tillage systems. Nonetheless, models built and calibrated using this procedure had a fair yield prediction accuracy since the rRMSE fell within 20%<rRMSE<30%. This was in sharp contrast to the multiple linear regression (ordinary least squares) models with rRMSE of greater than 30% for all the tillage practices, indicating a poor yield prediction accuracy. A related observation was made when a single model was fit across tillage practices where neural network had an rRMSE of 28.2% and linear regression had an rRMSE of 39.4%. The capability of the feed-forward neural network model to transform a linear combination of inputs into a nonlinear combination of inputs may increase its ability to use seasonal precipitation to predict winter wheat grain yield in a manner that exceeds the power of the linear regression model, thus, increasing its ability to detect yield patterns more efficiently. The categorization of the neural network model as fair suggests that the ability of the model to accurately predict winter wheat grain yield could be improved by integrating other useful yield predictors and applying an appropriate model selection algorithm to improve its rating from fair to good or excellent. This study suggests that when using seasonal precipitation in a dryland cropping system, the tillage system applied is important for accounting for more variability in winter wheat grain yield and that the deployment of the neural network model gives an improved yield prediction accuracy than a model fit using the ordinary least squares fitting procedure.
Data availability statement
The raw data supporting the conclusions of this article will be made available by the authors, without undue reservation.
Author contributions
LA conceptualized the idea, analyzed the data, and developed a draft manuscript. CC and AE managed, supervised, and stored data from the experiment and comprehensively reviewed the manuscript. CC secured funding for continuous management of the long-term experiment and publication of this article. All authors contributed to the article and approved the submitted version.
Funding
This research was partially funded by the Nebraska Wheat Board.
Conflict of interest
The authors declare that the research was conducted in the absence of any commercial or financial relationships that could be construed as a potential conflict of interest.
Publisher’s note
All claims expressed in this article are solely those of the authors and do not necessarily represent those of their affiliated organizations, or those of the publisher, the editors and the reviewers. Any product that may be evaluated in this article, or claim that may be made by its manufacturer, is not guaranteed or endorsed by the publisher.
References
Abiodun O. I., Jantan A., Omolara A. E., Dada K. V., Mohamed N. A., Arshad H. (2018). State-of-the-art in artificial neural network applications: A survey. Heliyon 4 (11), e00938. doi: 10.1016/j.heliyon.2018.e00938
Allaire J., Chollet F. (2022) Keras: R interface to 'Keras' (Version 2.7.0). Available at: https://CRAN.R-project.org/package=keras.
Aphalo P. J. (2021) Ggpmisc: Miscellaneous extensions to 'ggplot2' (Version 0.4.5). Available at: https://CRAN.R-project.org/package=ggpmisc.
Aula L., Omara P., Nambi E., Oyebiyi F. B., Dhillon J., Eickhoff E., et al. (2021). Active optical sensor measurements and weather variables for predicting winter wheat yield. Agron. J. 113 (3), 2742–2751. doi: 10.1002/agj2.20620
Barrett C. B. (2021). Overcoming global food security challenges through science and solidarity. Am. J. Agric. Econ. 103 (2), 422–447. doi: 10.1111/ajae.12160
Basso B., Cammarano D., Chen D., Cafiero G., Amato M., Bitella G., et al. (2009). Landscape position and precipitation effects on spatial variability of wheat yield and grain protein in southern Italy. J. Agron. Crop Sci. 195 (4), 301–312. doi: 10.1111/j.1439-037X.2008.00351.x
Bates D., Maechler M., Bolker B., Walker S., Raun B. (2015). Fitting linear mixed-effects models using lme4. J. Stat. Software. 67 (1), 1–48. doi: 10.18637/jss.v067.i01
Camara K., Payne W., Rasmussen P. (2003). Long-term effects of tillage, nitrogen, and rainfall on winter wheat yields in the pacific Northwest. Agron. J. 95 (4), 828–835. doi: 10.2134/agronj2003.8280
Colaço A., Bramley R. (2019). Site–year characteristics have a critical impact on crop sensor calibrations for nitrogen recommendations. Agron. J. 111 (4), 2047–2059. doi: 10.2134/agronj2018.11.0726
Dahnke W., Swenson L., Goos R. J., Leholm A. (1988). Choosing a crop yield goal (Fargo, ND: NDSU Extension Service). Available at: https://library.ndsu.edu/ir/bitstream/handle/10365/17617/SF-822-1988.PDF?sequence=2.
Despotovic M., Nedic V., Despotovic D., Cvetanovic S. (2016). Evaluation of empirical models for predicting monthly mean horizontal diffuse solar radiation. Renewable Sustain. Energy Rev. 56, 246–260. doi: 10.1016/j.rser.2015.11.058
Dhillon J. S., Eickhoff E., Mullen R., Raun W. R. (2019). World potassium use efficiency in cereal crops. Agron. J. 111 (2), 889–896. doi: 10.2134/agronj2018.07.0462
Eyduran E. (2020) ehaGoF: Calculates goodness of fit statistics (Version 0.1.1). Available at: https://CRAN.R-project.org/package=ehaGoF.
Feng P., Wang B., Liu D. L., Xing H., Ji F., Macadam I., et al. (2018). Impacts of rainfall extremes on wheat yield in semi-arid cropping systems in eastern Australia. Clim. Change 147 (3), 555–569. doi: 10.1007/s10584-018-2170-x
Fenster C. R. (1961). Stubble mulching with various types of machinery. Soil Sci. Soc. America J. 24 (6), 518–523. doi: 10.2136/sssaj1960.03615995002400060030x
Fenster C., Peterson G. (1979) Effects of no-tillage fallow as compared to conventional tillage in a wheat-fallow system. Available at: https://digitalcommons.unl.edu/ardhistrb/137/.
Filippi P., Jones E. J., Wimalathunge N. S., Somarathna P. D., Pozza L. E., Ugbaje S. U., et al. (2019). An approach to forecast grain crop yield using multi-layered, multi-farm data sets and machine learning. Precis. Agric. 20 (5), 1015–1029. doi: 10.1007/s11119-018-09628-4
Fuentes J. P., Flury M., Huggins D. R., Bezdicek D. F. (2003). Soil water and nitrogen dynamics in dryland cropping systems of Washington state, USA. Soil Tillage. Res. 71 (1), 33–47. doi: 10.1016/S0167-1987(02)00161-7
Gómez D., Salvador P., Sanz J., Casanova J. L. (2021). Modelling wheat yield with antecedent information, satellite and climate data using machine learning methods in Mexico. Agric. For. Meteorol. 300, 108317. doi: 10.1016/j.agrformet.2020.108317
Guan D., Zhang Y., Al-Kaisi M. M., Wang Q., Zhang M., Li Z. (2015). Tillage practices effect on root distribution and water use efficiency of winter wheat under rain-fed condition in the north China plain. Soil Tillage. Res. 146, 286–295. doi: 10.1016/j.still.2014.09.016
Hatfield J. L., Dold C. (2018). Agroclimatology and wheat production: coping with climate change. Front. Plant Sci. 9. doi: 10.3389/fpls.2018.00224
Hothorn T., Bretz F., Westfall P. (2008). Simultaneous inference in general parametric models. Biometrical. J. 50 (3), 346–363. doi: 10.1002/bimj.200810425
James G., Witten D., Hastie T., Tibshirani R. (2021). An introduction to statistical learning (2 ed.) (New York, NY: Springer).
Kamir E., Waldner F., Hochman Z. (2020). Estimating wheat yields in Australia using climate records, satellite image time series and machine learning methods. ISPRS. J. Photogramm. Remote Sens. 160, 124–135. doi: 10.1016/j.isprsjprs.2019.11.008
Khodayar M., Khodayar M. E., Jalali S. M. J. (2021). Deep learning for pattern recognition of photovoltaic energy generation. Electricity. J. 34 (1), 106882. doi: 10.1016/j.tej.2020.106882
Kuhn M. (2022) _caret: Classification and regression training_ (Version 6.0-93). Available at: https://CRAN.R-project.org/package=caret.
Lenth R. V. (2022) Emmeans: Estimated marginal means, aka least-squares means (Version 1.8.0). Available at: https://CRAN.R-project.org/package=emmeans.
Liu E., Chen B., Yan C., Zhang Y., Mei X., Wang J. (2015). Seasonal changes and vertical distributions of soil organic carbon pools under conventional and no-till practices on loess plateau in China. Soil Sci. Soc. America J. 79 (2), 517–526. doi: 10.2136/sssaj2014.02.0069
Lyon D. J., Stroup W. W., Brown R. E. (1998). Crop production and soil water storage in long-term winter wheat–fallow tillage experiments. Soil Tillage. Res. 49 (1-2), 19–27. doi: 10.1016/S0167-1987(98)00151-2
Marszalek M., Körner M., Schmidhalter U. (2022). Prediction of multi-year winter wheat yields at the field level with satellite and climatological data. Comput. Electron. Agric. 194, 106777. doi: 10.1016/j.compag.2022.106777
Nielsen D. C., Vigil M. F. (2010). Precipitation storage efficiency during fallow in wheat-fallow systems. Agron. J. 102, 537–543. doi: 10.2134/agronj2009.0348
Omara P., Aula L., Dhillon J. S., Oyebiyi F., Eickhoff E. M., Nambi E., et al. (2020). Variability in winter wheat (Triticum aestivum l.) grain yield response to nitrogen fertilization in long-term experiments. Commun. Soil Sci. Plant Anal. 51 (3), 403–412. doi: 10.1080/00103624.2019.1709489
Peng Z., Wang L., Xie J., Li L., Coulter J. A., Zhang R., et al. (2019). Conservation tillage increases water use efficiency of spring wheat by optimizing water transfer in a semi-arid environment. Agronomy 9 (10), 583. doi: 10.3390/agronomy9100583
Peterson G., Lyon D., Fenster C. (2012). Valuing long-term field experiments: Quantifying the scientific contribution of a long-term tillage experiment. Soil Sci. Soc. America J. 76 (3), 757–765. doi: 10.2136/sssaj2011.0413
Raun W. R., Solie J. B., Johnson G. V., Stone M. L., Lukina E. V., Thomason W. E., et al. (2001). In-season prediction of potential grain yield in winter wheat using canopy reflectance. Agron. J. 93 (1), 131–138. doi: 10.2134/agronj2001.931131x
Raun W. R., Solie J. B., Johnson G. V., Stone M. L., Mullen R. W., Freeman K. W., et al. (2002). Improving nitrogen use efficiency in cereal grain production with optical sensing and variable rate application. Agron. J. 94 (4), 815–820. doi: 10.2134/agronj2002.8150
Ray D. K., Gerber J. S., MacDonald G. K., West P. C. (2015). Climate variation explains a third of global crop yield variability. Nat. Commun. 6 (1), 1–9. doi: 10.1038/ncomms6989
R Core Team (2022). R: A language and environment for statistical computing (Version r 4.1.3) (Vienna, Austria: R Foundation for Statistical Computing). Available at: https://www.R-project.org/.
RStudio Team (2022). RStudio: Integrated development environment for r (Version 2022.07.1+554) (Boston, MA: RStudio, PBC). Available at: http://www.rstudio.com/.
Schillinger W. F., Schofstoll S. E., Alldredge J. R. (2008). Available water and wheat grain yield relations in a Mediterranean climate. Field Crops Res. 109 (1-3), 45–49. doi: 10.1016/j.fcr.2008.06.008
Shaver T., Peterson G., Ahuja L., Westfall D., Sherrod L., Dunn G. (2002). Surface soil physical properties after twelve years of dryland no-till management. Soil Sci. Soc. America J. 66 (4), 1296–1303. doi: 10.2136/sssaj2002.1296
Shiferaw B., Smale M., Braun H.-J., Duveiller E., Reynolds M., Muricho G. (2013). Crops that feed the world 10. past successes and future challenges to the role played by wheat in global food security. Food Secur. 5 (3), 291–317. doi: 10.1007/s12571-013-0263-y
Soil Survey Staff, Natural Resources Conservation Service, United States Department of Agriculture (2022) Web soil survey. Available at: http://websoilsurvey.sc.egov.usda.gov/.
Tanaka D., Anderson R. (1997). Soil water storage and precipitation storage efficiency of conservation tillage systems. J. Soil Water Conserv. 52 (5), 363–367.
Tang X., Liu H., Feng D., Zhang W., Chang J., Li L., et al. (2022). Prediction of field winter wheat yield using fewer parameters at middle growth stage by linear regression and the BP neural network method. Eur. J. Agron. 141, 126621. doi: 10.1016/j.eja.2022.126621
Wallach D., Makowski D., Jones J. W., Brun F. (2006). Working with dynamic crop models: methods, tools and examples for agriculture and environment (2 ed.) (London, UK; Waltham, MA, USA; San Diego, CA, USA: Academic Press).
Whitman C., Meyer R. (1990). “Strategies for increasing the productivity and stability of dryland farming systems,” in Advances in soil science (London, UK; Waltham, MA, USA; San Diego, CA, USA: Springer), 347–358.
Wickham H., Averick M., Bryan J., Chang W., McGowan L. D. A., François R., et al. (2019). Welcome to the tidyverse. J. Open Source Software. 4 (43), 1686. doi: 10.21105/joss.01686
Wickham H., Bryan J. (2019) Readxl: Read excel files (Version 1.3.1). Available at: https://CRAN.R-project.org/package=readxl.
Yu Q., Li L., Luo Q., Eamus D., Xu S., Chen C., et al. (2014). Year patterns of climate impact on wheat yields. Int. J. Climatol. 34 (2), 518–528. doi: 10.1002/joc.3704
Yunus K., Polat N. (2022). A linear approach for wheat yield prediction by using different spectral vegetation indices. Int. J. Eng. Geosci. 8 (1), 52–62. doi: 10.26833/ijeg.1035037
Keywords: yield prediction accuracy, tillage practices, precipitation, winter wheat, feed-forward neural network, multiple linear regression, relative root mean squared error
Citation: Aula L, Easterly AC and Creech CF (2023) Tillage practices influence winter wheat grain yield prediction using seasonal precipitation. Front. Agron. 5:1067371. doi: 10.3389/fagro.2023.1067371
Received: 11 October 2022; Accepted: 24 January 2023;
Published: 06 February 2023.
Edited by:
Stéphane Cordeau, INRA UMR1347 Agroécologie, FranceReviewed by:
Daniel Plaza-Bonilla, Universitat de Lleida, SpainShicheng Yan, Lanzhou University, China
Copyright © 2023 Aula, Easterly and Creech. This is an open-access article distributed under the terms of the Creative Commons Attribution License (CC BY). The use, distribution or reproduction in other forums is permitted, provided the original author(s) and the copyright owner(s) are credited and that the original publication in this journal is cited, in accordance with accepted academic practice. No use, distribution or reproduction is permitted which does not comply with these terms.
*Correspondence: Cody F. Creech, Y2NyZWVjaDJAdW5sLmVkdQ==