 Xuan Xu
 Jiaqi Wang1
 Xiang-Yu Meng
95% of researchers rate our articles as excellent or good
Learn more about the work of our research integrity team to safeguard the quality of each article we publish.
Find out more
ORIGINAL RESEARCH article
Front. Aging Neurosci. , 13 February 2025
Sec. Alzheimer's Disease and Related Dementias
Volume 17 - 2025 | https://doi.org/10.3389/fnagi.2025.1536142
This article is part of the Research Topic Advancing therapeutics for Alzheimer's disease and related dementias through multi-omics data analysis in ethnically diverse populations View all 4 articles
Introduction: Alzheimer’s disease (AD) and glioblastoma (GBM) are severe neurological disorders that pose significant global healthcare challenges. Despite extensive research, the molecular mechanisms, particularly those involving mitochondrial dysfunction, remain poorly understood. A major limitation in current studies is the lack of cell-specific markers that effectively represent mitochondrial dynamics in AD and GBM.
Methods: In this study, we analyzed single-cell transcriptomic data using 10 machine learning algorithms to identify mitochondria-associated cell-specific markers. We validated these markers through the integration of gene expression and methylation data across diverse cell types. Our dataset comprised single-nucleus RNA sequencing (snRNA-seq) from AD patients, single-cell RNA sequencing (scRNA-seq) from GBM patients, and additional DNA methylation and transcriptomic data from the ROSMAP, ADNI, TCGA, and CGGA cohorts.
Results: Our analysis identified four significant cross-disease mitochondrial markers: EFHD1, SASH1, FAM110B, and SLC25A18. These markers showed both shared and unique expression profiles in AD and GBM, suggesting a common mitochondrial mechanism contributing to both diseases. Additionally, oligodendrocytes and their interactions with astrocytes were implicated in disease progression, particularly through the APP signaling pathway. Key hub genes, such as HS6ST3 and TUBB2B, were identified across different cellular subpopulations, highlighting a cell-specific co-expression network linked to mitochondrial function.
Alzheimer’s disease (AD) and glioblastoma (GBM) are major neurological disorders that impact the brain’s cellular networks in distinct but complex ways. AD, the most prevalent form of dementia, is characterized by progressive cognitive decline, while GBM is an aggressive brain tumor noted for rapid growth and resistance to conventional therapies (Scheltens et al., 2021; Price et al., 2024). Interestingly, there is a significant overlap between these conditions, particularly among older adults. Approximately 42% of GBM patients aged 60–82 display AD-related pathology, suggesting potential shared pathological mechanisms (Xia et al., 2023). Epidemiological evidence indicates an inverse correlation between AD and GBM, but their co-occurrence can substantially affect disease progression and treatment outcomes (Lanni et al., 2021). Animal models have further demonstrated that the presence of AD pathology influences GBM tumor growth, disease progression, and immune responses (Broekman et al., 2018). This supports the hypothesis that AD and GBM may share underlying etiological factors, possibly linked to protein misfolding or biochemical changes characteristic of dementia (Lehrer, 2010; Sánchez-Valle et al., 2017). These findings highlight the importance of assessing cognitive status and AD pathology in elderly GBM patients, as it may inform treatment strategies, particularly in the context of radiotherapy (Shi and Huang, 2023; Fetcko-Fayad et al., 2024). Further investigation is warranted to uncover the underlying mechanisms and shared pathways between these two devastating neurological conditions.
Mitochondrial dysfunction is a critical feature of both AD and GBM. In AD, mitochondrial impairment is a hallmark that drives neuronal death and cognitive decline (Calvo-Rodriguez and Bacskai, 2021). Mitochondrial dysfunction in AD leads to reduced energy production, increased oxidative stress, and compromised mitochondrial dynamics, thereby impairing cellular quality control and exacerbating neuronal damage (Ebanks et al., 2020). These findings suggest that strategies to improve mitochondrial function and mitigate oxidative stress may benefit AD patients. Conversely, in GBM, mitochondria play a key role in supporting the high metabolic demands of rapidly proliferating tumor cells (Thakur et al., 2022). GBM cells reprogram their metabolism to enhance mitochondrial respiration and can acquire mitochondria from neighboring healthy cells, thereby boosting their tumor-forming potential (Zhang et al., 2023b). This metabolic reprogramming and mitochondrial hijacking represent promising therapeutic targets, with emerging drugs that inhibit mitochondrial apoptosis and mitophagy showing potential efficacy in GBM treatment. Despite considerable research, a comprehensive understanding of the mitochondrial mechanisms underpinning AD and GBM remains elusive. The advent of single-cell RNA sequencing (scRNA-seq) has opened new avenues for investigating cellular heterogeneity, offering unprecedented insight into disease progression at a cellular level (Lin P. et al., 2024). However, the full potential of scRNA-seq to elucidate mitochondrial functions in AD and GBM has yet to be realized (Wang et al., 2022).
This study aims to address this gap by utilizing scRNA-seq data combined with machine learning algorithms to identify mitochondrial-related biomarkers with differential expression across diverse cell types in AD and GBM. By integrating scRNA-seq with epigenetic and transcriptomic analyses, we aim to elucidate the regulatory mechanisms governing mitochondrial gene expression, thereby providing a more comprehensive view of their roles across various cellular contexts. The application of machine learning to multi-omics data offers a powerful framework to dissect the intricate relationships between mitochondrial function and cellular identity (Baysoy et al., 2023). This dual-pronged approach is expected to reveal novel biomarkers and regulatory pathways that traditional bulk tissue analyses may have overlooked (Zhu et al., 2020). By identifying cell type-specific mitochondrial signatures, our research seeks to refine our understanding of AD and GBM, potentially uncovering new therapeutic targets.
In summary, this study addresses a significant gap in our understanding of AD and GBM by focusing on the mitochondrial mechanisms central to both diseases. Despite extensive research, there remains an incomplete understanding of the cellular and molecular underpinnings of these conditions, particularly regarding mitochondrial function. Our approach integrates scRNA-seq data with machine learning algorithms to identify cell-specific mitochondrial markers across distinct cellular subpopulations. Notably, our findings have highlighted the potential involvement of genes linked to mitochondrial epistasis and localization, which may play pivotal roles in the pathogenesis of AD and GBM. By advancing our understanding of mitochondrial contributions to these diseases, we hope this work will guide the development of more targeted and effective therapies for AD and GBM patients. A detailed description of our methodology and the analysis process is presented in Figure 1.
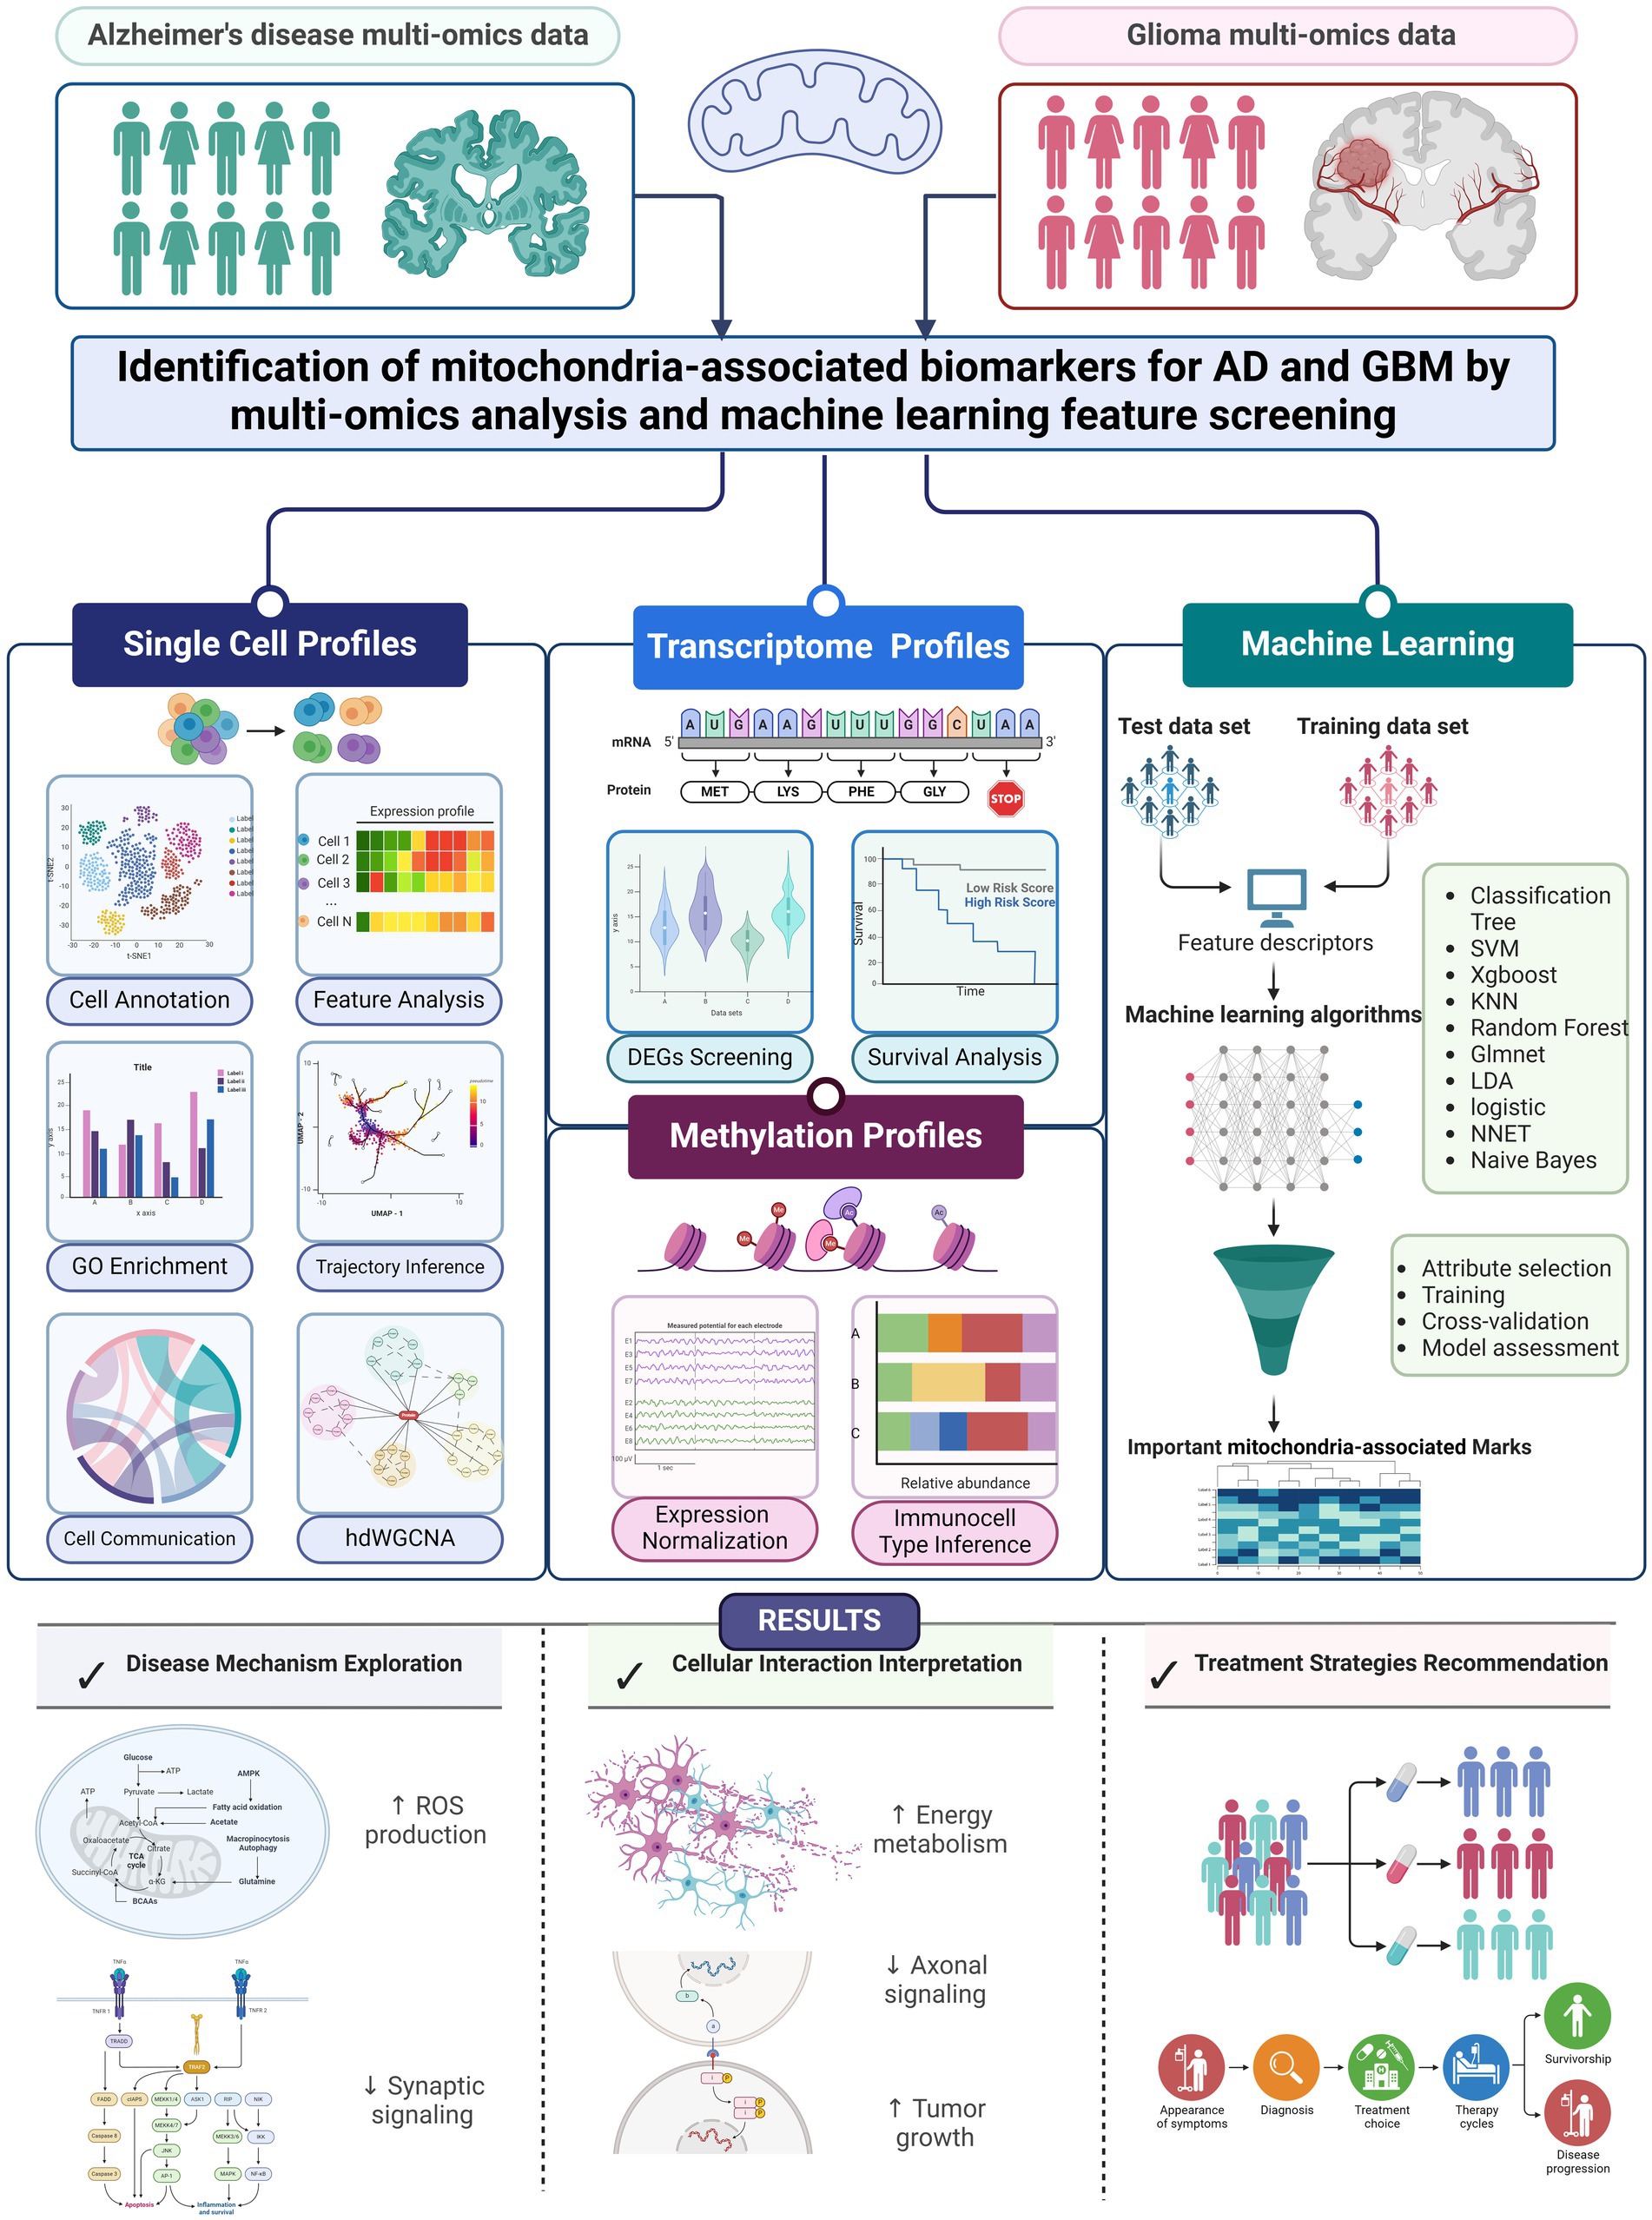
Figure 1. Workflow of unveiling mitochondrial mechanisms in AD and GBM through single-cell transcriptomics and machine learning analysis. Our research aims to bridge gaps in our understanding of Alzheimer’s Disease (AD) and Glioblastoma Multiforme (GBM) by employing single-cell RNA sequencing (scRNA-seq) alongside machine learning techniques. Our approach focuses on identifying biomarkers that exhibit varying expression levels across different types of cells in these conditions. We aimed to find mitochondrial biomarkers for both diseases using 10 machine learning methods, adding to scientific knowledge. Our study used multi-omics data, including RNA sequencing from brain samples of people with AD (n = 48) and from GBM patients (n = 16). We also included DNA methylation and transcriptome data from large studies. Data access was provided by four major studies: ADNI, ROSMAP, TCGA, and CGGA. We also used data from the GEO database. Informed consent was obtained from all participants, ensuring ethical standards and privacy protection. We performed a step-by-step bioinformatics process that included data normalization, correcting for batch effects, and analyzing gene expression differences. We also used a machine learning system with 10 different algorithms to identify key biomarkers. These algorithms helped us find important biomarkers related to mitochondria. This comprehensive analysis will elucidate the expression patterns and functions of these genes across different cell types. The integration of machine learning with genomic data provides a robust approach for exploring the complex interplay between mitochondrial function and cell identity. This dual-pronged strategy aims to uncover novel biomarkers and regulatory mechanisms, potentially obscured by traditional bulk tissue analysis methods. Our research will identify specific mitochondrial patterns associated with various cell types, providing a nuanced perspective on AD and GBM. This could open up new possibilities for targeted treatments.
In our research, the objective was to delve into a primary exploration of the possible connections between AD and GBM through a multi-omics lens, with a specific emphasis on mechanisms related to mitochondria. It was our intention to detect potential mitochondrial biomarkers for both conditions by employing a set of 10 machine learning techniques, with the aspiration to augment the current repository of scientific knowledge. The multi-omics data framework for our study encompassed Single-nucleus RNA sequencing (snRNA-seq) profiles from the prefrontal cortex of individuals exhibiting high and low AD pathology (n = 48), along with Single-cell RNA sequencing (scRNA-seq) from GBM patients and control samples (n = 16). This was complemented by DNA methylation data and comprehensive transcriptome information (ROSMAP: n = 740, ADNI: n = 1,706, TCGA: n = 159, CGGA: n = 151). The characteristics of the cohorts for ADNI, ROSMAP, TCGA and CGGA transcriptome and methylation data are listed in Supplementary Table S1. Access to this data was facilitated through the contributions of four esteemed cohort studies: the Alzheimer’s Disease Neuroimaging Initiative (ADNI) (Petersen et al., 2010), the Religious Orders Study and Memory and Aging Project (ROSMAP) (Bennett et al., 2018), which primarily include participants with sporadic late-onset Alzheimer’s Disease (AD); The Cancer Genome Atlas (TCGA),1 and the Chinese Glioma Genome Atlas (CGGA)2 (Zhao et al., 2021), both of which focus on providing a comprehensive genomic characterization of cancers, emphasizing sporadic cases to capture broader population trends. Additionally, we incorporated datasets from the Gene Expression Omnibus (GEO) series GSE138794 (Wang et al., 2019) and GSE162631 (Xie et al., 2021). For all participants included from the aforementioned studies, informed consents were secured, with unwavering commitment to ethical conduct and the protection of privacy and consent integrity. To bolster the thoroughness of our analytical approach, we engineered a sequential bioinformatics pipeline. This pipeline was designed to encompass processes such as data normalization, correction for batch effects, cellular deconvolution, and the analysis of differential expression. Further, we engaged an integrative machine learning framework, comprising 10 distinct algorithms: Classification Tree, Support Vector Machine (SVM), Xgboost, K-Nearest Neighbors (KNN), Random Forest, Glmnet, Linear Discriminant Analysis (LDA), logistic regression, Neural Networks (NNET), and Naive Bayes. This diverse set of algorithms was utilized to pinpoint significant biomarkers associated with mitochondrial functions.
For AD samples, post-mortem brain specimens were secured from 48 subjects who participated in the Religious Order Study (ROS) or the Rush Memory and Aging Project (MAP), renowned for their extensive research on aging and dementia. Data aggregation in ROSMAP encompassed clinical records, meticulous post-mortem evaluations, and intricate molecular analysis of the brain tissues. Among these participants, a subset of 24 exhibited high β-amyloid levels alongside AD pathological indicators, while the remaining 24 demonstrated negligible or no β-amyloid presence or related pathological traits. The prefrontal cortex, specifically Brodmann area 10, which is known for its role in cognitive functions often affected by AD, was examined for each subject. Immunohistochemistry confirmed the presence of β-amyloid, and microscopic examinations indicated that the integrity of nuclei in AD-affected samples was comparable to those without pathology. This research resulted in an extensive collection of 80,660 snRNA-seq profiles.
Regarding the GSE138794 context, surgical glioma tissues and peripheral blood were collected from patients who underwent operations at UCSF, with proper Institutional Review Board approval and informed consent. Tissue processing for single-cell RNA sequencing (scRNA-seq) followed a standardized protocol. Fresh tissue was subjected to mechanical and enzymatic dissociation using papain in a DNase I-containing solution, followed by filtration and resuspension in PBS. For frozen tissue, nuclei extraction followed the “Frakenstein” protocol as shared by the 10x Genomics community.3 Single-cell capture and complementary DNA (cDNA) synthesis were performed using the Fluidigm C1 system and the SMARTer Ultra Low RNA Kit. This was followed by cDNA quantification, dilution, and library preparation using the Nextera XT DNA Library Prep Kit. Agencourt AMPure XP beads were used for purification and size selection of the libraries. The 10X Genomics platform processed live cells and nuclei from both fresh and frozen tissues on the Chromium Single Cell Capture Chip, strictly adhering to the manufacturer’s guidelines for cell capture, reverse transcription, lysis, and library preparation. Sequencing was carried out on the Illumina NovaSeq platform using a 100 base pair paired-end protocol, yielding crucial data for analyzing the tumor microenvironment at the single-cell level. The dataset includes four IDH-wildtype (IDH-WT) GBMs and four IDH-mutant gliomas, providing a balanced representation of these two molecular subtypes. This composition is crucial for studying the molecular heterogeneity between IDH-WT and IDH-mutant gliomas, given their distinct biological behaviors and clinical outcomes.
For the GSE162631 dataset, surgical specimens were collected from four patients diagnosed with GBM with the aim of isolating endothelial cells (ECs) for single-cell RNA sequencing (scRNA-seq). From each patient, two tissue samples were processed: one extracted from the tumor epicenter and another from the peritumoral region. Tissue dissociation was initiated within 2 h of resection at the research facility to ensure cell viability and integrity. Single-cell suspensions were prepared following mechanical dissociation of the tissues, and specific kits from Miltenyi Biotec were utilized for the processing of tumor and peritumoral tissues. Cellular debris and red blood cells were meticulously removed according to the established protocol. Endothelial cells were then enriched through CD31+ selection using Dynabeads, a magnetic bead-based technology. The samples were subsequently resuspended in Dulbecco’s Phosphate-Buffered Saline (DPBS) with Bovine Serum Albumin (BSA) to facilitate cell counting and viability assessment. The optimal volume for scRNA-seq was selected based on the established protocol to ensure high-quality sequencing results. This dataset consists exclusively of IDH-WT samples, providing insights into the aggressive nature of this subtype, which is associated with a poorer prognosis and limited therapeutic options.
snRNA-seq/scRNA-seq libraries were crafted employing Chromium Single Cell Reagent Kit (10X Genomics). Subsequently, these libraries were consolidated and subjected to sequencing on the NovaSeq 6,000 platform by Illumina, guided by the NovaSeq Control Software (v1.6.0). The unprocessed sequence data underwent refinement through the Cell Ranger software (v.7.1.0) which enabled the alignment of reads to the human reference genome GRCh38. Consequently, for each specimen, a gene count matrix was formulated. The raw count data of ROSMAP snRNA-seq datasets and scRNA-seq datasets (GSE162631 and GSE138794) were analyzed utilizing the “Seurat” R package (v4.3.0.1). The filtration process was initially conducted to remove cells of poor quality, defined by a total RNA feature count below 200 or mitochondrial RNA surpassing 5%. Following the normalization of cellular gene expression, the SCTransform integration workflow was applied to integrate data from the various datasets. A total of 3,000 anchors for integration were identified, representing close neighbors within the individual datasets. Data scaling was performed to neutralize the effects of the cell cycle and to adjust for the overall counts recorded per cell and the mitochondrial gene expression ratio per cell. Principal Component Analysis (PCA) was then implemented to reduce the data dimensions, yielding 30 principal components. This was followed by the application of t-distributed stochastic neighbor embedding (tSNE) and uniform manifold approximation and projection (UMAP) algorithms for further dimensionality reduction across the initial 15 dimensions. The “doubletFinder” R package (McGinnis et al., 2019) was employed to sift out any doublets from the dataset. The application of the FindNeighbors and FindClusters functions, set at a resolution of 0.5, resulted in the identification of 8 and 12 distinct cell clusters for AD and GBM, respectively. The Wilcoxon rank-sum test was subsequently utilized to pinpoint genes with significant differential expression within each cluster, using the “FindAllMarkers” function with a minimum percentage cutoff of 0.25 and a logarithmic fold change threshold set at 0.25. Finally, the process of cluster consolidation and further exploration of cellular trajectories was facilitated by the “SCP” R package. This package was instrumental in the analysis of differentially expressed genes, cell type annotation, and the elucidation of cellular developmental paths, providing a comprehensive view of the cellular dynamics within the context of AD and GBM.
In multicellular organisms, effective communication between cells is essential for their proper functioning, enabling the sharing of information through the release of signaling molecules or via direct cell-to-cell contact. “CellChat” is a specialized bioinformatics tool designed to infer and quantitatively analyze networks of intercellular communication from scRNA-seq data (Jin et al., 2021). It incorporates comprehensive ligand-receptor interaction databases and is accessible online at http://www.cellchat.org/. This tool facilitates the identification and quantification of interactions based on differential expression levels of ligands and receptors within cell groups, with statistical significance defined by a p-value threshold of less than 0.05. The netVisual_diffInteraction function within CellChat was utilized to visually represent variations in the strength of intercellular communication, highlighting the differences between distinct cell populations. To elucidate the complex coordination among multiple cell populations and the signaling pathways that drive intercellular communication, non-negative matrix factorization (NMF) is implemented through the identifyCommunicationPatterns function, which aids in deducing the underlying communication patterns. Subsequently, CellChat enables the extraction of key signaling inputs and outputs among various cell clusters, which can be visually depicted using scatter plots for a clear representation of intercellular signaling dynamics. By measuring the Euclidean distance between pairs of shared signaling pathways on a two-dimensional manifold scatter plot, the rankSimilarity function was applied to pinpoint pathways that exhibit the most significant alterations, particularly in the context of AD and GBM samples. Finally, CellChat allows for the comparison of communication probabilities between ligand-receptor pairs that are regulated by specific cell populations and directed towards others. This comparison is achieved by adjusting the compare parameter within the netVisual_bubble function, providing a nuanced view of cell population-specific regulatory effects within the intercellular communication network. This approach offers valuable insights into the intricate mechanisms of cell–cell interactions in the context of scRNA-seq data analysis.
The “Boruta” R package is an advanced ensemble method for feature selection, designed to identify the most influential predictors in complex datasets. By employing a p-value threshold of 0.01, we enforced a rigorous criterion for variable retention, ensuring that only those features with a statistically significant association to the outcome variable are considered. The algorithm operate by comparing the importance of each feature against a set of randomly generated “shadow” features. This comparison is grounded in the mean decrease in accuracy, a measure that reflects the predictive relevance of each feature. Through iterative evaluation, Boruta distinguishes between truly important features and those that exhibit only spurious correlations. Upon completion of the Boruta process, a subset of “Confirmed” variables was selected—those that have demonstrated a substantial impact on model accuracy and have surpassed the predefined significance threshold. These variables form the basis for subsequent machine learning modeling, streamlining the dataset to its most informative elements. To account for potential confounding factors, such as age, gender, and IDH mutation status, we incorporated these variables as covariates in our machine learning models. This adjustment ensures that the predictive power of the identified gene signatures is evaluated independently of these clinical variables.
For models construction, we adopted a meticulous analytical approach to construct predictive models and identify key biomarkers using the “mlr3” R package.4 This package is part of the “mlr3verse,” a comprehensive ecosystem for machine learning in R, known for its flexibility and extensive range of algorithms. Our methodology commenced with a rigorous data preprocessing phase, which included data cleaning to handle missing values and outliers, and normalization to ensure that all features were on a comparable scale. An initial feature selection was conducted based on statistical measures such as variance and correlation, thereby establishing a solid foundation for model training.
The machine learning algorithms were categorized based on their analytical strengths:
• Tree-based models like Classification Tree, Random Forest, and Xgboost, known for their ability to handle non-linear relationships and interactions between features.
• Discriminant and linear models including Linear Discriminant Analysis (LDA) and Glmnet, which are effective for linearly separable data.
• Instance-based learning with K-Nearest Neighbors (KNN), which relies on the similarity of instances for prediction.
• Kernel-based learning via Support Vector Machine (SVM), which uses kernel functions to transform data into a higher-dimensional space.
• Probabilistic models such as Logistic Regression and Naive Bayes, with the latter noted for its simplicity and effectiveness in high-dimensional spaces.
• Neural Networks were also employed for their capacity to capture complex patterns.
Each algorithm underwent hyperparameter optimization using grid search cross-validation, streamlined by the AutoML features of the “mlr3” package, to identify the most effective hyperparameters. Post model training, variable importance scores were extracted and aggregated to pinpoint potential biomarker candidates. To reinforce the stability of feature selection, a process of stability selection was implemented, ensuring the consistency of important features across various data subsets. The predictive performance of the models was then validated using a held-out test set, thereby confirming the generalizability of our models and the relevance of the identified biomarkers. Subsequently, the models were refined using the selected biomarker subset, thereby enhancing both predictive accuracy and model interpretability. Throughout this process, we maintained stringent documentation standards, detailing every step from data preprocessing to model validation. This included hyperparameter settings, feature selection criteria, and variable importance scores.
In this research, 694 glioblastoma patients from the TCGA cohort were included. Clinical data were sourced from TCGA’s published works, as detailed previously. Utilizing the Xena Browser by UCSC, TCGA’s gene expression data from AffyU133a arrays and Illumina HiSeq RNA-seq for lower-grade gliomas (LGGs) and glioblastomas (GBMs) were retrieved from https://tcga-data.nci.nih.gov/. Additionally, the CGGA (Chinese Glioma Genome Atlas) dataset, which comprises 692 cases with gene expression profiles for 24,326 genes along with overall survival data, was accessed through the CGGA website at http://www.cgga.org.cn/. This dataset was generated using the Illumina HiSeq 2000 sequencing platform. Ethical approval for this study was granted by the Institutional Review Boards of Beijing Tiantan Hospital, with all participants providing their written consent. The research was conducted in strict compliance with the guidelines and regulations set forth by the Institutional Review Boards. Gene expression values were initially normalized to fragments per kilobase of transcript per million mapped reads (FPKM), considering the gene length. The “limma” R package was employed for data analysis, applying a fold change threshold of greater than 1.5 and an adjusted p-value of less than 0.05 to identify differentially expressed genes (DEGs). The “clusterProfiler” R package (Wu et al., 2021) was then used for functional enrichment analysis of the DEGs, categorizing them by Gene Ontology (GO) terms related to biological processes (BP), molecular functions (MF), and cellular components (CC). Additionally, pathway enrichment analysis was conducted with the “clusterProfiler” package, referencing pathways from the Kyoto Encyclopedia of Genes and Genomes (KEGG), with a false discovery rate (FDR) threshold of less than 0.05. For survival analysis, the “survival” and “survminer” R package was applied, offering an extensive toolkit for time-to-event data analysis. The package’s Coxph and Survfit function was utilized to perform Cox proportional hazards regression, a widely recognized approach to explore the correlation between survival outcomes and multiple predictive variables.
In our study, we explored the complex patterns of DNA methylation within a cohort comprising 159 glioma tissue samples. These data were meticulously sourced from the TCGA database, facilitated by the “TCGAbiolinks” R package (Colaprico et al., 2016). The methylation status of the samples was assessed using the Illumina Infinium HumanMethylation 450 platform, which quantifies methylation as β-values. These values represent the ratio of methylated cytosines to the total cytosine signal. Our investigation centered on methylation events occurring near CpG islands, including their shores and shelves. These regions are of significant interest due to their role in gene regulation. To ensure the accuracy of our analysis, we meticulously curated the data by excluding CpG sites that were in close proximity to known single nucleotide polymorphisms (SNPs), as identified on the Illumina product support website, and those that exhibited cross-reactivity. This exclusion was critical to prevent any misinterpretation of the methylation status. Additionally, we omitted CpG sites located on the Y chromosome, considering their lack of relevance to our all-female patient cohort. These rigorous filters culminated in a refined dataset comprising 180,758 CpG sites, which was then prepared for detailed analysis.
For the samples from the Chinese Glioma Genome Atlas (CGGA), immediate post-surgical snap-freezing in liquid nitrogen was employed to preserve tissue integrity. Hematoxylin and eosin-stained sections were meticulously examined to ensure that only samples with a tumor cell content exceeding 80% were included in the study. Genomic DNA extraction was conducted using the QIAamp DNA Mini Kit, strictly following the manufacturer’s protocol. The purity and concentration of the extracted DNA were determined using a NanoDrop ND-1000 spectrophotometer. The DNA methylation data underwent a series of normalization and processing steps using the ChAMP R package, with its default parameters applied to ensure analytical consistency. Subsequently, the “EpiDISH” R package (Teschendorff et al., 2017) was utilized to deconvolute the methylation profiles. This approach provided an estimation of the relative proportions of various immune cell types within the GBM samples. Our analysis not only deepened the understanding of the immune microenvironment in GBM but also provided valuable insights that could potentially inform the development of targeted immunotherapeutic strategies.
In our study, we employed high-dimensional weighted gene co-expression network analysis (hdWGCNA) to delve into the complex relationships within single-cell RNA sequencing (scRNA-seq) data. This approach was facilitated by the “hdWGCNA” R package (Morabito et al., 2023), which is specifically designed to create gene correlation networks suited for scRNA-seq data. We initiated our analysis by creating a Seurat object employing the SetupForWGCNA function. To counteract the sparsity characteristic of scRNA-seq data, we constructed metacells, which are clusters of transcriptionally similar cells, using the k-Nearest Neighbors (KNN) algorithm with default parameters: k = 25 for the number of neighbors and max_shared = 10 to control the sharing of cells between metacells. The determination of the optimal soft power threshold for gene–gene correlation scaling was performed using the TestSoftPowers function, which was set to explore a range of soft power values from 1 to 30 to achieve the best fit to the scale-free topology model. The ConstructNetwork function was then utilized to create a topological overlap matrix (TOM) for module detection, employing the scaled gene–gene correlations. Module dendrograms were visualized using the PlotDendrogram function to provide a clear hierarchical representation of gene clusters. Module eigengenes (ME), calculated with the ModuleEigengenes function using default settings, served as the first principal components of each module’s gene subset. Intra-modular connectivity was quantified using the SignedKME algorithm, which determined the kME metric for each gene in relation to its module’s eigengene. This step was crucial for identifying the most interconnected genes within each module. For dimensionality reduction and visualization, the RunModuleUMAP function was applied to the TOM, focusing on the top five hub genes per module as ranked by their kME values. This resulted in a UMAP visualization that was predominantly influenced by these hub genes, with annotations for the top five hub genes in each module to reflect the module’s key features.
All statistical analyses and data visualizations were performed using R software (version 4.3.3). Differences in survival between the two groups were assessed using Kaplan–Meier curves and the log-rank test. Univariate and multivariate Cox regression analyses were used to determine prognostic factors. For correlation analysis, correlation coefficients were calculated using Pearson for normally distributed data and Spearman for non-normally distributed data. For analysis of differences between two groups of data, unpaired Student’s t-test and Mann–Whitney U-test were used for normally and non-normally distributed variables, respectively. To compare more than two groups, one-way analysis of variance (ANOVA) and Kruskal–Wallis’s tests were used as parametric and nonparametric methods, respectively. The adjusted p-value (FDR) was calculated by the Benjamini–Hochberg correction method. p < 0.05 was considered statistically significant unless mentioned otherwise.
Our investigation began with single-nucleus RNA sequencing (snRNA-Seq) of AD, followed by comprehensive data annotation to delineate cellular subpopulations and their associated biological processes. After stringent quality control, we obtained a dataset comprising 70,634 cells for analysis. Using dimensionality reduction techniques, including UMAP and tSNE, alongside clustering analyses, we identified eight distinct cellular subpopulations: Oligodendrocytes (25.8%), Inhibitory Neurons (13.0%), Excitatory Neurons (4.9%), Astrocytes (4.8%), Oligodendrocyte Precursor Cells (OPCs, 3.7%), Microglia (2.7%), Pericytes (0.2%), and Endothelial Cells (0.2%) (Figures 2A–C). Hierarchical clustering and the Wilcoxon rank sum test were utilized to detect DEGs within each cellular cluster, revealing a significant representation of nerve cells. Each cell type exhibited a unique set of functionally distinct genes. For instance, Excitatory Neurons predominantly expressed genes associated with the modulation of chemical synaptic transmission and the regulation of trans-synaptic signaling processes. Subsequent clustering and enrichment analysis of DEGs from these cellular subpopulations uncovered that the C2 cluster, characterized by genes ABL1, DIP2B, SEMA4D, and SMURF1 in Oligodendrocytes, was significantly enriched for the mitochondrial morphogenetic pathway (Figures 3A,B). The defining genes of each cell subpopulation, as determined through cellular profiling, were as follows: Excitatory Neurons (CDK5), Oligodendrocytes (LPAR1), Inhibitory Neurons (RELN), Microglia (NCKAP1L), OPCs (DISC1), and Astrocytes (NOTCH1) (Supplementary Table S2). Notably, LPAR1, RELN, and NCKAP1L are associated with mitochondrial epistasis, genes previously identified in our study, while DISC1 is recognized as a gene related to mitochondrial localization (Figures 3C,D).
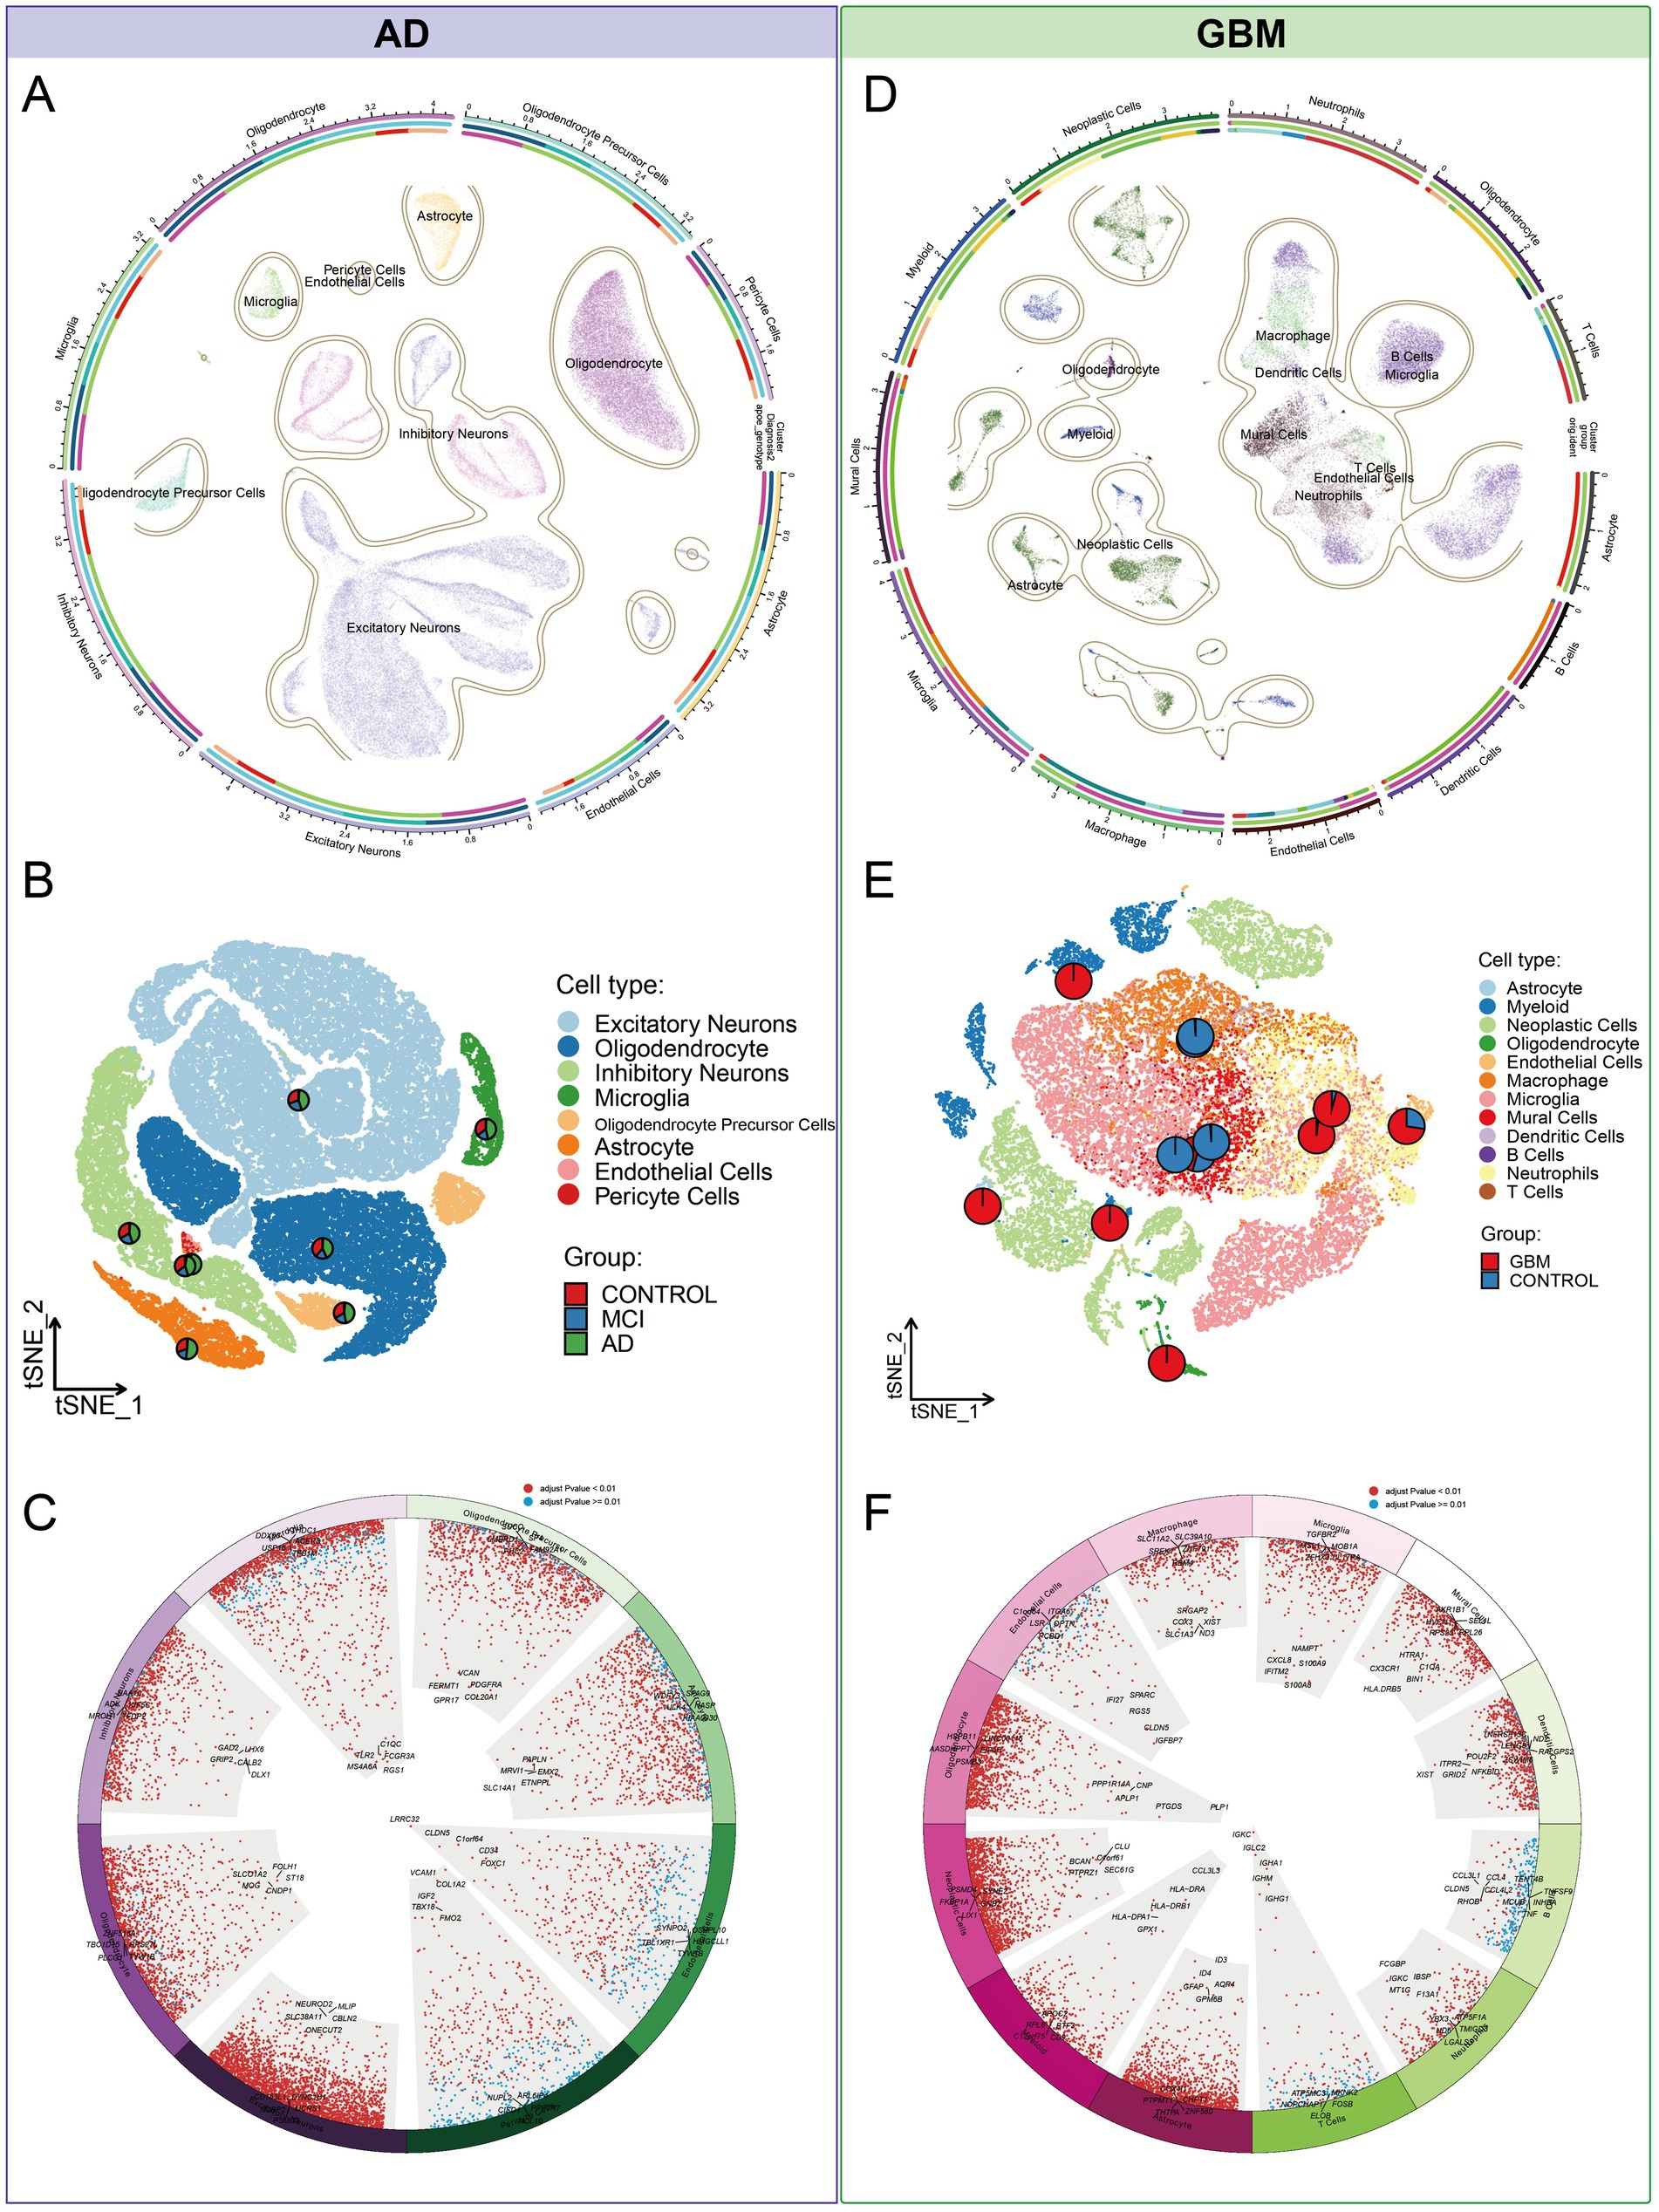
Figure 2. Cellular subpopulation landscape in AD and GBM. (A–C) Our investigation of AD utilized single-nucleus RNA sequencing (snRNA-Seq) to meticulously annotate and delineate cellular subpopulations in relation to established biological processes. Post stringent quality control measures, a dataset of 70,634 cells was subjected to dimensionality reduction techniques, such as Uniform Manifold Approximation and Projection (UMAP) and t-Distributed Stochastic Neighbor Embedding (tSNE), coupled with cluster analysis. This approach identified eight distinct cellular subpopulations, including Oligodendrocytes (25.8%), Inhibitory Neurons (13.0%), Excitatory Neurons (4.9%), Astrocytes (4.8%), Oligodendrocyte Precursor Cells (OPCs, 3.7%), Microglia (2.7%), Pericytes (0.2%), and Endothelial Cells (0.2%). (D–F) To explore the heterogeneity of GBM, we integrated single-cell RNA sequencing (scRNA-seq) data from two distinct datasets (GSE138794 and GSE162631). The SCTransform algorithm was applied to mitigate batch effects, resulting in an integrated dataset comprising 35,674 cells across 16 samples. Unsupervised clustering analysis identified 38 distinct clusters, which were categorized into 12 cell types: Microglia (35.6%), Neoplastic Cells (22.3%), Neutrophils (11.9%), Macrophages (10.2%), Myeloid Cells (8.1%), Mural Cells (6.5%), Dendritic Cells (1.8%), Oligodendrocytes (1.7%), Endothelial Cells (1.1%), Astrocytes (0.4%), T Cells (0.2%), and B Cells (0.1%). This comprehensive categorization facilitates a deeper understanding of the cellular diversity within AD and GBM and paves the way for targeted therapeutic strategies.
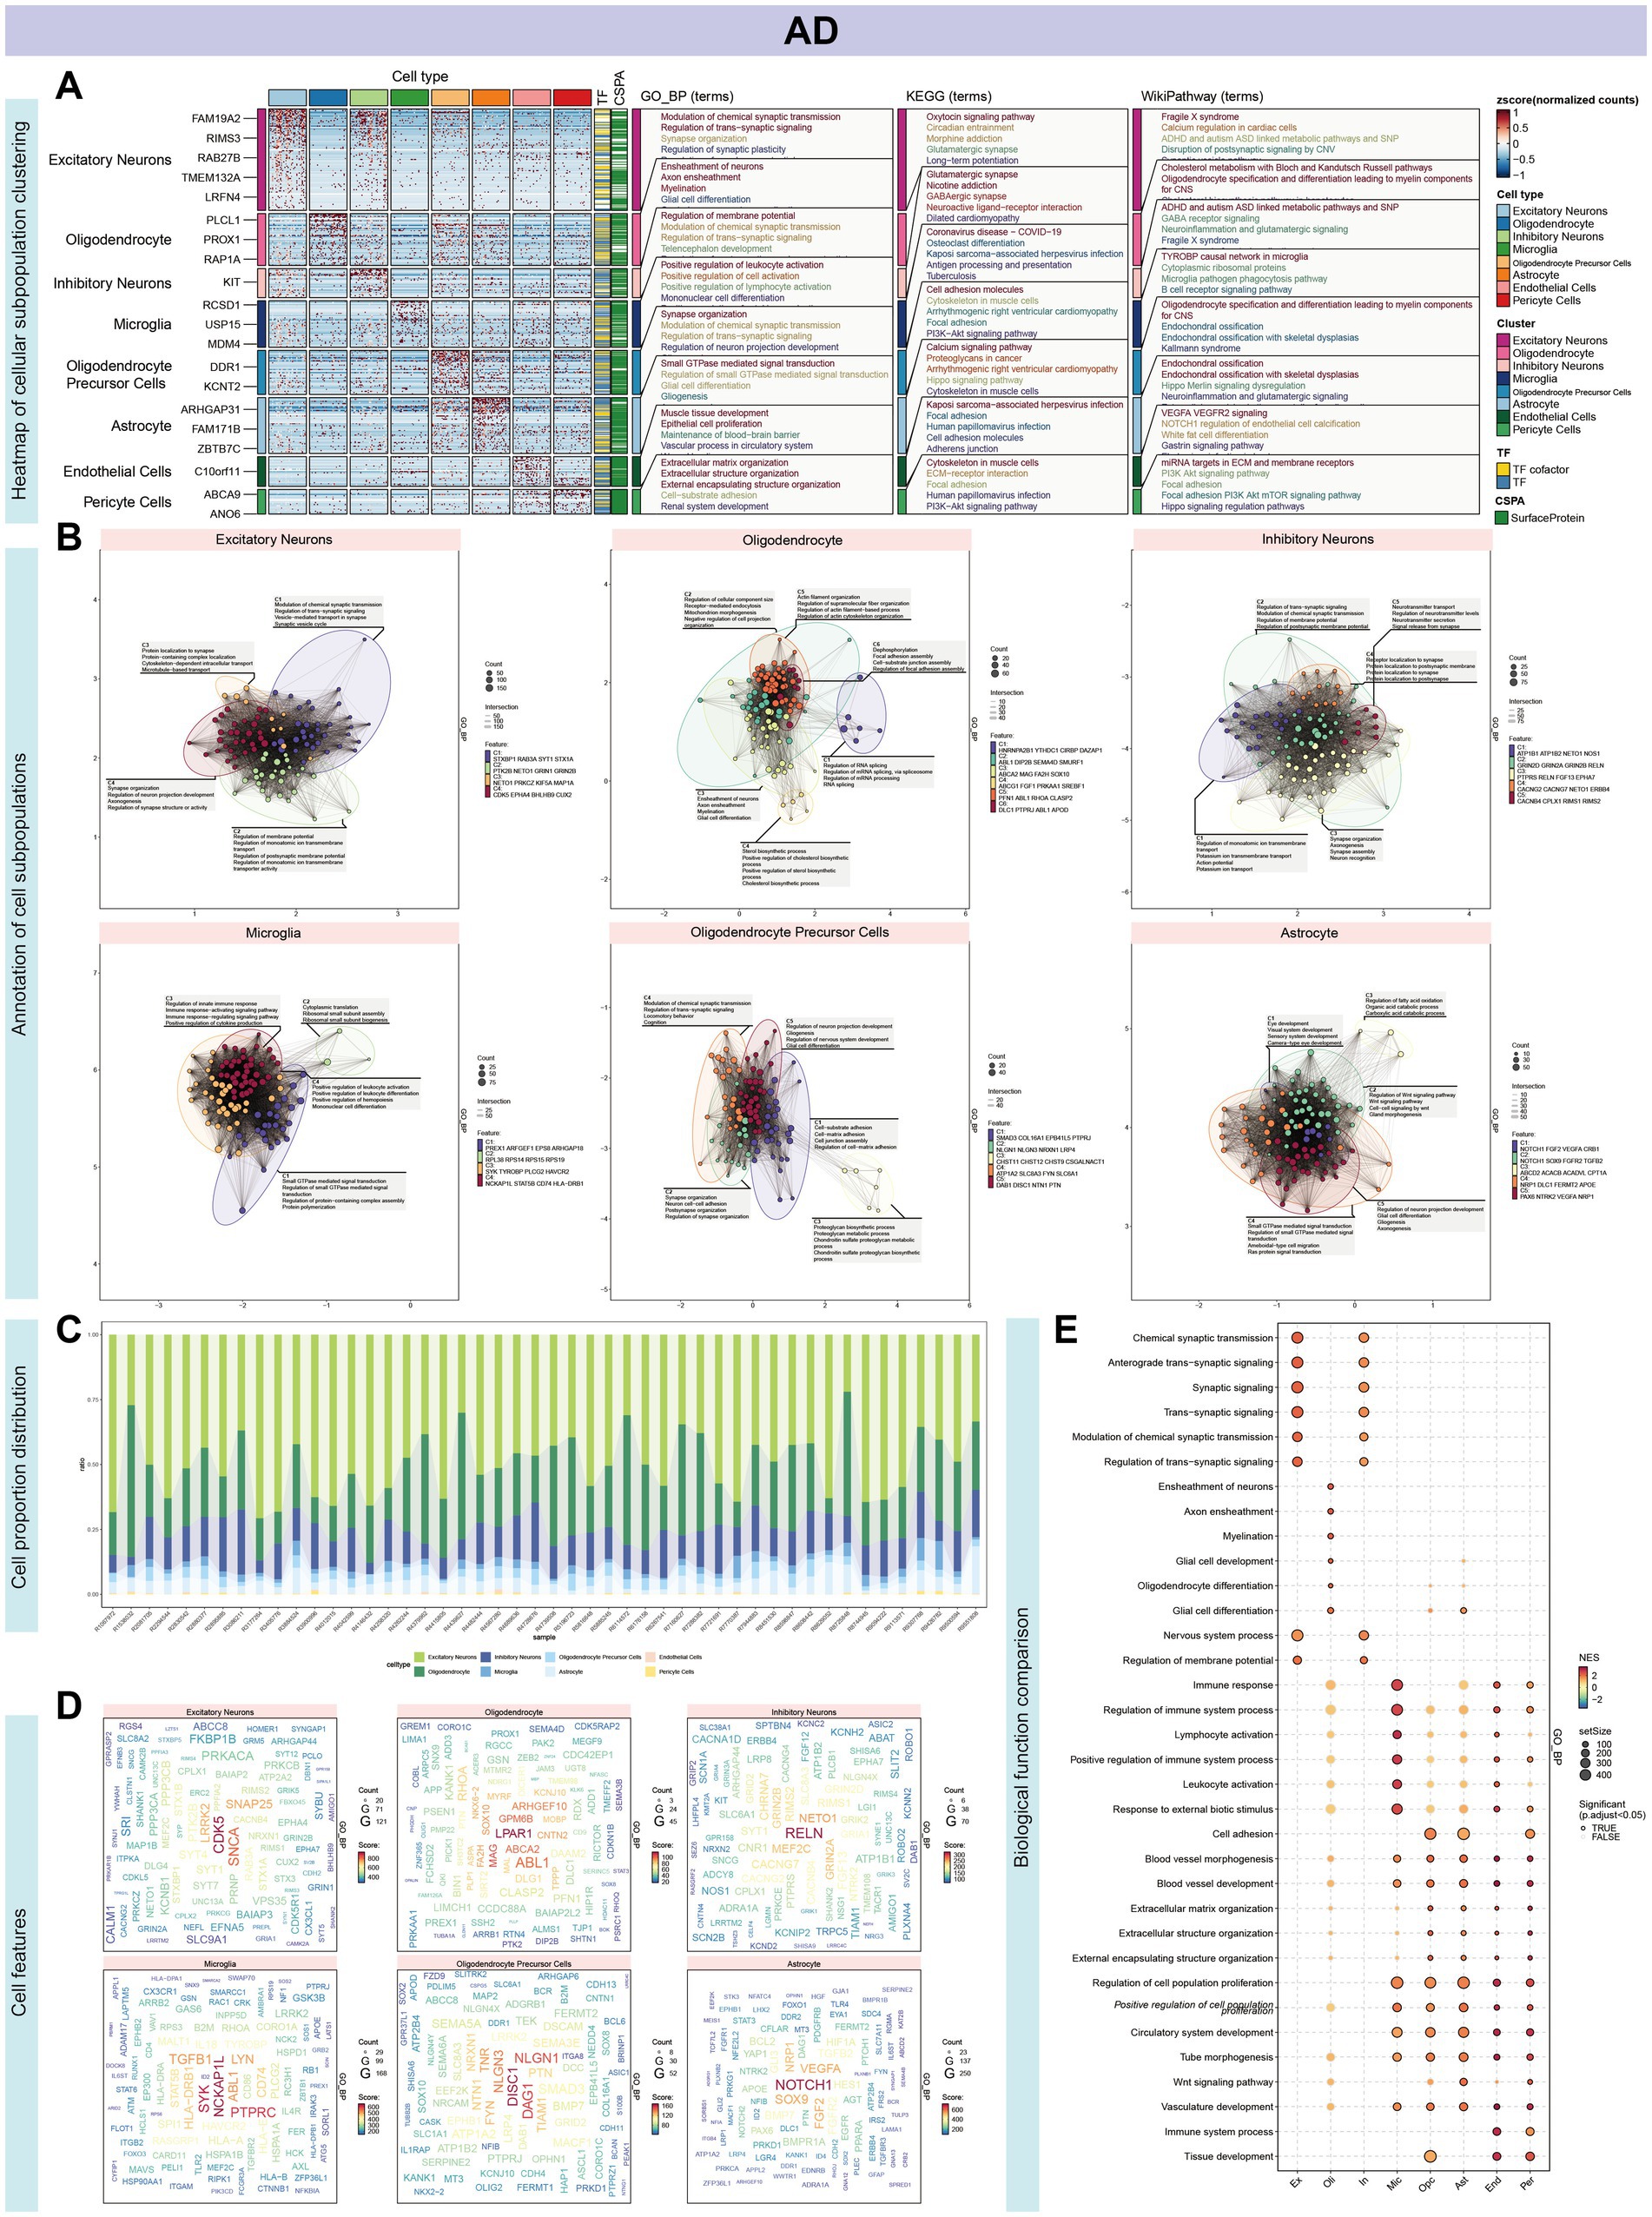
Figure 3. Characterization and functional annotation of AD single-cell subpopulations. (A) Hierarchical clustering, utilizing the Wilcoxon rank sum test, was employed to identify differentially expressed genes (DEGs) within each cluster, revealing a substantial representation of nerve cells. (B) Functional enrichment analysis revealed unique gene sets for each cell subset. Excitatory Neurons predominantly expressed genes linked to chemical synaptic transmission modulation and trans-synaptic signaling regulation. DEGs from cellular subpopulations, particularly the C2 cluster marked by ABL1, DIP2B, SEMA4D, and SMURF1 in Oligodendrocytes, showed significant enrichment in the mitochondrial morphogenetic pathway. (C) The histogram illustrates the proportional representation of cell types within each sample. (D) Cell subpopulations were characterized by defining genes: Excitatory Neurons (CDK5), Oligodendrocytes (LPAR1), Inhibitory Neurons (RELN), Microglia (NCKAP1L), OPCs (DISC1), and Astrocytes (NOTCH1). Notably, LPAR1, RELN, and NCKAP1L, implicated in mitochondrial epistasis, and DISC1, a gene associated with mitochondrial localization, were identified. This underscores the complex interplay between cellular identity and mitochondrial function in neurological diseases. (E) GSVA enrichment analysis across cell types revealed heightened involvement in signal transduction within the nervous system, including synaptic transmission, as well as processes related to cell growth and differentiation.
To investigate GBM heterogeneity, we conducted an integrated analysis of scRNA-seq data from two distinct datasets (GSE138794 and GSE162631). The SCTransform algorithm was utilized to mitigate batch effects, resulting in an integrated dataset comprising 35,674 cells across 16 samples. UMAP analysis identified 38 clusters, categorized into 12 cell types according to existing annotations: Microglia (35.6%), Neoplastic Cells (22.3%), Neutrophils (11.9%), Macrophages (10.2%), Myeloid Cells (8.1%), Mural Cells (6.5%), Dendritic Cells (1.8%), Oligodendrocytes (1.7%), Endothelial Cells (1.1%), Astrocytes (0.4%), T Cells (0.2%), and B Cells (0.1%) (Figures 2D–F). Differential gene expression analysis indicated that neoplastic cells exhibited the highest frequency of DEGs, followed by astrocytes and oligodendrocytes (Figure 4A; Supplementary Table S3). These cell types were significantly enriched for mitochondrial processes, including mitochondrial gene expression, electron transport chain activity, and ATP synthesis, with key genes such as MT-ND1, MT-ND2, MT-ND4, and MT-ND5 prominently expressed (Figures 4B–D). These genes were also linked to the NADH dehydrogenase (ubiquinone) 1 beta subcomplex, a crucial component of mitochondrial complex I, indicating a pivotal role in mitochondrial energy metabolism. Additionally, enrichment analysis showed these cells were involved in neuronal and cellular projections, highlighting their roles in neural development (Figure 4E).
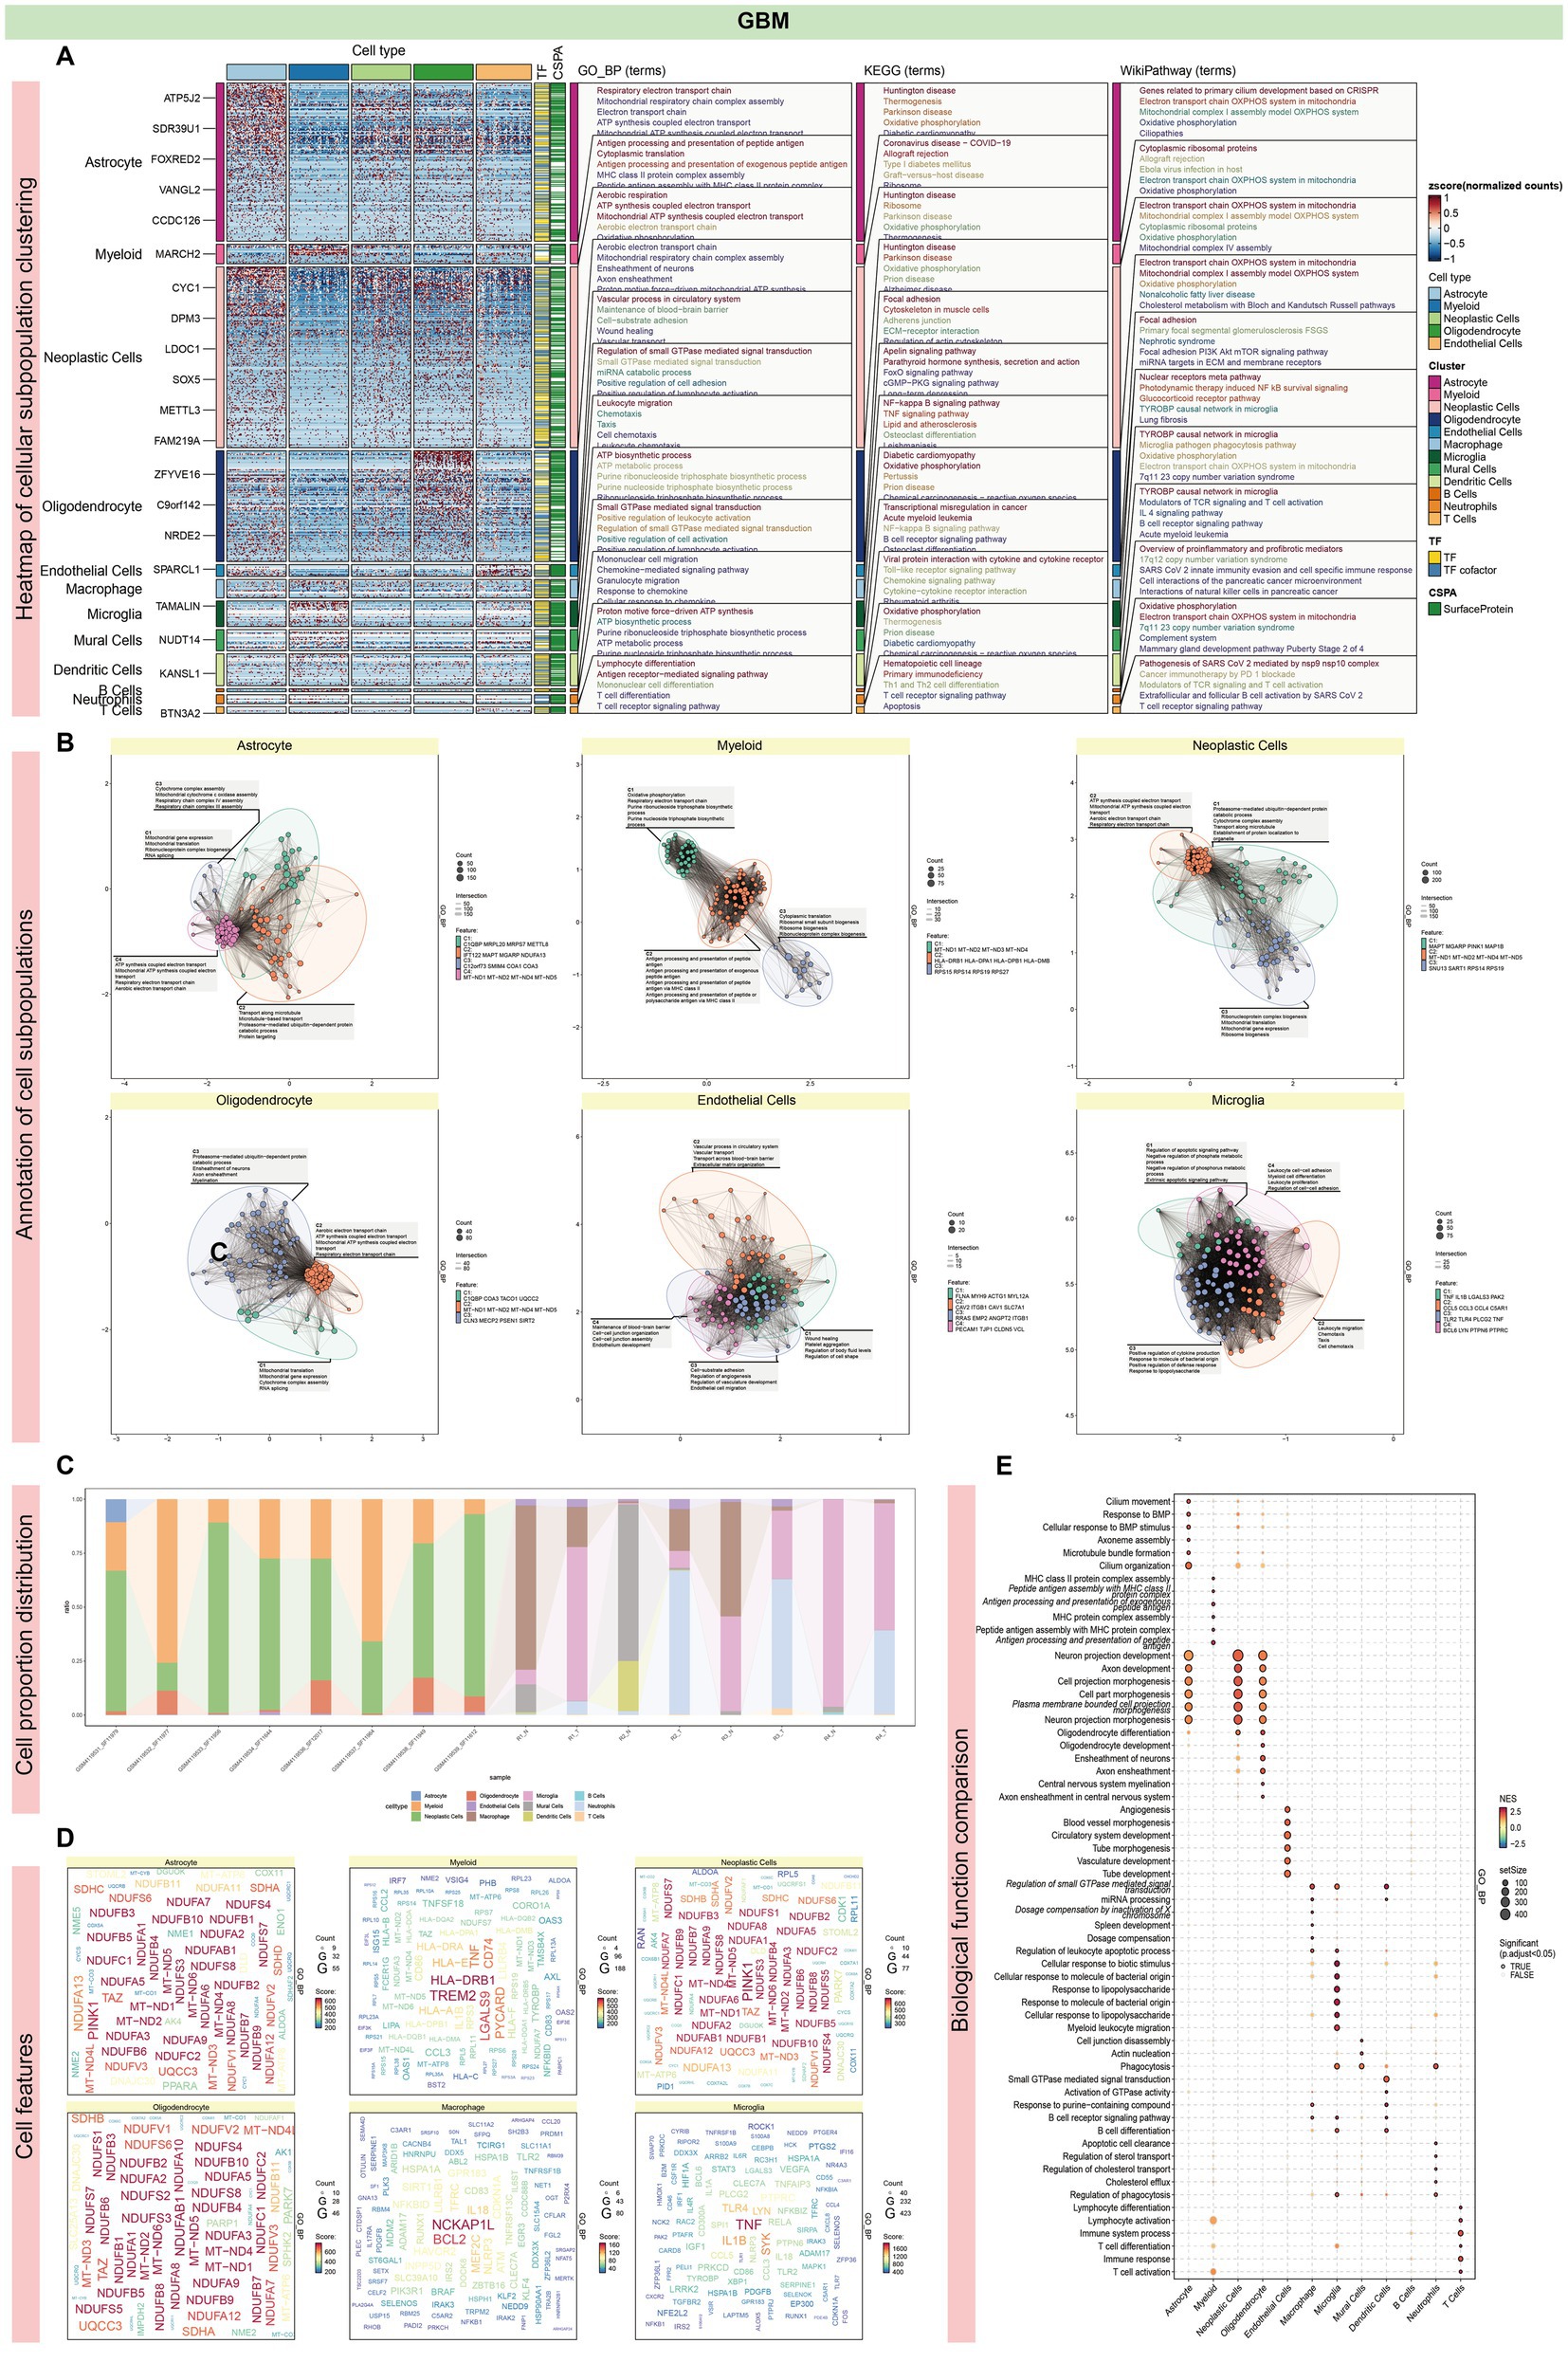
Figure 4. Characterization and functional annotation of GBM single-cell subpopulations. (A) Differential gene expression analysis identified Neoplastic Cells exhibited the highest frequency of DEGs, followed by Astrocytes and Oligodendrocytes. (B) Functional enrichment analysis of different cell subsets. All three cell types showed significant enrichment in mitochondria-related processes, including mitochondrial gene expression and mitochondrial ATP synthesis coupled with electron transport. They commonly had enrichment for mitochondrial gene clusters including MT-ND1, MT-ND2, MT-ND4, and MT-ND5. The differentially expressed genes in these cells included numerous genes coupled with the NADH dehydrogenase (ubiquinone) 1 beta subcomplex, a key component of the mitochondrial respiratory chain complex I. (C) The histogram illustrates the proportional representation of cell types within each sample. (D) Mitochondrial genes in these cell types were significantly enriched for processes related to mitochondrial function, including gene expression and electron transport-coupled ATP synthesis, underscoring their role in energy metabolism. (E) This enrichment highlights the intimate connection of these cell types with mitochondrial function and energy metabolism. Additionally, enrichment for processes involved in the development of neuronal and cellular projections was observed, indicating a role in cellular and neural development. Our single-cell analysis outcomes from AD and GBM highlight shared involvement in key biological processes. Both conditions show significant enrichment in mitochondria-related processes, particularly oxidative phosphorylation, and pathways influenced by small GTPases. Immune-related processes are also commonly enriched, with a notable role for microglia. Oligodendrocyte function is conserved in both diseases, closely associated with mitochondrial processes such as morphogenesis and energy metabolism, as well as axon ensheathment and neuronal morphogenesis. KEGG disease enrichment analysis of GBM’s oligodendrocyte signature genes suggests correlations with other neurodegenerative conditions, including Huntington’s disease, Parkinson’s disease, and AD. AD exhibits heightened enrichment in nervous system signaling, including synaptic transmission, and processes related to cell growth and differentiation. In contrast, GBM is characterized by a greater emphasis on mitochondrial energy metabolism, evident in the coupling of ATP synthesis with electron transport and the ATP biosynthetic process. Furthermore, GBM shows significant enrichment in immune response processes, particularly lymphocyte and T cell differentiation.
Comparative analyses of single-cell transcriptomics in AD and GBM revealed shared mitochondrial involvement in oxidative phosphorylation, immune response, and small GTPase-related signaling pathways. Both AD and GBM showed significant immune-related enrichments, particularly involving microglia. Notably, oligodendrocytes in both conditions displayed enrichment in mitochondrial processes such as morphogenesis, energy metabolism, axon ensheathment, and neuronal morphogenesis. KEGG pathway enrichment of oligodendrocyte-specific genes in GBM indicated associations with Huntington’s, Parkinson’s, and Alzheimer’s disease. Additionally, AD showed higher enrichment in synaptic transmission and neuronal signaling, whereas GBM emphasized mitochondrial energy metabolism, ATP synthesis, and immune response processes, including T cell differentiation (Figures 3E, 4E).
Cell communication analysis revealed intricate signaling networks among various brain cell types in AD and GBM. In AD, distinct receptor-ligand interactions were identified, prominently involving OPCs, astrocytes, excitatory and inhibitory neurons, and oligodendrocytes. The strongest interactions were observed between OPCs and astrocytes, as well as between excitatory and inhibitory neurons (Figures 5A,B; Supplementary Figure S1A; Supplementary Table S4). The five most significant signaling pathways were ADGRL (27 interactions), PTPRM (25 interactions), UNC5 (23 interactions), NRXN (23 interactions), and PSAP (21 interactions) (Figure 5C; Supplementary Figures S1B,C; Supplementary Table S5). Notably, the ligand-receptor pairs NRG3-ERBB4, NRXN3-LRRTM4, and NRXN1-NLGN1 exhibited the most substantial interactions across astrocytes, excitatory/inhibitory neurons, and OPCs (Supplementary Figures S1B,C). Outgoing and incoming signal patterns were categorized for cluster analysis, revealing five efferent and four afferent patterns, with ADGRL and NCAM pathways dominating secreted signals in excitatory and inhibitory neurons (Figures 5D–F). Astrocytes and oligodendrocytes exhibited distinct secretion patterns, enriched for pathways such as APP and PTPR (Supplementary Figure S1C).
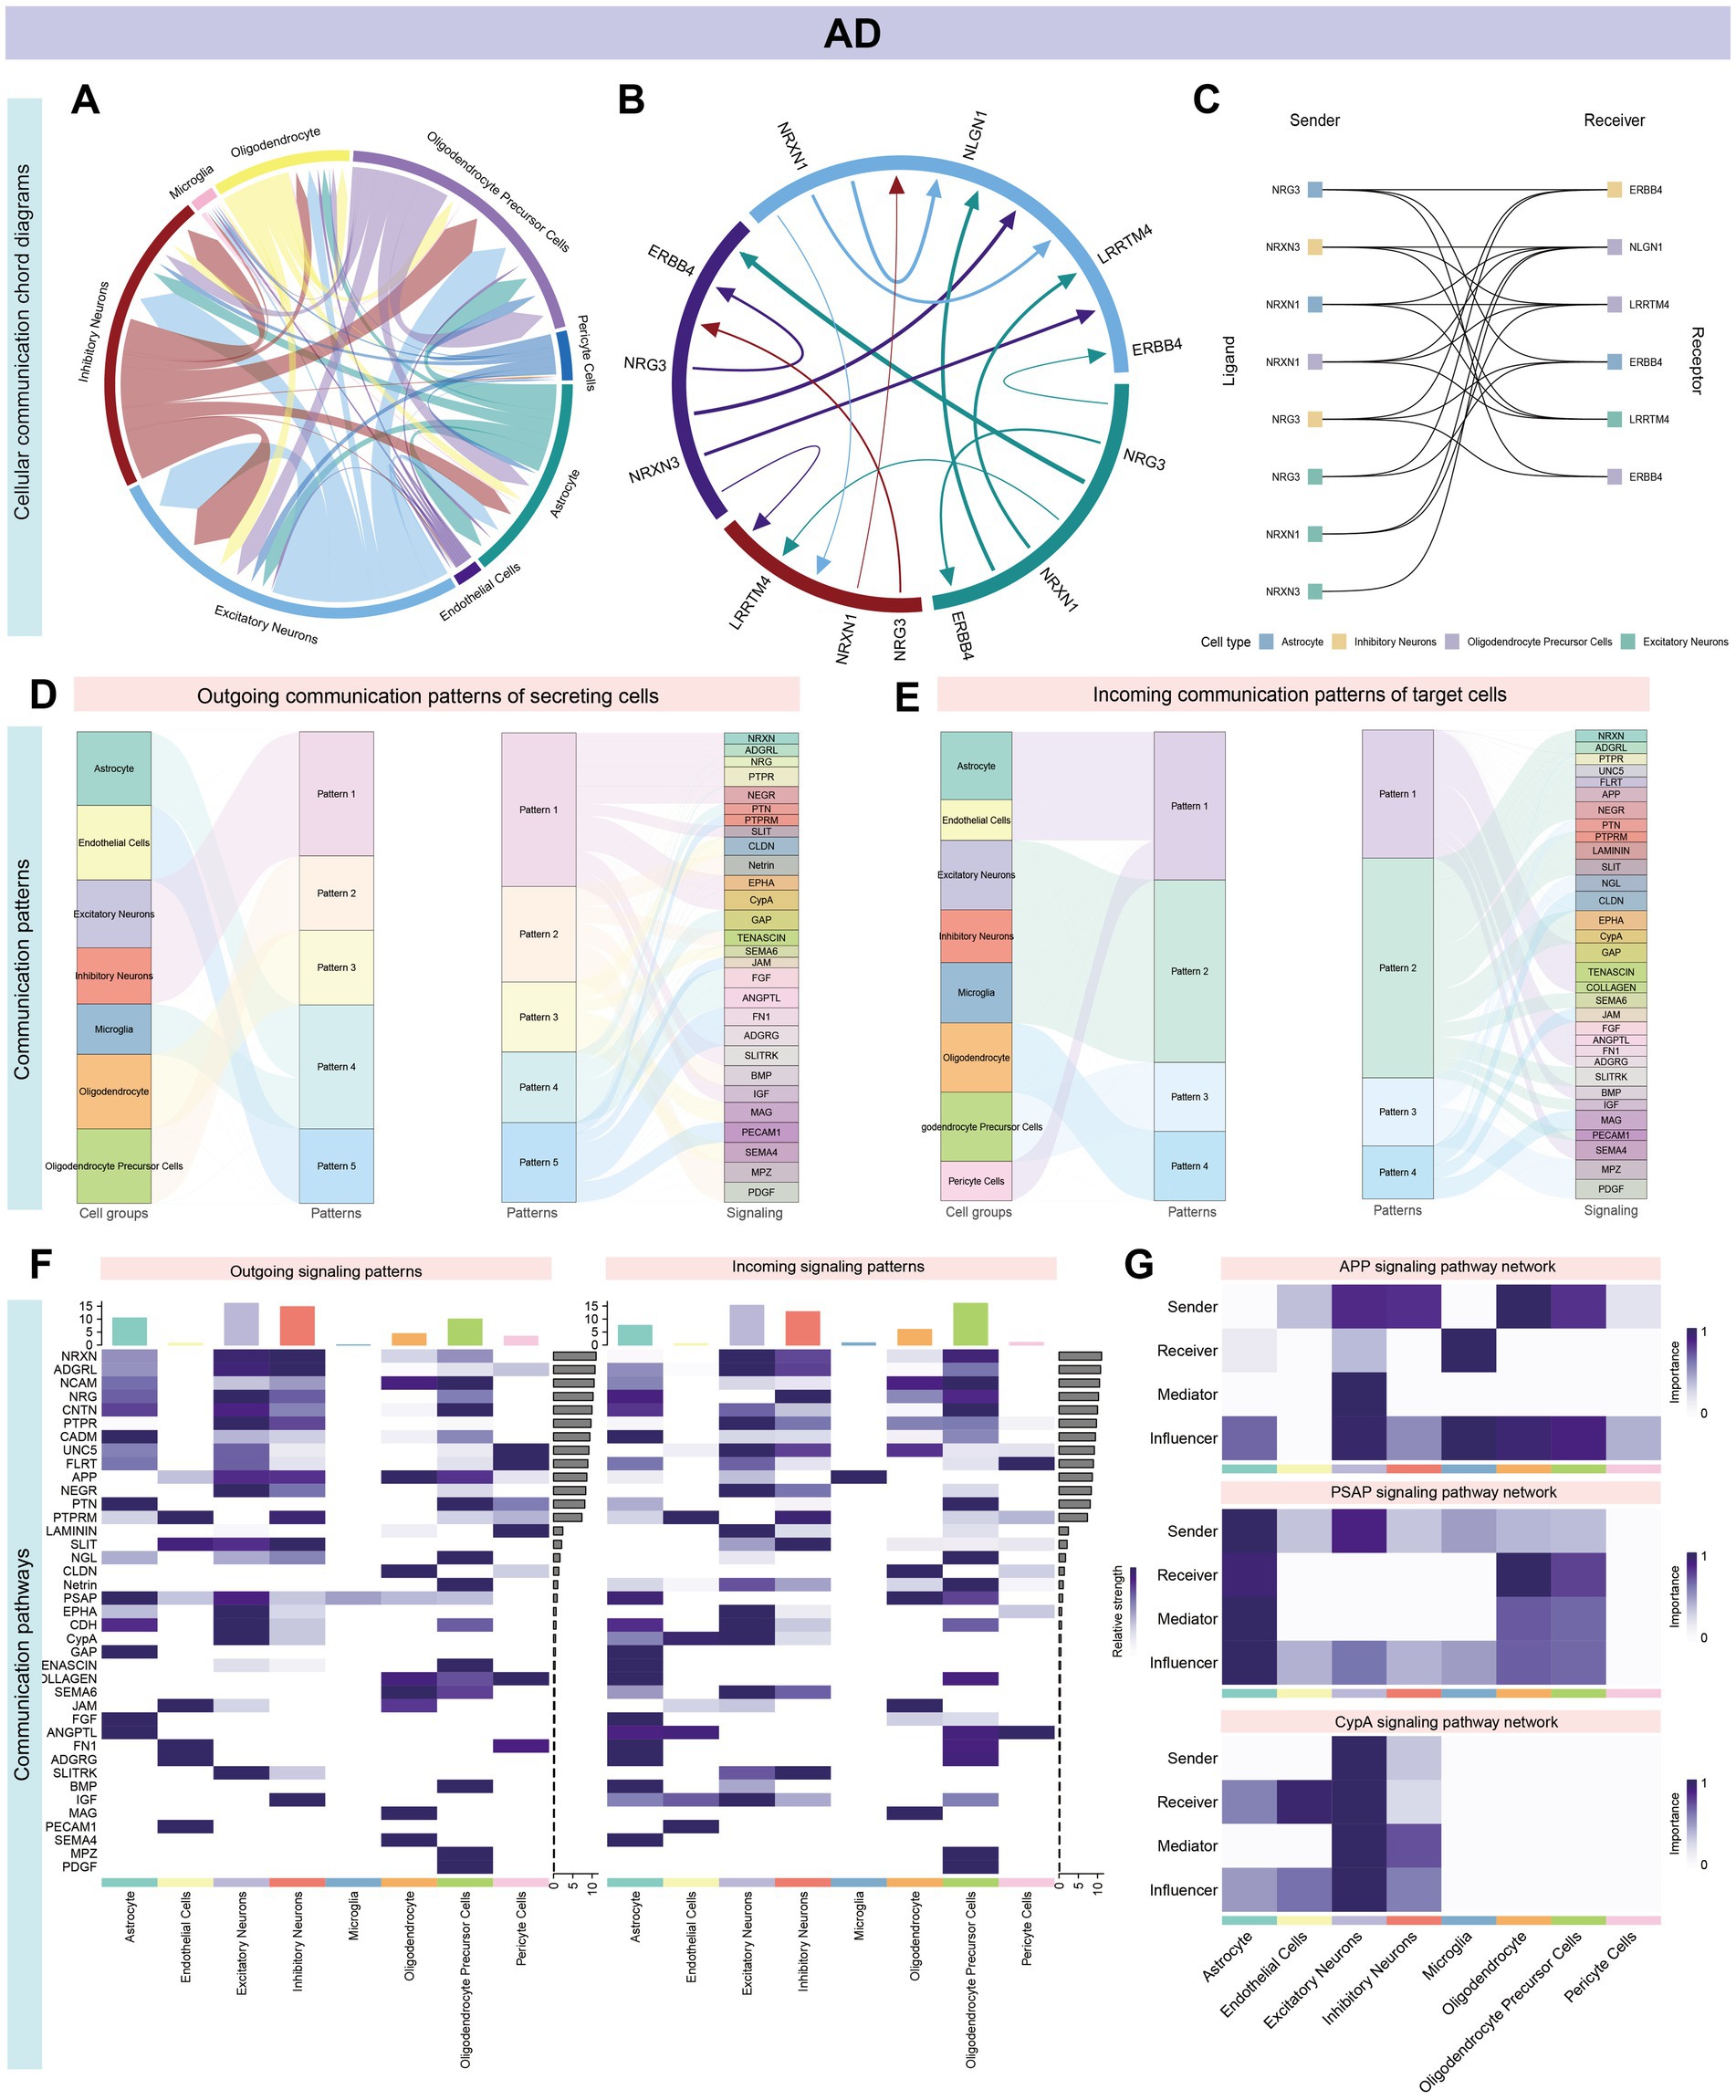
Figure 5. Systems analysis of cell–cell communication network in AD single-cell data. Panel (A–G) and Supplementary Figure S1 illustrate the intricate signaling networks among various cell types in the brains of patients with AD, as revealed by cell communication analysis. (A,B) The aggregated cell–cell communication network highlights prominent receptor-ligand interactions, especially among neuronal cells such as OPCs, Astrocytes, Excitatory Neurons, Inhibitory Neurons, and Oligodendrocytes. Significant interactions are observed between OPCs and Astrocytes, as well as between Excitatory and Inhibitory Neurons. (C) The most impactful pathways are ranked by the number of interactions, with ADGRL (27), PTPRM (25), UNC5 (23), NRXN and PSAP (each with 23), and FLRT (21) leading the list. Within Astrocytes, Excitatory/Inhibitory Neurons, and OPCs, the ligand-receptor pairs NRG3-ERBB4, NRXN3-LRRTM4, and NRXN1-NLGN1 stand out (Supplementary Figures S1B,C). (D,E) Signal classification into outgoing and incoming facilitates pattern recognition and cluster analysis, identifying five distinct efferent and four afferent signaling patterns. (F) Excitatory and Inhibitory neurons show similar conduction patterns, with the ADGRL and NCAM pathways being the primary routes for signal secretion. (G) Network centrality scores for the APP, PSAP, and CypA signaling pathways are computed and visualized, indicating their central roles in the cellular communication network.
In GBM, intercellular interactions were predominantly centered around astrocytes, myeloid cells, neoplastic cells, and oligodendrocytes. The highest interaction frequency was noted between astrocytes and neoplastic cells (18 interactions), followed by oligodendrocytes and astrocytes (Figures 6A,B; Supplementary Figure S2A; Supplementary Table S5). The APOE and APP pathways were significantly enriched across multiple cell types, including astrocytes, oligodendrocytes, microglia, dendritic cells, and macrophages. Among these, APP-CD74 and APP-(TREM2 + TYROBP) accounted for the largest proportion of interactions (Figure 6C; Supplementary Figures S2B,C; Supplementary Table S5). Cell communication patterns were categorized into four outgoing and four incoming modes, with immune cells (e.g., microglia, dendritic cells, and macrophages) showing similar signaling profiles. Both astrocytes and oligodendrocytes were uniquely enriched for the APP pathway (Figures 6D–F and Supplementary Figures S2B,C).
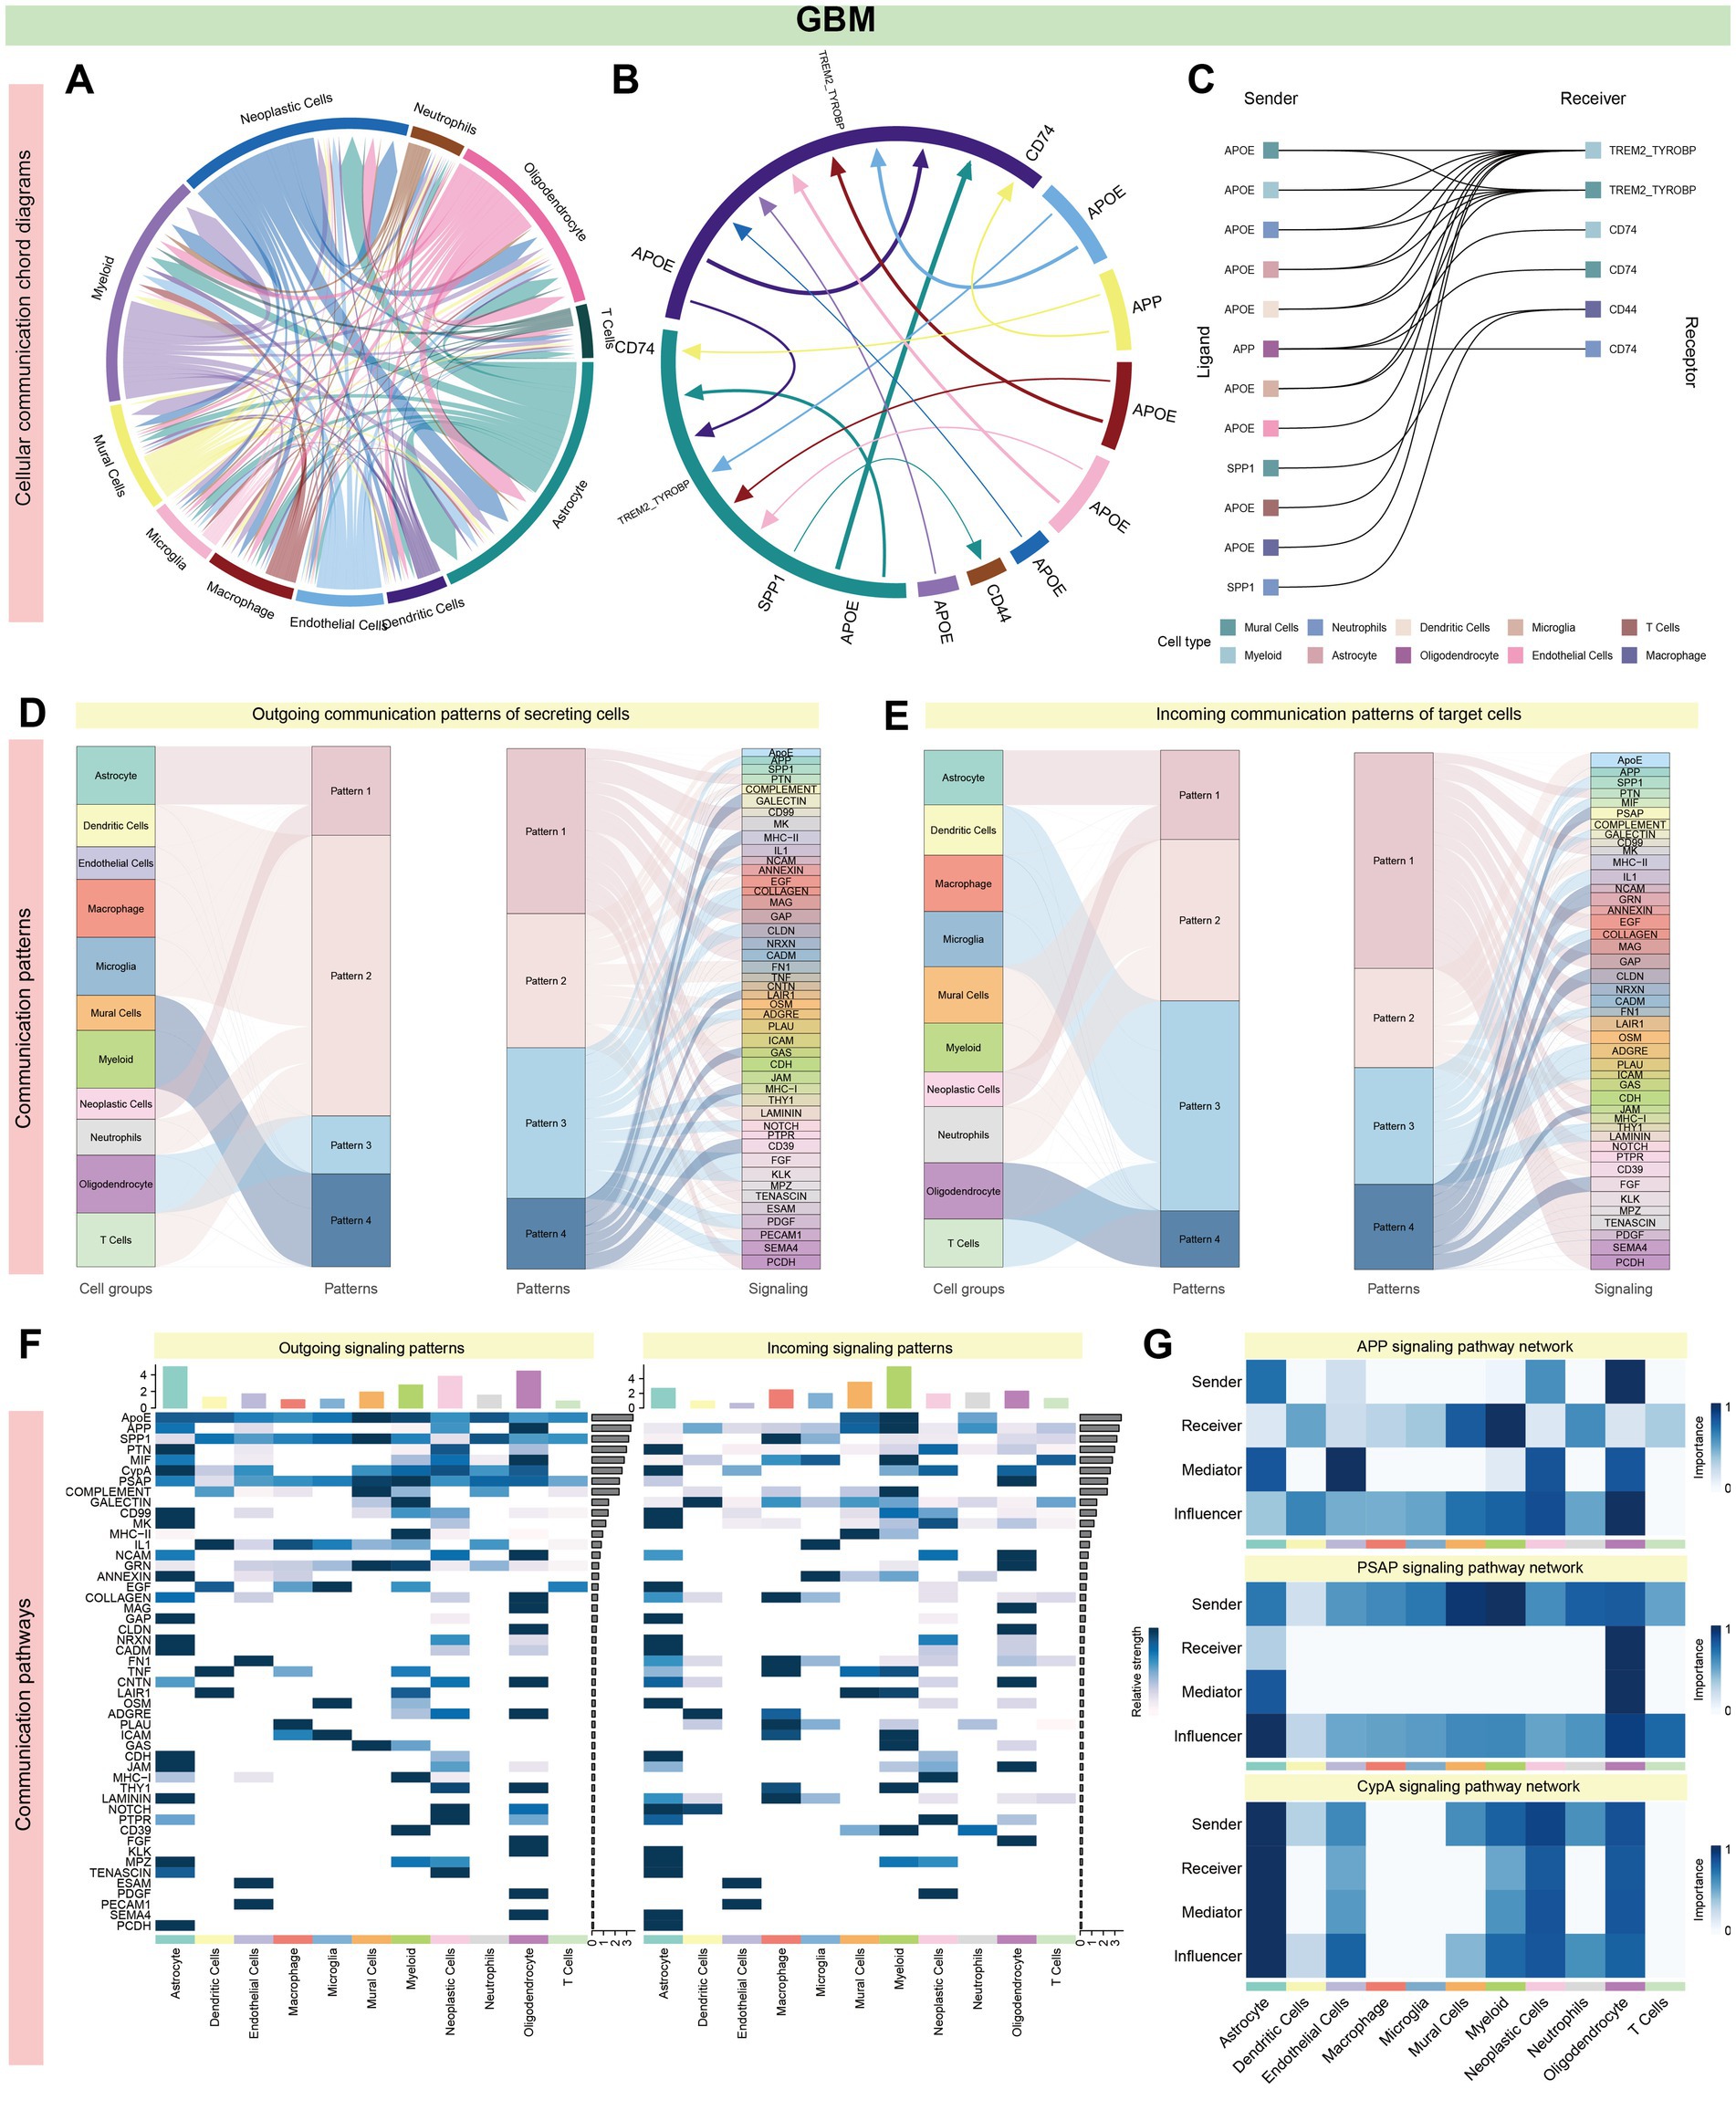
Figure 6. Systems analysis of cell–cell communication network in GBM single-cell data. (A,B) In GBM, Astrocytes, Myeloid Cells, Neoplastic Cells, and Oligodendrocytes exhibit particularly prominent intercellular interactions, as evidenced by high interaction counts (Astrocytes: 106 and 88, Myeloid Cells: 75 and 97, Neoplastic Cells: 100 and 78, Oligodendrocytes: 77 and 83). The most substantial interactions occur between Astrocytes and Neoplastic Cells, with Oligodendrocytes also showing significant interactions with both Astrocytes and Neoplastic Cells, each with 14 interactions. This suggests a key role for these cell types in the GBM cellular communication network. (C) A significant enrichment of the APOE or APP pathway is noted across various cell types, including Astrocytes, Oligodendrocytes, Microglia, Dendritic Cells, Macrophages, and T cells. Notably, the APP-CD74 and APP-(TREM2 + TYROBP) interactions constitute the majority of these pathway interactions. This prevalence suggests a central role for the APP pathway in the cellular interactions in GBM, potentially influencing disease progression and response to treatment (Supplementary Figures S2B,C). (D–F) All cell types display signaling patterns categorized into four distinct outgoing and four incoming patterns. Microglia and certain immune cells, such as Dendritic Cells, Macrophages, and T cells, exhibit similar signaling patterns, suggesting a coordinated immune response. In contrast, Astrocytes and Oligodendrocytes have unique transmission patterns, but both are enriched for the APP pathway, indicating a distinct role for these glial cells in disease pathology, potentially affecting tumor growth and therapy response [Figure 5G and panel (G)]. A total of 39 signaling pathways are enriched in AD, while 49 are enriched in GBM, with 23 pathways common to both. The APP pathway is the most significant, accounting for 24.7% of total interactions (705 out of 2,851), followed by the PSAP pathway, which represents 16.2% of interactions (462 out of 2,851). Other notable pathways include CypA, PTN, and NRNX, highlighting the APP pathway’s potential as a central mechanism in disease pathology.
In summary, 39 signaling pathways were enriched in AD and 49 in GBM, with 23 pathways shared between both conditions. The APP pathway emerged as the most significant (705/2851, 24.7%), followed by PSAP (462/2851, 16.2%), CypA (266/2851, 9.3%), PTN (252/2851, 8.8%), and NRXN (207/2851, 7.2%). Oligodendrocytes were key contributors to the APP signaling pathway (Figures 5G, 6G). Supplementary Figures S1, S2 illustrate specific receptor-ligand pairs across key cell types. The central roles of the NRXN and APP pathways in AD and GBM were highlighted, reflecting their distinct yet overlapping contributions to neuronal and neoplastic cells, respectively (Supplementary Figures S1D, 2D).
Gene expression analysis across four databases identified DEGs with the following up-and down-regulation counts: ROSMAP (up-regulated: 436, down-regulated: 1,267), ADNI (up-regulated: 25, down-regulated: 11), TCGA (up-regulated: 5,125, down-regulated: 5,121), and CGGA (up-regulated: 84, down-regulated: 33). The 10 most significantly up-and down-regulated genes were depicted in Figures 7A,C,E,G. The TCGA dataset demonstrated the most pronounced gene expression differences, whereas the ADNI dataset exhibited the fewest.
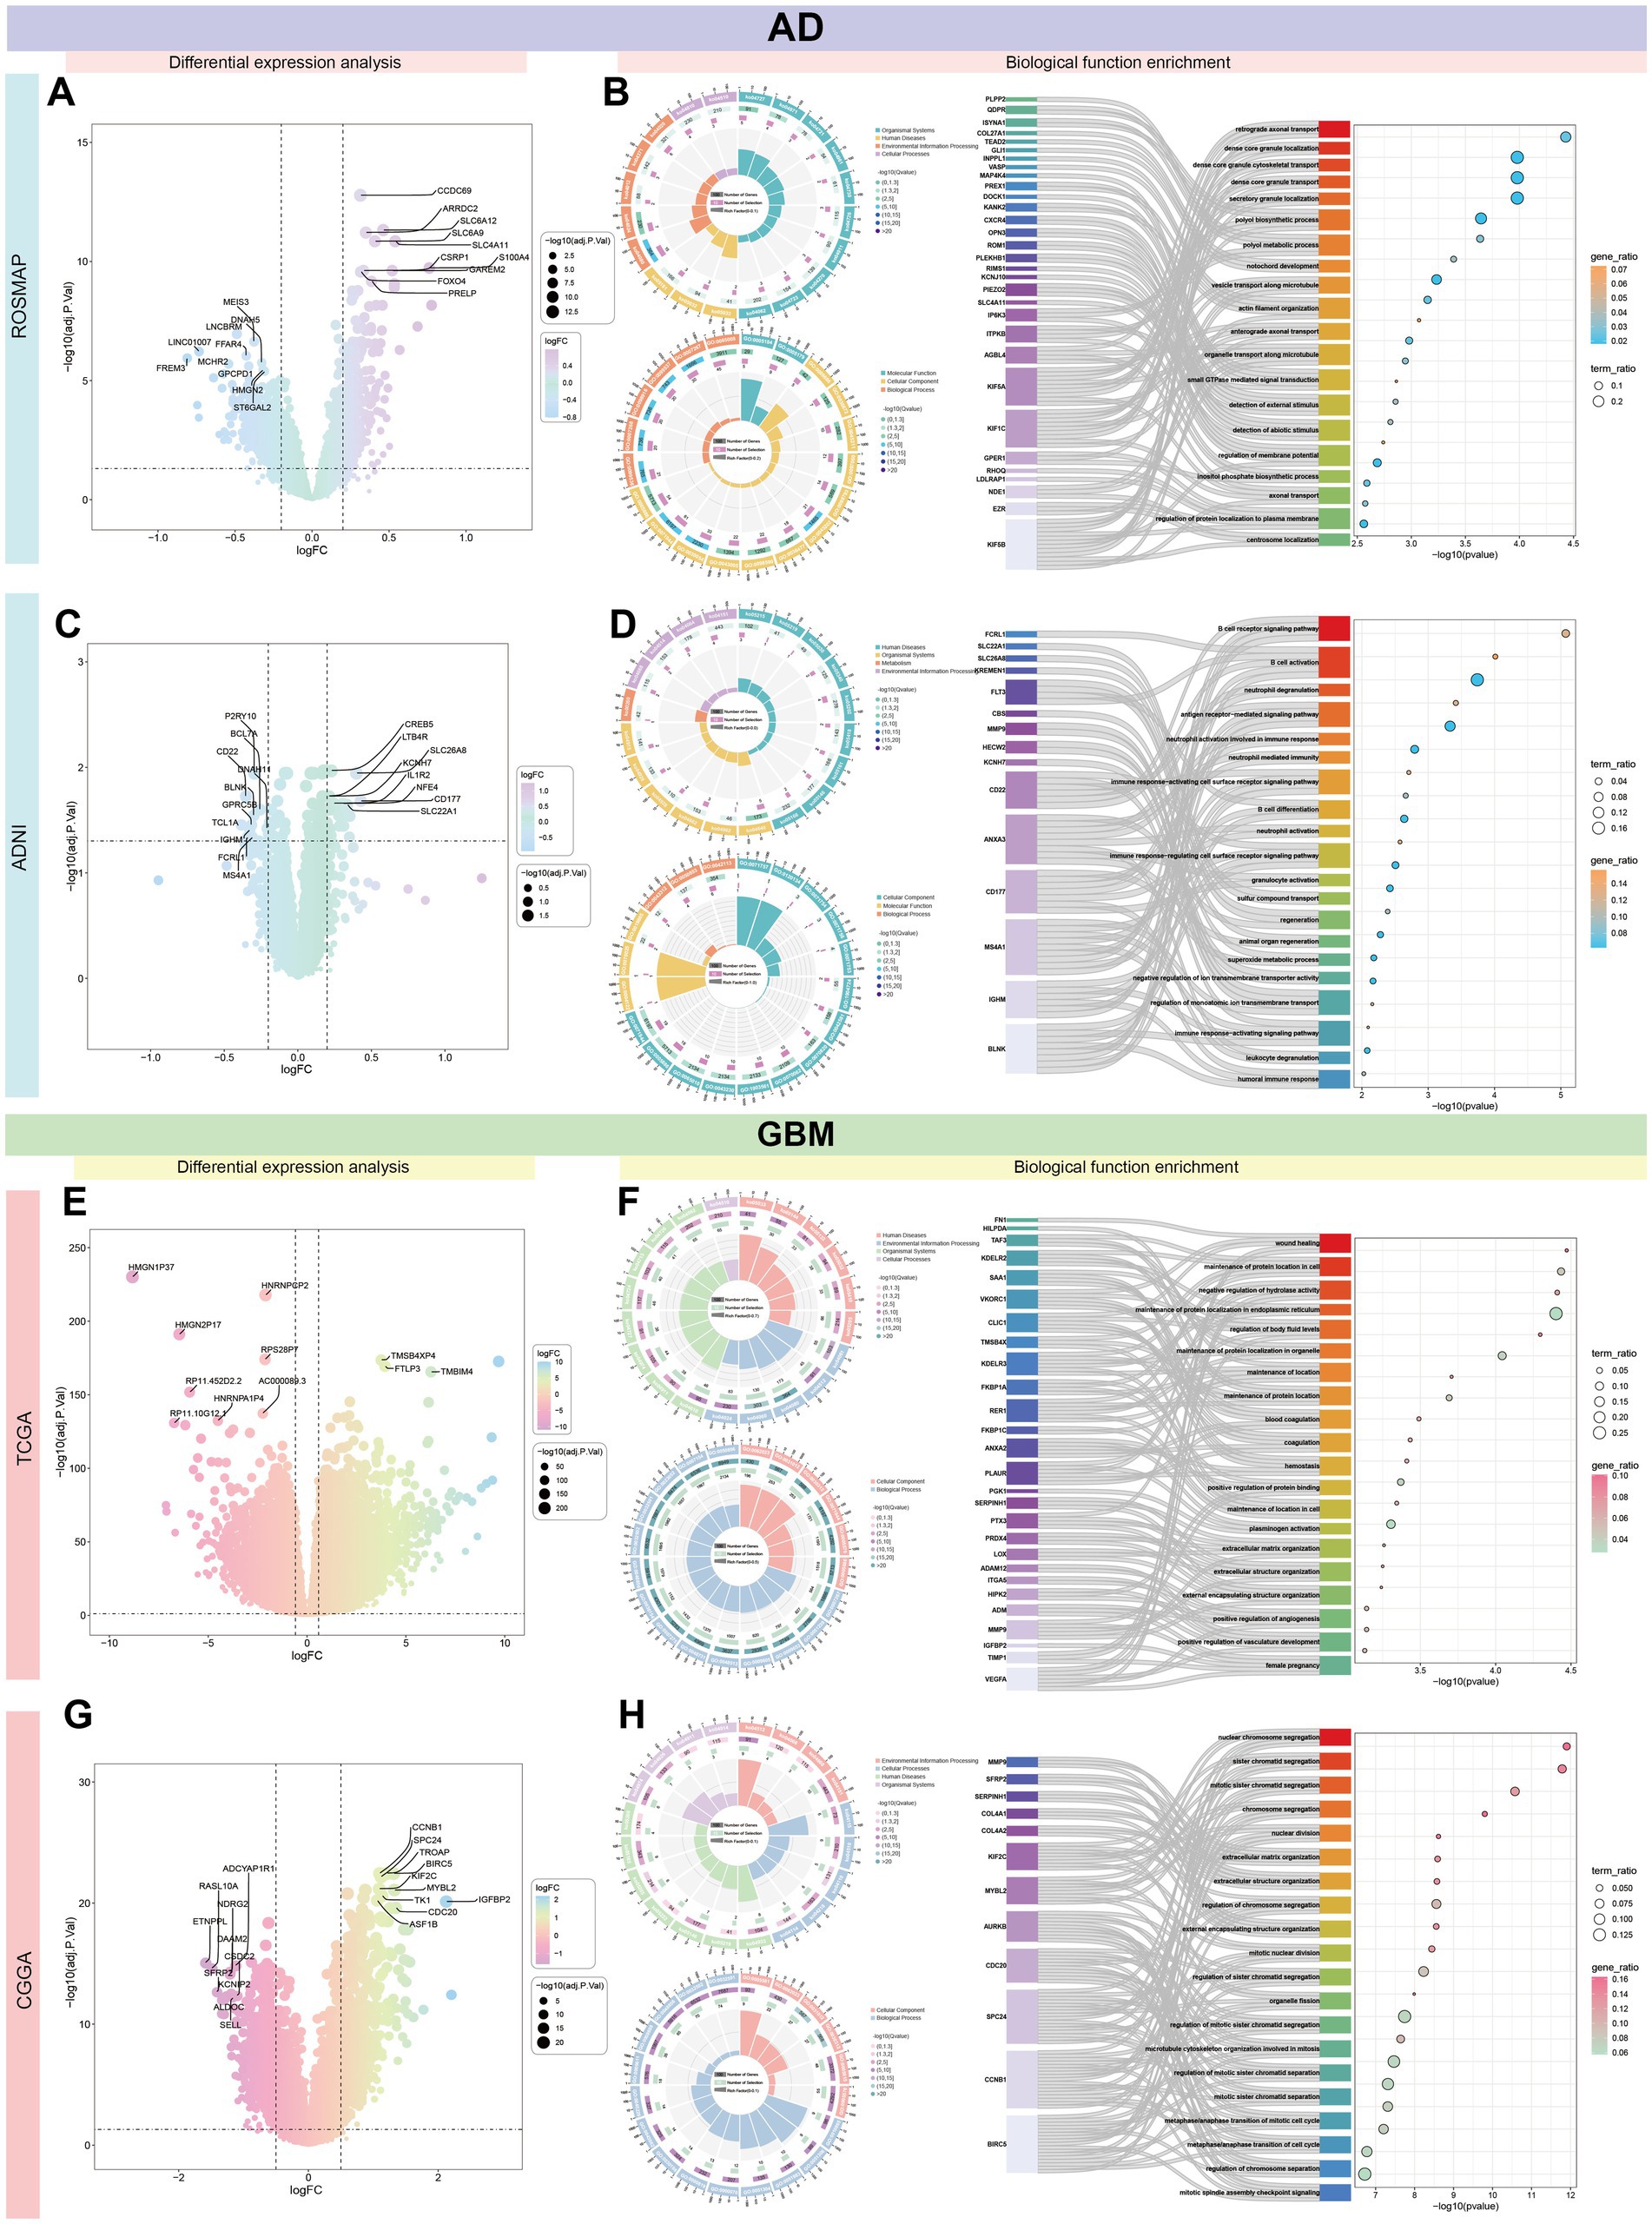
Figure 7. Comprehensive transcriptomic characterization of AD and GBM. This figure presents a comprehensive gene expression analysis across four distinct databases—ROSMAP, ADNI, TCGA, and CGGA—comparing differentially expressed genes in AD and GBM. The analysis highlights a significant variation in the number of up-and down-regulated genes among the datasets: ROSMAP (A) displays 436 up-regulated and 1,267 down-regulated genes, ADNI (C) shows 25 up-regulated and 11 down-regulated genes, TCGA (E) exhibits 5,125 up-regulated and 5,121 down-regulated genes, and CGGA (G) shows 84 up-regulated and 33 down-regulated genes. The 10 most significantly up-and down-regulated genes are illustrated for each database, with TCGA demonstrating the most substantial differences in gene expression and ADNI showing the least, suggesting a diverse molecular landscape across patient cohorts. The ROSMAP dataset (B) indicates that differential genes are predominantly involved in nuclear chromosome segregation, suggesting roles in cell division and genomic stability. In contrast, the ADNI dataset (D) reveals that differential genes are primarily associated with immune-related processes, such as B cell activation and signaling pathways (Supplementary Figures S3A,B,E–F), emphasizing the involvement of immune mechanisms in AD pathogenesis. For GBM, the TCGA (F) and CGGA (H) datasets show that differential genes are mainly implicated in protein localization and assembly, and chromosome segregation and mitotic processes (Supplementary Figures S3C,D,G–H), indicating a significant impact on tumor growth and progression, which could influence therapeutic strategies. The differential gene expression patterns observed across these databases provide valuable insights into the molecular mechanisms underlying AD and GBM, emphasizing the heterogeneity in disease pathology and the necessity for tailored therapeutic approaches. Understanding these patterns can guide the development of targeted therapies and personalized medicine strategies, ultimately aiming to improve patient outcomes.
Functional analysis of DEGs in the ROSMAP dataset revealed significant enrichment in nuclear chromosome segregation. In contrast, DEGs in the ADNI dataset were primarily associated with immune-related functions, particularly B cell activation and signaling pathways (Figures 7B,D and Supplementary Figures S3A,B,E–H). For GBM, differential gene expression analysis indicated that TCGA genes were enriched in protein localization and assembly, while CGGA genes were largely involved in chromosome segregation and mitotic processes (Figures 7F,H and Supplementary Figures S3C,D,G,H).
When consolidating all differential expression analyses, the most common enrichments were found in cellular processes, binding activities, and cellular anatomical structures. KEGG pathway analysis identified significant shared enrichment across signaling pathways. Genes up-regulated in both AD and GBM were enriched in mitosis, osteoblast morphogenesis, and protein-localized transcriptional maintenance. In contrast, down-regulated genes were most significantly associated with nuclear transcription, synaptic signaling, and calcium ion transport (Supplementary Figure S4).
Using differentially expressed genes from each cell type in AD and GBM single-cell datasets, we implemented a screening process utilizing ten distinct machine learning algorithms. To investigate the impact of mitochondria-related genes, we compared mitochondrial epistasis genes with mitochondrial localization genes based on previous studies (Xu et al., 2022, 2024). Our analysis identified 275 cell-specific mitochondrial epistasis genes (MT-Inter) and 94 cell-specific mitochondrial localization genes (MT-Locate) (Supplementary Tables S6, S7). The predictive potential and variable significance of these genes were evaluated using gene expression data from four databases: ROSMAP, ADNI, TCGA, and CGGA. The models were assessed using seven performance metrics: Area Under the Curve (AUC), Confusion Entropy (CE), Accuracy (ACC), Precision, Recall, Sensitivity, and Specificity.
For AD, Random Forest algorithm using mitochondrial localization genes from ROSMAP showed the highest predictive efficiency (AUC = 0.8). In the ADNI database, the KNN algorithm, using mitochondrial epistasis-related genes, achieved the best predictive performance (AUC = 0.82). Focusing on GBM, within the TCGA dataset, the Classification Tree’s AUC fell just below 0.9 (TCGA-Locate AUC = 0.88, TCGA-Inter AUC = 0.84), while all other models showed exceptionally high results, with AUCs surpassing 0.95. Notably, the TCGA-Locate model achieved the highest AUC score of 0.99. In the CGGA dataset, the Random Forest-based CGGA-Inter model emerged as the most effective (AUC = 0.77) (Figure 8 and Supplementary Table S8).
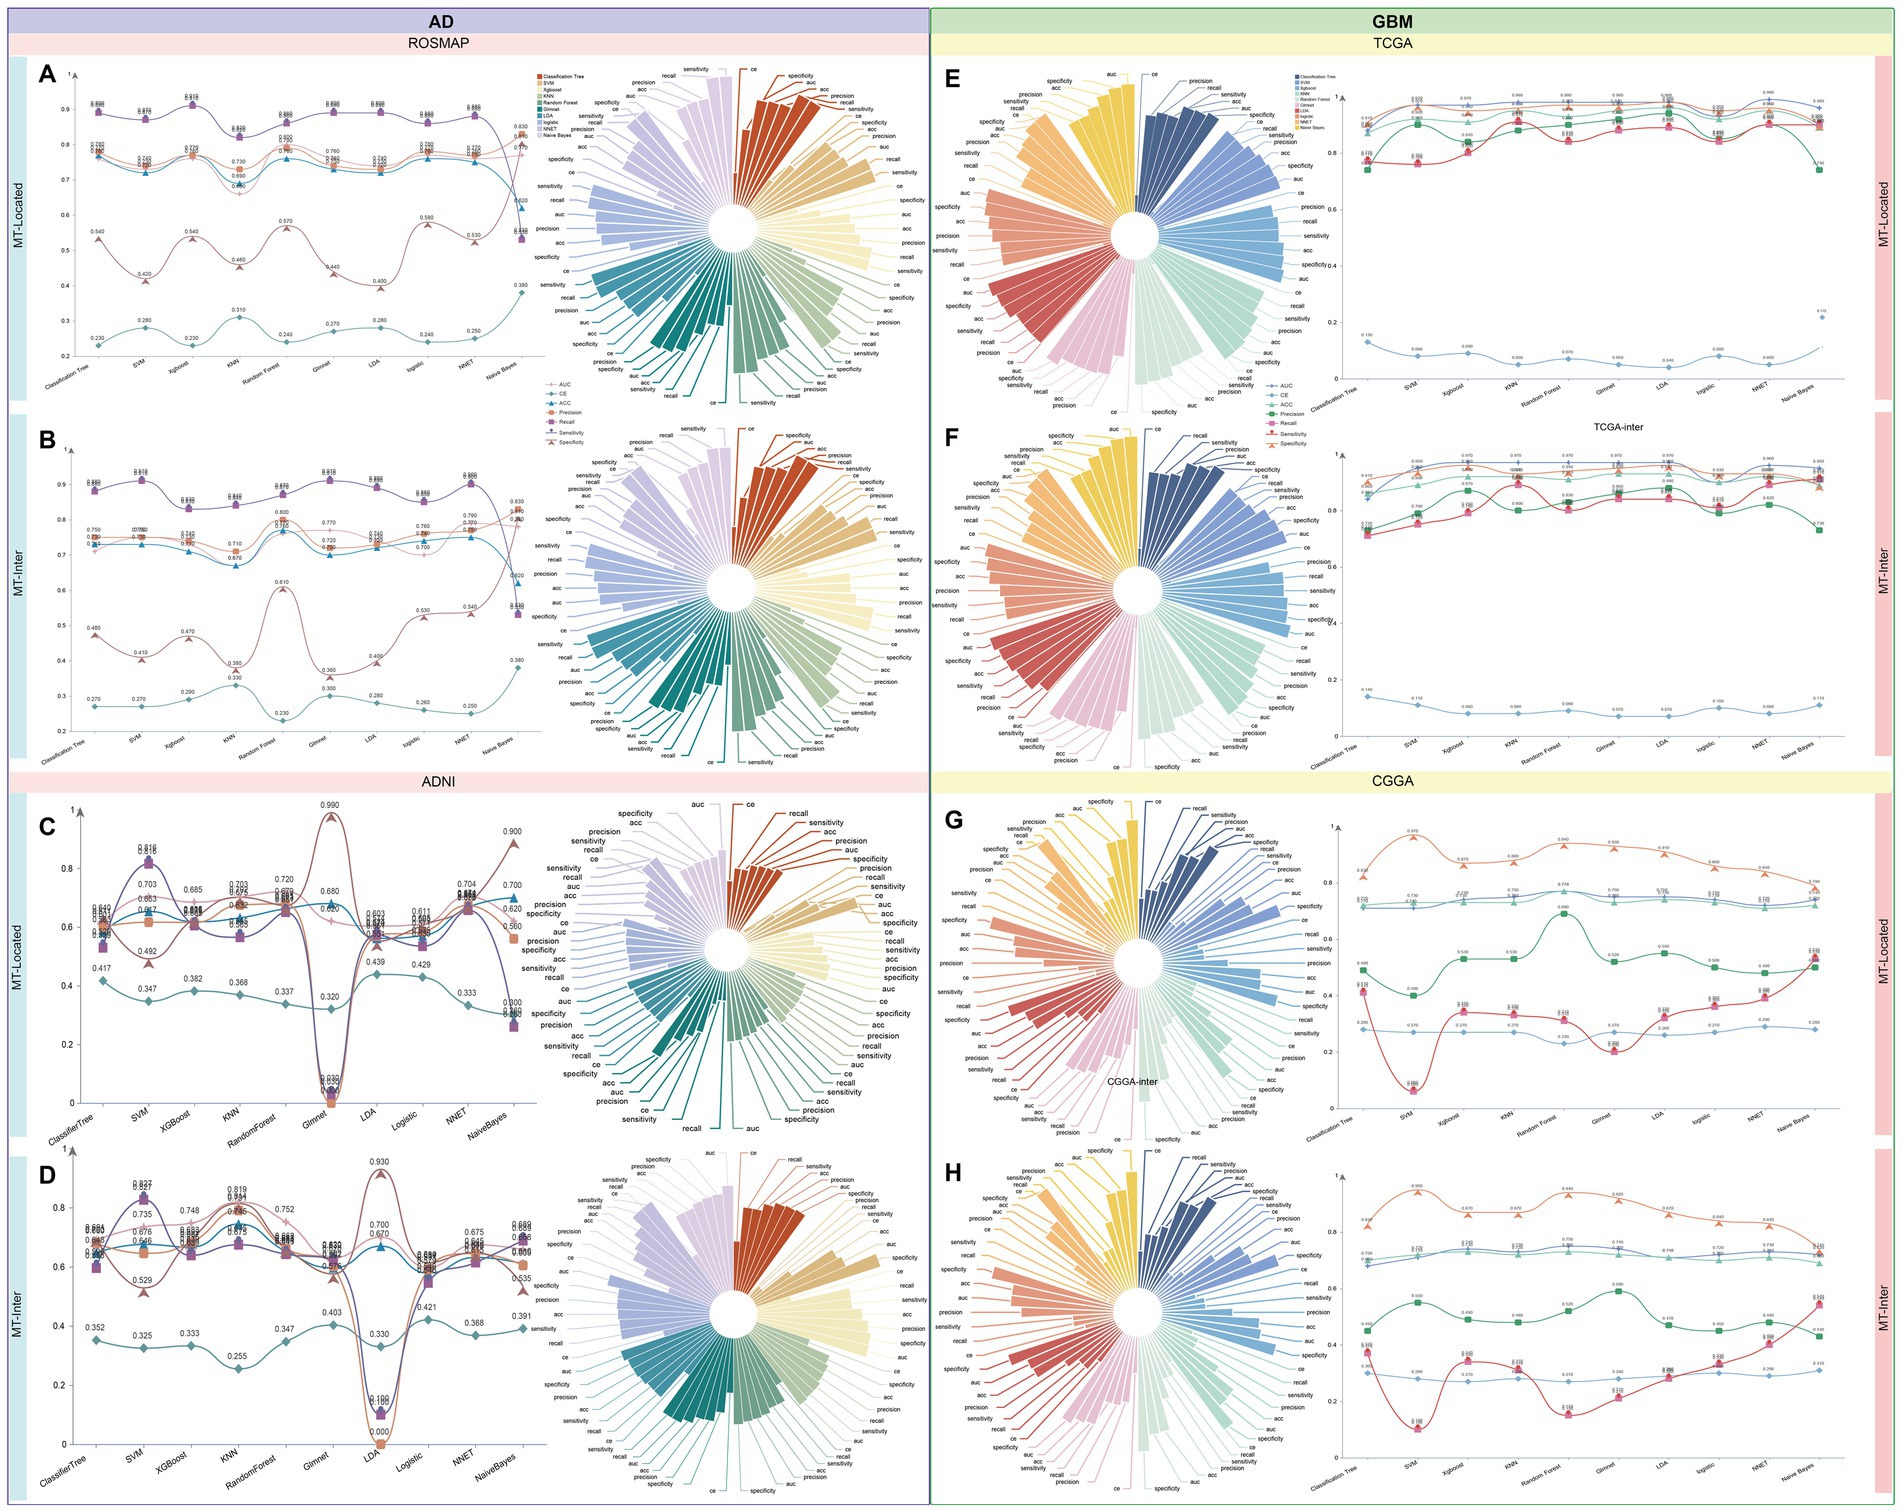
Figure 8. Machine learning-driven identification of mitochondria-associated markers in AD and GBM. We employed a panel of 10 distinct machine learning algorithms to screen differentially expressed genes identified for each cell type. Our analysis contrasted mitochondrial epistasis-related genes and mitochondrial localization genes, building upon our prior research (Xu et al., 2022, 2024). The analysis yielded 275 cell-specific mitochondrial epistasis genes (MT-Inter) and 95 cell-specific mitochondrial localization genes (MT-Locate). The predictive potential and variable significance of these genes were appraised using gene expression data from four databases: ROSMAP, ADNI, TCGA, and CGGA. Model evaluation was conducted through seven metrics, including Area Under the Curve (AUC), Confusion Entropy (CE), Accuracy (ACC), Precision, Recall, Sensitivity, and Specificity. (A–D) In AD, the ROSMAP database’s mitochondrial localization genes, as determined by the Random Forest algorithm, showed the highest predictive efficiency (AUC = 0.8). The KNN algorithm, applied to mitochondrial epistasis-related genes in the ADNI database, demonstrated superior predictive performance (AUC = 0.82). (E–H) In GBM, the TCGA dataset’s Classification Tree model had an AUC just below 0.9 (TCGA-Locate AUC = 0.88, TCGA-Inter AUC = 0.84), with other models achieving AUCs over 0.95. Notably, the TCGA-Locate model achieved the highest AUC score of 0.99. In the CGGA dataset, the Random Forest-based CGGA-Inter model was the most effective, with an AUC of 0.77. These findings highlight the value of machine learning algorithms in identifying and predicting mitochondria-associated cell-specific markers, offering insights into the molecular foundations of AD and GBM and aiding in the development of targeted therapeutic strategies.
Integrating variable importance from the top three predictive models allowed us to identify key markers within the MT-Inter and MT-Locate categories for each of the four datasets: ADNI (9/5), ROSMAP (25/16), and CGGA (39/49). For the TCGA dataset, the top 50 marker genes were selected. Network analysis revealed significant intersections among gene sets, with the TCGA-Locate and CGGA-Locate models showing the highest number of shared genes (17) (Supplementary Figure S5 and Supplementary Table S9). Notably, ERBB4 was a significant contributor across RUSH-Locate, CGGA-Locate, TCGA-Locate, and CGGA-Inter models.
By compiling biomarkers of high importance, we curated a list of 24 candidate cell-specific mitochondria-associated markers, each demonstrating significant contributions in at least one dataset for both AD and GBM (Supplementary Table S10). Among them, 16 were classified as mitochondrial epistasis genes, and 13 as mitochondrial localization genes. Five genes, ERBB4, ABAT, FAM110B, MAPK10, and PRKCA, were classified as both mitochondrial epistasis and mitochondrial localization genes. Their distinct expression patterns across different cell types of AD and GBM were illustrated in Supplementary Figures S6, S7. These candidate marker genes were predominantly expressed in oligodendrocytes and neoplastic cells, with distinct distribution patterns across neural cells in AD and GBM compared to immune cells. Particularly, significant disparities in expression were noted between astrocytes and oligodendrocytes.
Immune cell interactions with the tumor microenvironment (TME) are crucial for influencing tumor development, metastasis, and treatment response. We analyzed methylation data from four datasets to determine the distribution of 24 candidate genes in seven immune cell types. In the ROSMAP dataset, significant positive correlations were observed between the expression of SNN, LIMCH1, and MAPK10 with monocytes and eosinophils, while negative correlations were noted with B-cells, NK-cells, and CD4+ T-cells. In the ADNI dataset, ERBB3, LIMCH1, and SACS showed strong positive correlations with NK-cells and CD8+ T-cells, while CYCS, SLC25A18, and MAPK10 were negatively correlated with NK-cells and CD8+ T-cells (Figures 9A,B).
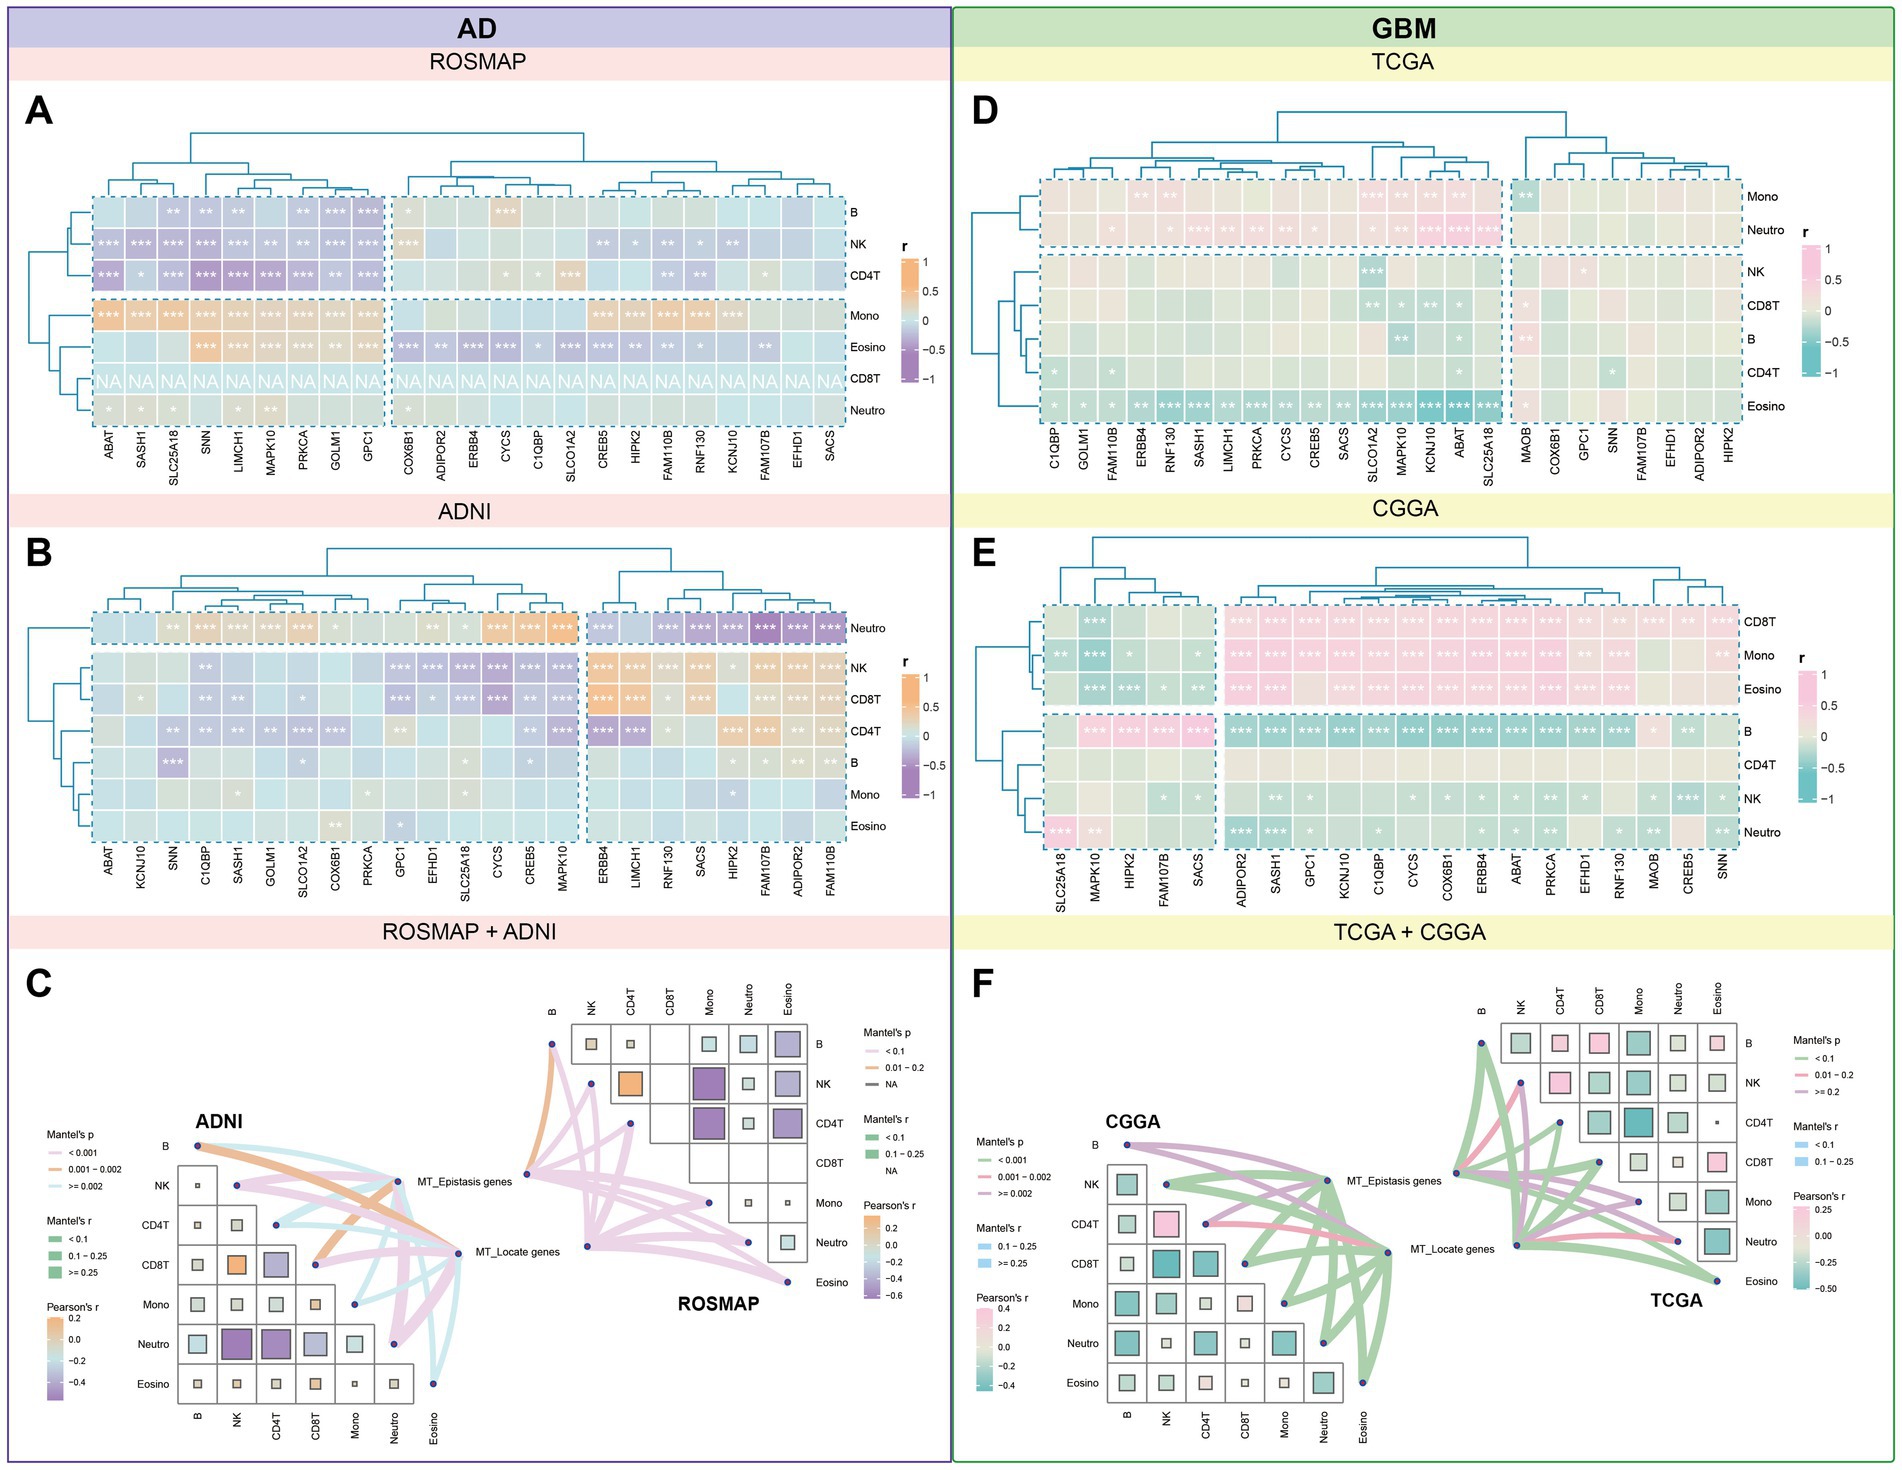
Figure 9. Correlational landscape of immune cell-gene expression in AD and GBM. We conducted an analysis of the intricate interactions between immune cells and the tumor microenvironment (TME) in the context of AD and GBM, as deduced from methylation data. We observed significant correlations between the expression of candidate genes and the abundance of various immune cell types. (A) In AD, the ROSMAP database showed positive correlations between genes SNN, LIMCH1, and MAPK10 with monocytes and eosinophils, while these genes were negatively correlated with B cells, natural killer (NK) cells, and CD4+ T cells. (B) The ADNI database revealed a positive correlation between ERBB3, LIMCH1, and SACS with NK-cells and CD8+ T-cells, while CYCS, SLC25A18, and MAPK10 exhibited negative associations with these cell types. In GBM, (D) the TCGA dataset indicated that ABAT, KCNJ10, and SLC25A18 were positively associated with monocytes and neutrophils, while they were negatively correlated with eosinophils. (E) The CGGA dataset demonstrated significant positive correlations for ADIPOR2, SASH1, and KCNJ10 with CD8+ T-cells, monocytes, and eosinophils, and a strong negative correlation with B-cells. (C,F) Further categorization of these genes into mitochondrial epistasis and mitochondrial localization genes revealed distinct correlation patterns. (C) In AD, mitochondrial epistasis genes showed significant positive correlations with NK cells and neutrophils, while mitochondrial localization genes were most strongly associated with neutrophils. (F) In GBM, both types of genes displayed strong associations with eosinophils, CD4+ T cells, and CD8+ T cells, with the highest positive correlations observed for NK cells and CD4+ T cells. These findings provide valuable insights into the complex interplay between immune cells and the TME in AD and GBM, highlighting the potential role of mitochondrial genes in modulating immune responses within these diseases.
In GBM, TCGA methylation data indicated that ABAT, KCNJ10, and SLC25A18 had significant positive associations with monocytes and neutrophils, while negative associations were noted with eosinophils. In the CGGA dataset, ADIPOR2, SASH1, and KCNJ10 demonstrated significant positive correlations with CD8+ T-cells, monocytes, and eosinophils, along with a strong negative correlation with B-cells (Figures 9D,E).
Categorizing these genes into mitochondrial epistasis and localization genes revealed distinct correlation patterns. In AD datasets, mitochondrial epistasis genes showed the strongest positive correlation with NK cells and neutrophils. Mitochondrial localization genes were most strongly associated with neutrophils, while significant positive correlations were also observed with NK cells, CD4+ T-cells (ROSMAP), and CD8+ T-cells (ADNI). In GBM datasets, a combination of mitochondrial epistasis and localization genes exhibited strong correlations with eosinophils, CD4+ T-cells, and CD8+ T-cells, with NK cells and CD4+ T-cells showing the most prominent positive associations (Figures 9C,F).
Survival analysis of 24 candidate genes across four datasets revealed significant differences in AD and GBM risk (p < 0.0001). Multi-gene Cox regression analysis identified significant genes (p < 0.05) in each dataset: ROSMAP (13 genes), ADNI (3 genes), TCGA (8 genes), and CGGA (11 genes) (Supplementary Table S11). Key genes with the most pronounced effects on disease risk were identified for each dataset: in TCGA, LIMCH1 (HR = 0.46, p = 2.27 × 10⁻⁹); in CGGA, CREB5 (HR = 1.02, p = 6.91 × 10⁻⁸); in ROSMAP, SACS (HR = 12.87, p = 3.51 × 10⁻⁵), and in ADNI, GPC1 (HR = 0.30, p = 2.27 × 10⁻⁹). Among these significant genes, CYCS, FAM110B, GOLM1, and SLC25A18 demonstrated opposing effects on disease risk in AD and GBM, increasing risk in one while decreasing it in the other. In contrast, EFHD1, LIMCH1, MAOB, COX6B1, SASH1, and SNN consistently contributed to disease risk in both AD and GBM (Figure 10). Further screening of integrated gene expression data revealed four genes—EFHD1, SASH1, FAM110B, and SLC25A18—that were differentially expressed in both AD and GBM (Supplementary Figure S8).
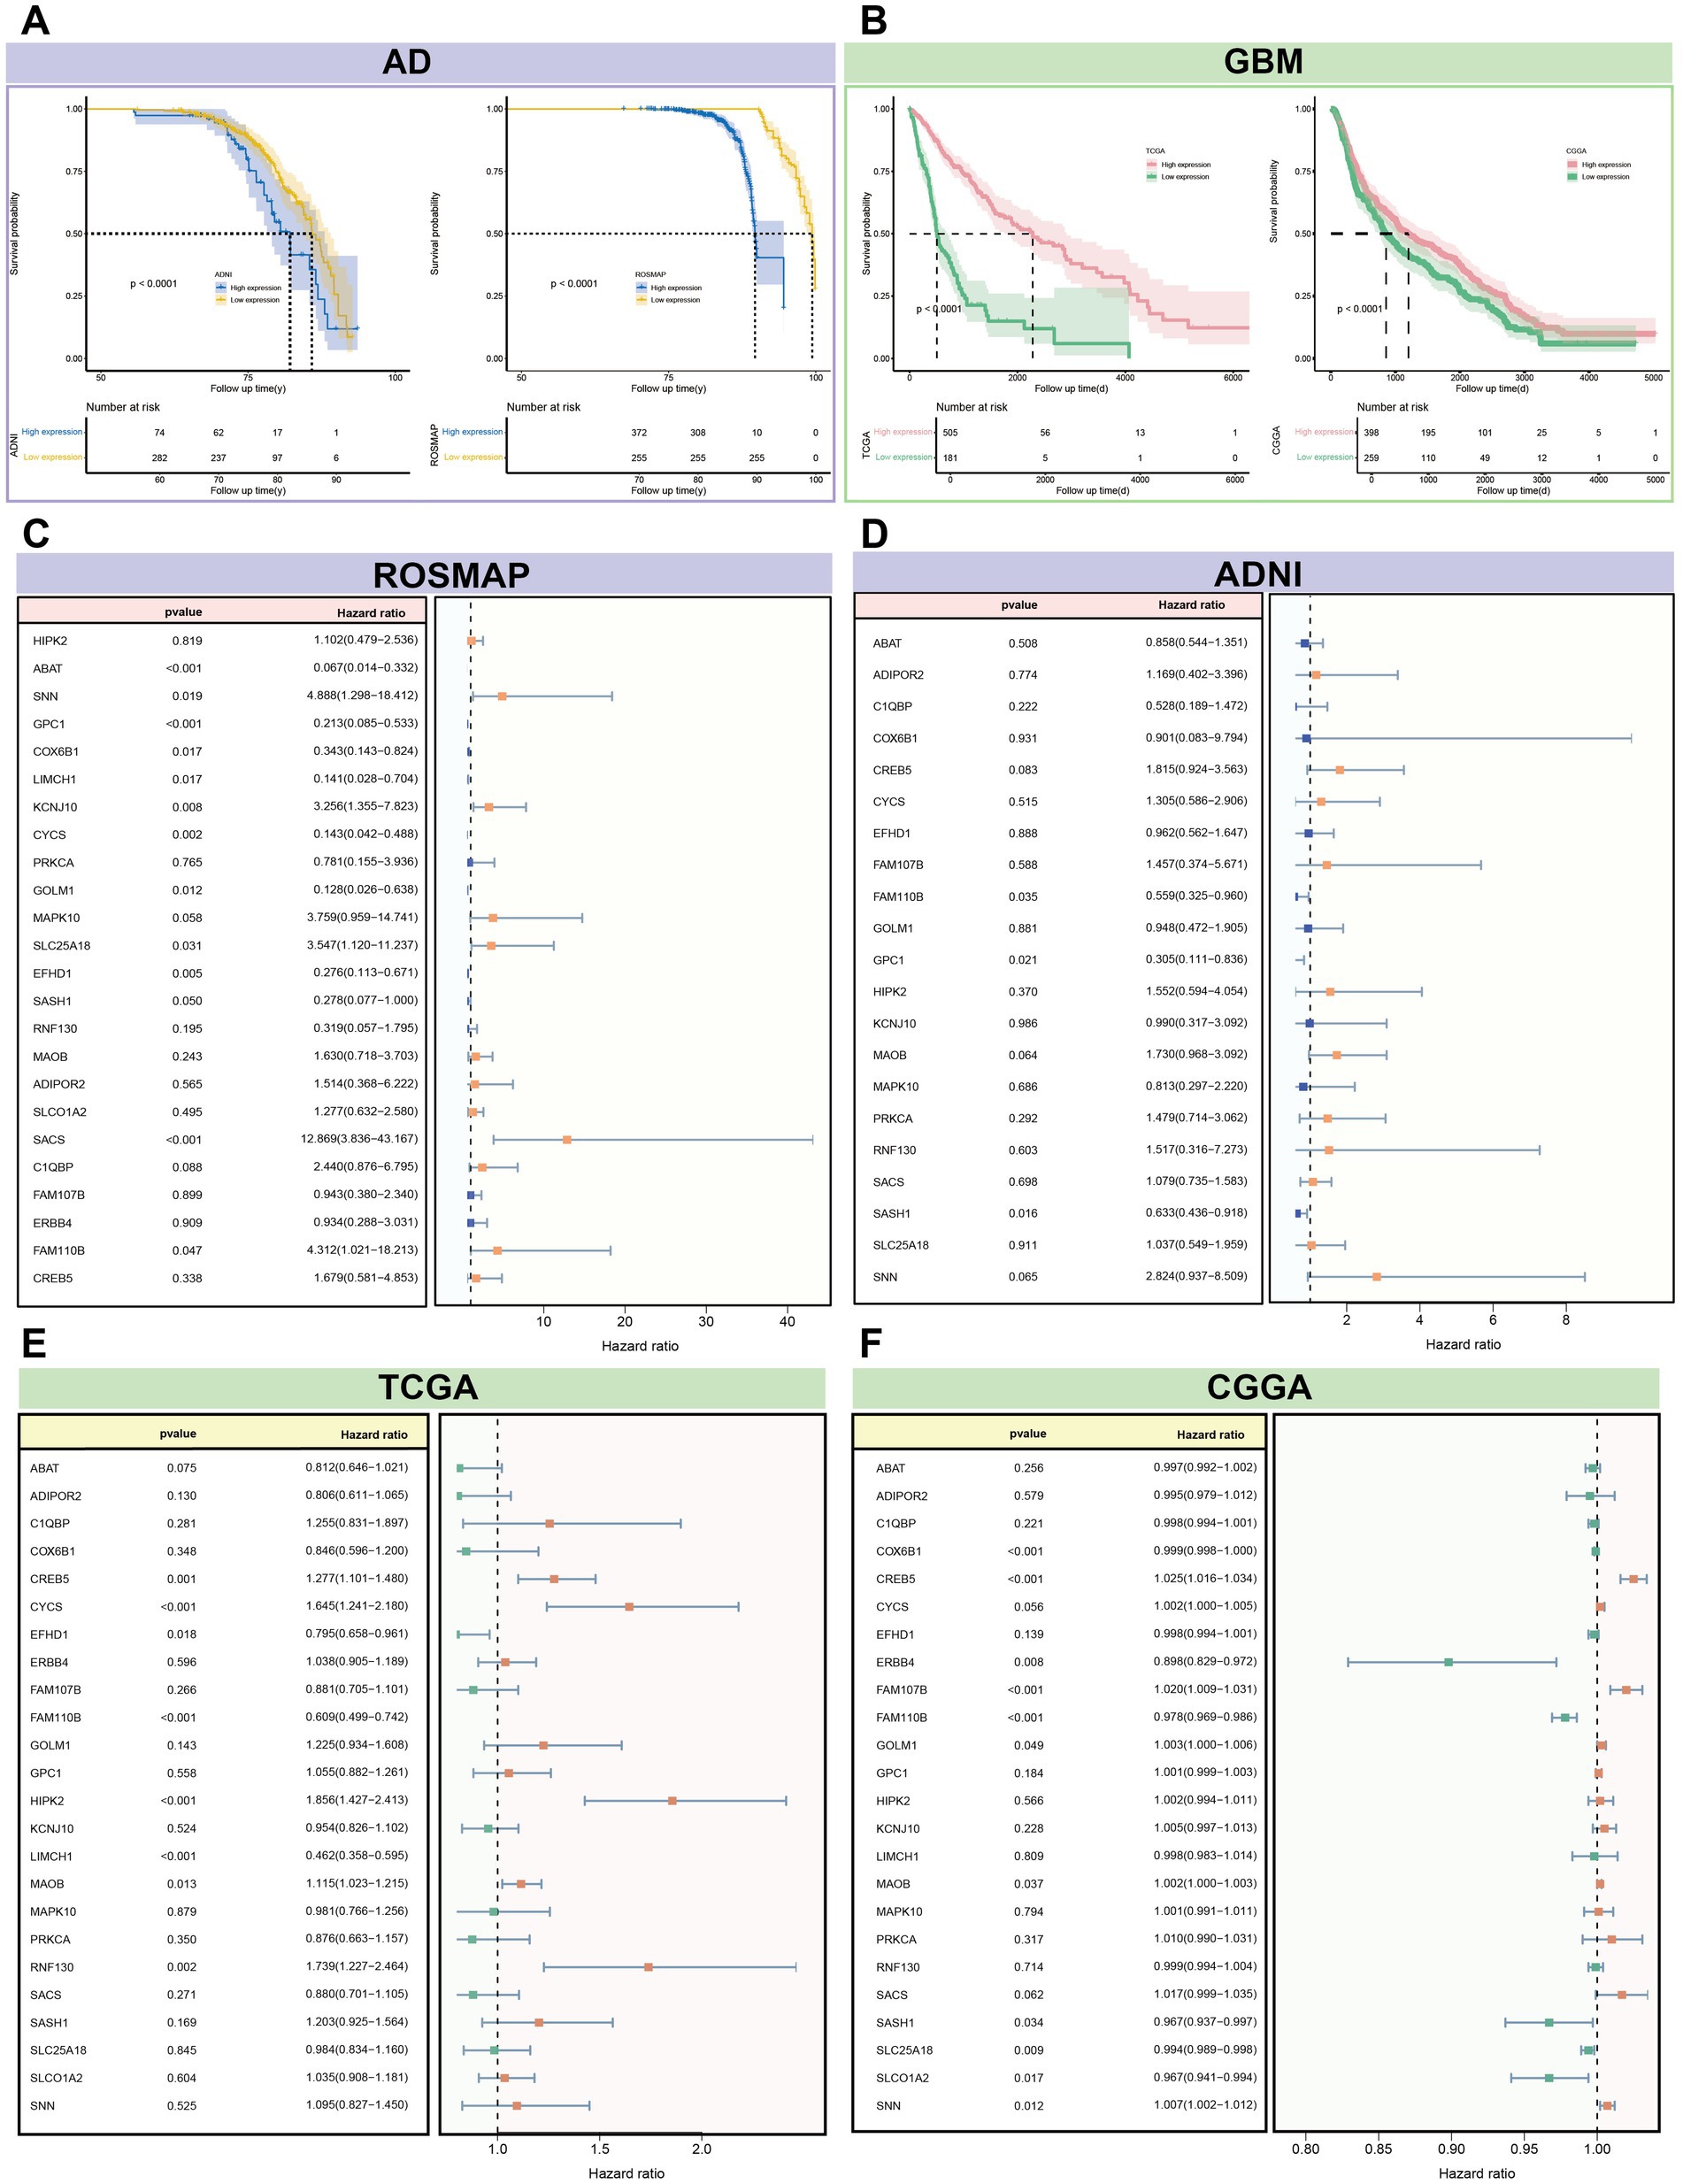
Figure 10. Survival analysis of 24 candidate genes associated with the risk of AD and GBM. (A,B) The survival curves for these genes revealed significant differentiation in disease risk, with a p-value threshold of less than 0.0001, indicating a profound impact on disease prognosis. The Cox regression analysis, accounting for multiple gene contributions, identified genes with significant associations (p < 0.05) in each dataset: (C) ROSMAP with 13 genes, (D) ADNI with 3 genes, (E) TCGA with 8 genes, and (F) CGGA with 11 genes. Notable genes with the most substantial impact on disease risk include LIMCH1 from the TCGA dataset for GBM (Hazard Ratio [HR] = 0.46, p = 2.27 × 10⁻⁹) and SACS from the ROSMAP dataset for AD (HR = 12.87, p = 3.51 × 10⁻⁵). Additionally, GPC1 from the ADNI dataset showed a significant association with AD risk (HR = 0.30, p = 2.27 × 10⁻⁹), while CREB5 from the CGGA dataset was notably associated with GBM risk (HR = 1.02, p = 6.91 × 10⁻⁸). The analysis also highlighted genes with opposing effects on disease risk between AD and GBM, such as CYCS, FAM110B, GOLM1, and SLC25A18. These genes may increase the risk of one disease while decreasing the risk of the other, suggesting distinct pathophysiological roles. Conversely, EFHD1, LIMCH1, MAOB, COX6B1, SASH1, and SNN demonstrated consistent contributions to risk across both diseases, indicating a shared molecular mechanism that could be targeted for therapeutic intervention. The integrated analysis underscores the complexity of gene expression patterns associated with AD and GBM risk and provides a foundation for further investigation into the molecular determinants of disease prognosis and treatment response.
Single-cell level analysis using the CancerSEA database (Yuan et al., 2019) revealed significant correlations between four candidate genes and functional states of high-grade gliomas (HGG) in the central nervous system (CNS). Notably, EFHD1 and SLC25A18 exhibited strong positive correlations with cellular processes related to the cell cycle (Cor = 0.368/0.385, P < =0.001), whereas SASH1 and FAM110B were found to be closely associated with tumor stemness (Cor =0.328/0.427, P < =0.001) (Figures 11A–D and Supplementary Table S12).
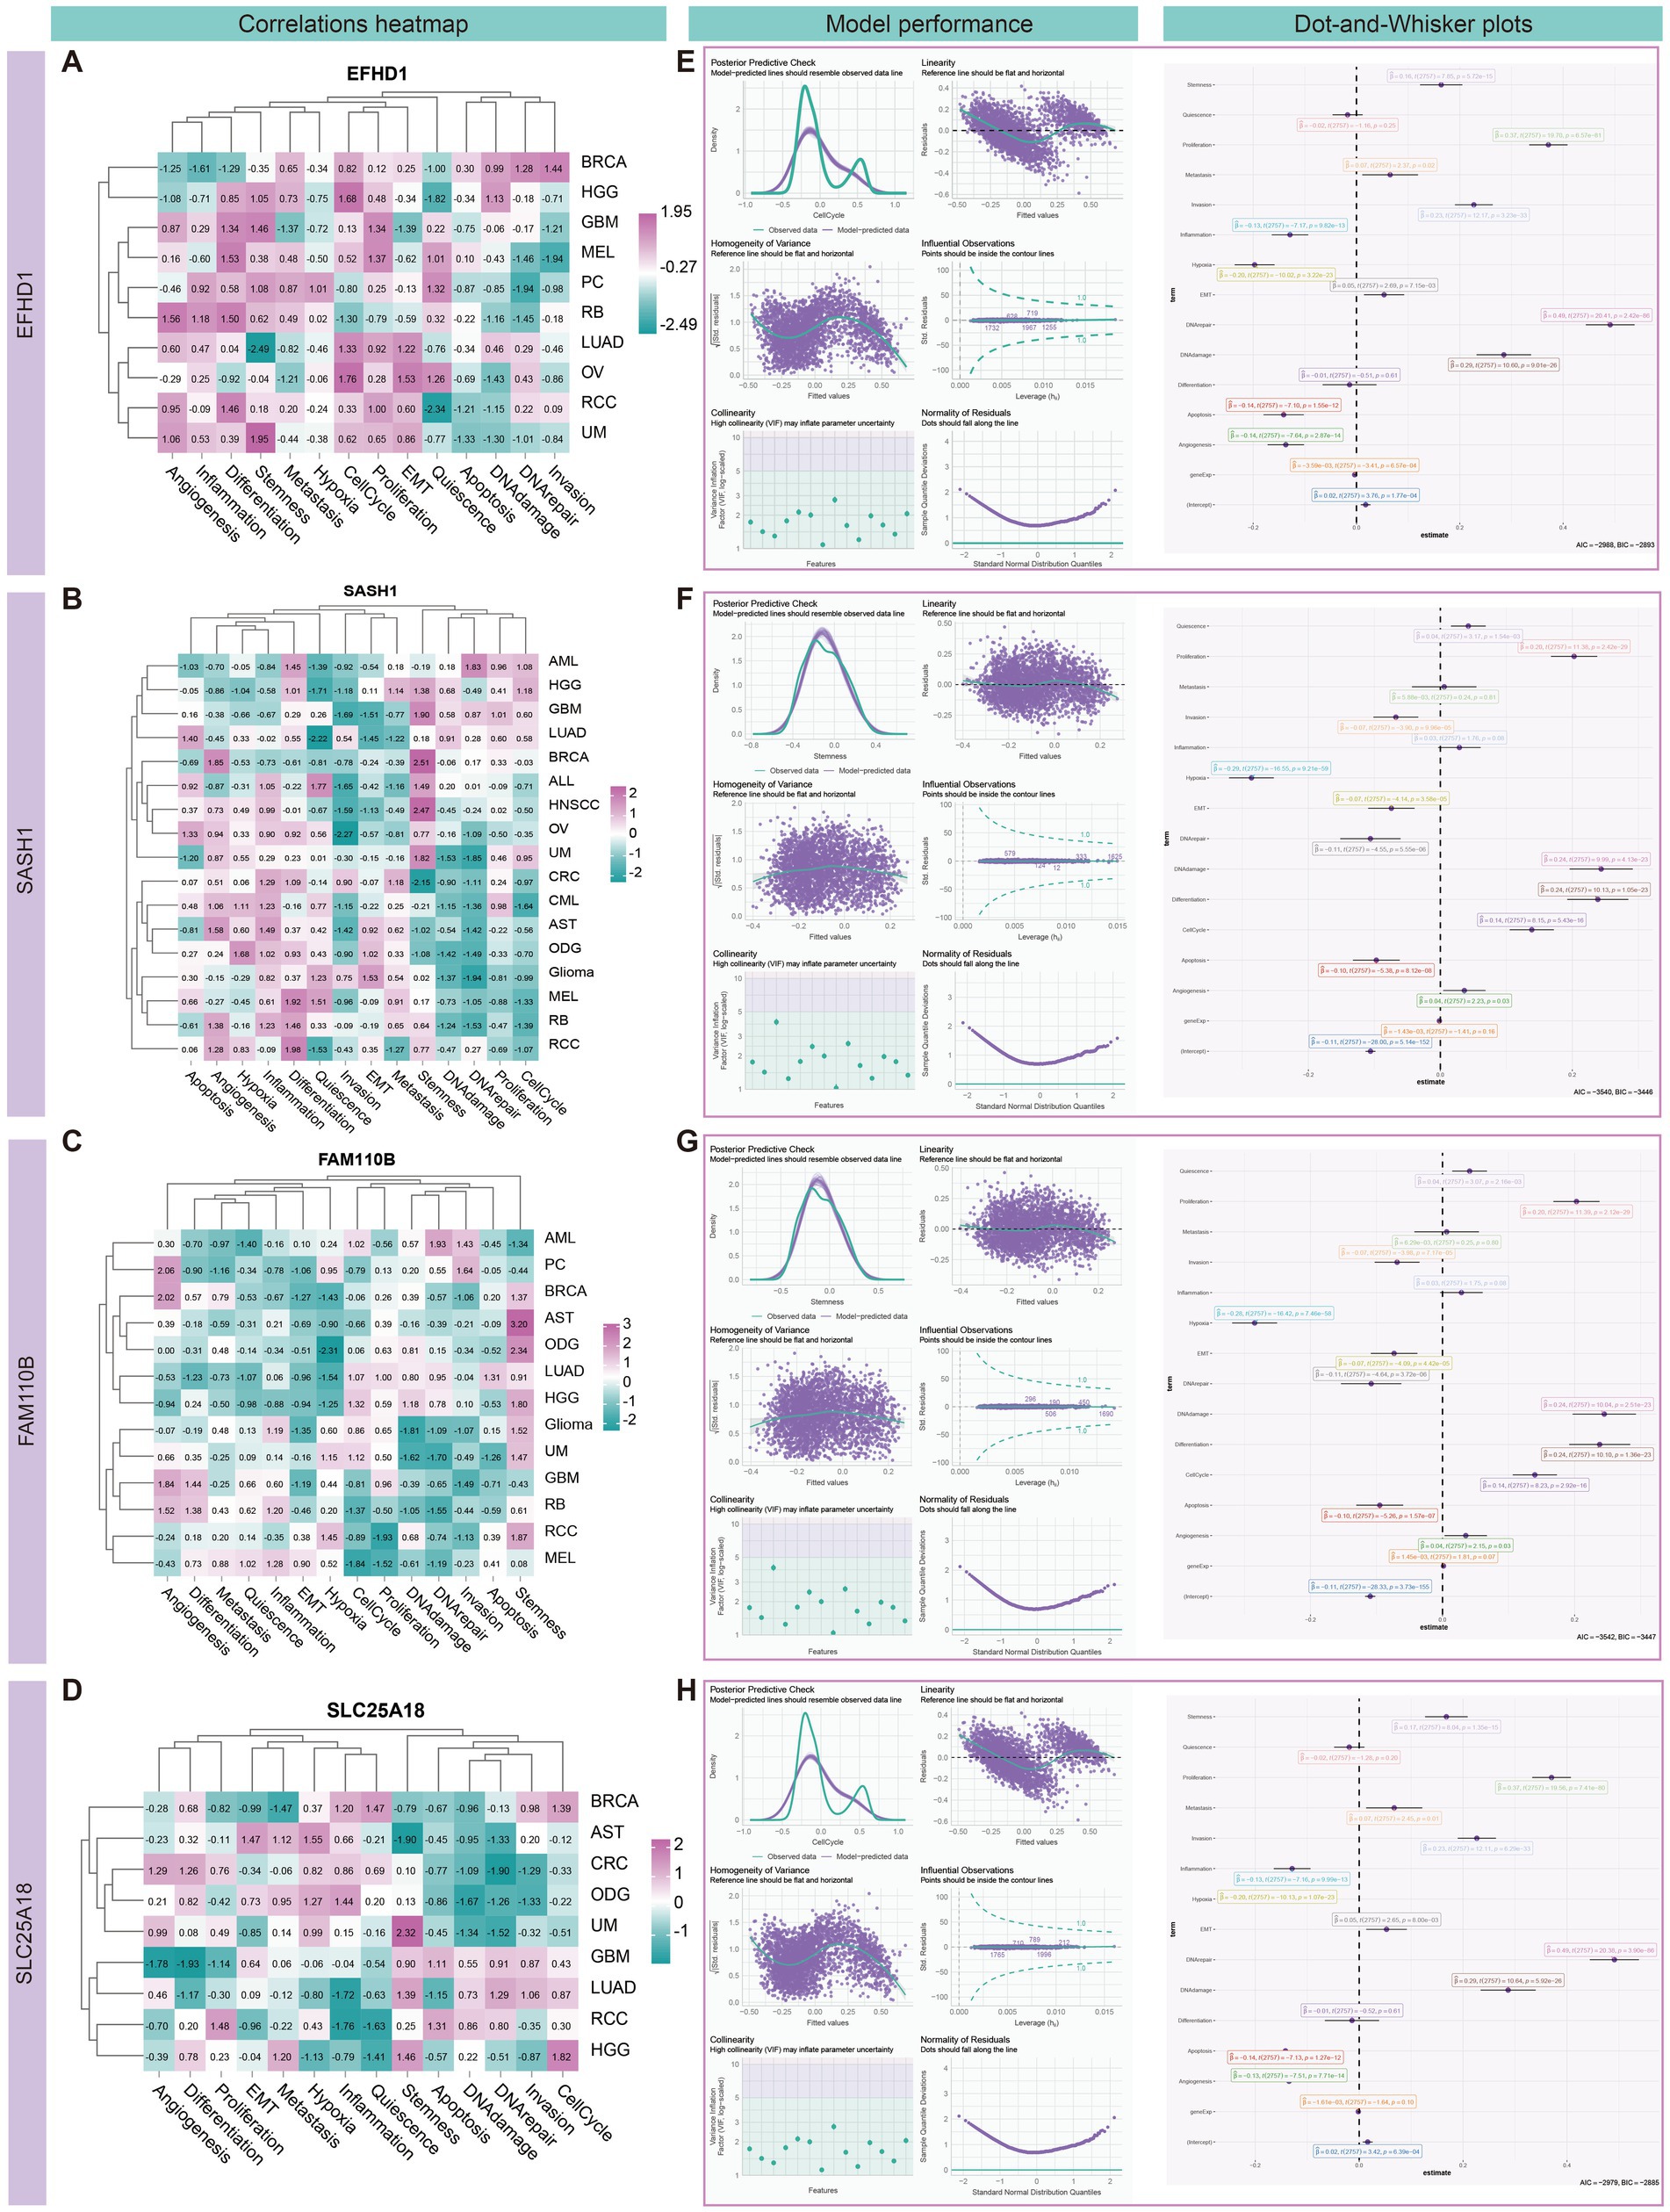
Figure 11. Correlation analysis and modeling of candidate genes with different cancer functional states in high-grade gliomas (HGG). (A–D) Heatmap showing the correlation between the normalized candidate genes and the different characteristics of different tumors. The analysis revealed significant positive correlations between the genes EFHD1 and SLC25A18 with cellular processes, particularly the cell cycle, with correlation coefficients (Cor) of 0.368 and 0.385, respectively (P < =0.001). Additionally, SASH1 and FAM110B were found to be closely associated with tumor stemness, with Cor of 0.328 and 0.427, respectively (P < =0.001). (E–H) Generalized linear models were used to further evaluate these associations, with cell cycle and stemness as dependent variables and the remaining 14 gene characteristics as independent variables. This approach allowed us to explore the intricate relationships between gene expression and the complex biological processes in HGG. The modeling results demonstrated significant associations between EFHD1 and SLC25A18 with the cell cycle, with a determination coefficient (R2) of 0.79. Likewise, SASH1 and FAM110B showed a substantial association with tumor stemness, with an R2 value of 0.522. These findings provide valuable insights into the molecular interplay within HGG and underscore the potential of these candidate genes as indicators of the disease’s functional states.
To further validate these associations, we employed generalized linear models that incorporated a comprehensive set of 14 gene characteristics in HGG. These characteristics spanned a range of biological processes, including gene expression, angiogenesis, apoptosis, cell cycle, differentiation, DNA damage, DNA repair, epithelial-mesenchymal transition (EMT), hypoxia, inflammation, invasion, metastasis, proliferation, quiescence, and stemness. In these models, cell cycle and stemness were set as the dependent variables, while the remaining characteristics served as independent variables, allowing us to capture the complex interplay between gene expression and HGG biology. Our models demonstrated that EFHD1 and SLC25A18 were significantly associated with the cell cycle (R2 = 0.790), while SASH1 and FAM110B showed a notable association with tumor stemness (R2 = 0.522) (Figures 11E–H and Supplementary Tables S13–S16).
We conducted pseudotime analysis on sn/scRNA-seq datasets from AD and GBM to explore dynamic cellular features. The heatmap illustrated three distinct lineages and six feature clusters within each dataset, with each cluster associated with unique biological functions. For instance, in AD, Cluster 1 (C1) was enriched for immune processes, including complement activation and cell adhesion. Cluster 2 (C2) was involved in the regulation of the MAPK cascade, while Cluster 4 (C4) related to intermediate filaments and the cytoskeleton. In GBM, Cluster 1 (C1) showed a response to essential metal ions such as copper and zinc and was associated with synaptic potentiation. Cluster 2 (C2) correlated with the blood–brain barrier, and Cluster 3 (C3) was linked to membrane proteins and lipolytic processes (Supplementary Figure S9).
tSNE maps further elucidated the potential evolutionary paths of various cell types in AD and GBM. In AD, the expression levels of Astrocytes, Oligodendrocytes, and OPCs were notably higher in the later stages across the three spectral time series. Specifically, EFHD1 exhibited increased expression at the late pseudotime stage of Lineage 1. SASH1 showed elevated expression at the late pseudotime stages across Lineages 1, 2, and 3. The expression of FAM110B fluctuated similarly across different lineages and time periods, while SLC25A18 displayed increased expression at the late pseudotime stage of Lineage 3.
In GBM, EFHD1 expression was heightened in oligodendrocytes and tumor cells during the middle and late pseudotime stages of Lineage 1. SASH1 demonstrated a decreasing expression trend from pre-pseudotime tumor cells and myeloid cells. FAM110B expression was upregulated in tumor cells and some oligodendrocytes during the middle and late stages of Lineages 1 and 3. SLC25A18 expression was elevated in tumor cells and a subset of astrocytes and oligodendrocytes at the late pseudotime stages of Lineages 1 and 3.
We identified cell types in AD and GBM using candidate differential genes from multi-omics data analysis. The identified AD cell types include astrocytes, oligodendrocytes, oligodendrocyte precursor cells (OPCs), and excitatory/inhibitory neurons (Supplementary Tables S17–S21). In GBM, the identified cell types are astrocytes, microglia, oligodendrocytes, myeloid cells, and neoplastic cells (Supplementary Tables S22–S26). To investigate potential gene interactions, we constructed single-cell gene co-expression networks for AD and GBM. In AD, the co-expression network revealed modules predominantly involving astrocytes (4 modules), inhibitory neurons (7 modules), and oligodendrocytes (2 modules) (Supplementary Figure S10). In GBM, co-expression modules were detected in microglia (4 modules), neoplastic cells (2 modules), and oligodendrocytes (2 modules) (Supplementary Figure S12). We identified hub genes from each cell module and assessed their recurrence across cell types. The most recurrent hub genes in AD were FTH1 (identified in astrocytes, oligodendrocytes, and OPCs) and HS6ST3 (found in excitatory neurons, inhibitory neurons, and OPCs). In GBM, TUBB2B emerged as the most frequently identified hub gene, observed in astrocytes, neoplastic cells, myeloid cells, and oligodendrocytes. Among the identified hub genes, mitochondrial epistasis-related genes included HS6ST3, DOCK10, DPP10, NRG3, and NRXN1. Meanwhile, genes with mitochondrial localization included HSP90AA1 and PRNP. Figure 12 and Supplementary Figures S11, S13 illustrated the overlap between sub-modules within individual cell types and differentiation genes, correlations between modules, as well as the network and distribution of hub genes across cellular subsets. Notably, oligodendrocytes demonstrated the most pronounced variation in module distribution, suggesting distinct functional roles in both AD and GBM pathologies.

Figure 12. Identification of the crucial modules related to candidate genes by hdWGCNA. Gene co-expression networks were established at the single-cell level for both diseases, revealing the interaction patterns among the candidate genes. The analysis provides a comprehensive view of the molecular crosstalk within cell types associated with these diseases. By aggregating hub genes from each cell’s modules, their prevalence across cell types was quantified. (A–C) The most recurrent hub genes identified were FTH1, which was prevalent in Astrocytes, Oligodendrocytes, and OPCs. HS6ST3 was found in excitatory neurons, inhibitory neurons, and oligodendrocyte precursor cells. These genes are considered central in the gene co-expression network, indicating their potential role in key cellular processes. (D–F) In GBM, the gene TUBB2B emerged as the most frequently occurring hub gene, present in Astrocytes, Neoplastic Cells, Myeloid cells, and Oligodendrocytes. This highlights its potential as a central player in the disease’s cellular dynamics. Among the identified hub genes, a subset was implicated in mitochondrial function: (1) Mitochondrial epistasis genes, including HS6ST3, DOCK10, DPP10, NRG3, and NRXN1, are suggested to regulate mitochondrial activity, which is critical for cellular energy metabolism and other functions. (2) Mitochondrial localization genes, HSP90AA1 and PRNP, are involved in the precise targeting and localization of proteins within the mitochondria, essential for maintaining cellular health. These findings provide valuable insights into the molecular mechanisms underlying the cellular heterogeneity in AD and GBM. The identification of crucial hub genes and their involvement in mitochondrial functions suggests their potential as central players in the pathogenesis of these diseases. These insights may contribute to the development of targeted therapeutic strategies.
Gene enrichment analyses further revealed specific associations. In AD, SASH1 was associated with modules involving astrocytes (Astrocytes3), inhibitory neurons (Inhibitory Neurons3), and oligodendrocytes (Oligodendrocytes2). FAM110B was linked to astrocytes and inhibitory neurons (Inhibitory Neurons3), while EFHD1 showed enrichment primarily in oligodendrocytes (Oligodendrocytes1). The Astrocyte2 module was found to have strong associations with excitatory neurons and exhibited functional enrichment for the glutamate catabolic process (GO:0006538) and intracellular iron ion sequestration (GO:0006880). Notably, gene expression synergism was observed between excitatory and inhibitory neurons, indicating potential interactions affecting neuronal signaling. Inhibitory Neurons3 were particularly involved in retinal ganglion cell axon guidance (GO:0031290) and the glutamate receptor signaling pathway (GO:0007215). Oligodendrocyte modules (Oligodendrocyte1 and Oligodendrocyte2) were enriched for endoplasmic reticulum proteins (GO:0045047) and processes regulating basement membrane assembly during embryoid body morphogenesis (GO:1904261), respectively (Supplementary Figure S11).
In GBM, gene enrichment analyses also identified SASH1 associated with microglia (Microglia3) and oligodendrocytes (Oligodendrocytes1). FAM110B was linked to neoplastic cells (Neoplastic Cells1) and oligodendrocytes (Oligodendrocytes2). The Microglia3 module was involved in processes such as leukocyte aggregation (GO:0070486), adiponectin regulation (GO:0070163), astrocyte differentiation (GO:0048708), and excitatory postsynaptic potential (GO:0090394). Oligodendrocyte modules (Oligodendrocyte1 and Oligodendrocyte2) were associated with the regulation of protein depolymerization (GO:1901879) and protein targeting to the endoplasmic reticulum (GO:0045047), respectively (Supplementary Figure S13).
Emerging evidence suggests both positive and inverse relationships between AD and GBM risk (Zabłocka et al., 2021; Cai et al., 2022). AD is characterized by neurodegeneration, while GBM involves uncontrolled cell proliferation. Despite their differences, both share mitochondrial dysfunction as a common pathological feature. In AD, mitochondrial impairment reduces energy production and increases oxidative stress, leading to neuronal death (Ebanks et al., 2020). Conversely, in GBM, mitochondrial abnormalities support tumor growth and resistance to apoptosis, promoting malignancy (Wang S. et al., 2024). These opposing effects underscore the complex role of mitochondria in disease mechanisms. Multi-omics approaches and machine learning algorithms are pivotal in identifying key genes and pathways involved in AD and GBM.
First, we explored the characterization of different cell types and their marker genes in AD and GBM based on single-cell data. Oligodendrocytes in both diseases were enriched for mitochondria-associated functions, including the mitochondrial morphogenetic pathway in AD and ATP synthesis coupled with electron transport in GBM. In AD, LPAR1, a key mitochondrial epistasis gene, influences mitochondrial dynamics, energy metabolism, and apoptosis, contributing to neuroinflammation and neuronal survival. In GBM, LPAR1 promotes tumor growth and invasion through altered mitochondrial bioenergetics (Choi et al., 2010). These findings highlight LPAR1’s potential as a therapeutic target in both AD and GBM. Additionally, GBM Neoplastic cells, Astrocytes, and Oligodendrocytes exhibited enrichment in NADH dehydrogenase complex (Complex I) genes. Mutations in MT-ND1, MT-ND2, MT-ND4, and MT-ND5, crucial for Complex I function, lead to altered bioenergetics and increased oxidative stress, contributing to GBM’s aggressiveness and therapeutic resistance (Viale et al., 2015). In comparing AD and GBM, mitochondria play divergent roles: sustaining neuronal signaling in AD and meeting high-energy demands in GBM. Oligodendrocyte function, linked to myelin production, may be compromised in AD, impacting axonal signaling, whereas in GBM, it may be adapted to support the tumor microenvironment. Understanding these roles could reveal shared or distinct regulatory mechanisms and offer new avenues for intervention.
Cellular communication analysis emphasized the importance of the microenvironment in AD and GBM, particularly the regulatory roles of astrocytes and oligodendrocytes. Astrocytes interact with GBM cells to promote tumor growth, invasion, and therapy resistance, partly through extracellular vesicles and mitochondrial transfer mediated by GAP43 (Brandao et al., 2019; Zhang et al., 2020; Watson et al., 2023). Astrocytes also engage in complex interactions with oligodendrocytes, crucial for glial development, disease progression, and tissue regeneration (Linnerbauer et al., 2020; Hu et al., 2023). These interactions, which occur via direct contact and secreted factors, significantly impact CNS homeostasis and pathogenesis. Understanding the cross-talk between astrocytes and microglia is also essential, as it contributes to GBM progression through cytokines and chemokines (Fan et al., 2024). Insights into these cellular relationships could lead to new therapeutic strategies for GBM and other CNS diseases.
Our findings revealed significant enrichment of the APP (amyloid precursor protein) signaling pathway in both AD and GBM. In AD, APP processing generates Aβ, leading to plaque formation, neuronal damage, and inflammation, ultimately contributing to cognitive decline (Hardy and Selkoe, 2002). In GBM, APP has been implicated in promoting cell proliferation and invasion (Lee et al., 2021). Mitochondria are central to these processes: in AD, Aβ interacts with mitochondria, causing dysfunction and oxidative stress, exacerbating neuronal injury (Atamna and Frey, 2007); in GBM, mitochondria regulate energy metabolism, apoptosis, and tumor cell invasiveness (Wu et al., 2022). Additionally, the shared involvement of the NRXN pathway in both diseases highlights its potential role. Neurexins, such as Neurexin-1β, stimulate the PI3K pathway in glioma cells, promoting growth (Venkatesh et al., 2015; Yun et al., 2023), and are implicated in synaptic dysfunction in AD (Zhang R. et al., 2023). This connection between NRXN1, mitochondrial pathways, and neurological function presents an avenue for understanding and treating these disorders (Nakamura and Kennedy, 2021; Levy et al., 2022).
Differential enrichment analysis revealed significant gene expression patterns in AD and GBM. Upregulated genes in both diseases were enriched in pathways related to mitosis, osteoblast morphogenesis, and transcriptional maintenance, indicating shared mechanisms of cell proliferation and structural remodeling (De La Torre, 2002; Dobson et al., 2020; Perluigi et al., 2024). Mitochondria are crucial in these processes, regulating energy production, oxidative stress, and apoptosis. Mitochondrial dysfunction in both AD and GBM has been linked to increased cell proliferation and altered differentiation. In GBM, these abnormalities increase ROS production, leading to DNA damage and tumorigenesis (Kim et al., 2006), while in AD, they exacerbate neuronal damage and synaptic loss (Chen W. et al., 2023). Downregulated genes in both diseases were linked to nuclear transcription, synaptic signaling, and calcium ion transport. Mitochondrial dysfunction affects calcium homeostasis, impacting neuronal function in AD and tumor cell viability in GBM (Chen W. et al., 2023; An et al., 2024; Kazanietz and Cooke, 2024; Lin H. et al., 2024). These insights highlight the shared and distinct mechanisms underlying AD and GBM and suggest potential therapeutic targets.
Combining single-cell signature genes and machine learning algorithms, we identified 24 cell-specific mitochondria-associated markers, which can be categorized into two groups based on their relationship with mitochondria: mitochondria epitope-associated (MT-Inter) and mitochondria-located genes (MT-Locate). The associations of these marker genes with immune cells were explored using methylation data. In AD, both classes of genes showed strong associations with neutrophil levels. Neutrophils migrate into the brain parenchyma and adhere to blood vessels in AD, releasing extracellular traps (NETs) that exacerbate neuroinflammation and tissue damage (Pietronigro et al., 2017; Dong et al., 2018; Aries and Hensley-McBain, 2023). Mitochondria in neutrophils contribute to their development, chemotaxis, effector functions, and cell death, playing an essential role in disease progression (Dong et al., 2018; Peng et al., 2023). In the tumor microenvironment, neutrophils adapt to glucose limitation by utilizing oxidative mitochondrial metabolism, particularly fatty acid oxidation, to sustain reactive oxygen species (ROS) production and immune suppression (Rice et al., 2018). These findings underscore the crucial role of mitochondria in neutrophil biology and their potential as therapeutic targets.
In GBM, we found associations between the two gene classes and immune cells, including eosinophils, CD4+ T-cells, and CD8+ T-cells. Eosinophils, though traditionally linked to allergic responses, modulate the GBM tumor microenvironment, with increased eosinophil-associated cytokine levels correlating with better survival and enhanced T-cell infiltration (Herold-Mende et al., 2023). Mitochondria are essential for eosinophil apoptosis and survival, modulated by glucocorticoids and nitric oxide (Ilmarinen et al., 2014). Mitochondrial dysfunction in CD8+ T-cells impairs their anti-tumor activity, affecting energy metabolism and increasing apoptosis (Yang et al., 2010; Zhang et al., 2022). Interestingly, a combination of high CD4+ and low CD8+ tumor-infiltrating lymphocytes (TILs) predicts poor prognosis in GBM, indicating a complex relationship between T-cell subtypes and outcomes (Waziri et al., 2008; Abarca-Rojano et al., 2009; Han et al., 2014; Lee et al., 2015; Surace et al., 2021; Du et al., 2023; Kim et al., 2023). Understanding these immune interactions and mitochondrial dynamics offers promising therapeutic targets.
From survival and differential analyses, we identified four key mitochondria-related genes: EFHD1, SASH1, FAM110B, and SLC25A18, which play critical roles in mitochondrial function, cellular metabolism, and signaling pathways. EFHD1, a mitochondrial calcium-binding protein, regulates calcium homeostasis and suppresses tumor metastasis via the Hippo/YAP pathway (Mun et al., 2021; Meng et al., 2023). It also influences calcium-dependent transcriptional co-activators or repressors, modulating ESR1 activity in the Transcriptional Regulation by the AP-2 (TFAP2) Family of Transcription Factors (R-HSA-8864260.2) pathway (Nassa et al., 2019). This interaction integrates TFAP2-and EFHD1-mediated signals to regulate hormone-related genes such as VEGFA, contributing to cellular growth and angiogenesis. Besides, EFHD2 is implicated in neurological disorders, including AD, and regulates macrophage function in GBM, presenting potential for immunotherapy (Vega, 2016; Zhang et al., 2023a). SASH1, acting as a tumor suppressor and mitochondrial epistasis gene, regulates oxidative stress, cell adhesion, and migration (Martini et al., 2011; Yang et al., 2012, 2015; Cazzaro et al., 2023; Lundberg et al., 2023). It interacts with SFN (14–3-3σ) in the TP53 Regulates Transcription of Cell Cycle Genes (R-HSA-6791312.5) pathway, enhancing TP53-mediated responses to DNA damage by stabilizing CDK inhibitors and enforcing G2/M checkpoint arrest. This interaction contributes to genomic stability by coordinating cell cycle arrest, DNA repair, and apoptosis pathways (Segal et al., 2023). FAM110B is associated with cell proliferation and cytoskeletal organization (Li et al., 2024; Yan et al., 2020). In the Deregulated CDK5 Triggers Multiple Neurodegenerative Pathways in Alzheimer’s Disease (R-HSA-8862803.4) pathway, it interacts with YWHAE (14–3-3ε), stabilizing the cytoskeleton and modulating stress responses (Cho et al., 2022). Together, they mitigate CDK5-induced neurodegeneration by regulating Tau hyperphosphorylation, oxidative stress, and neuronal apoptosis, making FAM110B and YWHAE potential therapeutic targets in Alzheimer’s disease. SLC25A18 is a mitochondrial carrier protein involved in glutamate transport, linking amino acid metabolism to the TCA cycle by importing L-glutamate into the mitochondrial matrix, where it is converted to 2-oxoglutarate (Yan et al., 2020; Wang et al., 2021; Wang S. et al., 2024; Watanabe et al., 2021; Taylor et al., 2022; Ren et al., 2023). In the Malate–Aspartate Shuttle (R-HSA-9856872.1) pathway, SLC25A18 supports energy production, biosynthesis, and mitochondrial homeostasis, integrating metabolite transport with oxidative phosphorylation to ensure metabolic flexibility and energy balance. These genes are potential targets for therapeutic interventions in both neurodegeneration and cancer. The detailed pathway regulatory relationships are shown in Supplementary Figure S14.
Lineage analysis showed distinct expression patterns for these genes. In AD, EFHD1, SASH1, and SLC25A18 were significantly elevated in oligodendrocytes, OPCs, and astrocytes at late pseudotemporal stages. In GBM, these genes were associated with tumor cells and oligodendrocytes at different stages. Oligodendrocytes, critical for CNS myelination, depend on mitochondrial function for energy production and lipid synthesis. Dysfunction in these cells, influenced by factors such as β-amyloid and neurofibrillary tangles, contributes to neuroinflammation, oxidative stress, and apoptosis in AD, whereas in GBM, oligodendrocytes enhance tumor cell migration and therapy resistance (Cai and Xiao, 2016; Rinholm et al., 2016; Butt et al., 2019; Kawashima et al., 2019; Meyer and Rinholm, 2021; Chen P. et al., 2023; Hide and Komohara, 2020). Targeting oligodendrocytes and OPCs may offer therapeutic opportunities in both AD and GBM.
The identification of mitochondrial disease-specific markers (EFHD1, SASH1, FAM110B, and SLC25A18) highlights shared mechanisms, such as oxidative phosphorylation, calcium signaling, and immune responses, that can serve as therapeutic targets in both AD and GBM. These markers enable patient stratification based on mitochondrial dysfunction, paving the way for personalized treatments addressing neurodegenerative and oncogenic processes. For instance, modulating oxidative stress and mitochondrial metabolism could simultaneously enhance neuronal survival in AD and suppress metabolic adaptation in GBM. Additionally, combination therapies targeting shared pathways, such as calcium homeostasis and energy metabolism, offer the potential for synergistic effects. These findings underscore the translational value of mitochondrial biomarkers and the need for further experimental validation to refine their therapeutic application.
The classification of GBM based on IDH mutation status is critical for both diagnosis and treatment planning, as patients with IDH-mutant GBM generally exhibit a significantly better prognosis compared to those with IDH wild-type tumors (Han et al., 2020). In our study, we identified four key marker genes (EFHD1, SASH1, FAM110B, and SLC25A18) and evaluated their differential expression across IDH subtypes using the CGGA dataset. The results revealed significant expression differences between IDH-mutant and IDH-wildtype GBM, highlighting their potential as biomarkers for stratifying gliomas by IDH status and severity. Among the markers, FAM110B displayed the most pronounced differential expression. It was significantly overexpressed in IDH-mutant gliomas across all grades of severity, suggesting its strong association with the IDH-mutant phenotype. This consistent overexpression underscores its potential role in the molecular mechanisms driving the relatively favorable prognosis of IDH-mutant gliomas. SLC25A18, another key marker, showed the highest expression levels in lower-grade gliomas (WHO grade II) with IDH mutation and in IDH-mutant, 1p19q co-deleted (LGG) subtypes. This expression pattern aligns with the less aggressive clinical behavior typically observed in these glioma subtypes and highlights SLC25A18’s potential involvement in the metabolic adaptations associated with IDH mutations (Supplementary Figure S15). These findings emphasize the relevance of IDH status in interpreting the functional roles of these markers and their correlation with glioma severity. Further functional studies are warranted to elucidate how these markers contribute to the distinct biological pathways and clinical outcomes observed in IDH-mutant gliomas. Additionally, their differential expression profiles may provide insights into IDH-specific therapeutic targets, offering opportunities for more personalized approaches in glioma treatment.
To elucidate gene interactions, we established a single-cell co-expression network and identified FTH1, HS6ST3, and TUBB2B as hub genes across multiple cell types. HS6ST3 is involved in the biosynthesis of heparan sulfate (HS), a glycosaminoglycan that regulates mitochondrial function under stress conditions (Lehri-Boufala et al., 2015). This suggests an indirect link between HS6ST3 and mitochondrial processes, and it has been identified as a hub gene in the GBM protein–protein interaction network (Xie et al., 2018). HS6ST3 may impact mitochondrial regulation in both AD and GBM (El Hayek et al., 2023). TUBB2B, encoding tubulin beta 2B, is linked to cortical malformations and microtubule dysfunction, common in neurodegenerative diseases like AD (Sferra et al., 2020; Soliman et al., 2022). Although associated with AD pathology, TUBB2B has no direct evidence linking it to GBM, requiring further investigation.
Co-expression module analysis revealed significant associations of hub genes with oligodendrocytes, followed by astrocytes and inhibitory neurons, indicating contributions to both diseases. Astrocytes are crucial in AD and GBM; in AD, they contribute to neuroinflammation, oxidative stress, and Aβ clearance (Bi et al., 2022), while in GBM, they support tumor growth and invasion, making them potential therapeutic targets (Brandao et al., 2019). Live imaging has shown limited mitochondrial dynamics in mature astrocytes in vivo compared to cultured cells, suggesting tightly regulated mitochondrial activity (Bergami and Motori, 2020). Astrocyte-oligodendrocyte interactions are critical for CNS remyelination, blood–brain barrier (BBB) integrity, and synaptogenesis (Hu et al., 2023; Molina-Gonzalez et al., 2023) Understanding these interactions could inform therapeutic strategies for CNS diseases. The AD-, GBM-specific and common biological pathways identified in our pipeline are summarized in Figure 13.
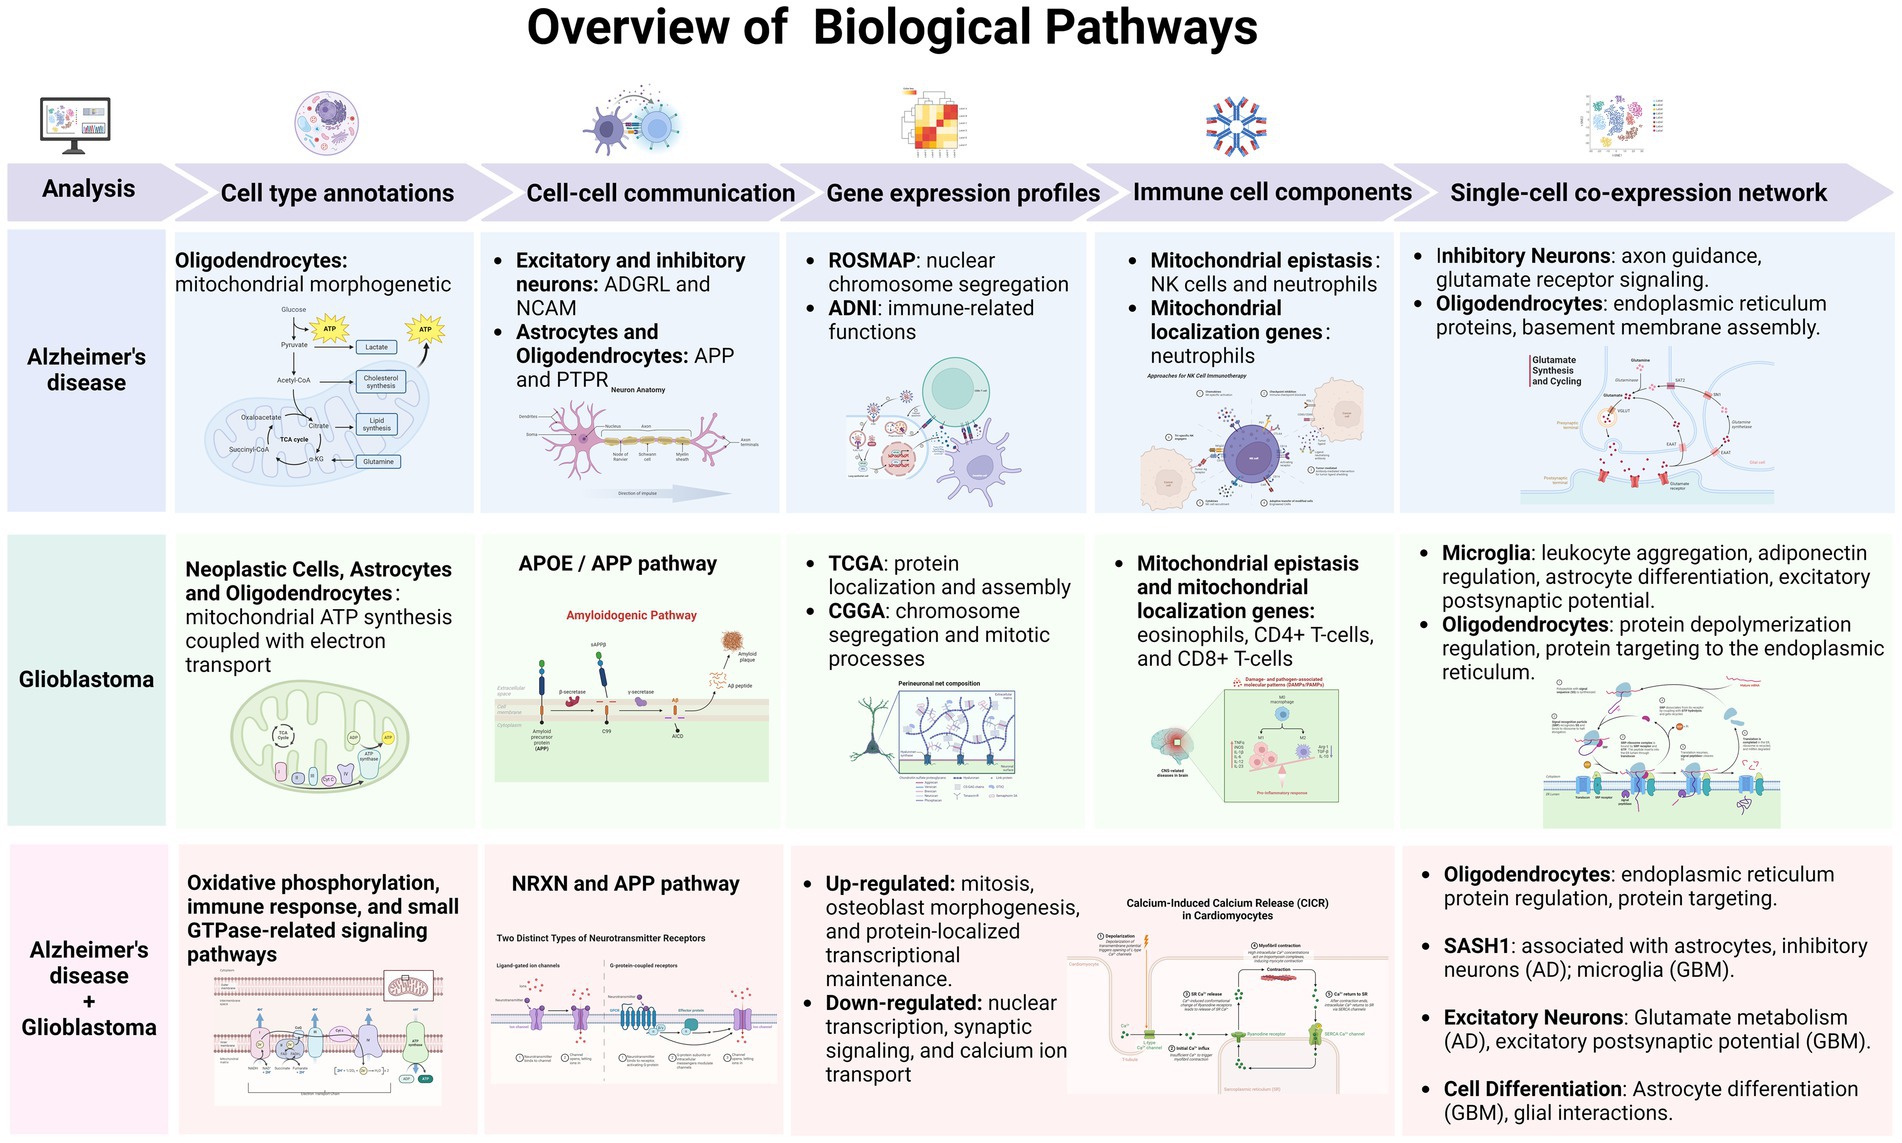
Figure 13. Overview of disease-specific and shared biological pathways in Alzheimer’s disease and glioblastoma. This figure summarizes the key biological pathways identified through our analytical pipeline for AD, GBM, and their shared mechanisms. The pathways are categorized across five analytical dimensions: cell type annotations, cell–cell communication, gene expression profiles, immune cell components, and single-cell co-expression networks. In AD, pathways include mitochondrial morphogenesis in oligodendrocytes, APP/NCAM signaling in astrocytes and inhibitory neurons, and immune-related nuclear functions. In GBM, critical processes involve mitochondrial ATP synthesis in neoplastic cells, astrocytes, and oligodendrocytes, as well as mitotic and protein localization pathways. Shared pathways encompass oxidative phosphorylation, calcium signaling, and immune responses, with notable roles for NRXN, APP, and small GTPase signaling. The figure highlights disease-specific and overlapping mechanisms, providing a comprehensive overview of the biological context for potential therapeutic targets.
Previous studies have demonstrated that mitochondrial dysfunction in Parkinson’s disease (PD), Huntington’s disease (HD), and amyotrophic lateral sclerosis (ALS) primarily affects pathways related to oxidative phosphorylation, mitochondrial dynamics, and calcium signaling (Green and Reed, 1998; Henrich et al., 2023). For example, MT-ND1, MT-ND2, MT-ND4, and MT-ND5, which are components of the mitochondrial electron transport chain, have been shown to be downregulated in both PD and ALS, reflecting impaired mitochondrial energy metabolism (Johri and Beal, 2012). In contrast, our study on AD and GBM highlights a distinct enrichment of mitochondrial pathways related to energy metabolism and ATP synthesis, particularly in GBM, where mitochondrial dysfunction is associated with tumor progression and cell survival. In AD, we observed significant enrichment in pathways linked to synaptic transmission and neuronal signaling, which are not as prominently affected in PD or ALS (Kori et al., 2016). Moreover, immune-related mitochondrial pathways involving microglia activation were shared across AD and GBM, which is consistent with findings in ALS and HD, where neuroinflammation plays a central role in disease pathogenesis (Chen K. et al., 2023). However, the specific involvement of APP, TREM2, and CD74 in microglial activation was particularly pronounced in AD and GBM, suggesting a more disease-specific activation of the immune system in these two conditions. In contrast, PD and ALS exhibit different immune activation profiles, with a more prominent role of astrocytes and other glial cells (Philips and Rothstein, 2014).
While our study highlights potential mitochondrial links between AD and GBM, several limitations must be acknowledged. The current findings, based on bioinformatics analyses of multi-omics datasets, lack experimental validation and precise mechanistic insights. Future research should integrate genomic, proteomic, and metabolomic studies, alongside cell-based and in vivo models, to validate the roles of key markers (EFHD1, SASH1, FAM110B, and SLC25A18) in mitochondrial dysfunction. Additionally, further investigation into the differential roles of these genes across IDH subtypes—such as FAM110B in IDH-mutant gliomas—and their therapeutic potential is needed. The interaction between clinical factors (e.g., IDH status and MGMT methylation) and our prognostic model also requires clarification through analysis of annotated clinical samples. Validation in larger, multi-ethnic cohorts and longitudinal datasets tracking mitochondrial changes across disease stages will enhance generalizability and identify critical therapeutic windows. Addressing these limitations will advance our understanding of mitochondrial dysfunction in AD and GBM, guiding the development of targeted therapies.
In summary, our research leverages single-cell data and applies a suite of 10 machine learning algorithms to discern mitochondria-related cell-specific markers, thereby contributing to the field’s understanding of AD and GBM. By integrating gene expression and methylation data, we have meticulously validated these markers and charted the expression patterns of mitochondrial features common to both diseases across various cell types. The identification of EFHD1, SASH1, FAM110B, and SLC25A18 as significant cross-disease markers sheds light on the shared and divergent mitochondrial mechanisms at play in AD and GBM. Our findings suggest a potential role for oligodendrocytes and their interactions with astrocytes in the pathogenesis of both diseases, with a particular focus on the APP signaling pathway. This insight provides a fresh perspective on the cellular dynamics that may underlie these conditions. Furthermore, the discovery of key hub genes, including HS6ST3 and TUBB2B, within cellular subpopulations, and their association with a cell-specific co-expression network associated with these mitochondrial markers, suggests a complex interplay of genetic factors that could influence disease progression and response to treatment. Our work strives to add complexity to the mitochondrial narrative in AD and GBM, with the ultimate aim of enhancing clinical relevance and therapeutic potential.
The software used in this study is publicly available. Libraries were used according to their vignettes with parameter descriptions and versions as specified in the Methods. Custom code is available at GitHub (https://github.com/xxulab1230/AD_GBM).
The studies involving humans were approved by Multi-omics data related to Alzheimer’s Disease (AD) from the ROSMAP database can be accessed via the AMP-AD Knowledge Portal (https://adknowledgeportal.synapse.org/) at the following identifiers: single-nucleus RNA sequencing (snRNA-Seq: syn18485175), bulk RNA sequencing (bulk RNA-seq: syn4164376), and DNA methylation array data (syn3157275), or through the Rush Alzheimer’s Disease Center (RADC) at https://www.radc.rush.edu. Gene expression and methylation data for validation of characteristic genes are available on the Alzheimer’s Disease Neuroimaging Initiative (ADNI) website at http://adni.loni.usc.edu. Single-cell RNA sequencing (scRNA-seq) data for glioblastoma multiforme (GBM) is accessible through the Gene Expression Omnibus (GEO, https://www.ncbi.nlm.nih.gov/geo/) with accession codes GSE138794 and GSE162631. Gene expression data and methylation data from The Cancer Genome Atlas (TCGA), including data from Affymetrix U133a arrays and Illumina HiSeq RNA-seq for lower-grade gliomas (LGGs) and GBMs, were obtained from https://tcga-data.nci.nih.gov/. The Chinese Glioma Genome Atlas (CGGA) dataset is accessible through http://www.cgga.org.cn/. Additionally, CellChat, which integrates extensive ligand-receptor interaction databases, is available online at http://www.cellchat.org/. The studies were conducted in accordance with the local legislation and institutional requirements. The participants provided their written informed consent to participate in this study.
XX: Conceptualization, Data curation, Formal analysis, Funding acquisition, Investigation, Methodology, Project administration, Resources, Software, Supervision, Validation, Visualization, Writing – original draft, Writing – review & editing. JW: Data curation, Writing – review & editing. TC: Visualization, Writing – review & editing. SW: Software, Writing – review & editing. FW: Investigation, Writing – review & editing. JH: Validation, Writing – review & editing. X-YM: Funding acquisition, Methodology, Supervision, Writing – review & editing. YS: Data curation, Formal analysis, Funding acquisition, Supervision, Writing – review & editing.
The author(s) declare that financial support was received for the research, authorship, and/or publication of this article. XX was supported by the Research Fund for the Doctoral Program of Anhui Medical University (0801059201).YS was supported by the Young Scientists Fund of the National Natural Science Foundation of China (Grant No. 32300556), the University Natural Science Research Project of Anhui Province (2023AH050611) and the Research Fund for the Doctoral Program of Anhui Medical University (1401041201). X-YM. was supported by National Natural Science Foundation of China (82303057), Natural Science Foundation of Hubei Province of China (2023AFB521), and “Chutian Scholars Program” of Hubei Province of China. Study data were provided by the Rush Alzheimer’s Disease Center, Rush University Medical Center, Chicago. Data collection was supported through funding by NIA grants P30AG10161 (ROS), R01AG15819 (ROSMAP; genomics and RNAseq), R01AG17917 (MAP), R01AG30146, R01AG36042 (5hC methylation, ATACseq), RC2AG036547 (H3K9Ac), R01AG36836 (RNAseq), R01AG48015 (monocyte RNAseq) RF1AG57473 (single nucleus RNAseq), U01AG32984 (genomic and whole exome sequencing), U01AG46152 (ROSMAP AMP-AD, targeted proteomics), U01AG46161 (TMT proteomics), U01AG61356 (whole genome sequencing, targeted proteomics, ROSMAP AMP-AD), the Illinois Department of Public Health (ROSMAP), and the Translational Genomics Research Institute (genomic). Additional phenotypic data can be requested at www.radc.rush.edu. Data obtained from the Alzheimer’s Disease Neuroimaging Initiative (ADNI) database were funded by the Alzheimer’s Disease Neuroimaging Initiative (ADNI) (National Institutes of Health Grant U01 AG024904) and DOD ADNI (Department of Defense award number W81XWH-12-2-0012). The investigators within the ADNI contributed to the design and implementation of ADNI and/or provided data but did not participate in analysis or writing of this report.
We extend our gratitude to the individuals who participated in the TCGA, CGGA, ROSMAP and ADNI studies, as well as their families and caregivers, for their invaluable contributions in making these programs possible.
The authors declare that the research was conducted in the absence of any commercial or financial relationships that could be construed as a potential conflict of interest.
The authors declare that no Generative AI was used in the creation of this manuscript.
All claims expressed in this article are solely those of the authors and do not necessarily represent those of their affiliated organizations, or those of the publisher, the editors and the reviewers. Any product that may be evaluated in this article, or claim that may be made by its manufacturer, is not guaranteed or endorsed by the publisher.
The Supplementary material for this article can be found online at: https://www.frontiersin.org/articles/10.3389/fnagi.2025.1536142/full#supplementary-material
1. ^https://www.cancer.gov/tcga
3. ^https://community.10xgenomics.com/t5/Customer-Developed-Protocols/ct-p/customer-protocols
Abarca-Rojano, E., Muñiz-Hernández, S., Moreno-Altamirano, M. M. B., Mondragón-Flores, R., Enriquez-Rincón, F., and Sánchez-García, F. J. (2009). Re-organization of mitochondria at the NK cell immune synapse. Immunol. Lett. 122, 18–25. doi: 10.1016/j.imlet.2008.10.008
An, G., Park, J., Song, J., Hong, T., Song, G., and Lim, W. (2024). Relevance of the endoplasmic reticulum-mitochondria axis in cancer diagnosis and therapy. Exp. Mol. Med. 56, 40–50. doi: 10.1038/s12276-023-01137-3
Aries, M. L., and Hensley-McBain, T. (2023). Neutrophils as a potential therapeutic target in Alzheimer’s disease. Front. Immunol. 14:1123149. doi: 10.3389/fimmu.2023.1123149
Atamna, H., and Frey, W. H. (2007). Mechanisms of mitochondrial dysfunction and energy deficiency in Alzheimer’s disease. Mitochondrion 7, 297–310. doi: 10.1016/j.mito.2007.06.001
Baysoy, A., Bai, Z., Satija, R., and Fan, R. (2023). The technological landscape and applications of single-cell multi-omics. Nat. Rev. Mol. Cell Biol. 24, 695–713. doi: 10.1038/s41580-023-00615-w
Bennett, D. A., Buchman, A. S., Boyle, P. A., Barnes, L. L., Wilson, R. S., and Schneider, J. A. (2018). Religious orders study and Rush memory and aging project. J. Alzheimers Dis. 64, S161–S189. doi: 10.3233/JAD-179939
Bergami, M., and Motori, E. (2020). Reweaving the fabric of mitochondrial contact sites in astrocytes. Front. Cell Dev. Biol. 8:592651. doi: 10.3389/fcell.2020.592651
Bi, W., Lei, T., Cai, S., Zhang, X., Yang, Y., Xiao, Z., et al. (2022). Potential of astrocytes in targeting therapy for Alzheimer’s disease. Int. Immunopharmacol. 113:109368. doi: 10.1016/j.intimp.2022.109368
Brandao, M., Simon, T., Critchley, G., and Giamas, G. (2019). Astrocytes, the rising stars of the glioblastoma microenvironment. Glia 67, 779–790. doi: 10.1002/glia.23520
Broekman, M. L., Maas, S. L. N., Abels, E. R., Mempel, T. R., Krichevsky, A. M., and Breakefield, X. O. (2018). Multidimensional communication in the microenvirons of glioblastoma. Nat. Rev. Neurol. 14, 482–495. doi: 10.1038/s41582-018-0025-8
Butt, A. M., De La Rocha, I. C., and Rivera, A. (2019). Oligodendroglial cells in Alzheimer’s disease. Adv. Exp. Med. Biol. 1175, 325–333. doi: 10.1007/978-981-13-9913-8_12
Cai, Z., and Xiao, M. (2016). Oligodendrocytes and Alzheimer’s disease. Int. J. Neurosci. 126, 97–104. doi: 10.3109/00207454.2015.1025778
Cai, J., Ye, L., Hu, Y., Ye, Z., Gao, L., Wang, Y., et al. (2022). Exploring the inverse association of glioblastoma multiforme and Alzheimer’s disease via bioinformatics analysis. Med. Oncol. 39:182. doi: 10.1007/s12032-022-01786-w
Calvo-Rodriguez, M., and Bacskai, B. J. (2021). Mitochondria and calcium in Alzheimer’s disease: from cell signaling to neuronal cell death. Trends Neurosci. 44, 136–151. doi: 10.1016/j.tins.2020.10.004
Cazzaro, S., Woo, J.-A. A., Wang, X., Liu, T., Rego, S., Kee, T. R., et al. (2023). Slingshot homolog-1–mediated Nrf2 sequestration tips the balance from neuroprotection to neurodegeneration in Alzheimer’s disease. Proc. Natl. Acad. Sci. 120:e2217128120. doi: 10.1073/pnas.2217128120
Chen, P., Guo, Z., and Zhou, B. (2023). Disease-associated oligodendrocyte: new player in Alzheimer’s disease and CNS pathologies. J. Integr. Neurosci. 22:90. doi: 10.31083/j.jin2204090
Chen, K., Wang, H., Ilyas, I., Mahmood, A., and Hou, L. (2023). Microglia and astrocytes dysfunction and key neuroinflammation-based biomarkers in parkinson’s disease. Brain Sci. 13:634. doi: 10.3390/brainsci13040634
Chen, W., Zhao, H., and Li, Y. (2023). Mitochondrial dynamics in health and disease: mechanisms and potential targets. Signal Transduct. Target. Ther. 8:333. doi: 10.1038/s41392-023-01547-9
Cho, N. H., Cheveralls, K. C., Brunner, A.-D., Kim, K., Michaelis, A. C., Raghavan, P., et al. (2022). OpenCell: endogenous tagging for the cartography of human cellular organization. Science 375:eabi6983. doi: 10.1126/science.abi6983
Choi, J. W., Herr, D. R., Noguchi, K., Yung, Y. C., Lee, C.-W., Mutoh, T., et al. (2010). LPA receptors: subtypes and biological actions. Annu. Rev. Pharmacol. Toxicol. 50, 157–186. doi: 10.1146/annurev.pharmtox.010909.105753
Colaprico, A., Silva, T. C., Olsen, C., Garofano, L., Cava, C., Garolini, D., et al. (2016). TCGAbiolinks: an R/Bioconductor package for integrative analysis of TCGA data. Nucleic Acids Res. 44:e71. doi: 10.1093/nar/gkv1507
De La Torre, J. C. (2002). Alzheimer disease as a vascular disorder: nosological evidence. Stroke 33, 1152–1162. doi: 10.1161/01.str.0000014421.15948.67
Dobson, P. F., Dennis, E. P., Hipps, D., Reeve, A., Laude, A., Bradshaw, C., et al. (2020). Mitochondrial dysfunction impairs osteogenesis, increases osteoclast activity, and accelerates age related bone loss. Sci. Rep. 10:11643. doi: 10.1038/s41598-020-68566-2
Dong, Y., Lagarde, J., Xicota, L., Corne, H., Chantran, Y., Chaigneau, T., et al. (2018). Neutrophil hyperactivation correlates with Alzheimer’s disease progression. Ann. Neurol. 83, 387–405. doi: 10.1002/ana.25159
Du, Y., Pollok, K. E., and Shen, J. (2023). Unlocking glioblastoma secrets: natural killer cell therapy against Cancer stem cells. Cancers 15:5836. doi: 10.3390/cancers15245836
Ebanks, B., Ingram, T. L., and Chakrabarti, L. (2020). ATP synthase and Alzheimer’s disease: putting a spin on the mitochondrial hypothesis. Aging (Albany NY) 12, 16647–16662. doi: 10.18632/aging.103867
El Hayek, L., DeVries, D., Gogate, A., Aiken, A., Kaur, K., and Chahrour, M. H. (2023). Disruption of the autism gene and chromatin regulator KDM5A alters hippocampal cell identity. Sci. Adv. 9:eadi0074. doi: 10.1126/sciadv.adi0074
Fan, Q., Wang, H., Gu, T., Liu, H., Deng, P., Li, B., et al. (2024). Modeling the precise interaction of glioblastoma with human brain region-specific organoids. iScience 27:109111. doi: 10.1016/j.isci.2024.109111
Fetcko-Fayad, K., Batich, K., Reitman, Z. J., Walsh, K. M., Chamberlin, G., Smith, V., et al. (2024). Coexisting biopsy-diagnosed dementia and glioblastoma. Brain Sci. 14:143. doi: 10.3390/brainsci14020143
Green, D. R., and Reed, J. C. (1998). Mitochondria and apoptosis. Sciience 281, 1309–1312. doi: 10.1126/science.281.5381.1309
Han, S., Liu, Y., Cai, S. J., Qian, M., Ding, J., Larion, M., et al. (2020). IDH mutation in glioma: molecular mechanisms and potential therapeutic targets. Br. J. Cancer 122, 1580–1589. doi: 10.1038/s41416-020-0814-x
Han, S., Zhang, C., Li, Q., Dong, J., Liu, Y., Huang, Y., et al. (2014). Tumour-infiltrating CD4+ and CD8+ lymphocytes as predictors of clinical outcome in glioma. Br. J. Cancer 110, 2560–2568. doi: 10.1038/bjc.2014.162
Hardy, J., and Selkoe, D. J. (2002). The amyloid hypothesis of Alzheimer’s disease: progress and problems on the road to therapeutics. Science 297, 353–356. doi: 10.1126/science.1072994
Henrich, M. T., Oertel, W. H., Surmeier, D. J., and Geibl, F. F. (2023). Mitochondrial dysfunction in Parkinson’s disease – a key disease hallmark with therapeutic potential. Mol. Neurodegener. 18:83. doi: 10.1186/s13024-023-00676-7
Herold-Mende, C., Heiland, D. H., Fermi, V., Von Deimling, A., Unterberg, A., and Warta, R. (2023). IMMU-08. Eosinophils are important modulators of an immune-responsive tumor-microenvironment in glioblastoma. Neuro-oncol. 25, v142–v143. doi: 10.1093/neuonc/noad179.0540
Hu, X., Yu, G., Liao, X., and Xiao, L. (2023). Interactions between astrocytes and oligodendroglia in myelin development and related brain diseases. Neurosci. Bull. 39, 541–552. doi: 10.1007/s12264-022-00981-z
Ilmarinen, P., Moilanen, E., and Kankaanranta, H. (2014). Mitochondria in the Center of Human Eosinophil Apoptosis and Survival. Int. J. Mol. Sci. 15, 3952–3969. doi: 10.3390/ijms15033952
Jin, S., Guerrero-Juarez, C. F., Zhang, L., Chang, I., Ramos, R., Kuan, C.-H., et al. (2021). Inference and analysis of cell-cell communication using cell chat. Nat. Commun. 12:1088. doi: 10.1038/s41467-021-21246-9
Johri, A., and Beal, M. F. (2012). Mitochondrial dysfunction in neurodegenerative diseases. J. Pharmacol. Exp. Ther. 342, 619–630. doi: 10.1124/jpet.112.192138
Kawashima, T., Yashiro, M., Kasashima, H., Terakawa, Y., Uda, T., Nakajo, K., et al. (2019). Oligodendrocytes up-regulate the invasive activity of glioblastoma cells via the Angiopoietin-2 signaling pathway. Anticancer Res. 39, 577–584. doi: 10.21873/anticanres.13150
Kazanietz, M. G., and Cooke, M. (2024). Protein kinase C signaling “in” and “to” the nucleus: master kinases in transcriptional regulation. J. Biol. Chem. 300:105692. doi: 10.1016/j.jbc.2024.105692
Kim, G. J., Chandrasekaran, K., and Morgan, F. W. (2006). Mitochondrial dysfunction, persistently elevated levels of reactive oxygen species and radiation-induced genomic instability: a review. Mutagenesis 21, 361–367. doi: 10.1093/mutage/gel048
Kim, S.-H., Kim, M.-J., Lim, M., Kim, J., Kim, H., Yun, C.-K., et al. (2023). Enhancement of the anticancer ability of natural killer cells through allogeneic mitochondrial transfer. Cancers 15:3225. doi: 10.3390/cancers15123225
Lanni, C., Masi, M., Racchi, M., and Govoni, S. (2021). Cancer and Alzheimer’s disease inverse relationship: an age-associated diverging derailment of shared pathways. Mol. Psychiatry 26, 280–295. doi: 10.1038/s41380-020-0760-2
Lee, H. N., Jeong, M. S., and Jang, S. B. (2021). Molecular characteristics of amyloid precursor protein (APP) and its effects in Cancer. Int. J. Mol. Sci. 22:4999. doi: 10.3390/ijms22094999
Lee, S. J., Kang, W. Y., Yoon, Y., Jin, J. Y., Song, H. J., Her, J. H., et al. (2015). Natural killer (NK) cells inhibit systemic metastasis of glioblastoma cells and have therapeutic effects against glioblastomas in the brain. BMC Cancer 15:1011. doi: 10.1186/s12885-015-2034-y
Lehrer, S. (2010). Glioblastoma and dementia may share a common cause. Med. Hypotheses 75, 67–68. doi: 10.1016/j.mehy.2010.01.031
Lehri-Boufala, S., Ouidja, M.-O., Barbier-Chassefière, V., Hénault, E., Raisman-Vozari, R., Garrigue-Antar, L., et al. (2015). New roles of Glycosaminoglycans in α-Synuclein aggregation in a cellular model of Parkinson disease. PLoS One 10:e0116641. doi: 10.1371/journal.pone.0116641
Levy, K. A., Weisz, E. D., and Jongens, T. A. (2022). Loss of neurexin-1 in Drosophila melanogaster results in altered energy metabolism and increased seizure susceptibility. Hum. Mol. Genet. 31, 3422–3438. doi: 10.1093/hmg/ddac115
Li, Y., Li, X., Wu, B., Su, S., Su, Y., and Guo, L. (2024). Pan-cancer analysis and single-cell analysis reveals FAM110B as a potential target for survival and immunotherapy. Front. Mol. Biosci. 11. doi: 10.3389/fmolb.2024.1424104
Lin, P., Gan, Y.-B., He, J., Lin, S.-E., Xu, J.-K., Chang, L., et al. (2024). Advancing skeletal health and disease research with single-cell RNA sequencing. Mil. Med. Res. 11:33. doi: 10.1186/s40779-024-00538-3
Lin, H., Liu, C., Hu, A., Zhang, D., Yang, H., and Mao, Y. (2024). Understanding the immunosuppressive microenvironment of glioma: mechanistic insights and clinical perspectives. J. Hematol. Oncol. 17:31. doi: 10.1186/s13045-024-01544-7
Linnerbauer, M., Wheeler, M. A., and Quintana, F. J. (2020). Astrocyte crosstalk in CNS inflammation. Neuron 108, 608–622. doi: 10.1016/j.neuron.2020.08.012
Lundberg, M., Sng, L. M. F., Szul, P., Dunne, R., Bayat, A., Burnham, S. C., et al. (2023). Novel Alzheimer’s disease genes and epistasis identified using machine learning GWAS platform. Sci. Rep. 13:17662. doi: 10.1038/s41598-023-44378-y
Martini, M., Gnann, A., Scheikl, D., Holzmann, B., and Janssen, K.-P. (2011). The candidate tumor suppressor SASH1 interacts with the actin cytoskeleton and stimulates cell–matrix adhesion. Int. J. Biochem. Cell Biol. 43, 1630–1640. doi: 10.1016/j.biocel.2011.07.012
McGinnis, C. S., Murrow, L. M., and Gartner, Z. J. (2019). Doublet finder: doublet detection in single-cell RNA sequencing data using artificial nearest neighbors. Cell Syst. 8, 329–337.e4. doi: 10.1016/j.cels.2019.03.003
Kori, M., Aydın, B., Unal, S., Arga, K. Y., and Kazan, D. (2016). Metabolic biomarkers and neurodegeneration: A pathway enrichment analysis of alzheimer’s disease, parkinson’s disease, and amyotrophic lateral sclerosis. OMICS: J. Integr. Biol. 20, 645–661. doi: 10.1089/omi.2016.0106
Meng, K., Hu, Y., Wang, D., Li, Y., Shi, F., Lu, J., et al. (2023). EFHD1, a novel mitochondrial regulator of tumor metastasis in clear cell renal cell carcinoma. Cancer Sci. 114, 2029–2040. doi: 10.1111/cas.15749
Meyer, N., and Rinholm, J. E. (2021). Mitochondria in myelinating oligodendrocytes: slow and out of breath? Meta 11:359. doi: 10.3390/metabo11060359
Molina-Gonzalez, I., Holloway, R. K., Jiwaji, Z., Dando, O., Kent, S. A., Emelianova, K., et al. (2023). Astrocyte-oligodendrocyte interaction regulates central nervous system regeneration. Nat. Commun. 14:3372. doi: 10.1038/s41467-023-39046-8
Morabito, S., Reese, F., Rahimzadeh, N., Miyoshi, E., and Swarup, V. (2023). hdWGCNA identifies co-expression networks in high-dimensional transcriptomics data. Cell Rep. Methods 3:100498. doi: 10.1016/j.crmeth.2023.100498
Mun, S. A., Park, J., Park, K. R., Lee, Y., Kang, J. Y., Park, T., et al. (2021). Structural and biochemical characterization of EFhd1/Swiprosin-2, an actin-binding protein in mitochondria. Front. Cell Dev. Biol. 8:628222. doi: 10.3389/fcell.2020.628222
Nakamura, D., and Kennedy, T. (2021). Netrin-1 marshals mitochondrial movement, morphology, and metabolism in myelin. Neural Regen. Res. 16, 2399–2400. doi: 10.4103/1673-5374.313028
Nassa, G., Giurato, G., Salvati, A., Gigantino, V., Pecoraro, G., Lamberti, J., et al. (2019). The RNA-mediated estrogen receptor α interactome of hormone-dependent human breast cancer cell nuclei. Sci. Data 6:173. doi: 10.1038/s41597-019-0179-2
Hide, T., and Komohara, Y. (2020). Oligodendrocyte progenitor cells in the tumor microenvironment. Adv. Exp. Med. Biol. 1234, 107–122. doi: 10.1007/978-3-030-37184-5_8
Peng, S., Gao, J., Stojkov, D., Yousefi, S., and Simon, H. (2023). Established and emerging roles for mitochondria in neutrophils. Immunol. Rev. 314, 413–426. doi: 10.1111/imr.13158
Perluigi, M., Di Domenico, F., and Butterfield, D. A. (2024). Oxidative damage in neurodegeneration: roles in the pathogenesis and progression of Alzheimer disease. Physiol. Rev. 104, 103–197. doi: 10.1152/physrev.00030.2022
Petersen, R. C., Aisen, P. S., Beckett, L. A., Donohue, M. C., Gamst, A. C., Harvey, D. J., et al. (2010). Alzheimer’s Disease Neuroimaging Initiative (ADNI): clinical characterization. Neurology 74, 201–209. doi: 10.1212/WNL.0b013e3181cb3e25
Philips, T., and Rothstein, J. (2014). Glial cells in amyotrophic lateral sclerosis. Exp. Neurol. 262, 111–120. doi: 10.1016/j.expneurol.2014.05.015
Pietronigro, E. C., Della Bianca, V., Zenaro, E., and Constantin, G. (2017). NETosis in Alzheimer’s disease. Front. Immunol. 8:211. doi: 10.3389/fimmu.2017.00211
Price, M., Neff, C., Nagarajan, N., Kruchko, C., Waite, K. A., Cioffi, G., et al. (2024). CBTRUS statistical report: American Brain Tumor Association & NCI neuro-oncology branch adolescent and young adult primary brain and other central nervous system tumors diagnosed in the United States in 2016-2020. Neuro-oncol. 26:iii1–iii53. doi: 10.1093/neuonc/noae047
Ren, D., Zhuang, X., Lv, Y., Zhang, Y., Xu, J., Gao, F., et al. (2023). Identification of family with sequence similarity 110 member C (FAM110C) as a candidate diagnostic and prognostic biomarker for glioma. Iran. J. Public Health 52, 2117–2127. doi: 10.18502/ijph.v52i10.13850
Rice, C. M., Davies, L. C., Subleski, J. J., Maio, N., Gonzalez-Cotto, M., Andrews, C., et al. (2018). Tumour-elicited neutrophils engage mitochondrial metabolism to circumvent nutrient limitations and maintain immune suppression. Nat. Commun. 9:5099. doi: 10.1038/s41467-018-07505-2
Rinholm, J. E., Vervaeke, K., Tadross, M. R., Tkachuk, A. N., Kopek, B. G., Brown, T. A., et al. (2016). Movement and structure of mitochondria in oligodendrocytes and their myelin sheaths. Glia 64, 810–825. doi: 10.1002/glia.22965
Sánchez-Valle, J., Tejero, H., Ibáñez, K., Portero, J. L., Krallinger, M., Al-Shahrour, F., et al. (2017). A molecular hypothesis to explain direct and inverse co-morbidities between Alzheimer’s disease, Glioblastoma and Lung cancer. Sci Rep-uk 7:4474. doi: 10.1038/s41598-017-04400-6
Scheltens, P., De Strooper, B., Kivipelto, M., Holstege, H., Chételat, G., Teunissen, C. E., et al. (2021). Alzheimer’s disease. Lancet 397, 1577–1590. doi: 10.1016/S0140-6736(20)32205-4
Segal, D., Maier, S., Mastromarco, G. J., Qian, W. W., Nabeel-Shah, S., Lee, H., et al. (2023). A central chaperone-like role for 14-3-3 proteins in human cells. Mol. Cell 83, 974–993.e15. doi: 10.1016/j.molcel.2023.02.018
Sferra, A., Nicita, F., and Bertini, E. (2020). Microtubule dysfunction: a common feature of neurodegenerative diseases. Int. J. Mol. Sci. 21:7354. doi: 10.3390/ijms21197354
Shi, J., and Huang, S. (2023). Comparative insight into microglia/macrophages-associated pathways in glioblastoma and Alzheimer’s disease. Int. J. Mol. Sci. 25:16. doi: 10.3390/ijms25010016
Soliman, A., Bakota, L., and Brandt, R. (2022). Microtubule-modulating agents in the fight against neurodegeneration: will it ever work? Curr. Neuropharmacol. 20, 782–798. doi: 10.2174/1570159X19666211201101020
Surace, L., Doisne, J.-M., Escoll, P., Marie, S., Dardalhon, V., Croft, C., et al. (2021). Polarized mitochondria as guardians of NK cell fitness. Blood Adv. 5, 26–38. doi: 10.1182/bloodadvances.2020003458
Taylor, R., Hamid, F., Fielding, T., Gordon, P. M., Maloney, M., Makeyev, E. V., et al. (2022). Prematurely terminated intron-retaining mRNAs invade axons in SFPQ null-driven neurodegeneration and are a hallmark of ALS. Nat. Commun. 13:6994. doi: 10.1038/s41467-022-34331-4
Teschendorff, A. E., Breeze, C. E., Zheng, S. C., and Beck, S. (2017). A comparison of reference-based algorithms for correcting cell-type heterogeneity in epigenome-wide association studies. BMC Bioinf. 18:105. doi: 10.1186/s12859-017-1511-5
Thakur, A., Faujdar, C., Sharma, R., Sharma, S., Malik, B., Nepali, K., et al. (2022). Glioblastoma: current status, emerging targets, and recent advances. J. Med. Chem. 65, 8596–8685. doi: 10.1021/acs.jmedchem.1c01946
Vega, I. E. (2016). EFhd2, a protein linked to Alzheimer’s disease and other neurological disorders. Front. Neurosci. 10:150. doi: 10.3389/fnins.2016.00150
Venkatesh, H. S., Johung, T. B., Caretti, V., Noll, A., Tang, Y., Nagaraja, S., et al. (2015). Neuronal activity promotes glioma growth through Neuroligin-3 secretion. Cell 161, 803–816. doi: 10.1016/j.cell.2015.04.012
Viale, A., Corti, D., and Draetta, G. F. (2015). Tumors and mitochondrial respiration: a neglected connection. Cancer Res. 75, 3687–3691. doi: 10.1158/0008-5472.CAN-15-0491
Wang, L., Babikir, H., Müller, S., Yagnik, G., Shamardani, K., Catalan, F., et al. (2019). The phenotypes of proliferating glioblastoma cells reside on a single axis of variation. Cancer Discov. 9, 1708–1719. doi: 10.1158/2159-8290.CD-19-0329
Wang, Y., Cai, R., Wang, P., Huang, C., Zhang, C., and Liu, Z. (2021). FAM46A expression is elevated in glioblastoma and predicts poor prognosis of patients. Clin. Neurol. Neurosurg. 201:106421. doi: 10.1016/j.clineuro.2020.106421
Wang, L., Jung, J., Babikir, H., Shamardani, K., Jain, S., Feng, X., et al. (2022). A single-cell atlas of glioblastoma evolution under therapy reveals cell-intrinsic and cell-extrinsic therapeutic targets. Nat. Cancer 3, 1534–1552. doi: 10.1038/s43018-022-00475-x
Wang, R., Lei, H., Wang, H., Qi, L., Liu, Y., Liu, Y., et al. (2024). Dysregulated inter-mitochondrial crosstalk in glioblastoma cells revealed by in situ cryo-electron tomography. Proc. Natl. Acad. Sci. 121:e2311160121. doi: 10.1073/pnas.2311160121
Wang, S., Qi, Y., Zhao, R., Pan, Z., Li, B., Qiu, W., et al. (2024). Copy number gain of FAM131B-AS2 promotes the progression of glioblastoma by mitigating replication stress. Neuro-oncol. 26, 1027–1041. doi: 10.1093/neuonc/noae014
Watanabe, N., Nakano, M., Mitsuishi, Y., Hara, N., Mano, T., Iwata, A., et al. (2021). Transcriptional downregulation of FAM3C/ILEI in the Alzheimer’s brain. Hum. Mol. Genet. 31, 122–132. doi: 10.1093/hmg/ddab226
Watson, D. C., Bayik, D., Storevik, S., Moreino, S. S., Sprowls, S. A., Han, J., et al. (2023). GAP43-dependent mitochondria transfer from astrocytes enhances glioblastoma tumorigenicity. Nat. Cancer 4, 648–664. doi: 10.1038/s43018-023-00556-5
Waziri, A., Killory, B., Ogden, A. T., Canoll, P., Anderson, R. C. E., Kent, S. C., et al. (2008). Preferential in situ CD4+CD56+ T cell activation and expansion within human glioblastoma. J. Immunol. 180, 7673–7680. doi: 10.4049/jimmunol.180.11.7673
Wu, Z., Ho, W. S., and Lu, R. (2022). Targeting mitochondrial oxidative phosphorylation in glioblastoma therapy. Neuro Mol. Med. 24, 18–22. doi: 10.1007/s12017-021-08678-8
Wu, T., Hu, E., Xu, S., Chen, M., Guo, P., Dai, Z., et al. (2021). clusterProfiler 4.0: a universal enrichment tool for interpreting omics data. Innovations 2:100141. doi: 10.1016/j.xinn.2021.100141
Xia, S., Chen, H., and Tang, T. (2023). Risk of death from Alzheimer’s disease associated with brain tumor, glioma, and glioblastoma. J. Alzheimers Dis. 96, 623–631. doi: 10.3233/JAD-230554
Xie, Y., He, L., Lugano, R., Zhang, Y., Cao, H., He, Q., et al. (2021). Key molecular alterations in endothelial cells in human glioblastoma uncovered through single-cell RNA sequencing. JCI Insight 6:e150861. doi: 10.1172/jci.insight.150861
Xie, Y., Wang, L., Xie, Z., Zeng, C., and Shu, K. (2018). Transcriptomics evidence for common pathways in human major depressive disorder and glioblastoma. Int. J. Mol. Sci. 19:234. doi: 10.3390/ijms19010234
Xu, X., Wang, H., Bennett, D. A., Zhang, Q.-Y., Meng, X.-Y., and Zhang, H.-Y. (2024). Characterization of brain resilience in Alzheimer’s disease using polygenic risk scores and further improvement by integrating mitochondria-associated loci. J. Adv. Res. 56, 113–124. doi: 10.1016/j.jare.2023.03.002
Xu, X., Wang, H., Bennett, D. A., Zhang, Q.-Y., Wang, G., and Zhang, H.-Y. (2022). Systems genetic identification of mitochondrion-associated Alzheimer’s disease genes and implications for disease risk prediction. Biomedicines 10:1782. doi: 10.3390/biomedicines10081782
Yan, T., Liang, J., Gao, J., Wang, L., Fujioka, H., Initiative, T. A. D. N., et al. (2020). FAM222A encodes a protein which accumulates in plaques in Alzheimer’s disease. Nat. Commun. 11:411. doi: 10.1038/s41467-019-13962-0
Yang, L., Liu, M., Gu, Z., Chen, J., Yan, Y., and Li, J. (2012). Overexpression of SASH1 related to the decreased invasion ability of human glioma U251 cells. Tumour Biol. 33, 2255–2263. doi: 10.1007/s13277-012-0487-z
Yang, I., Tihan, T., Han, S. J., Wrensch, M. R., Wiencke, J., Sughrue, M. E., et al. (2010). CD8+ T-cell infiltrate in newly diagnosed glioblastoma is associated with long-term survival. J. Clin. Neurosci. 17, 1381–1385. doi: 10.1016/j.jocn.2010.03.031
Yang, L., Zhang, H., Yao, Q., Yan, Y., Wu, R., and Liu, M. (2015). Clinical significance of SASH1 expression in glioma. Dis. Markers 2015, 1–7. doi: 10.1155/2015/383046
Yuan, H., Yan, M., Zhang, G., Liu, W., Deng, C., Liao, G., et al. (2019). CancerSEA: a cancer single-cell state atlas. Nucleic Acids Res. 47, D900–D908. doi: 10.1093/nar/gky939
Yun, E.-J., Kim, D., Kim, S., Hsieh, J.-T., and Baek, S. T. (2023). Targeting Wnt/β-catenin-mediated upregulation of oncogenic NLGN3 suppresses cancer stem cells in glioblastoma. Cell Death Dis. 14:423. doi: 10.1038/s41419-023-05967-x
Zabłocka, A., Kazana, W., Sochocka, M., Stańczykiewicz, B., Janusz, M., Leszek, J., et al. (2021). Inverse correlation between Alzheimer’s disease and Cancer: short overview. Mol. Neurobiol. 58, 6335–6349. doi: 10.1007/s12035-021-02544-1
Zhang, W., Chen, L., Yang, S., Zhong, Y., Lu, X., Wang, Y., et al. (2023a). Clinical characterization of EFHD2 (swiprosin-1) in glioma-associated macrophages and its role in regulation of immunosuppression. Genomics 115:110702. doi: 10.1016/j.ygeno.2023.110702
Zhang, R., Jiang, H., Liu, Y., and He, G. (2023). Structure, function, and pathology of Neurexin-3. Genes Dis. 10, 1908–1919. doi: 10.1016/j.gendis.2022.04.008
Zhang, L., Zhang, W., Li, Z., Lin, S., Zheng, T., Hao, B., et al. (2022). Mitochondria dysfunction in CD8+ T cells as an important contributing factor for cancer development and a potential target for cancer treatment: a review. J. Exp. Clin. Canc. Res. 41:227. doi: 10.1186/s13046-022-02439-6
Zhang, H., Zhou, Y., Cui, B., Liu, Z., and Shen, H. (2020). Novel insights into astrocyte-mediated signaling of proliferation, invasion and tumor immune microenvironment in glioblastoma. Biomed. Pharmacother. 126:110086. doi: 10.1016/j.biopha.2020.110086
Zhang, W., Zhou, H., Li, H., Mou, H., Yinwang, E., Xue, Y., et al. (2023b). Cancer cells reprogram to metastatic state through the acquisition of platelet mitochondria. Cell Rep. 42:113147. doi: 10.1016/j.celrep.2023.113147
Zhao, Z., Zhang, K.-N., Wang, Q., Li, G., Zeng, F., Zhang, Y., et al. (2021). Chinese glioma genome atlas (CGGA): a comprehensive resource with functional genomic data from Chinese glioma patients. Genomics Proteomics Bioinformatics 19, 1–12. doi: 10.1016/j.gpb.2020.10.005
Keywords: Alzheimer’s disease, glioblastoma, mitochondria, multi-omics, biomarker
Citation: Xu X, Wang J, Chen T, Wang S, Wang F, He J, Meng X-Y and Shen Y (2025) Deciphering novel mitochondrial signatures: multi-omics analysis uncovers cross-disease markers and oligodendrocyte pathways in Alzheimer’s disease and glioblastoma. Front. Aging Neurosci. 17:1536142. doi: 10.3389/fnagi.2025.1536142
Edited by:
Anjali Garg, Washington University in St. Louis, United StatesReviewed by:
Ravinder Gulia, University of California, Irvine, United StatesCopyright © 2025 Xu, Wang, Chen, Wang, Wang, He, Meng and Shen. This is an open-access article distributed under the terms of the Creative Commons Attribution License (CC BY). The use, distribution or reproduction in other forums is permitted, provided the original author(s) and the copyright owner(s) are credited and that the original publication in this journal is cited, in accordance with accepted academic practice. No use, distribution or reproduction is permitted which does not comply with these terms.
*Correspondence: Xuan Xu, eHV4dWFuQGFobXUuZWR1LmNu; Yin Shen, c2hlbnlpbkBhaG11LmVkdS5jbg==
Disclaimer: All claims expressed in this article are solely those of the authors and do not necessarily represent those of their affiliated organizations, or those of the publisher, the editors and the reviewers. Any product that may be evaluated in this article or claim that may be made by its manufacturer is not guaranteed or endorsed by the publisher.
Research integrity at Frontiers
Learn more about the work of our research integrity team to safeguard the quality of each article we publish.