 Yuan Xie
 Wansheng Nie
 Yuchao Gao
 Yiheng Tong
95% of researchers rate our articles as excellent or good
Learn more about the work of our research integrity team to safeguard the quality of each article we publish.
Find out more
ORIGINAL RESEARCH article
Front. Aerosp. Eng. , 26 May 2022
Sec. Energetics and Propulsion
Volume 1 - 2022 | https://doi.org/10.3389/fpace.2022.876191
The volume of fluid (VOF) model and the adaptive mesh refinement (AMR) method are used to study the spray characteristics of a gas–liquid pintle injector and the effects of mass flow pulsation of liquid on it. A pintle injector is a thrust adjusting device that changes the injection area using movable parts. Pressure pulsation in the supply pipeline is simulated by periodically changing the mass flow rate of the inlet. Spray characteristics with constant and pulsating upstream flows are compared with each other. The effect of frequency and amplitude of upstream liquid flow pulsation on the spray performance was studied. The results reveal that holding the mass flow rate of the upstream liquid flow constant, under the impact of gas flow, the liquid block, the liquid filament, and a large number of small droplets are peeled off from the liquid film. The film breakup position stays relatively fixed, and the spray has a conical shape. However, when the upstream liquid flow is pulsating, the film breakup position changes periodically, and the spray has a “Christmas tree”-shape. The pulsation frequency has little effect on the spray angle. But it strongly determines the droplet size and the spatial distribution of the spray. In addition, the pulsation amplitude can enhance the phenomenon of “Christmas tree.” With the increase in pulsation amplitude, the liquid film at the outlet of the pintle injector appears with a periodic phenomenon of “contraction–expansion.”
Liquid rockets have the advantages of high specific impulse, high thrust, and repeatable ignition (Yang and Anderson, 1971; Ferraiuolo and Riccio, 2019; Khan and Qamar, 2020; Liang et al., 2021). In recent years, with the development of manned lunar exploration project and reusable rocket technology, large-scale variable-thrust liquid rockets have become a hot spot for investigation. The pintle injector is selected as the best choice for the injection system (Zhang et al., 2020). The most famous pintle injector engine is the Lunar Module Descent Engine (LMDE) used in the American “Apollo program,” with a maximum thrust of 44.52 kN and a 10:1 thrust adjustment capability (Dressler, 2013). At present, several SpaceX engines also use pintle injectors, and its engine variable thrust performance is in a leading position in the world (Dek et al., 2020).
In liquid rocket engines, the atomization of the liquid propellant can promote evaporation, mixing, and combustion. Since the 1980s, researchers from the United States (Dressler and Bauer, 2000; Gamertsfelder et al., 2020), South Korea (Son et al., 2015; Son et al., 2016a; Radhakrishnan et al., 2018), China (Zhang et al., 2014; Fang and Shen, 2017; Chen et al., 2019; Wang et al., 2020), Japan (Sakaki et al., 2015; 2018), and other countries have carried out a lot of investigations on the spray characteristics of pintle injectors, mainly focusing on the angle and the breakup process of the spray, together with size, velocity, mixing features, and other aspects of the droplets.
The pintle injector originated from the Jet Propulsion Laboratory (JPL) of the California Institute of Technology. It was first used to investigate the reaction rate of the hypergolic propellant (Dressler and Bauer, 2000), and then the pintle injector was used in the liquid rocket engine by TRW. Wang et al. (2020) studied the breakup and mixing processes of the pintle injector unit. Two different spray patterns were observed. Chen et al. (2019) studied the spray boundary, droplet size distribution, and flow field characteristics under different momentum ratios and found that the spray characteristics were also affected by the local momentum ratio. Fang and Shen (2017) obtained the effects of the structure parameters on SMD, droplet size distribution uniformity index, and spray angle. Sakaki et al. (2015) and Sakaki et al. (2018) used the ethanol/liquid oxygen pintle injector to evaluate the performance of a rocket engine. Nardi et al. (2015) also designed a pintle injector engine and conducted experiments. Min et al. (Son et al., 2015) experimentally studied the effects of momentum ratio and Weber number on the spray angle. They found that in addition to the lower liquid injection pressure drop, the spray angle was proportional to the momentum ratio and Weber number under all experimental conditions. Subsequently, a combination of experiments and numerical simulations were used to analyze the velocity distribution, spray angle, and the droplet spatial distribution. The discrete phase model (DPM) was used to explore the effects of injection conditions and geometric parameters on spray characteristics, but the model has certain flaws and cannot capture a detailed breakup phenomenon (Zhang et al., 2020).
Combustion instabilities caused by the coupling of heat release and acoustic pressure in the combustor may generate intense pressure fluctuations and lead to excessive heat that transfers to combustor walls and injector plates (Fang et al., 2021; Yang et al., 2021). Although tremendous human, material, and time resources have been invested by many countries since 1940s to determine ways to solve this problem, it has not yet been resolved. There are two significant characteristics of pressure fluctuations in the unstable combustion chamber: large amplitudes and obvious periodicity (Miller et al., 2007; Pomeroy and Anderson, 2016).
Propellant atomization is the basis of liquid rocket engine combustion. The length of liquid film breakup and droplet size distribution basically determine the combustion process, efficiency, and stability (Yang and Anderson, 1971). During the practical work of the liquid rocket engine, the liquid mass flow in the propellant supply pipeline has a certain form of pulsation, which directly affects the liquid film spray characteristics. The atomization subjected to pressure fluctuations may have a similar periodicity with which combustion instability occurs. It might be coupled with the combustion process under certain conditions, which may lead to pressure oscillations and unstable heat release in the combustion chamber (Yang et al., 2018).
The injection pressure oscillations accompany the mass flow oscillations that modulate the velocities of the liquid with time. Meanwhile, the faster droplets chase the slower droplets. A large proportion of droplets are superposed together at a certain point. This phenomenon called the “klystron effect” also appeared in impinging jet injectors (Heister et al., 1997) and swirl injectors (Khil et al., 2012). Mulmule et al. (2010) studied the crushing process of the circular liquid film formed by the front collision of two jets under sound pressure pulsation and found that the diameter of the circular liquid film and the average droplet size decreased. Ahn et al. (2012) developed mechanical pulsators and obtained the periodically changing air core diameters inside the transparent vortex chamber and the nozzle, as well as the spray near the exit nozzle using a high-speed camera. Yang and Turan (2017) studied the effect of disturbance frequency and amplitude on jet atomization. It is found that the jet is insensitive to high-frequency disturbance. The amplitude of disturbance has an important effect on droplet number and droplet size.
In summary, the steady spray characteristics of the pintle injector have been studied sufficiently. Meanwhile, upstream flow pulsation has a great influence on spray. However, the unsteady spray characteristics of the pintle injector have not yet been analyzed fully. Therefore, it is necessary to deeply understand the spray characteristics of the pintle injector under the condition of mass flow pulsation from the upstream propellants. In this study, a numerical study on the unsteady atomization process of a pintle injector is carried out. Effects of pulsation in the supply system on the spray performances are deeply analyzed.
The liquid film breaks up near the pintle injector outlet, and the droplets are very dense. In this study, the commercial software FLUENT is used for numerical calculation. Therefore, this study adopts the realizable k-epsilon model and the VOF model, combined with the adaptive mesh refinement (AMR) method to capture the detailed gas–liquid interface. In this numerical study, the unsteady pressure-based solver is selected. The separation scheme, the pressure-implicit with splitting of operators (PISO), and the second-order spatial discretization are employed.
The VOF model is utilized in the article to capture the atomization process and the interaction of liquid with gas (Dinic and Sharma, 2019). The advantage of the VOF model is that there is no need to deal with physical phenomena such as interface fragmentation and aggregation because these topological changes are implicitly included in the VOF model. Therefore, the VOF model is very suitable for atomization numerical calculation of liquid film fragmentation and aggregation.
In the VOF model, the volume fraction of each phase is defined as
where
When
where
The velocity
where
where
The same as the momentum equation, the energy equation also shared among phases, which is given as follows:
where
For flow problems involving complex shapes and free surfaces, sufficient grid resolution is required to ensure computational accuracy and stability. The significant advantage of the adaptive mesh refinement (AMR) method is to reduce calculations without loss of calculation accuracy (Xiang et al., 2020; Li and Soteriou, 2014). An octree is a tree-like data structure that describes a three-dimensional space. The use of an octree adaptive mesh for discretization can make dynamic adaptive algorithms simple and flexible. The AMR can automatically refine or coarsen the mesh at the intersection of the two phases. When the liquid block leaves the grid position, the hanging grids are automatically removed, which greatly reduces the calculation time and storage space, and improves the calculation efficiency. Figure 1 is a schematic diagram of the encryption process, where the grid elements are represented by cube elements. In this article, the gradient of the liquid phase volume fraction is used to adapt the grid at the gas–liquid interface, using two levels of adaptive grids to capture more subtle fluctuations at the gas–liquid interface.
FIGURE 1. Octree model (the green line represents primary encryption, and the red line represents secondary encryption).
However, it is very challenging to sample droplets through the VOF model at a given computational domain. In order to facilitate the statistics of droplets, the VOF-to-DPM (Jie and Peng, 2021) is studied and analyzed to study droplets. Due to the transition mechanism of the VOF-to-DPM, droplets can also be sampled at any given location in the simulation. Moreover, droplet properties such as volume, equivalent diameter, velocity, and position can be determined with the DPM. Since there are very few studies on the atomization process under pulsation conditions using the VOF-to-DPM, which cannot verify the effectiveness of VOF-to-DPM in capturing pulsation atomization, the VOF model is still adopted to study the spray characteristics with mass flow pulsation of liquid, and the VOF-to-DPM is only used to count the droplet size.
The near-spherical lumps are transferred from the VOF-to-DPM point masses based on two criteria on the lumps. The first criterion is based on the droplet size, and the droplets must be between the minimum and maximum volume-equivalent diameter. The specific formula is as follows:
where
The second criterion is based upon the droplet shape to support more coherent and smooth conversions. This criterion ensures that small irregular droplets or filaments are not transferred. The shape of the liquid lump is calculated in two ways: standard deviation of the normalized radius and average radius-surface orthogonality. The maximum asphericity
where
FIGURE 2. Diagram illustrating the asphericity index.
Then, the standard deviation of these weighted distances is computed and normalized by the average radius of the lump. Only droplets with asphericity below the specified maximum value can be converted. The specific formula is as follows:
The maximum asphericity
If the liquid lump satisfies both size and shape criteria, the liquid lump is removed from the VOF model and converted into particle in the Lagrange system. All locally adaptive mesh refinements used to solve the gas–liquid interface are automatically restored so that the Lagrange particle packets can be placed in a single-large grid. If the volume of the liquid mass is much larger than that of the coarser mesh, the liquid mass is converted into as many Lagrange particle packets as possible. Kim et al. (2007) and Chadha et al. (2021) employed a coupled VOF and DPM approach to model the atomization of fuel within a gas turbine injector, and the numerical results fit well with the experiment and can be used to predict the experimental results.
The structure of the pintle injector is shown in Figure 3, which is the same as that in the reference (Radhakrishnan et al., 2018). Specific dimensions are shown in Table 1. The liquid is injected from the inner channel. Then, the thin liquid film is formed and interacted with the high-speed gas in the outer channel. After that, the liquid film breaks up and tears down into small droplets.
FIGURE 3. Schematic of a pintle injector.
TABLE 1. Dimensions of a pintle injector.
Air and water are set to the primary and secondary phases in the simulation, respectively. The computational domain is shown in Figure 4. The minimum mesh cell size of the liquid out cross section is 40
FIGURE 4. Schematic diagrams showing the computational domain and boundary conditions (the cross-sectional surface is used to count the mass flow rate of liquid through it).
The outlet boundary is set as a pressure outlet, and the backflow volume fraction of water is set to 0, which means that the effect of backflow of water from outside the computational domain is not considered. The other boundaries are set as non-slip wall boundary conditions. The calculated Reynolds number and turbulence intensity are
In order to study the effect of pulsation frequency on spray, the pulsation amplitude is set to 0.15, and the specific frequency setting are shown in Table 2. In addition, the effect of pulsation amplitude on spray is studied. The frequency is set as 2,000 Hz, and the specific pulsation amplitude settings are shown in Table 2.
TABLE 2. Numerical simulation conditions with different pulsation frequencies and amplitudes.
The pressure at the minimum liquid outlet cross section (as shown in Figure 3) is calculated by CFD. The local pressure is much higher than the “saturated vapor pressure (2.33KPA)” at room temperature. So, the “cavitation” phenomenon could not occur, and the VOF model could be used for numerical analysis.
At the same time, the velocity of water with the maximum mass flow rate of liquid is calculated. The velocity of water at the minimum liquid outlet cross section is 27.1 m/s, and the air velocity at the gas outlet of the pintle injector is 176.26 m/s. They are both less than the local sound speed, so the gas and liquid channels are believed to be unchoked, which is in line with the design principle of the pintle injector (Son et al., 2016b).
Since experimental research about the effects of upstream pulsation on spray performance of a pintle injector has not been published, in the current study, to verify the accuracy of the numerical model, two validation cases are carried out. The verification process is shown in Figure 5.
FIGURE 5. Process of validating the numerical model.
The model was verified by the pintle injector spray under steady flow conditions, namely,
FIGURE 6. Spray patterns obtained in refereed (A) and numerical studies (B–D) at different grids under the same injection condition (operating condition:
Then, the upstream pulsation model is verified by using the pulsation boundary conditions with a cylindrical jet, which is the same as that in reference (Srinivasan et al., 2011). The numerical result is shown in Figure 7B, and the overall performance of the jet surface fluctuation pattern is in good agreement with results as shown in Figure 7A from reference (Srinivasan et al., 2011). It shows that the boundary condition of liquid inlet compiled by UDF can effectively simulate the flow pulsation of liquid. So it could be concluded that both the VOF method and the pulsation model in the current article are validated.
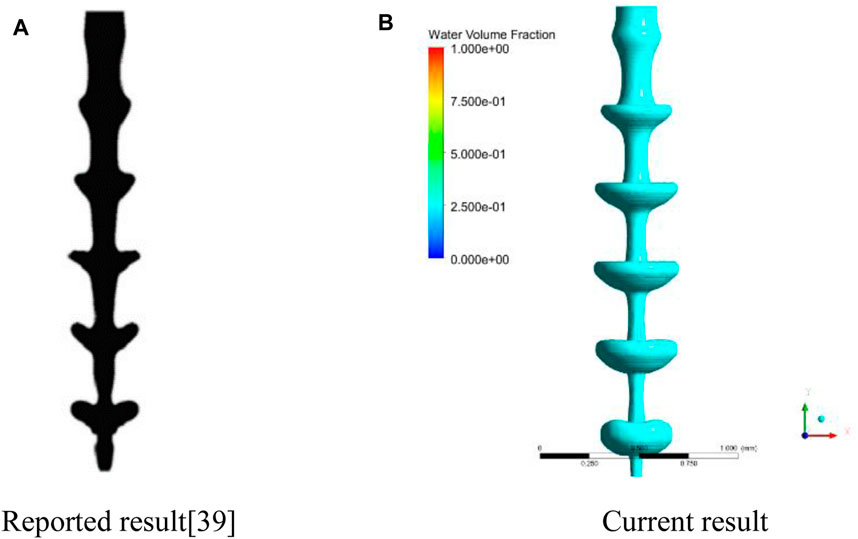
FIGURE 7. Comparison of the spray pattern between the reported and current results. (A) Reported computation result from the reference (Srinivasan et al., 2011). (B) Current computational result under the same pulsation boundary conditions of (A).
Case 1 (
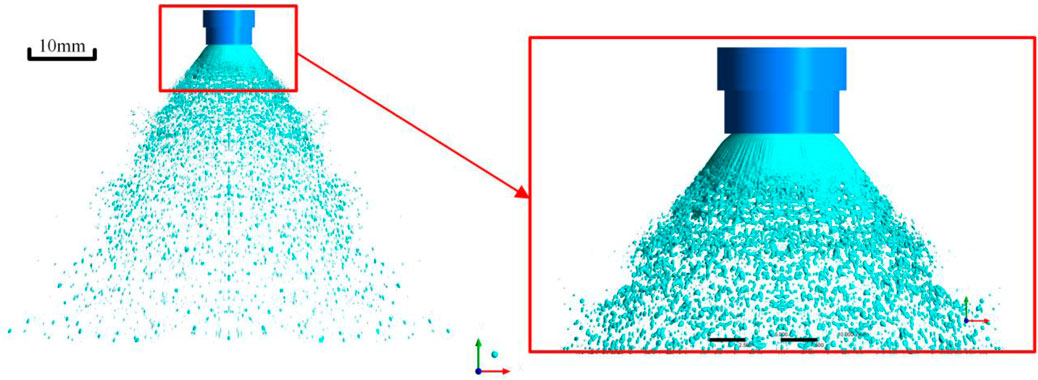
FIGURE 8. Spray pattern of case 1 (f = 0).
Figure 9 shows the streamline and velocity contour of case 1(f = 0). There are recirculation zones in the central region of the spray field. The outside droplets enter the central recirculation zone. After the gas and liquid collide, the velocity rapidly decays from 184 m/s at the gas outlet of the pintle injector to about 70 m/s. During this gas–liquid colliding process, there is a momentum exchange between the gas and the liquid. The impact of the gas on the liquid film makes the liquid film fluctuate. As the liquid film develops downstream, the thickness of the liquid film rapidly decreases, which promotes the breakup of the liquid film, as shown in Figure 10.
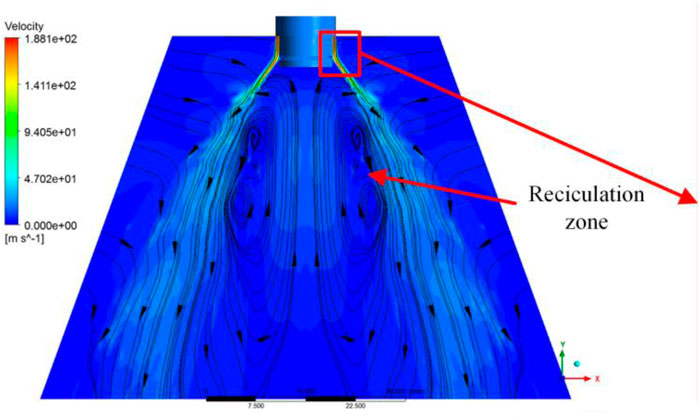
FIGURE 9. Velocity and streamline contour (case 1).
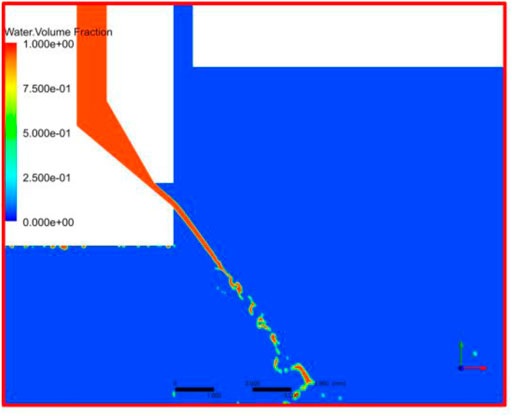
FIGURE 10. Water volume fraction distribution of the YOZ plane.
Case 3 (f = 1,000 Hz) is selected to reveal the spray characteristics under unsteady flow conditions, and the liquid film breakage pattern is shown in Figure 11. Different from the liquid film breakup with steady upstream, upstream pulsation promotes the liquid film breakup. There are two main reasons of liquid film breakage. First, the gas force and surface tension work together. The liquid film produces some irregular holes, and small droplets are generated near the holes (Chu et al., 2020). The size and the number of holes are further developed. Finally, the liquid film breaks up; meanwhile, the upstream fluctuation increases the instability of the liquid film and promotes the breakup, resulting in liquid filaments and liquid blocks earlier. Under the action of aerodynamic force, the liquid filaments and liquid blocks broke up further and produced small droplets. Statistics of the spray angle at different moments show that the spray angle does not change much in one cycle. The spatial distribution of the spray stays relatively stable. Compared with the spray under steady conditions, upstream pulsation can enlarge the spatial distribution of spray.
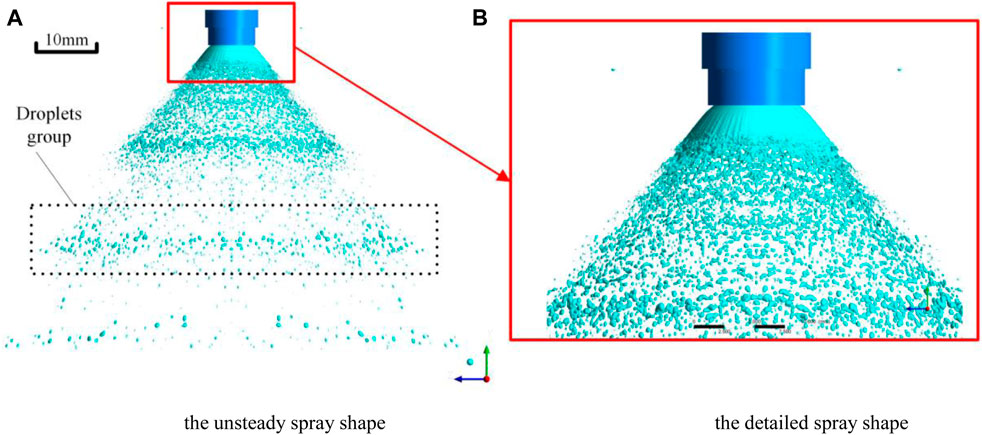
FIGURE 11. Spray shape of case 3 (f = 1,000 Hz). (A) Unsteady spray shape and the droplet group. (B) Detailed spray near the exit of the pintle injector.
Figure 12 shows the evolution of the spray in one cycle for case 3 (f = 1,000 Hz). Three obvious periodic droplet groups appear. The droplet group presents a shape of circular ring in space. With the downstream development of spray, the ring gradually becomes larger, so the number of droplets per unit space volume decreases and becomes sparse. The entire spray shows like a” Christmas tree.” The main reason is that the upstream flow pulsation causes periodic change of liquid film velocity at injector exit. The faster droplets can catch up slower droplets, so the droplet concentration region appears. Moreover, because of the radial velocity, the droplet continues to radially diffuse, and finally present the shape of the “Christmas tree.” This phenomenon is the specific embodiment of “klystron” (Kang et al., 2016a; Kang et al., 2016b) effect on the pintle injector.
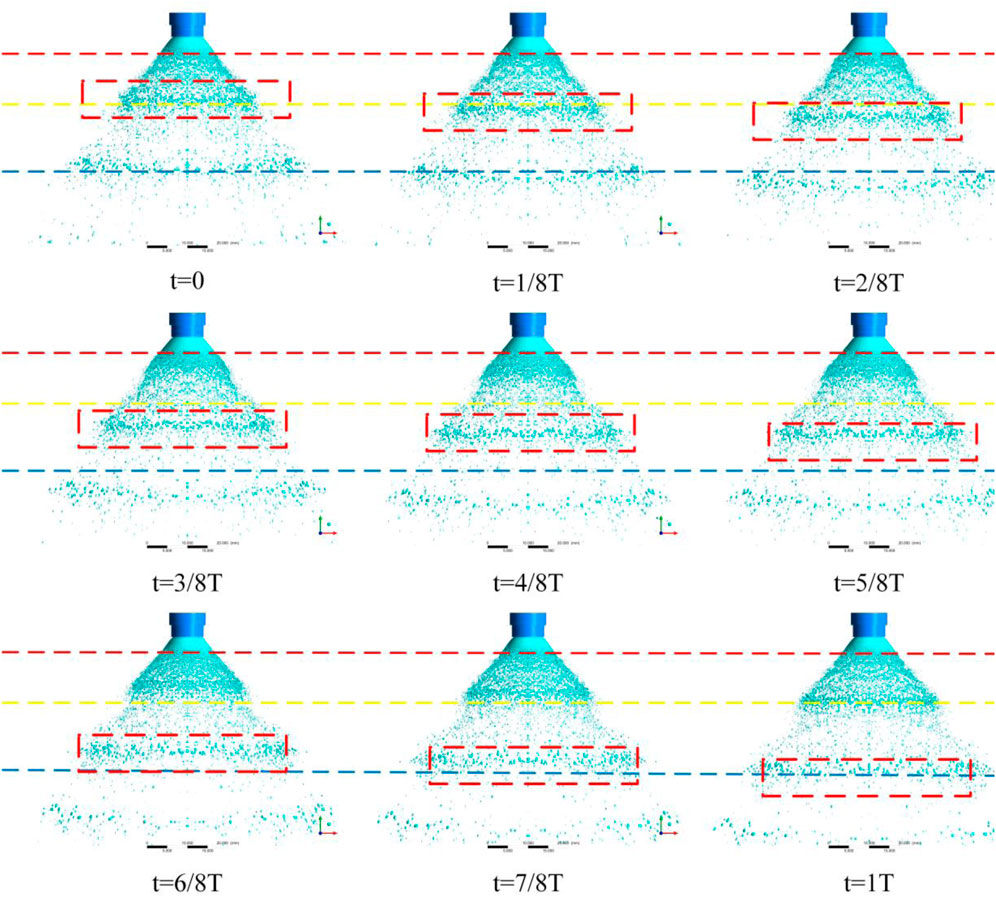
FIGURE 12. Pulsated spray patterns in one cycle under the unsteady flow condition of case 3 (f = 1,000 Hz).
Auxiliary lines are drawn on the spray cycle images, as shown in Figure 12. It can be seen that the length of the complete liquid film above the red line remains nearly fixed, while the broken position of the liquid film below the red line changes periodically. This is obviously different from the basically fixed position of liquid film breakup under steady upstream. The main reason is that the liquid film just coming out of the injector is still relatively thick and cannot be broken immediately. As the liquid film develops downstream, the thickness becomes thin, and when the broken boundary conditions of the liquid film are reached, the fragmentation occurs. At the same time, due to upstream pulsation, the liquid film velocity also changes periodically. When the liquid film velocity is small, the momentum of the liquid film is small and the liquid film is easy to be broken by the gas impact, so the breakup position of the liquid film is relatively close to the upper. When the liquid film speed is high, the momentum of liquid film is big and the liquid film moves rapidly downward, so the breakup position is relatively later. When the liquid film velocity changes periodically, the breakup position of the liquid film also changes periodically. In the spray region between the red line and yellow line, it is obvious that the droplet space quantity density changes periodically, which is also caused by upstream pulsation. The periodic change of space quantity density of droplet might lead to the periodic change of combustion heat release, which may be not conducive to the combustion stability of the liquid rocket engine.
When the liquid rocket engine is working, the violent vibration of the rocket causes the vibration of the propellant pipe, which can disturb the stability of mass flow rate of upstream propellant, affecting the spray characters (Yang et al., 2018). This part analyzes the effects of the pulsation frequency of upstream liquid propellant on the spray characteristics. The pulsation amplitude
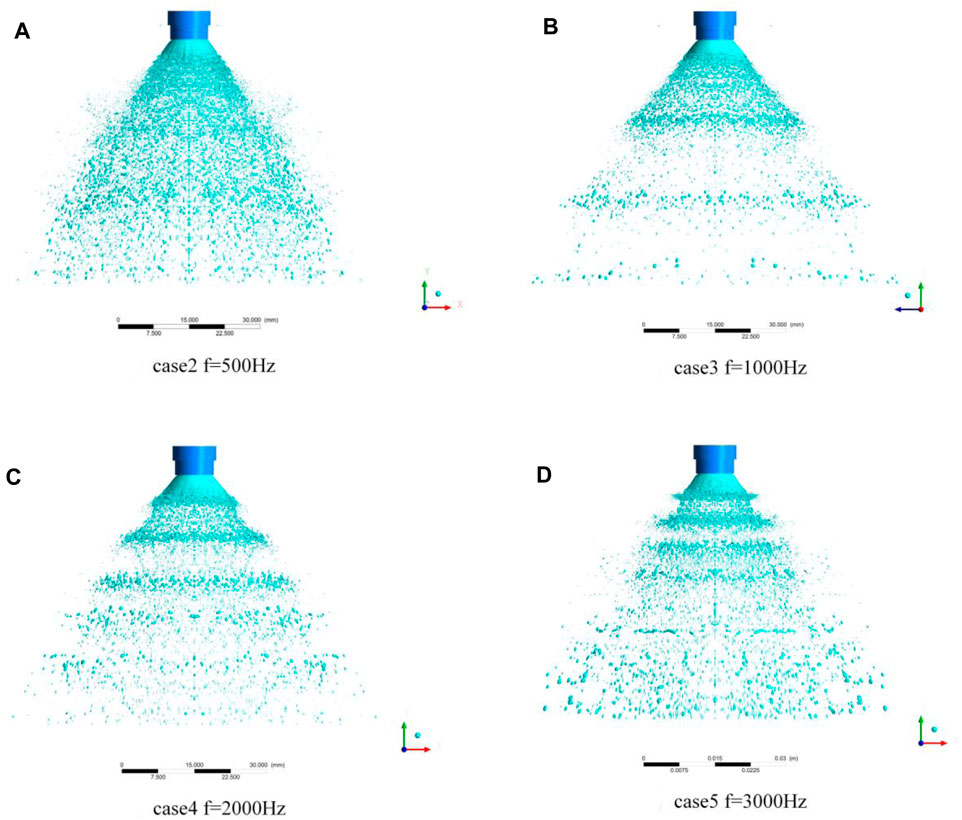
FIGURE 13. Comparison of the spray pattern under different pulsation frequencies: (A) case 2 (f = 500 Hz,
The mass flow rate of the liquid through the surface is monitored at different cross-sectional positions as shown in Figure 4, and the result is shown in Figure 14. From the aspect of waveform of the flow curve of the monitoring surface, under steady flow conditions, the mass flow rate at A, B, and C surfaces is almost constant, and the mass flow rate at D and E surfaces fluctuates evenly up and down the average value. It can be concluded that there is no significant difference in the velocity of droplets passing through the same location, the droplet is not locally gathered, and the droplet distribution in the spray field is relatively uniform. When there is a flow pulsation, the flow curve on A surface is sinusoidal, the flow curve on B and C surfaces is slightly deformed, and the flow curve on D and E surfaces turns into a steep peak waveform. The fluctuation value above the sinusoidal curve is much larger than that below that, and the value between the maximum fluctuation value and the minimum fluctuation value at different positions is different, indicating that the concentration degree of droplets at different positions is different.
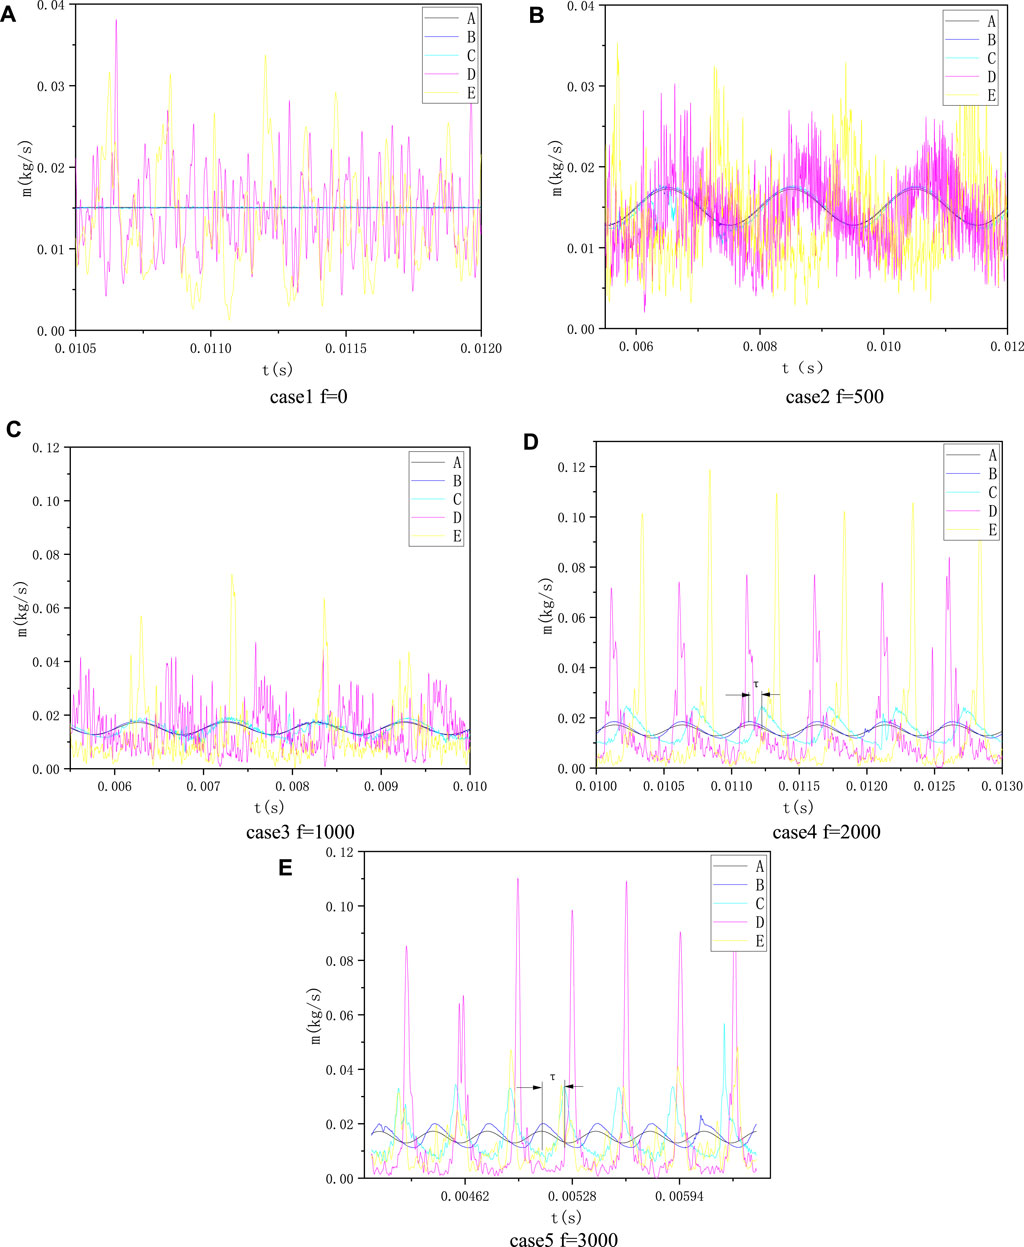
FIGURE 14. Mass flow rate of liquid with varying time at different pulsation frequencies (the pulsation amplitude is set as 0.15). (A) Case 1, f = 0 Hz. (B) Case 2, f = 500 Hz. (C) Case 3, f = 1,000 Hz. (D) Case 4, f = 2,000 Hz. (E) Case 5, f = 3,000 Hz.
According to the Rayleigh criterion (Rayleigh, 1878), when the phase of combustion chamber pressure and the combustion exothermic oscillation are consistent, the instable combustion may be excited. The droplet accumulation in the spray field may cause spatial oscillation of the combustion exotherm, so the mass flow pulsation of upstream liquid propellant at the special pulsation frequency may stimulate the combustion instability. When the liquid rocket is unstable at low and intermediate frequencies, the pressure curve at the position of the injector of the combustion chamber is sawtooth, and there is a correlation between the steep peak wave flow curve and the sawtooth pressure curve. Therefore, mass flow pulsation may be one of the reasons for the unstable combustion of liquid rockets at low and intermediate frequencies.
From the aspect of the fluctuation frequency of the flow curve of the monitoring surface, the frequency response of the mass flow rate of the passing monitoring surface to the upstream pulsation is consistent with that. However, there is a phase difference (or a time lag τ) between the response and the upstream pulsation, as shown in Figure 14D. It can be seen from the figure that the pulsation frequency has great effects on the phase difference. Take the phase difference of the flow curves of the A and C surfaces as an example. When the frequency is 500 and 1,000 Hz, the phase difference is small; when the frequency is 2,000 Hz, the phase difference is about 45°; and when frequency is 3,000 Hz, the phase difference increases to around 160°. In conclusion, the magnitude of the phase difference is positively correlated with the pulsation frequency.
The pulsation frequency of upstream liquid not only affects the phase difference but also affects the peak value of the flow curve. Taking the C surface flow curve as an example, as the pulsation frequency increases, the peak value of the flow curve becomes significantly larger. Compared with the frequency of 1,000 Hz, the peak value under the conditions of 2,000 and 3,000 Hz is increased by 27.8 and 73%, respectively. It shows that the higher the pulsation frequency, the more obvious the droplet groups aggregation phenomenon, which can also be seen from Figure 13. Most of the flow curves on the D and E surfaces also conform to this trend. However, the peak value of the E surface in Figure 14E is smaller than the upstream flow peak. The main reason is that the liquid film produces droplet groups earlier under high-frequency conditions. The droplet groups change sparsely before reaching the E surface so the peak flow of the mass rate on the E surface is reduced.
The droplet size distribution is analyzed, and the quantitative effect of pulsation frequency on droplet size is shown in Figure 15. Macroscopically, upstream pulsation can significantly reduce the droplet size. As the frequency of upstream pulsation increases, SMD, average droplet size, and median droplet size all increase. The main reason is that with the increase of the frequency, the same spray area can produce more droplet groups. After the same gas impact, small droplets with high pulsation frequency are more likely to gather and produce large droplets. What is more special is that the SMD value with a pulsation frequency of 3,000 Hz is greater than all other cases, probably because a few large droplets appear, so the SMD value increases sharply.
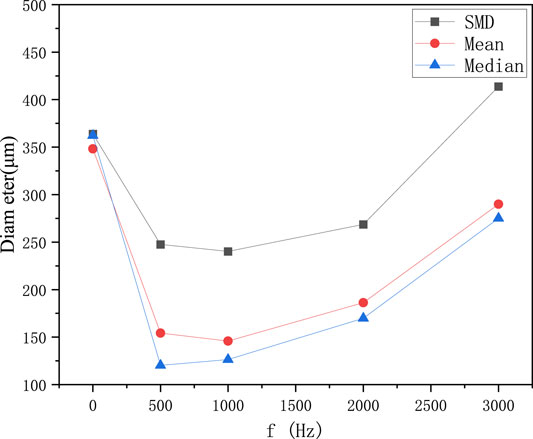
FIGURE 15. SMD, mean, and median diameter at different frequencies.
Figure 16 shows the effects of pulsation frequency on the probability distribution of the droplet size. When the upstream pulsates, the proportion of large droplets decreases while the proportion of small droplets increases, and the mean value of the probability distribution curve is moving to the right. It also can be concluded that under the action of upstream pulsation, the average droplet size decreases. Meanwhile, the droplet size increases with the increase of the pulsation frequency, but it does not exceed the droplet size under steady state flow condition. The main reason is that upstream pulsation enhances the instability of the liquid film. After the gas impact, liquid film breakup earlier, and the time of droplets subjected to gas–liquid shear becomes longer, and the droplets become smaller. The numerical results show that when the upstream pulsates, the number of droplets in the local area of the atomization field increases significantly and the droplet size decreases.
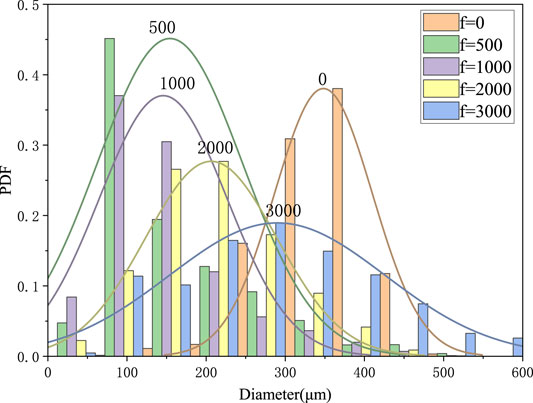
FIGURE 16. Probability density function (PDF) distribution of droplet diameter at different frequencies.
The spatial position of the droplets is displayed in the coordinate system and projected. The effects of pulsation frequency on the droplet space distribution are shown in Figure 17. In the spray region, the number of “bulging” structures is 0, 1, 2, 4, and 7 in order. The number of “bulging” structures is linearly related to the pulsation frequency, indicating that the number of “bulging” structures response to the upstream pulsation frequency is linear. It can be clearly seen that the central region of the spray zone has smaller droplets, and the outer droplets are larger, indicating that the internal recirculation region plays a role in improving the quality of atomization.
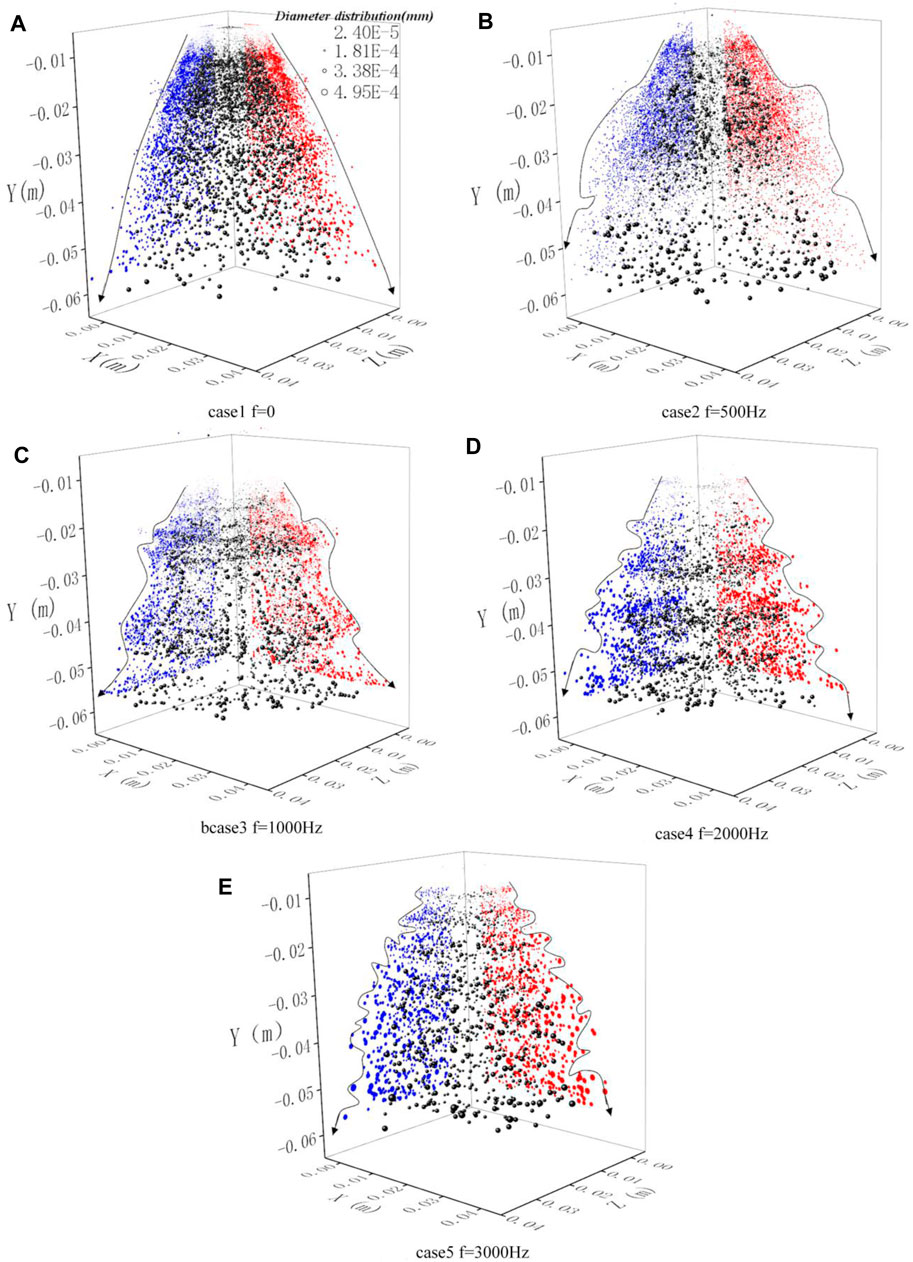
FIGURE 17. Velocity and diameter distribution of droplets at different distribution frequencies. (A) Case 1, f = 0 Hz. (B) Case 2, f = 500 Hz. (C) Case 3, f = 1,000 Hz. (D) Case 4, f = 2,000 Hz. (E) Case 5, f = 3,000 Hz.
This part analyzes the effects of the pulsation amplitude of upstream liquid propellant on the spray characteristics. The pulsation frequency
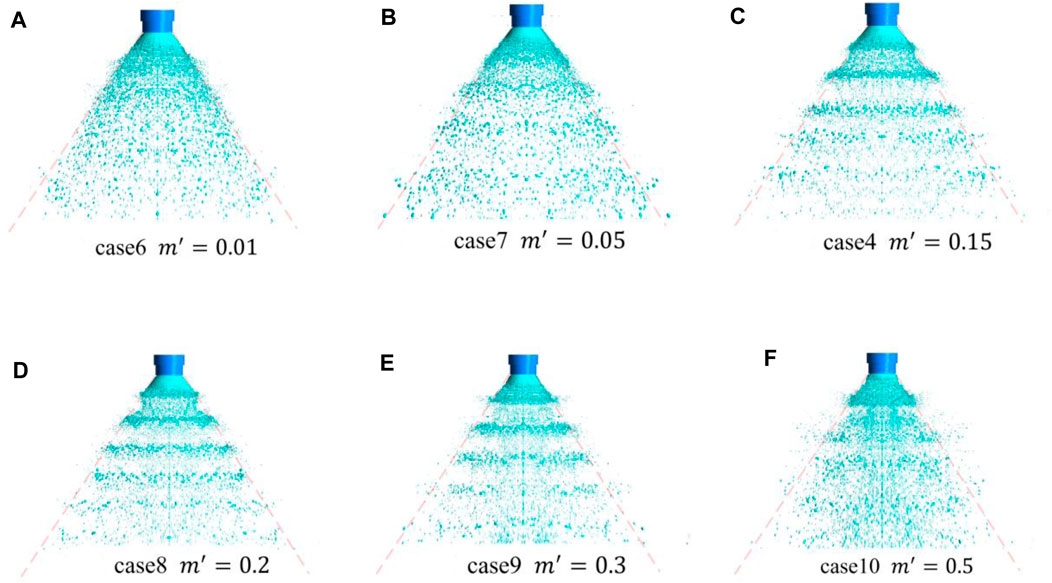
FIGURE 18. Spray pattern under different pulsation amplitudes (the angle of the auxiliary line is fixed; the pulsation frequency is set as 2,000 Hz).
In Figure 18, the auxiliary line with a fixed angle is made, and it can be seen that the overall spray region does not change significantly, and the spray angle is almost constant. However, the spray shrink toward the central region with the pulsation amplitude increases, resulting in the increase of droplet space density in the central region. The main reason is that the liquid velocity is relatively smaller when the liquid flow is less than the average flow in the cycle. After being impacted by gas, the liquid film is quickly blown down to the center region of the spray field, resulting in an increase in droplets in the center region, and then the overheating of the pintle injector tip may occur in the actual work of the rocket engine. In previous experiments (Vasques and Haidn, 2017), the problem of erosion of the pintle injector tip had occurred.
The dominant feature in the early stages of “Christmas tree”-shaped spray is the periodic “contraction and expansion” of the liquid film near the pintle injector exit. This phenomenon becomes more pronounced as the amplitude increases. Case 10 (
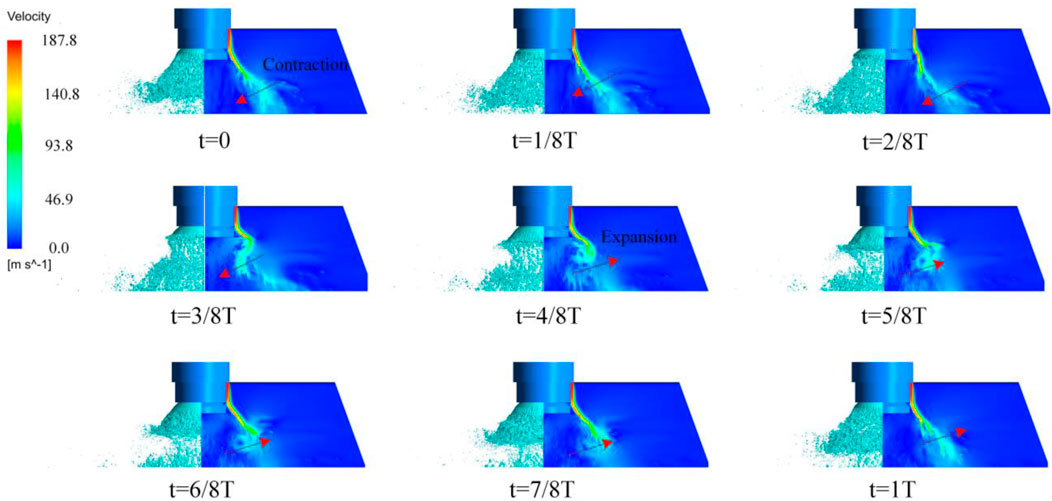
FIGURE 19. Spray pattern of the liquid film at the pintle injector exit within one pulsation cycle of case 10,
The effect of pulsation amplitude on the mass flow rate of liquid at the monitoring surface is shown in Figure 20. Under the condition of small amplitude (
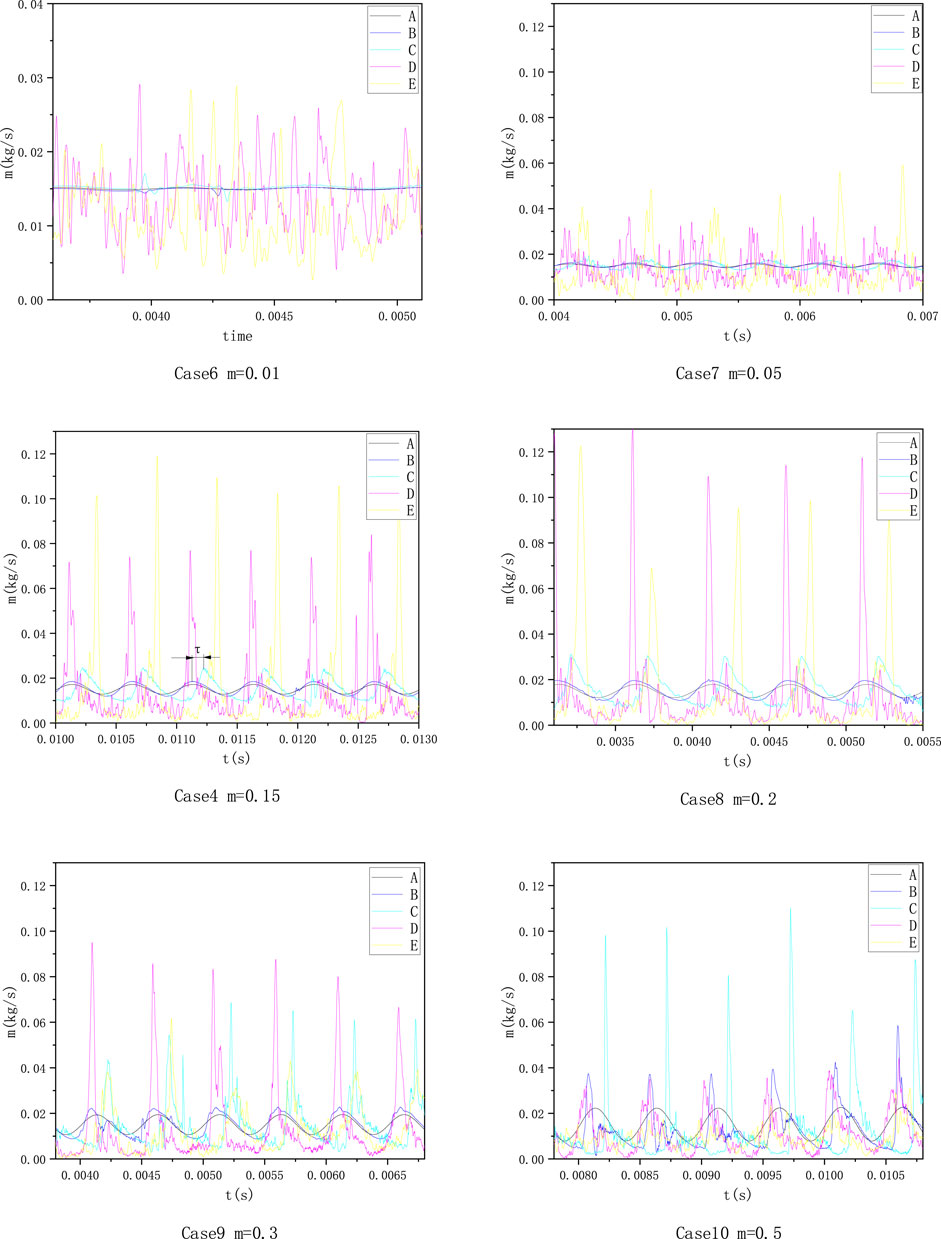
FIGURE 20. Time varying mass flow rate at different pulsation amplitudes (the pulsation frequency is set as 2,000 Hz).
A surface calculates the liquid mass flow at the liquid inlet, so the flow curve is sinusoidal with different amplitudes. The mass flow rate of liquid at the injector liquid outlet was calculated through B surface. When the amplitude was between 0.01 and 0.2, the flow curve of B surface was very similar to that at A surface. When the amplitude is 0.3 the waveform of the flow curve at B surface changes partially. When the amplitude is 0.5, the waveform at B surface changes obviously, and the peak value increases 66.7% compared with that of the amplitude of 0.3. It shows that the fluctuation of the liquid film at the injector outlet becomes more obvious with the increase in amplitude. Compared with the flow curve at B surface, the flow curve at C surface is deformed more strongly with the same amplitude.
In the amplitude range of 0.01–0.5, the peak value of flow curves of D and E are different from those of A, B, and C surfaces. The peak flow at D surface increases between amplitudes of 0.01 and 0.2, and decreases between amplitudes of 0.3 and 0.5. The flow curve of E surface also conforms to this trend, but the amplitude corresponding to the peak transition is different from that of D surface. The flow peak decreased, indicating that the degree of droplet aggregation decreased. In the decreasing range of the peak value, the higher the amplitude is, the more obvious the liquid film swings at the injector outlet, and the more difficult it is for droplet groups to maintain the form of aggregation in the downstream. E surface is located downstream of D surface, so the droplet group distribution at E surface is more dispersed, and the amplitude corresponding to the drop point of peak flow at E surface is smaller than that in D surface.
The changing trend of the flow curve at D and E surfaces of case 10 (m = 0.5) conforms to the previous analysis, but the value of the mass flow rate is smaller than that of other amplitudes. To explain this phenomenon, a parameter is defined: capturing rate of the mass flow rate
where the average mass rate at C (D or E) is obtained by calculating the average mass flow rate at C, D, and E surfaces with different amplitudes in Figure 20. The results are shown in Figure 21. It can be seen from Figure 21 that
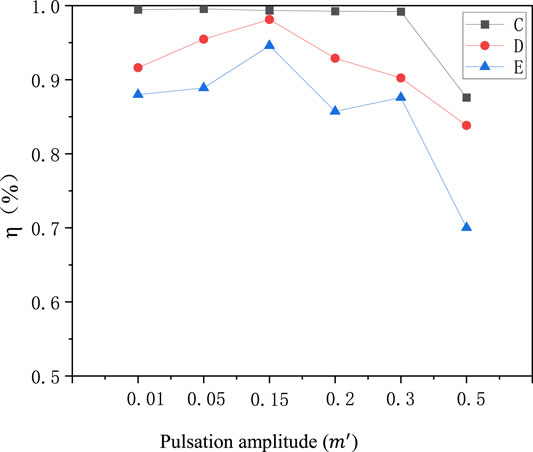
FIGURE 21. Capture rate of the mass flow rate of the liquid at C, D, and E surfaces with different amplitudes (the pulsation frequency is set as 2,000 Hz).
The reason why case 10 (
The quantitative effects of pulsation amplitude on particle size are shown in Figure 22. Macroscopically, pulsation amplitude has great effects on droplet size. With the increase in pulsation amplitude, SMD, mean particle size, and median particle size all decrease. The reason is that liquid film instability is enhanced, and liquid film breakup is more likely to occur because of mass flow pulsation. Moreover, the droplet size decreases with the increase in pulsation amplitude. When the mass flow rate is greater than the average mass flow rate, the liquid film velocity is bigger and the gas–liquid interaction is stronger, which is conducive to the liquid film breakup. When the mass flow rate is lower than the average mass flow rate, the liquid film velocity is smaller, and it is easier to be impacted by the external airflow and broken into droplets. Therefore, the presence of upstream pulsation reduces the droplet size, and the larger the pulsation amplitude is, the more obvious the droplet size decrease is.
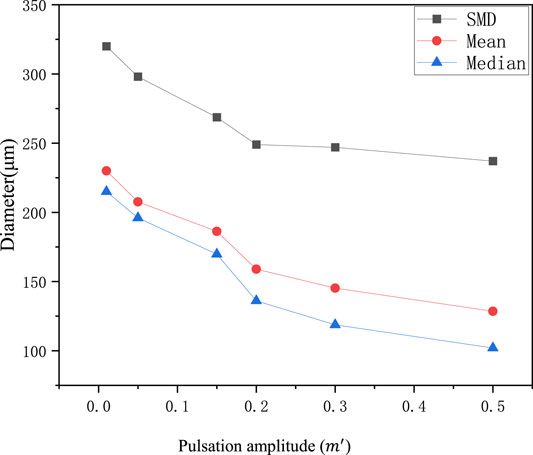
FIGURE 22. SMD, mean, and median diameter at different pulsation amplitudes (the pulsation frequency is set as 2,000 Hz).
Figure 23 shows the effects of pulsation amplitude on the probability distribution of droplet size. With the increase in pulsation amplitude, the proportion of large droplets decreases and that of small droplets increases. It shows that under the action of upstream pulsation, the average droplet size decreases. On the other hand, with the increase in pulsation amplitude, the distribution curve becomes thin and high, indicating that the droplet particle size distribution becomes concentrated and uniform.
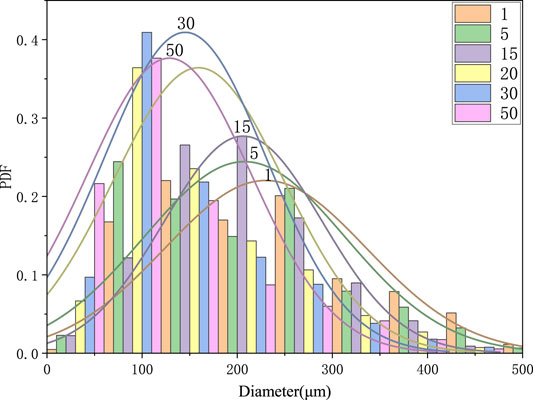
FIGURE 23. Probability density function (PDF) distribution of droplet diameter at different pulsation amplitudes (the pulsation frequency is set as 2,000 Hz).
In conclusion, the increase in pulsation amplitude is beneficial to the decrease in droplet size, and the droplet size distribution is relatively concentrated. In terms of droplet combustion heat release, this may be conducive to the uniform heat release of droplet combustion and reduces the pressure difference at different positions in the combustion chamber.
This investigation uses numerical methods to study the spray characteristics of the pintle injector with and without pulsation in the upstream liquid propellant, and the main conclusions are as follows:
(1) Using the volume of fluid (VOF) model and the adaptive mesh refinement (AMR) method to effectively capture the liquid film fluctuation process and the entire atomization process of the pintle injector under steady conditions, the overall spray shape is a cone structure, and the existence of the inner central recirculation region improves the droplet mixing effect.
(2) Under unsteady flow conditions, the droplet morphology is more diversified, the breakup position of the liquid film changes periodically, the spray angle does not change much in one cycle, the overall spray region is relatively stable, the central spray area expands outward, and the overall spray shape appears as a “Christmas tree.”
(3) With the increase in the pulsation frequency, the axial distance of the droplet groups decreases, and the number of droplet groups appearing increases, and the falling frequency of large liquid blocks is consistent with the pulsation frequency. The response of the mass flow rate of the monitoring face to the upstream flow pulsation is consistent with that, but there is a phase difference τ; the pulsation frequency also affects the peak value of the flow curve, droplet size, and spatial distribution.
(4) With the increase in pulsation amplitude, the “klystron effect” of the spray becomes more obvious. When the pulsation amplitude is very small (
The original contributions presented in the study are included in the article/Supplementary Material, further inquiries can be directed to the corresponding author.
YX: Main completion of simulation. WN: Provided simulation assistance. YG: provided data processing assistance. YT: Undertook the project design and provided simulation computing resources.
The authors declare that the research was conducted in the absence of any commercial or financial relationships that could be construed as a potential conflict of interest.
All claims expressed in this article are solely those of the authors and do not necessarily represent those of their affiliated organizations, or those of the publisher, the editors, and the reviewers. Any product that may be evaluated in this article, or claim that may be made by its manufacturer, is not guaranteed or endorsed by the publisher.
Ahn, B., Ismailov, M., and Heister, S. D. (2012). Experimental Study Swirl Injector Dynamic Response Using a Hydromechanical Pulsator. J. Propuls. Power 28 (3), 585–595. doi:10.2514/1.b34261
Chadha, S., Jefferson-Loveday, R., and Hussain, T. (2021). A High-Fidelity Simulation of the Primary Breakup within Suspension High Velocity Oxy Fuel Thermal Spray Using a Coupled Volume of Fluid and Discrete Phase Model - Science Direct[J]. Int. J. Multiph. Flow 133, 103445. doi:10.1016/j.ijmultiphaseflow.2020.103445
Chen, H.-Y., Li, Q.-L., Cheng, P., Lin, W.-H., and Li, C.-Y. (2019). Influence of Momentum Ratio and its Throttling Method on Spray Characteristics of Pintle Injector. Acta Phys. Sin. 68 (20), 204704. doi:10.7498/aps.68.20190671
Chu, W., Li, X., Tong, Y., and Ren, Y. (2020). Numerical Investigation of the Effects of Gas-Liquid Ratio on the Spray Characteristics of Liquid-Centered Swirl Coaxial Injectors. Acta Astronaut. 175, 204–215. doi:10.1016/j.actaastro.2020.05.050
Dek, C., Overkamp, J.-L., Toeter, A., Hoppenbrouwer, T., Slimmens, J., van Zijl, J., et al. (2020). A Recovery System for the Key Components of the First Stage of a Heavy Launch Vehicle. Aerosp. Sci. Technol. 100, 105778. doi:10.1016/j.ast.2020.105778
Dinic, J., and Sharma, V. (2019). Computational Analysis of Self-Similar Capillary-Driven Thinning and Pinch-Off Dynamics During Dripping Using the Volume-Of-Fluid Method. Phys. Fluids 31, 021211. doi:10.1063/1.5061715
Dressler, G., and Bauer, J. (2000). “TRW Pintle Engine Heritage and Performance Characteristics[C],” in Las Vegas: 36th Joint Propulsion Conference and Exhibit, 24 July 2000 - 28 July 2000 (Las Vegas, NV, U.S.A: AIAA). doi:10.2514/6.2000-3871
Dressler, G. (2013). “Summary of Deep Throttling Rocket Engines with Emphasis on Apollo LMDE,” in 42 nd//Aiaa/asme/sae/asee Joint Propulsion Conference & Exhibit, 9–12, July (Sacramento, California: Spacecraft Engines and Propulsion Systems III). doi:10.2514/6.2006-5220
Fang, X.-x., and Shen, C.-b. (2017). Study on Atomization and Combustion Characteristics of LOX/Methane Pintle Injectors. Acta Astronaut. 136, 369–379. doi:10.1016/j.actaastro.2017.03.025
Fang, Y., Yang, Y., Hu, K., Wang, G., Li, J., and Zheng, Y. (2021). Experimental Study on Self-Excited Thermoacoustic Instabilities and Intermittent Switching of Azimuthal and Longitudinal Modes in an Annular Combustor. Phys. Fluids 33, 084104. doi:10.1063/5.0059315
Ferraiuolo, M., and Riccio, A. (2019). Study of the Effects of Materials Selection for the Closeout Structure on the Service Life of a Liquid Rocket Engine Thrust Chamber. J. Mater. Eng. Perform. 28, 3186–3195. doi:10.1007/s11665-019-03896-5
Gamertsfelder, J., Khare, P., and Bravo, L. (2020). “Investigation of Atomization Behaviors of Liquid Monopropellants in Pintle Injectors[C],” in ASME Turbo Expo 2020: Turbomachinery Technical Conference and Exposition, London, United Kingdom, June 22–26, 2020 (International Gas Turbine Institute).
Heister, S. D., Rutz, M. W., and Hilbing, J. H. (1997). Effect of Acoustic Perturbations on Liquid Jet Atomization. J. Propul. Power 13 (5), 82–88. doi:10.2514/2.5132
Jie, L. A., and Peng, K. B. (2021). Modelling and Analysis of Initial Icing Roughness with Fixed-Grid Enthalpy Method Based on DPM-VOF Algorithm. Chin. J. Aeronautics (5), 85–96. doi:10.1016/j.cja.2021.07.028
Kang, Z., Li, Q., Peng, C., Zhang, X., and Wang, Z. (2016). Effects of Recess on the Self-Pulsation Characteristics of Liquid-Centered Swirl Coaxial Injectors. J. Propuls. Power 32, 1–9. doi:10.2514/1.b35632
Kang, Z., Li, Q., Peng, C., Zhang, X., and Wang, Z. G. (2016). Effects of Self-Pulsation on the Spray Characteristics of Gas–Liquid Swirl Coaxial Injector. Acta Astronaut. 127, 38. doi:10.1016/j.actaastro.2016.05.038
Khan, T. W., and Qamar, I. (2020). Optimum Characteristic Length of Gas Generator for Liquid Propellant Rocket Engine. Acta Astronaut. 176, 1–12. doi:10.1016/j.actaastro.2020.06.021
Khil, T., Chung, Y., Bazarov, V. G., and Yoon, Y. (2012). Dynamic Characteristics of Simplex Swirl Injector in Low Frequency Range. J. Propul. Power 28 (5), 323–333. doi:10.2514/1.b34169
Kim, D., Desjardins, O., Herrmann, M., and Moin, P. (2007). “The Primary Breakup of a Round Liquid Jet by a Coaxial Flow of Gas,” in ILASS Americas 20th Annual Conference on Liquid Atomization and Spray Systems, Chicago, May, 2007 (Chicago, IL: Center for Turbulence Research).
Li, X., and Soteriou, M. C. (2014). “High-Fidelity Simulation of High Density-Ratio Liquid Jet Atomization,” in Crossflow with Experimental Validation, ILASS Americas 26th Ann. Conf. on Liq. Atom. and Spray Syst, Portland, OR, May 2014 (Nashville, Tennessee: AIAA).
Liang, T., Song, J., Li, Q., Cui, P., Cheng, P., and Chen, L. (2021). System Scheme Design of Electric Expander Cycle for LOX/LCH4 Variable Thrust Liquid Rocket Engine. Acta Astronaut. 186, 451–464. doi:10.1016/j.actaastro.2021.06.015
Miller, K., Sisco, J., Nugent, N., and Anderson, W. (2007). Combustion Instability with a Single-Element Swirl Injector. J. Propuls. Power 23 (5), 1102–1112. doi:10.2514/1.26826
Mulmule, A. S., Tirumkudulu, M. S., and Ramamurthi, K. (2010). Instability of a Moving Liquid Sheet in the Presence of Acoustic Forcing. Phys. Fluids 22, 022101. doi:10.1063/1.3290745
Nardi, R., Perez, V., and Pimenta, A. (2015). “Experiments with Pintle Injector Design and Development[C],” in Aiaa/sae/asee Joint Propulsion Conference, Orlando, FL, July 27–29, 2015 (Orlando, FL: AIAA).
Pomeroy, B., and Anderson, W. (2016). Transverse Instability Studies in a Subscale Chamber. J. Propuls. Power 32 (4), 939–947. doi:10.2514/1.b35763
Radhakrishnan, K., Son, M., Lee, K., and Koo, J. (2018). Effect of Injection Conditions on Mixing Performance of Pintle Injector for Liquid Rocket Engines. Acta Astronaut. 150, 105–116. doi:10.1016/j.actaastro.2017.12.012
Rayleigh, L. (1878). The Explanation of Certain Acoustical Phenomena 1. Nature 18, 319–321. doi:10.1038/018319a0
Sakaki, K., Choi, M., Nakaya, S., Tsue, M., Hiraiwa, T., and Sciences, S. (2015). Fundamental Combustion Characteristics of Ethanol/Liquid Oxygen Rocket Engine Combustor with Planar Pintle-Type Injector. Trans. Jpn. Soc. Aero. S Sci. 58 (1), 15–22. doi:10.2322/tjsass.58.15
Sakaki, K., Funahashi, T., Nakaya, S., Tsue, M., Kanai, R., Suzuki, K., et al. (2018). Longitudinal Combustion Instability of a Pintle Injector for a Liquid Rocket Engine Combustor. Combust. Flame 194, 115–127. doi:10.1016/j.combustflame.2018.04.017
Son, M., Radhakrishnan, K., and Koo, J. (2016). Design Procedure of a Movable Pintle Injector for Liquid Rocket Engines[J]. J. Propuls. Power 2016, 1–12. doi:10.2514/1.B36301
Son, M., Yu, K., Koo, J., Kwon, O. C., and Kim, J. S. (2015). Effects of Momentum Ratio and Weber Number on Spray Half Angles of Liquid Controlled Pintle Injector. J. Therm. Sci. 24, 37–43. doi:10.1007/s11630-015-0753-7
Son, M., Yu, K., Radhakrishnan, K., Shin, B., and Koo, J. (2016). Verification on Spray Simulation of a Pintle Injector for Liquid Rocket Engine. J. Therm. Sci. 25, 90–96. doi:10.1007/s11630-016-0838-y
Srinivasan, V., Salazar, A. J., and Saito, K. (2011). Modeling the Disintegration of Modulated Liquid Jets Using Volume-Of-Fluid (VOF) Methodology. Appl. Math. Model. 35 (Issue 8), 3710–3730. doi:10.1016/j.apm.2011.01.040
Vasques, B., and Haidn, O. J. (2017). “Effect of Pintle Injector Element Geometry on Combustion in a Liquid Oxygen/Liquid Methane Rocket Engine,” in München: 7th European Conference for Aeronautics and Aerospace Sciences, Lodon, England, June 22-26, 2020 (Milan). doi:10.13009/EUCASS2017-88
Wang, K., Lei, F. P., and Yang, A. L. (2020). Numerical Simulation on Spray and Mixing Process of Impingement Between Sheet and Jet in Pintle Injector Element[J]. Acta Aeronautica Astronautica Sinica 41 (X), 123802. doi:10.7527/S10006893.2020.23802
Xiang, G., Ren, Z., Kim, S., and Wang, B. (20201). Numerical Analysis on the Disintegration of Gas-Liquid Interface in Two-Phase Shear-Layer Flows. Aerosp. Sci. Technol. 98, 105710–109638. doi:10.1016/j.ast.2020.105710
Yang, A., Yang, S., Yunfei, X. U., and Longfei, L. I. (2018). Periodic Atomization Characteristics of Simplex Swirl Injector Induced by Klystron Effect. Chin. J. Aeronautics 31 (05), 204–212. doi:10.1016/j.cja.2018.02.016
Yang, V., and Anderson, W. E. (1971). Liquid Rocket Engine Combustion Instability. Prog. Astronautics Aeronautics (6), 106–115. doi:10.2514/4.866371
Yang, X., and Turan, A. (2017). Simulation of Liquid Jet Atomization Coupled with Forced Perturbation. Phys. Fluids 29, 022103. doi:10.1063/1.4976621
Yang, Y., Wang, G., Fang, Y., Jin, T., and Li, J. (2021). Experimental Study of the Effect of Outlet Boundary on Combustion Instabilities in Premixed Swirling Flames. Phys. Fluids 33 (2), 027106. doi:10.1063/5.0038984
Zhang, R., Lan, X., Chen, W., and Lei, J. (2014). The Development of 7500 N Variable Thrust Engine for Chang’ E-3. Sci. Sin.-Tech. 44, 569–575. doi:10.1360/092014-52
Keywords: pintle injector, volume of fluid (VOF) fraction, AMR, simulation, mass flow pulsation, spray characteristics
Citation: Xie Y, Nie W, Gao Y and Tong Y (2022) Numerical Investigation on Spray Characteristics With Upstream Flow Pulsation of a Pintle Injector. Front. Aeroesp. Eng. 1:876191. doi: 10.3389/fpace.2022.876191
Received: 15 February 2022; Accepted: 19 April 2022;
Published: 26 May 2022.
Edited by:
Leonid Tartakovsky, Technion Israel Institute of Technology, IsraelReviewed by:
Marek Mlkvik, Slovak University of Technology in Bratislava, SlovakiaCopyright © 2022 Xie, Nie, Gao and Tong. This is an open-access article distributed under the terms of the Creative Commons Attribution License (CC BY). The use, distribution or reproduction in other forums is permitted, provided the original author(s) and the copyright owner(s) are credited and that the original publication in this journal is cited, in accordance with accepted academic practice. No use, distribution or reproduction is permitted which does not comply with these terms.
*Correspondence: Yiheng Tong, eWloZW5nX3RvbmdAc2luYS5jb20=
Disclaimer: All claims expressed in this article are solely those of the authors and do not necessarily represent those of their affiliated organizations, or those of the publisher, the editors and the reviewers. Any product that may be evaluated in this article or claim that may be made by its manufacturer is not guaranteed or endorsed by the publisher.
Research integrity at Frontiers
Learn more about the work of our research integrity team to safeguard the quality of each article we publish.