
94% of researchers rate our articles as excellent or good
Learn more about the work of our research integrity team to safeguard the quality of each article we publish.
Find out more
ORIGINAL RESEARCH article
Adv. Opt. Technol., 08 November 2024
Sec. Optical Manufacturing and Design
Volume 13 - 2024 | https://doi.org/10.3389/aot.2024.1494705
This article is part of the Research TopicOptoelectronics, Ultrafast Optics, and Terahertz Radiations for Advanced Device ApplicationsView all 4 articles
This paper aims to present data recorded by a three-axial Fiber-Optic Rotational Seismograph (FORS). The laboratory and field tests showed a high correlation coefficient above 99% between two seismographs signals during the external disturbance, with an amplitude ranging from 0.5 mrad/s to 1.2 rad/s. This is achieved by ensuring a 100 ns time synchronization in the systems. At the same time, the Allan Variance analysis was applied to determine the basic parameters of random errors of the presented seismographs. The performed analysis indicates the angular random walk of 35–45 nrad/s/√Hz and a bias instability below 50 nrad/s. FORS offers the widest dynamic range available, at 170 dB, which is crucial during rotational seismology exploration due to its wide range of interest from seismology to engineering applications. Finally, a field research is also presented during an explosion in a closed limestone quarry in the border area.
Seismic measurements are widely used in mining, geophysics and civil engineering. Mainly, recordings of velocities and accelerations of three translational components (ux, uy, uz) of vibrations along axes shown in Figure 1 are carried out. However, knowing that a complete description of seismic wave motion also contains three rotational components (Ωx, Ωy, Ωz), it is necessary to conduct deep research aimed at measuring and determining the nature of rotational motions. Over the last decade, the subject of rotational ground vibrations has become an essential topic in seismological research (Zembaty et al., 2021; Lee et al., 2009; Yuan et al., 2020).
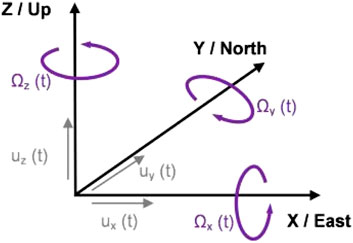
Figure 1. Six degrees of freedom of ground motion: three translational [ux(t), uy(t), uz(t)] and three rotational [Ωx(t), Ωy(t), Ωz(t)] components of motion (Zembaty et al., 2021).
The emergence of sensors enabling direct measurement of rotational components of seismic vibrations on the market allowed the expansion of rotational motion analysis from the theoretical to the experimental sphere. Rotational measurements are carried out not only in the case of high-energy earthquakes (Lin et al., 2009) but also in civil engineering (Trifunac, 2009; Zembaty et al., 2016) including structural health monitoring (Murray-Bergquist et al., 2021), mining geophysics (Kalab et al., 2013; Zembaty et al., 2017), and even in measurements of gravitational waves (Ju et al., 2000).
The path of obtaining high-resolution rotation sensing was relatively long and a large part of it was driven by navigation and altitude control for aircraft. Considering the technology used, four main groups can be distinguished among sensors that work as rotational seismometers (Jaroszewicz et al., 2016): mechanical (Kraft, 2000; Teisseyre and Nagahama, 1999; Brokešová and Malek, 2013), electrochemical (Lin et al., 2009), magnetohydrodynamic (Ringler et al., 2018), and optical (Schreiber and Wells, 2023), including fiber-optic (Murray-Bergquist et al., 2021; Kurzych et al., 2019a). The last one is based on active optical Sagnac interferometers which became available in the 1970s after the era of mechanical gyroscopes. The reduction in size caused the emergence of the fiber optic gyroscopes (FOGs). Modern mechanical rotational sensors are based on highly miniaturized microelectromechanical devices (MEMS) (Zembaty et al., 2013). In terms of size and manufacturing, these systems resemble microelectronic systems. Initially, this technology was developed to produce integrated accelerometers used in industry and aerospace.
Although there is an abundance of new rotational sensors, the rotational movements of the ground associated with natural earthquakes and phenomena of anthropogenic origin are still poorly understood. The theoretical basis for hypothetical seismic rotational waves and rotational surface motions can be found in the literature (Teisseyre et al., 2003; Majewski et al., 2006). To extend this knowledge experimentally, there is a great need for portable rotational sensors with a sensitivity of a few dozen nrad/s. In addition, particular care must be taken to obtain reliable data from different types of rotating seismometers. There is a very limited knowledge in this area, de facto coming down to a single joint experiment conducted at the end of 2019 in Fürsenfeldbruck, Germany. The results obtained there with more than 24 rotating sensors show this area limitations (Bernauer et al., 2021).
As presented in this paper, a three-axial Fibre-Optic Rotational Seismograph (FORS) offers a measuring range from dozens of nrad/s up to a few rad/s in frequencies ranging from DC up to 100 Hz. FORS senses the component of a rotational motion perpendicular to a particular sensor loop by the Sagnac effect based on a minimum optical configuration designed for the FOG with special attention to angular motion detection (Lefevre, 1996). Despite FOG technology being mature and well known, the electronic part involved in detecting rotational speed is more innovative and uses complex control algorithms. The readout of the detected rotation is performed by a closed-loop configuration based on the compensatory phase measurement method, which guarantees a high resolution and an extensive dynamic range. The laboratory and field tests presented showed that the instruments were valid, accurate, and reliable tools for rotational seismology issues. Due to the external housing and water resistance, they can be deployed in harsh environments.
The three optical heads of FORS use the Sagnac fiber-optic interferometer, which detects differences in travel time between the counter-propagating beams on the closed optical path. The sensors sensitivity depends, among others, on the fiber length, diameter of the fiber coil, optical losses, and wavelength of the light source (Perez et al., 2016). To obtain the sensitivity required by rotational seismology (Jaroszewicz et al., 2016), three 6-km-long low-cost SMF coils (Figure 2) are used and installed orthogonally in FORS. FORS consists of two parts: optical and electronic. The first part is constructed according to a minimum gyro configuration, while the second part implements a digital closed-loop signal processing approach (Lefevre et al., 1991), optimized to detect rotation rate instead of angular motion performed in FOG according to the deep description previously described (Kamiński et al., 2024).
An ASE light source has been applied to obtain broadband and unpolarized light, which reduces polarization nonreciprocity, overcomes thermal instability, and, as a result, obtains a high-performance system (Perez et al., 2016). The input optical power of 14 dBm is split into individual axes by a 1x3 optical fiber coupler and then guided to the fiber circulator (Figure 2A).
A multifunction integrated optic chip (MIOC) ensures light modulation using the closed-loop approach. It also divides the beam into two counterpropagating waves in the sensor loop. The interfering light travels to an avalanche photodiode detector (APD), where the conversion of the optical power to the electrical signal takes place. Great attention has been paid to obtaining low-loss and cost optical heads (Figure 2B) with high optical Sagnac sensitivity by applying a bifilar quadrature SMF winding in a 0.25 m loop diameter with total optical head losses in the range of 16.25 dB where half of them relate to the MIOC used. The electronic part modulates the signal according to the digital phase ramp and synchronizes it with the square-wave biasing modulation (Lefevre et al., 1991; Kamiński et al., 2024). An FPGA-based module coordinates the operation of the electronic part modules, controls algorithms, and communicates with external devices. The optical signal that contains the angular rate data after conversion to the electrical signal is amplified by a trans-impedance amplifier and an additional amplifier adapted to a buffer of the ADC input. As an additional element, it includes a GPS-based time stamp to ensure the temporal correlation of data from different devices. Two parts of FORS are installed in a special housing, which is hermetically sealed (IP67) with a four-plane cover of stainless steel (Figure 3). It enables the installation of the system in any environmental conditions.
Allan Variance analysis (AV) was applied to determine the basic parameters of random errors of the FORS because it is commonly used for sensors with digital data recording (Freescale Semiconducto, 2015). It is a time-domain data sequence analysis method originally developed to determine the frequency stability of oscillators. Firstly, an angle random walk (ARW) was theoretically calculated by the following formula, which takes into consideration the main noise factors under the auxiliary modulation depth π/2 (Perez et al., 2016):
where: λ–the central light wavelength (1550 nm), c–the speed of light, D–the loop diameter (0.25 m), L–the loop length (about 6,000 m), k–the Boltzmann’s constant, T–the temperature (293 K), R–the resistance of a trans-impedance transducer of the photodetector device (20 kΩ), η–the efficiency ratio of the photodiode (0.85 A/W), P–the incident optical power on the APD, e–the elementary charge, id–the photodiode dark current (80 nA), Δλ–the spectral width of the light source (40 nm).
As one can see, the minimum sensitivity is influenced by four components: APD preamplifier thermal noise, detector dark current, quantum noise, and excess noise of the light source (RIN–the random intensity noise for ASE). The latter is ultimately limited by FORS operation with a bias equal to 3/4 π instead of π/2, which better secures SNR (Lefevre, 1996). The calculated theoretical values of ARW for each optical head for four FORS type FOS6 were in the range of 4.49–4.85 nrad/√s, depending on total optical losses and fiber length in the given optical head.
FORS has been installed in the Military University of Technology (MUT), Warsaw, Poland’s laboratory to test performance under laboratory conditions. At first, the signals from FORS were gathered at night to experimentally validate the noise parameters, and, then, AV was determined (Freescale Semiconducto, 2015; IEEE, 1997). In this method, noise components are sought as points on the measurement curve for which the tangent has a characteristic slope at this point. For ARW, the slope should be equal to “−1/2”. This point corresponds to the phenomenon of random fluctuations of the measured angle or angular velocity signal. It determines the measuring sensitivity of an instrument. Whereas bias instability (BI) refers to the device tendency to have a constant shift of the operating point (bias) or change (drift) during its operation. BI corresponds to the value on the Allan curve for which the slope of the tangent is zero. Because such a “graphical” approach can be a subjective interpretation of the relevant points on the curve, an automatic method of determining all noise parameters according to AV called autonomous regression method for AV (ARMAV) has been used (Jurado et al., 2019). The results of tests of the Z (Up) axes using the ARMAV method are shown in Figure 4, where the following parameters have been obtained–ARW: 35 nrad/√s and 45 nrad/√s, BI: 10.0 nrad/s and 51.0 nrad/s for FOS6-01 and FOS6-02, respectively. The obtained values are one order of magnitude higher than the theoretical ones. Nevertheless, it should be emphasized that the data were gathered in the laboratory in the Polish capital -Warsaw, Poland where urban noises were undoubtedly present. Data gathered for the AV analysis should be recorded in a completely noise-isolated environment, which is, unfortunately, not available for the authors during their tests at the MUT laboratory (Kurzych et al., 2019b). Therefore, the authors believe that the obtained parameters in an isolated environment would be even better, confirming the theoretical calculations.
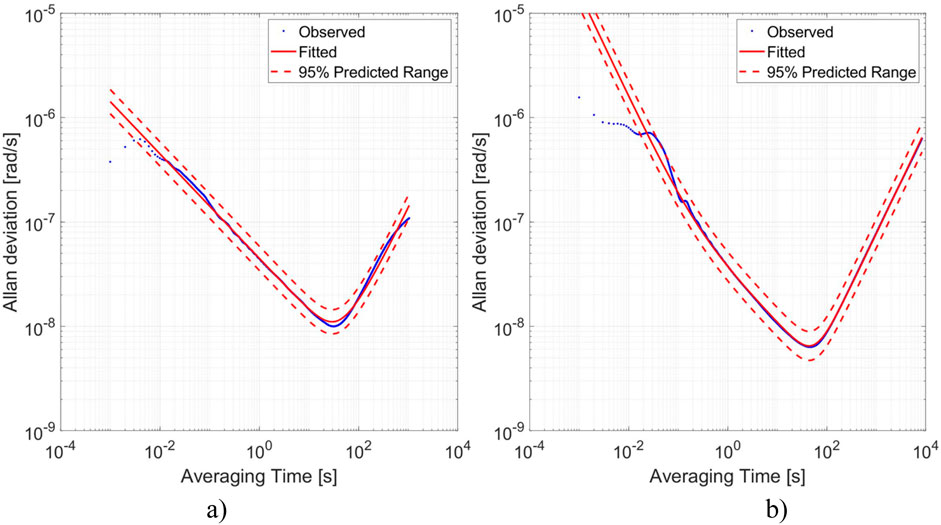
Figure 4. Determined AV using the ARMAV method for the data recorded by axis Z (Up from Figure 1) of FOS6-01 (A) and FOS6-02 (B).
FORS parameters can be compared to the first commercially available FOG-based rotational sensor–BlueSeis-3A (IXblue, France). BlueSeis-3A uses a 5-km-long fiber-optic coil, assembled in mutually orthogonal orientations, forming a three-component sensor. BlueSeis-3A is characterized by an ARW equal to 15 nrad/s/√Hz (ixblue, 2024a), while the FORS achieved an ARW of 35 nrad/s/√Hz in a noised environment. However, the FORS offers a dynamic range of around 170 dB, compared to BlueSeis-3A, which is characterized by a dynamic range of 135 dB. The wide dynamic range is especially important due to the wide range of rotational seismology areas of interest, from seismological application to engineering aspects.
FORS solution is also involved, as is the latest model of a IXblue rotational seismometer BlueSeis-1C, which is an improved version of BlueSeis-3A. BlueSeis-1C is characterized by even higher sensitivity and stability in measuring ground rotational movements (ARW equal to 5 nrad/s/√Hz, dynamic range of 152 dB (ixblue, 2024b)). The BlueSeis-1C seismometer has been optimized to reduce self-noise, allowing it to detect even minimal angular velocities but only on one axis.
The often solution for rotational seismology is the rotational sensor R-1 by Eentec (Vilnius, Lithuania), e.g., for collecting data of mining activity (Fuławka et al., 2020) or local earthquakes (Yin et al., 2016). Nevertheless, the comparison of the all group of rotational sensors (Jaroszewicz et al., 2016) indicates that it is proper solution but only in case of stronger signals due to limited sensitivity, frequency range and thermal instability.
The authors believe that the ability to achieve high data correlation from at least two FORSs is an important outcome of their design. To confirm this, series of laboratory and field tests were conducted. Both FOS6 devices were put next to each other on a leveled board (Figure 5) which could rotate along its center in the laboratory. This way, the authors collected data from both systems, simultaneously measuring the same rotations along the chosen axis.
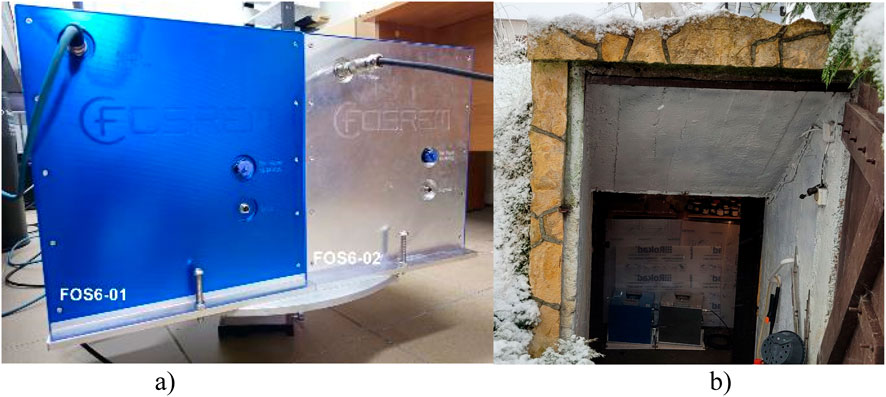
Figure 5. Two FORSs type FOS6 situated on a leveled board: (A) FOS6-01 and FOS6-02 in the MUT laboratory on the rotary table. (B) FOS6-01 and FOS6-04 in a basement about 1.5 m below ground level in the Kampinos Nature Park, Poland.
A Pearson correlation coefficient (P) was calculated to estimate the level of correlation. This coefficient is a statistical metric that measures the strength and direction of a linear relationship between two continuous variables (x, y), in the authors’ case, two signals from different devices. It is defined as the ratio of the covariance of two variables cov (x,y) to the product of their respective standard deviations, σx and σy (Benesty et al., 2008):
P-value ranges from 0% to 100%, expected to be close to the higher value. The value of P equal to 0 indicates the absence of the monotonic correlation or any correlation in the case of bivariate normal data.
Firstly, the test of correlation consisted of medium high-amplitude (at a level of 0.25 rad/s) and fast-changing (at a level of 100 Hz) excitations, which results recorded by FOS6-01 and FOS6-02 are shown in Figure 6A). It is evident that both devices registered almost identical values of the rotation rate, with the Pearson correlation coefficient equal to 99.42%.
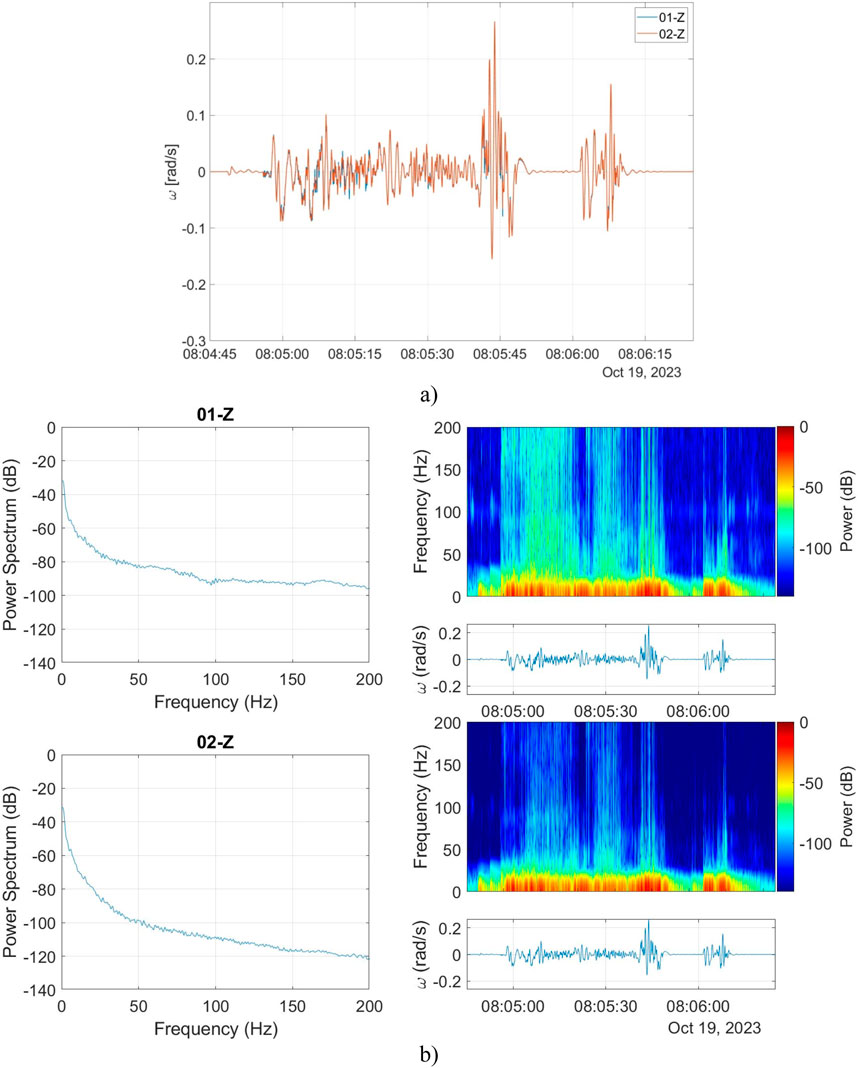
Figure 6. The correlation verification between two FORSs: (A) signals recorded by FORSs Z–axes during the medium high-amplitude and fast-changing excitations, (B) power spectrum analysis.
Additional analysis of the spectral response in the form of a power spectrum and spectrogram showed that a large part of the registered signal was below 30 Hz. However, the devices were also able to register high-frequency components up to 200 Hz (the actual highest recorded frequency due to the sampling rate was 500 Hz, but the authors decided to truncate the signal at 200 Hz), as shown in Figure 6B). Based on the power spectrum plots, it is visible that the high-frequency noise level for FOS6-02 is lower than for FOS6-01. This test confirmed the usefulness of the authors’ systems for high-frequency and medium/high amplitude rotations observed, e.g., during storms or heavy gusts of wind.
Secondly, tests were conducted to determine FORSs performance during high-amplitude (at a level of 1 rad/s) rotations. Again, data registered by both FOS6-01 and FOS6-02 devices are almost identical, as shown in Figure 7, with the Pearson correlation coefficient of 99.99%. Due to the construction of the rotation table, it was impossible to exceed the rotation rate of 1.2 rad/s. The power spectrum in Figure 7B) shows that the high-frequency noise level is significantly lower for FOS6-02 than for FOS6-01. From the spectrogram in Figure 7B), it is also clearly visible that, as in the previous case, most of the signal was below 30 Hz, with only a few parts extended above this value–during rapid changes in the rotation of the board. Therefore, the authors confirmed the applicability of FORSs to high-amplitude rotations which could occur, e.g., during dangerous resonant motions of technological structures.
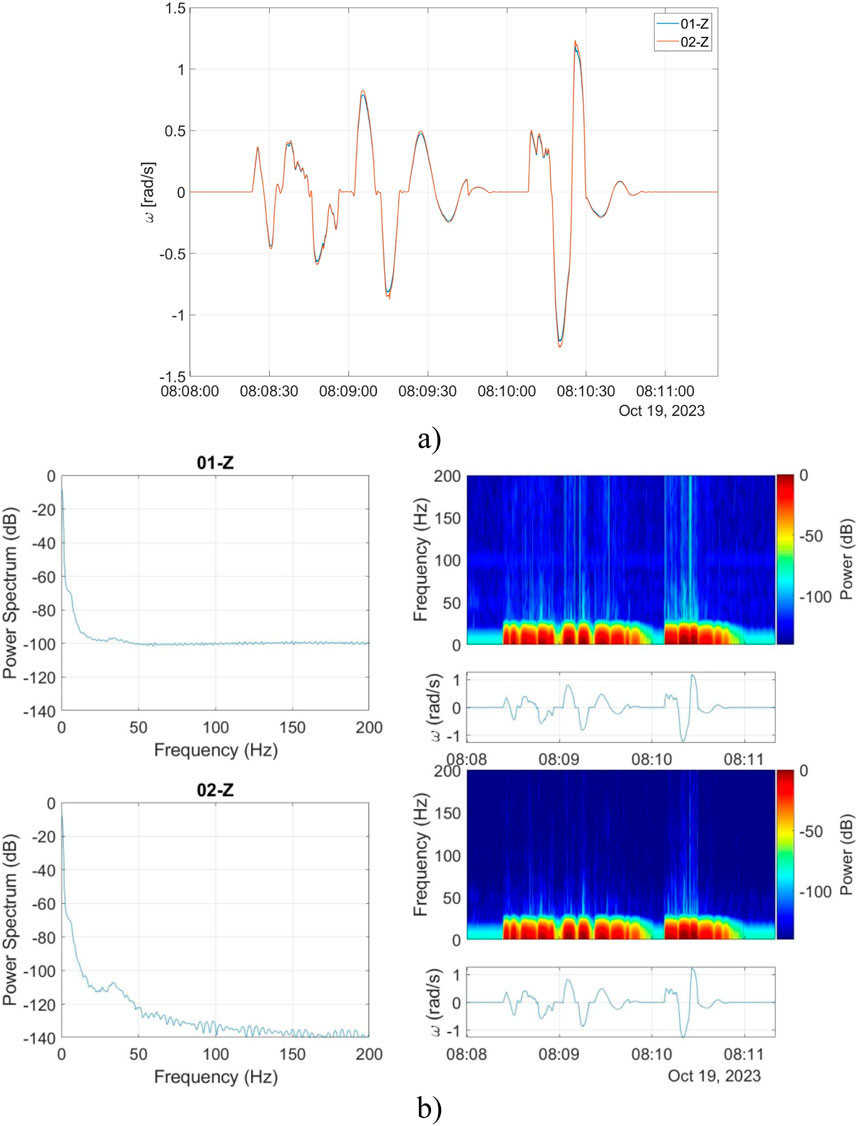
Figure 7. The correlation verification between two FORSs: (A) signals recorded by FORSs during the high-amplitude amplitude excitations, (B) power spectrum analysis.
The authors also performed an additional analysis of signals from both tests using the correlation of moving means. To determine the changes in the correlation between signals from both devices, they calculated the moving mean of all signals with a time window of 0.5 s (500 samples). Then, they performed calculations of the Pearson correlation coefficient in the same time windows, as shown in Figure 8A, B). As a result, a plot of correlation coefficient varying in time was obtained. The correlation in most of the analyzed signals was near 100%, with only occasional drops to lower values due to some noise fluctuations. Therefore, it can be confirmed that both developed systems are reliable, provide consistent results, and are suitable even for high-amplitude and high-frequency measurements of technological structures.
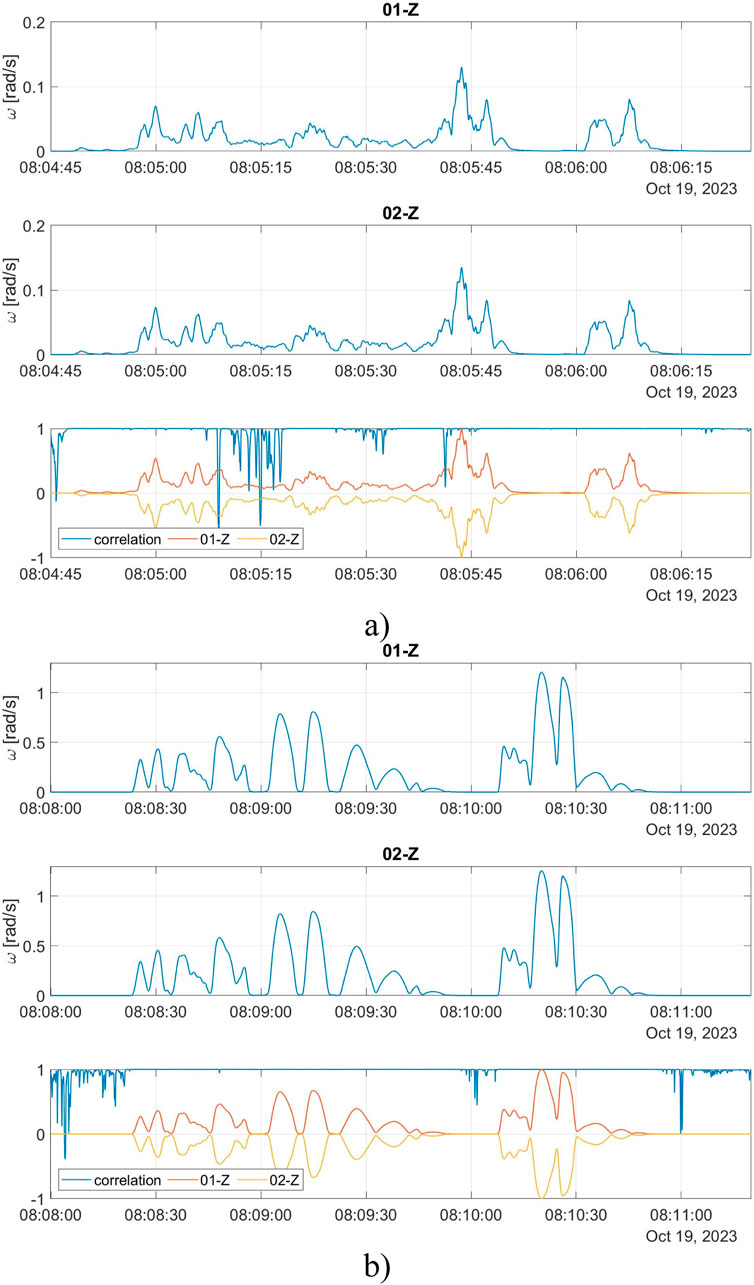
Figure 8. Analysis of signals using correlation of moving means from the correlation test: (A) during the medium high-amplitude and fast-changing excitations, (B) during the high-amplitude excitations; red line–moving mean of FOS6-01 with a time window of 0.5 s, yellow line–moving mean of FOS6-02 with a time window of 0.5 s, blue line–Pearson correlation coefficient for a time window of 0.5 s and normalized values of moving means of FOS6-01 and FOS6-02 (inverted for clarity) with a time window of 0.5 s.
Finally, Figure 9 shows the above correlation analysis on the data recorded during the field test in the Kampinos Nature Park by a second pair of FORSs (FOS6-01 and FOS6-04). It was a weak rotational disturbance (with an amplitude of about 0.5 mrad/s) generated by the wild animal (elk) moving in the field close to the FORSs location. As one can see, for all three axes, recorded data had an amplitude three orders of magnitude lower than during laboratory tests with a correlation of about 95% for the X-axis, about 99% for Y-axis (two horizontal axes), and about 99% for the Z-axis (vertical axis). Slightly lower correlation value for X-axis was due to additional ripples present in the analyzed signal from FOS6-04 – before and after the main disturbance.
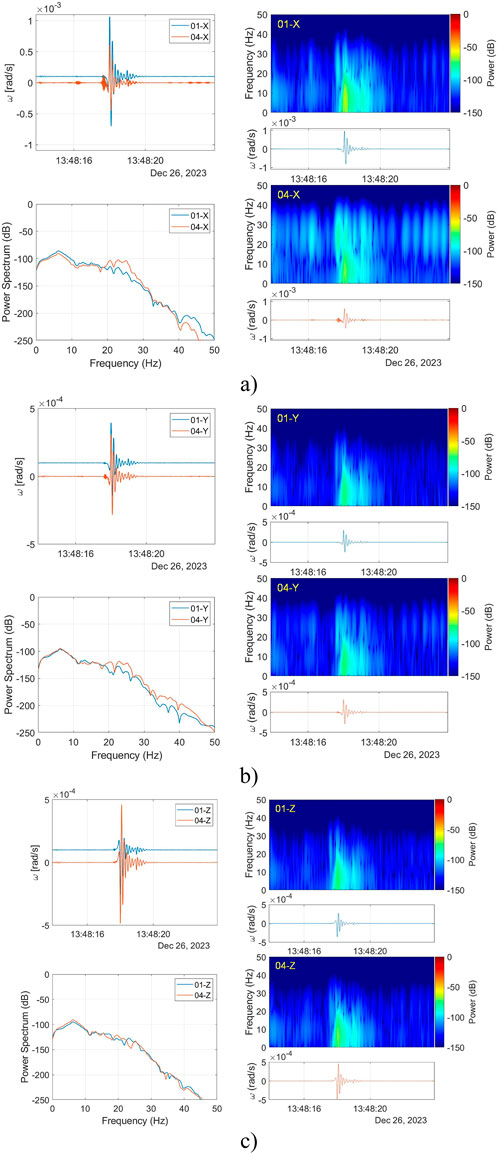
Figure 9. The correlation verification between FOS6-01 and FOS6-04 during the field operation. Recorded seismogram and their spectral analysis for (A) X-axes, (B) Y-axes, and (C) Z-axes given Pearson coefficient equal to 94.80, 99.00, and 99.06%, respectively. Presented in the upper left windows, two seismograms are shifted vertically by 10–4 rad/s for picture clarity.
The data analyzed and presented in Figure 9 were filtered through a low-pass 12-th order Butterworth filter with a cutoff frequency at 50 Hz to eliminate unwanted high-frequency noise. In the range from 0 Hz up to 20 Hz, the spectral responses of both systems were almost identical for all three axes. Above 20 Hz, a slight increase in the power signal level can be observed for FOS6-04 in both horizontal (X and Y) axes, which is also noticeable in the rotation rate plots as regions with higher frequency perturbations–especially at the beginning of the registered main disturbance. Spectrograms presented in Figure 9 also indicate the existence of two regions–below about 15 Hz with most of the energy originating from the registered disturbance and above about 15 Hz with repeating frequency patterns, which is mostly evident in the X and Y (two horizontal) axes of FOS6-04. Based on the presented results, it can be deduced that developed systems are suitable for detecting faint rotations observed during seismic events.
The practical examination of FORS usefulness was a field test conducted in Szopowe, Poland, near the Ukrainian border. This is the area of a closed limestone quarry far from residential buildings. On the 7th of October 2023, there were three explosions performed (Figure 10):
1. 12:33 UTC, 5 kg of explosive, 3 m below the ground surface with surface discharge.
2. 13:41 UTC, 5 kg of explosive, 4.5 m below the ground surface without surface discharge.
3. 15:11 UTC, two 5 kg explosive charges installed 5 m apart were detonated one after the other, 4.5 m below the ground surface, with a distance of 5 m between loads.
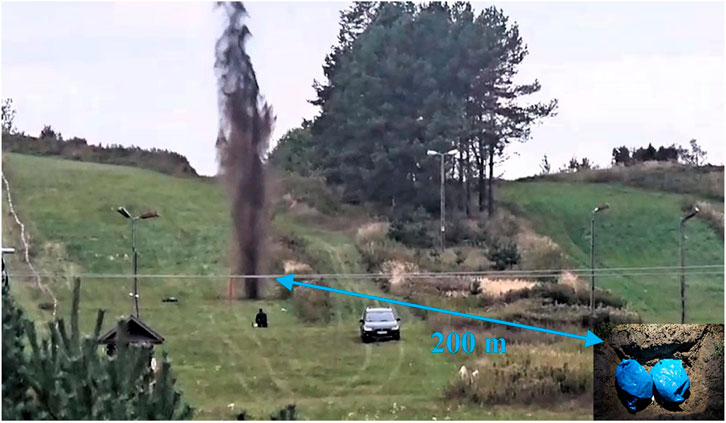
Figure 10. Field research during explosive charge detonation: the first explosive charge explosion with schematic identification of the FORSs localization.
It should be noted that automatic, continuous monitoring of artificial explosions in near-border areas is an important task, considering the global situation (for instance, the armed conflict between Ukraine and Russia). The explosives used for blasts were placed about 200 m from the seismometers installed about 0.6 m below the ground level (see the inset in Figure 10).
Figure 11 presents the rotational seismograms recorded by FOS6-02 originating from a blast during field tests on the 7th of October, 2023. The characteristics of rotations along all three axes (directed as Z–vertical, X–East/West, Y–North/South) can be described similarly due to the proximity of the blast source. All three components are characterized by rotation rate at a level of 10–3 rad/s with a frequency of the registered signal starting at about 50 Hz for the first and second explosion and 100 Hz for the third explosion, and gradually falling together with the amplitude, as shown in the power spectrum analysis in Figure 11B, D, F.
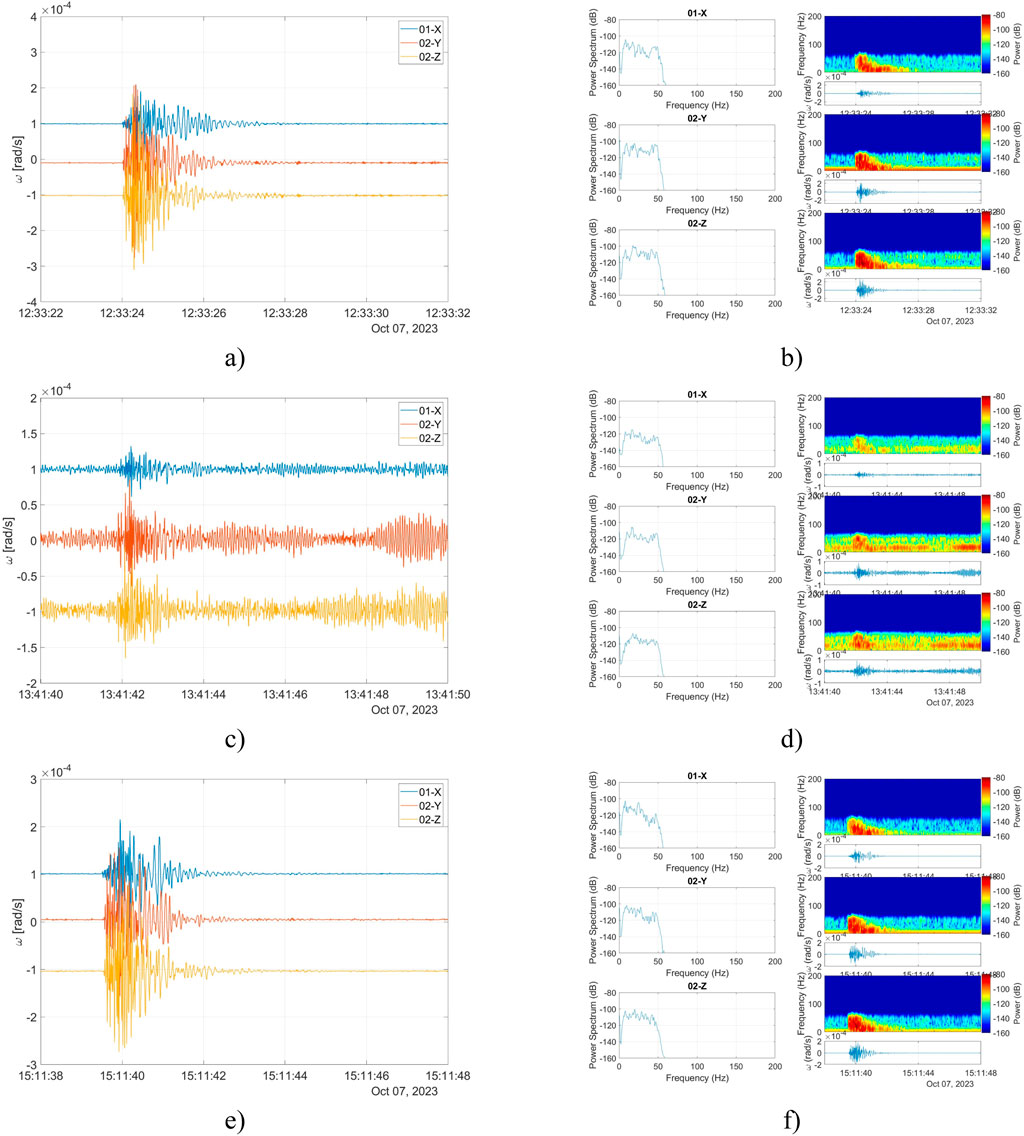
Figure 11. The data recorded during three explosive detonations: (A), (C), (E) signals of rotations along all three axes recorded by FORS; (B), (D), (F) power spectrum analysis.
Table 1 presents the recorded maximum signal amplitude (Amax) and energy coefficient (EF). EF is calculated numerically using rectangles of the Riemann integral as a field of the area under the curve (absolute value of rotation amplitude multiplied by time), which is used to investigate disturbance power.
As one can see, the signals recorded during the second explosion are characterized by the lowest values of signal amplitude and signal energy. The signal was disturbed by the operation of a construction machine. The X–East/West component of the rotation is characterized by the lowest values of the maximum signal amplitude and signal energy.
The paper presents data confirming the high reliability of recordings gathered by a three-axial FORS. The correlation analysis was performed during diversified external disturbances both in laboratory and field conditions. In the correlation analysis, three types of signals have been measured by FORSs: medium/high-amplitude (at a level of 0.1 rad/s) and fast-changing (at a level of 100 Hz) excitations, high-amplitude (at a level of 1.25 rad/s), as well as a weak rotational disturbance (with an amplitude of about 0.5 mrad/s). In all cases, the obtained correlation coefficient between signals recorded by two FORSs was near the value of 100%. This confirmed the systems reliability and wide range of possible applications from faint rotations observed during seismic events to strong rotation. FORS also recorded successful artificial explosions in field tests carried out in Szopowe, Poland, which confirmed its usefulness in monitoring detonation tests, especially in border areas. Considering the global situation, these kinds of measurements in near-border areas are currently crucial.
In laboratory conditions, measurements were conducted to determine FORS basic parameters. The AV analysis showed a theoretical sensitivity at 4.5 nrad/√s. The experimentally obtained value is one order of magnitude higher, equal to about 35–45 nrad/√s. Nevertheless, the authors found the value satisfactory, considering the environment in which the data were collected. The authors are confident that the noise parameters in an isolated environment would be at least one order better, confirming the theoretical calculations. The wide measuring range of FORS needs to be emphasized, which is the widest available and is equal to 170 dB. The application of depolarized light and the 6-km length of a telecommunication single-mode fiber makes the solution low-cost and easy to assemble.
A deep study of the rotational components needs to be further carried out, especially considering the structural health monitoring point of view, where rotational events can force an entirely new approach to earthquake protection issues. The authors hope that the newly presented three-axial rotational system will cover the lack of reliable data for all aspects of rotational seismology.
The data that support the findings of this study are available from the authors upon reasonable request. The part of data is shared on the website: https://fosrem.eu/.
AK: Data curation, Investigation, Writing–original draft. LJ: Conceptualization, Formal Analysis, Supervision, Writing–review and editing. MD: Data curation, Investigation, Writing–original draft.
The author(s) declare that financial support was received for the research, authorship, and/or publication of this article. This work was supported by the Polish Agency for Enterprise Development project FENG.01.01-IP.02-1714/23 and the National Centre for Research and Development project POIR.01.01.01-00-1553/20-00.
Authors ATK, LRJ, and MD were employed by Elproma Elektronika Ltd.
All claims expressed in this article are solely those of the authors and do not necessarily represent those of their affiliated organizations, or those of the publisher, the editors, and the reviewers. Any product that may be evaluated in this article, or claim that may be made by its manufacturer, is not guaranteed or endorsed by the publisher.
Benesty, J., Chen, J., and Huang, Y. (2008). On the importance of the Pearson correlation coefficient in noise reduction. IEEE Trans. Audio, Speech, Lang. Process. 16 (4), 757–765. doi:10.1109/TASL.2008.919072
Bernauer, F., Behnen, K., Wassermann, J., Egdorf, S., Igel, H., Donner, S., et al. (2021). Rotation, strain and translation sensors performance tests with active seismic sources. Sensors 21, 264. doi:10.3390/s21010264
Brokešová, J., and Malek, J. (2013). Rotaphone, a self-calibrated six-degree-of-freedom seismic sensor and its strong-motion records. Seismol. Res. Lett. 84 (5), 737–744. doi:10.1785/0220120189
Freescale Semiconducto (2015). Allan variance: noise analysis for gyroscopes. Applications note AN5087 Rev. 0.2/2015. Austin, United States: Freescale Semisconductor Inc. Available at: https://telesens.co/wp-content/uploads/2017/05/AllanVariance5087-1.pdf.
Fuławka, K., Pytel, W., and Pałac-Walko, B. (2020). Near-field measurement of six degrees of freedom mining-Induced tremors in lower silesian copper basin. Sensors 20 (23), 6801. doi:10.3390/s20236801
IEEE (1997). 952-1997 - IEEE standard specification format guide and test procedure for single-Axis interferometric fiber optic gyros. IEEE.
ixblue (2024a). BlueSeis-3A rotational seismometer. Available at: https://www.rotational-seismology.org/events/workshops/2016/blueseis-3a.pdf (Accessed May 17, 2024).
ixblue (2024b). Ultra-low-noise portable 1 component rotational seismometer. Available at: https://www.ixblue.com/wp-content/uploads/2022/02/blueSeis-1C-datasheet.pdf (Accessed May 5, 2024).
Jaroszewicz, L. R., Kurzych, A., Krajewski, Z., Marć, P., Kowalski, J., Bobra, P., et al. (2016). Review of the usefulness of various rotational seismometers with laboratory results of fibre-optic ones tested for engineering applications. Sensors 16 (12), 2161 Dec. doi:10.3390/s16122161
Ju, L., Blair, D. G., and Zhao, C. (2000). Detection of gravitational waves. Rep. Prog. Phys. 63 (9), 1317–1427. doi:10.1088/0034-4885/63/9/201
Jurado, J., Schubert Kabban, C. M., and Raquet, J. (2019). A regression-based methodology to improve estimation of inertial sensor errors using Allan variance data. J. Inst. Navigation 66 (1), 251–263. doi:10.1002/navi.278
Kaláb, Z., Knejzlík, J., and Lednická, M. (2013). Application of newly developed rotational sensor for monitoring of mining induced seismic events in the karvina region. Acta Geodyn. Geomaterialia 10 (2), 197–205. doi:10.13168/AGG.2013.0020
Kamiński, M., Tylman, W., Jabłoński, G., Kotas, R., Amrozik, P., Sakowicz, B., et al. (2024). Firmware development for the fibre-optic seismometer based on FOG. Opto-Electronics Rev. 32 (2), e150179. doi:10.24425/opelre.2024.150179
Kraft, M. (2000). Micromachined inertial sensors: the state-of-the-art and a look into the future. Meas. Control 33 (6), 164–168. doi:10.1177/002029400003300601
Kurzych, A. T., Jaroszewicz, L. R., Krajewski, Z., Dudek, M., and Kowalski, J. K. (2019b). “Interferometric optical fiber sensor set for angular velocity recording: Allan variance analysis in practice,” in Proc. SPIE 11199, Seventh European Workshop on Optical Fibre Sensors, Limassol, Cyprus, 1-4 October 2019. doi:10.1117/12.2539430
Kurzych, A. T., Jaroszewicz, L. R., Krajewski, Z., Dudek, M., Teisseyre, K. P., and Kowalski, J. K. (2019a). Two correlated interferometric optical fiber systems applied to the mining activity recordings. J. Light. Technol. 37 (18), 4851–4857. doi:10.1109/JLT.2019.2923853
Lee, W. H. K., Celebi, M., Todorovska, M. I., and Igel, H. (2009). Introduction to the special issue on rotational seismology and engineering applications. Bull. Seismol. Soc. Am. 99 (2B), 945–957. doi:10.1785/0120080344
Lefevre, H. C. (1996). “Fundamentals of the interferometric fiber-optic gyroscope,” in Proc. of SPIE, Denver, CO, USA, 2–17. doi:10.1117/12.258167
Lefevre, H. C., Martin, P., Morisse, J., Simonpietri, P., Vivenot, P., and Arditti, H. J. (1991). “High dynamic-range fiber gyro with all-digital signal-processing,” in Proc. of SPIE, San Jose, USA, 72–80.
Lin, C. J., Liu, C. C., and Lee, W. H. K. (2009). Recording rotational and translational ground motions of two TAIGER explosions in northeastern taiwan on 4 march 2008. Bull. Seismol. Soc. Am. 99 (2B), 1237–1250. doi:10.1785/0120080176
Majewski, E. (2006). “Seismic rotation waves: spin and twist solutions,” in Earthquake source asymmetry, structural media and rotational effects. Editors R. Teisseyre, M. Takeo, and E. Majewski (Berlin: Springer), 255–272.
Murray-Bergquist, L., Bernauer, F., and Igel, H. (2021). Characterization of six-degree-of -freedom sensors for building health monitoring. Sensors 21, 3732. doi:10.3390/s21113732
Perez, R. J., Álvarez, I., and Enguita, J. (2016). Theoretical design of a depolarized interferometric fiber-optic gyroscope (IFOG) on SMF-28 single-mode standard optical fiber based on closed-loop sinusoidal phase modulation with serrodyne feedback phase modulation using simulation tools for tactical and industrial grade applications. Sensors 16 (5), 604. doi:10.3390/s16050604
Ringler, A. T., Anthony, R. E., Holland, A. A., Wilson, D. C., and Lin, C. J. (2018). Observations of rotational motions from local earthquakes using two temporary portable sensors in Waynoka, Oklahoma. BSSA 108 (6), 3562–3575. doi:10.1785/0120170347
Schreiber, U., and Wells, J. P. (2023). “Rotation sensing with large ring lasers”, applications in geophysics and geodesy. Cambridge: Cambridge University Press.
Teisseyre, R., Suchcicki, J., Teisseyre, K., Wiszniowski, J., and Paolo, P. (2003). Seismic rotation waves: basic elements of theory and recording. Ann. Geophys. 46 (4), 671–685. doi:10.4401/ag-4375
Teisseyre, R., and Nagahama, H. (1999). Micro-inertia continuum: rotations and semi-waves. Acta geophys. Pol. 47 (3), 259–272.
Trifunac, M. D. (2009). Review: rotations in structural response. Bull. Seismol. Soc. Am. 99 (2B), 968–979. doi:10.1785/0120080068
Yin, J., Nigbor, R., Chen, Q., and Steidl, J. (2016). Engineering analysis of measured rotational ground motions at GVDA. Soil Dyn. Earthq. Eng. 87, 125–137. doi:10.1016/j.soildyn.2016.05.007
Yuan, S., Simonelli, A., Lin, C. J., Bernauer, F., Donner, S., Braun, T., et al. (2020). Six degree-of-freedom broadband ground-motion observations with portable sensors: validation, local earthquakes, and signal processing. Bull. Seismol. Soc. Am. 110 (13), 953–969. doi:10.1785/0120190277
Zembaty, Z., Bernauer, F., Igel, H., and Schreiber, K. U. (2021). Rotation rate sensors and their applications. Sensors 21 (16), 5344. doi:10.3390/s21165344
Zembaty, Z., Kokot, S., and Bobra, P. (2013). Application of rotation rate sensors in an experiment of stiffness reconstruction. Smart Mater. Struct. 22 (7), 077001. doi:10.1088/0964-1726/22/7/077001
Zembaty, Z., Kokot, S., and Bobra, P. (2016). “Application of rotation rate sensors in measuring beam flexure and structural health monitoring,” in Seismic behaviour and design of irregular and complex civil structures II. Geotechnical, geological and earthquake engineering. Editors Z. Zembaty, and M. De Stefano (Cham: Springer), 65–76.
Keywords: detection, rotational seismology, Sagnac effect, rotational seismograph, interferometer
Citation: Kurzych AT, Jaroszewicz LR and Dudek M (2024) Rotational motion investigation in seismology – remote sensing by an optical fiber seismograph. Adv. Opt. Technol. 13:1494705. doi: 10.3389/aot.2024.1494705
Received: 11 September 2024; Accepted: 28 October 2024;
Published: 08 November 2024.
Edited by:
Rajesh Sharma, Guru Ghasidas Vishwavidyalaya, IndiaCopyright © 2024 Kurzych, Jaroszewicz and Dudek. This is an open-access article distributed under the terms of the Creative Commons Attribution License (CC BY). The use, distribution or reproduction in other forums is permitted, provided the original author(s) and the copyright owner(s) are credited and that the original publication in this journal is cited, in accordance with accepted academic practice. No use, distribution or reproduction is permitted which does not comply with these terms.
*Correspondence: Anna T. Kurzych, YW5uYS5rdXJ6eWNoQHdhdC5lZHUucGw=
†ORCID: Anna T. Kurzych, orcid.org/0000-0001-7547-0638; Leszek R. Jaroszewicz, orcid.org/0000-0001-8838-5846; Michał Dudek, orcid.org/0000-0002-7766-0969
Disclaimer: All claims expressed in this article are solely those of the authors and do not necessarily represent those of their affiliated organizations, or those of the publisher, the editors and the reviewers. Any product that may be evaluated in this article or claim that may be made by its manufacturer is not guaranteed or endorsed by the publisher.
Research integrity at Frontiers

Learn more about the work of our research integrity team to safeguard the quality of each article we publish.