 K. J. Paige
 A. S. Weigard
 O. Ajilore
 K. Luan Phan
 H. de Wit
 H. Klumpp
 N. A. Crane
94% of researchers rate our articles as excellent or good
Learn more about the work of our research integrity team to safeguard the quality of each article we publish.
Find out more
ORIGINAL RESEARCH article
Front. Adolesc. Med., 04 March 2025
Sec. Addiction in Adolescents
Volume 3 - 2025 | https://doi.org/10.3389/fradm.2025.1541068
This article is part of the Research TopicCannabis use and neurocognitive functioning in adolescentsView all 3 articles
Introduction: Cannabis and its main psychoactive constituent, delta-9-tetrahydrocannabinol (THC), are thought to weaken neurocognitive processes. However, past experimental research examining the acute effects of THC on neurocognition has produced mixed results. The current study aims to advance this literature through application of computational modeling and consideration of individual differences in cannabis use history and subjective drug effects.
Methods: In a double-blind THC administration experiment, N = 30 healthy late adolescent and young adult occasional to regular cannabis users (53% men; ages 18–25) received THC (7.5 mg, oral) and placebo. They completed a Go/No Go (GNG) task at the time of peak drug effect. We analyzed GNG data using the drift diffusion model, which provides measures of effects of THC on three components of neurocognition: cognitive efficiency (drift rate), response caution (boundary separation), and motor response execution processes (non-decision time). Bayesian statistical methods were used to assess relations between individuals’ neurocognitive parameter differences across the experimental conditions (THC—placebo) and several relevant covariates (cannabis use history and subjective drug effects).
Results: Overall, THC vs. placebo did not significantly alter any parameter. However, THC was associated with greater between-person variability in both drift rate and nondecision time, suggesting heterogeneity in the effects of the drug. THC weakened cognitive efficiency (slower drift rates) to a greater extent in participants with less cannabis use. Further, stronger subjective effects (drug “effect” and drug “high”) were related to poorer cognitive efficiency during THC intoxication.
Discussion: Results add to our understanding of the acute neurocognitive effects of THC. Slower cognitive efficiency after THC was highly heterogeneous, and was related to both recent cannabis use and subjective drug effects. These findings support the notion that acute effects of cannabis on cognitive efficiency (GNG drift rate) are reduced by individuals’ tolerance to cannabis.
Cannabis use is increasing rapidly in the U.S., and is most prevalent among youth and young adults (1, 2). Indeed, in 2023 25% of 18–25-year-olds reported consuming cannabis in the past month (3). Moreover, legalization of recreational cannabis use has been associated with reductions in perceived harmfulness of cannabis among adolescents and young adults (2). At the same time, public interest has brought cannabis to the forefront of media discussions and scientific debates, raising concerns about safety and adverse impacts on key neurocognitive processes while intoxicated (4, 5). Despite a recent increase in research on cannabis use and neurocognition (6, 7), the evidence remains mixed. This is a critical gap in the literature, as understanding the effect of cannabis on neurocognitive processes has wide-reaching public health implications [e.g., driving under the influence, increases in injuries due to falls; (8)].
Previous research on the acute effects of cannabis on neurocognitive processes has produced mixed results. With respect to Reaction Time (RT), a common measure of inhibitory control, two small studies (N = 14 and N = 18) with heavy cannabis users (at least daily use) found that smoked cannabis increased premature responses on a RT task and accidental wall hits during a virtual maze task (9, 10). Three other studies (N range = 20–37) using light (>10 lifetime occasions of use; use around 1.5 times/week) to heavy (use >4 days/week) cannabis users demonstrated that both oral and inhaled vaporized THC increased stop signal reaction time on the Stop Signal Task [SST; (11–13)]. However, these studies varied widely in the doses of THC administered, including doses as high as 35 mg (12, 13). Findings on acute THC effects on another common measure of inhibitory control, errors of commission, have also been mixed. Van Wel and colleagues (2013) found that a high dose, 300 microgram/kg or approximately 21 mg, of THC did not affect stop signal reaction time or number of omission errors, but THC increased errors of commission. This is consistent with some other reports that THC increased errors of commission in occasional cannabis users [less than 25 occasions of lifetime use and less than 11 occasions of past month use, respectively; (14, 15)]. However, two other studies using participants with a range of cannabis use histories failed to detect this effect (11, 16).
In addition to variable effects of THC across studies, there is also considerable within-study variability. Many studies report negative associations between THC and performance on one or two neurocognitive measures, but performance is often unaltered between placebo and THC on several other neurocognitive measures. For example, Hart and colleagues (2001) found THC increased premature responding and completion time for several cognitive tasks, but accuracy on these and other cognitive tasks were unaltered among N = 18 adults (21–35 years old) who, on average, used cannabis 6 days a week. Similarly, McDonald and colleagues (2003) reported adverse effects on SST performance following a 15 mg dose of THC, but no effects of a 7.5 mg dose, and no THC effects on the GNG, or Delay or Probability discounting tasks at either dose. Further, while Pabon and Wit (15) found that THC acutely increased errors of commission on GNG at a 15 mg dose, there was no effect of THC on errors of omission/misses across both 7.5 mg and 15 mg doses among N = 60 adult females. In summary, experimental studies that have examined the acute effects of THC on neurocognitive processes have produced mixed results. We propose that mixed results may be due to: (1) measurement issues with behavioral measures of neurocognitive processes and, (2) failure to consider that individual differences in cannabis use history may impact acute THC effects on neurocognition.
Previous studies examining links between cannabis use and neurocognitive functioning have frequently used assessments designed to measure distinct higher-order neurocognitive functions (e.g., attentional shifting, working memory, inhibitory control, etc.), measures which often suffer from psychometric problems (17, 18). Indeed, the dominant framework posits that higher-order neurocognitive functioning is characterized by a set of complex, modular functions (19). However, this framework has led to considerable heterogeneity in measurement and terminology (20) and has not been well-supported by psychometric studies (21). Further, measures of these higher-order functions do not typically account for strategic or motor response processes that can impact behavioral performance metrics and are also potentially impacted by THC intoxication. For example, does an increase in mean RT after THC administration reflect decreases in cognitive efficiency, a more cautious response strategy, slower motor processes, or some combination of these processes? In summary, common practices for measuring higher-order cognitive functions have likely contributed to confusion regarding the effects of THC on neurocognition. An alternative framework that has emerged from the computational modeling literature posits that individuals’ efficiency of accumulating goal-relevant evidence is a domain-general cognitive individual difference dimension that largely underlies many modular neurocognitive functions (22–24). Importantly, formal computational models that index evidence accumulation also account for other sources of influence on behavioral performance, like motor response speed and strategy. This alternative framework therefore both shows great promise as a plausible model of a general process that drives diverse neurocognitive functions and provides a method for disaggregating additional processes that influence behavioral performance. Notably, no studies to date have utilized this approach with respect to elucidating the effects of THC on neurocognitive functions.
Evidence accumulation models are a well-validated framework from mathematical psychology and computational neuroscience that explain individuals’ choices and RTs on a wide array of cognitive tasks. The models posit a process in which individuals gather evidence for possible choices until a critical evidence threshold is reached for a given choice (25, 26). The diffusion decision model [DDM; (27, 28)], one of the most commonly used evidence accumulation models, decomposes task performance into parameters representing several mechanisms of influence on behavioral performance: (1) efficiency of evidence accumulation toward the correct choice (“drift rate”; v), (2) degree of response caution (boundary separation; a), (3) response biases, which tend to favor decisions with higher probabilities (start point; z), and (4) processes unrelated to the decision process, such as time for stimulus encoding and motor response execution [non-decision time; Ter; (29)]. The DDM has previously been used to measure these mechanisms on the GNG by accounting for construct-irrelevant influences on GNG performance (30, 31). Additionally, application of the DDM to behavioral data from an alcohol experimental paradigm has been fruitful in advancing our understanding of the acute effects of alcohol, which include both decreased efficiency of evidence accumulation and increased motor response speed (32). In other words, using this approach allows us to better understand whether an increase in mean RT after THC administration reflects poorer cognitive efficiency (slower drift rate/efficiency of evidence accumulation), a more cautious response strategy (higher boundary separation response caution), slower motor processes (higher non-decision time), or some combination of these processes. We propose that application of this model to GNG data during THC administration will help clarify previous mixed results regarding the effects of cannabis on acute neurocognitive functioning.
A second reason for mixed results may be a failure to consider key individual difference factors, including cannabis use history and subjective drug effects, when examining the impact of THC on acute neurocognition. Invoking the notion of drug tolerance, it may be expected that individuals who use less cannabis and/or report experiencing stronger drug effects following THC ingestion would be more likely to display poor neurocognitive functioning. Indeed, Ramaekers and colleagues (2009) reported differences in neurocognitive performance following ingestion of 500 micrograms/kg or approximately 35 mg THC between heavy (cannabis use more than 4 days/week) and occasional (weekly use or less) cannabis users. Even at this high dose, heavy cannabis users did not display poorer performance on the majority of neurocognitive tasks, indicating tolerance effects. These findings strongly suggest that cannabis use history has a significant impact on the association between cannabis use and acute neurocognitive functioning. Yet, the majority of previous studies in this literature do not consider the role of cannabis use history in acute THC effects on neurocognition. Further, many studies recruited participants who are homogenous in their cannabis use [e.g., either very light cannabis users with no past month use or very heavy cannabis users with more than weekly use; (16, 33)], which precluded their ability to investigate how cannabis history may modify acute THC effects on neurocognition. Relatedly, adolescents who report stronger experiences of feeling the effects of THC or feeling “high” may be more likely to display worse neurocognitive functioning. While past research has demonstrated that participants report more subjective drug effects in THC condition compared to placebo (10), no previous studies have examined whether individual differences in the strength of these subjective drug effects impacts neurocognitive functioning following THC administration. In summary, failure to examine individual differences in cannabis use history and subjective drug effects may obscure relations between THC and adverse impacts on neurocognitive functioning, especially among light or occasional cannabis users.
The current study was designed to systematically assess the acute effects of THC on neurocognition in a sample of late adolescent and young adult cannabis users whose cannabis use history ranged from at least 10 times in their lifetime to more regular use (use 1–6 days per week). Additionally, we applied the DDM to GNG data in order to improve measurement reliability and parse several mechanisms of influence on behavioral performance. Although previous research suggests that THC may negatively impact behavioral performance on GNG, no past studies have applied the DDM to behavioral data during THC administration. Therefore, the acute effects of THC on specific DDM parameters which quantify several neurocognitive and motor response processes underlying behavioral performance is unknown. Regarding tolerance, it was expected that poorer performance on GNG following THC administration would be stronger among individuals with less recent cannabis use history and who reported experiencing more subjective drug effects.
Participants (N = 30) were a community sample of non-treatment-seeking late adolescents and young adults (ages 18–25) recruited from the Chicagoland area through online and printed advertisements. Inclusion criteria consisted of 18–25 years old, English fluency, ≥10 lifetime cannabis use but current use <7 days/week, 19–26 body mass index, and generally medically and physically healthy. Exclusion criteria consisted of <12 years of education, current night shift worker, current or lifetime DSM-5 Diagnosis of psychosis, mania, Attention-Deficit/Hyperactivity Disorder, Obsessive Compulsive Disorder, Feeding and Eating disorder, Posttraumatic Stress Disorder, or substance use disorder (SUD) (except for mild or moderate CUD or AUD), significant depression or anxiety symptoms (>7 on Hamilton Depression or Anxiety Rating Scales), alcohol use >4 days/week, >20 cigarettes/week [or electronic nicotine delivery system (ENDS) equivalent], desire to cut down/stop cannabis use, currently engaged in SUD treatment, use of psychoactive medications in past 4-weeks, cognitive dysfunction (e.g., history of head injury with >5 min loss of consciousness, intellectual disability, organic mental/neurologic syndrome, pervasive developmental disorder), or MRI contraindications (current pregnancy, left-handedness, presence of ferrous-containing metal in body, claustrophobia).
Data from the current study were drawn from a larger ongoing study (NCT04512365). Study protocols were approved by the University of Illinois at Chicago Institutional Review Board and in accordance with the Declaration of Helsinki. All data and analysis code are available upon request.
Interested individuals completed a brief survey and were contacted via telephone to assess eligibility criteria. Eligible participants completed a screening visit, during which informed consent was obtained and a battery of questionnaires assessing cannabis use history was completed. All questionnaires were completed via REDCap (34). Qualifying participants completed a within-subject, double-blind, randomized study using a cross-over design in which they attended two drug administration visits, 4–7 days apart on which they received oral 7.5 mg THC (dronabinol) or placebo, 45 min prior to completing a Go/No-Go task. Participants were asked to abstain from all substance use for at least 24 h before each study session. Data for the current study were drawn from the screening visit (i.e., pre-laboratory sessions), as well as the laboratory drug administration visits.
Sociodemographic factors, including sex, race, ethnicity, educational attainment, height, and weight were collected via a demographics questionnaire. At screening, the Structured Clinical Interview for DSM-5 Disorders (SCID-5-RV) was administered to assess current and past DSM-5 CUD (35).
At screening, participants completed the DFAQ-CU (36) to assess patterns of cannabis use. Past month cannabis use frequency was estimated with a numerical response ranging from 0 to 31 (i.e., “Approximately how many days of the past month did you use cannabis?”). To measure past year cannabis use frequency, participants were asked “which of the following best captures the average frequency you currently use cannabis?”. Participants selected from 13 response options, ranging from 0 = “I do not use cannabis” to 12 = “More than once a day.” Responses to this question were recoded continuously to approximate past year cannabis use. For example, 0 and 1= “Less than once a year” were recoded to 0, 7 = “Once a week” was recoded to 52, and 11 = “Once a day” was recoded to 365. 12 was recoded to reflect twice a day, or 730 times in the past year. More information on the recoding of and response distribution to this variable is provided in Supplementary Table S2.
At screening, study personnel administered the modified Drug History Questionnaire [mDHQ; based on (37)] to participants. As part of this semi-structured questionnaire, study personnel asked participants how many years they used cannabis and then asked them about their average cannabis use occasions during those years (e.g., use 1×/week over 1 year = 52 cannabis use occasions). Study personnel were trained to ask about changes in use during those years and to incorporate changes in use into calculation of cumulative lifetime use frequency.
At screening, participants completed the CUDIT-R to assess past 6-month cannabis use and cannabis use problems, and to screen for further CUD assessment (38). Participants responded to eight items using a 5-point Likert scale (0 = Never to 4 = Daily or Almost Daily). Example items included, “How often in the past 6 months have you devoted a great deal of your time to getting, using, or recovering from cannabis?” and, “How often in the past 6 months did you fail to do what was normally expected from you because of using cannabis?”. Responses were summed to create a total score (possible range = 0–32). A total score of 8 or more indicates hazardous use; a score of 12 or more indicates the need to assess for cannabis use disorder.
During the drug administration sessions, participants completed the Drug Effects Questionnaire [DEQ (39);] at baseline (0 min; prior to drug administration), 30 min (prior to the GNG task), and 60 min (immediately after the GNG task). On the DEQ, participants rated their responses to the questions, “Do you feel any drug effects?” and “Do you feel high right now” (rated from “not at all”=0 to “very strongly”=100). For DEQ analyses, we used change scores before to after the GNG task (mean of 30 and 60 min assessments) and subtracted placebo from THC scores (40).
The GNG task [based on (41, 42)] was administered 45 min after placebo and THC administration. At the beginning of each block, participants were instructed to press either the left or right button for letters that differed from the previous letter (i.e., Go trials), and to withhold a response if the letter was the same as the prior letter (i.e., No-go trials). For every No-go trial, participants could either respond (failed inhibition; FI) or withhold a response (successful inhibition; SI). Similarly, for every Go stimulus, participants could either respond (hit) or withhold (miss). Go and No-go stimuli (i.e., the letters) were presented for 200 ms with a response window of 700 ms. Accuracy feedback was presented after each trial for 1,000 ms (i.e., green/yellow bar for correct/incorrect responses, respectively). Inter-trial intervals were marked by a fixation cross presented on the center of the screen for a randomized duration between 500 and 1,000 ms. Participants completed at least 2 blocks of the task, with at least 288 Go trials and 72 No-go trials. New blocks were presented until participants generated at least 20 FI responses.
We fit the DDM to GNG data using Bayesian estimation in Dynamic Models of Choice software (43). With respect to varying numbers of trials across some participants, the minimum number of trials in this study was greater than the number previously found to be sufficient for recovery of DDM parameters for GNG tasks (31). Further, our Bayesian analytic approach accounts for this feature of the GNG task by adjusting the uncertainty of parameter estimates based on the amount of data per person (leading to greater uncertainty for individuals with fewer trials). Prior to model estimation, we excluded individuals with missing data from either session (n = 5) or those with an overall accuracy rate <.55 at either session (n = 1), leaving a total of 30 participants for analysis. Next, following standard procedures for fitting the DDM (44), “fast guess” response times <150 ms were excluded, which affected <1% of response. The central five drift diffusion model parameters were estimated: drift rates for go (v.go) and no-go stimuli (v.nogo), response conservativeness (a), nondecision time (Ter), and response bias (z). A parameter for between-trial variability in Ter was included, but between-trial variability in v and z were not estimated due to difficulties with parameter recovery and findings that the main DDM parameters are not substantially affected by their omission (45). Latency and variability in Ter were captured by estimating two parameters representing the lower bound (t0) and upper bound (st0) of the uniform distribution of variability in nondecision times across trials, respectively. The scales for the drift rate and boundary separation parameters are arbitrary in that they are determined by the value of a scaling parameter (46). In this case, between-trial variability in drift rate was set to 1 as a scaling parameter. The scale for non-decision time is in seconds, and t0 ranged from 0.14 to 0.22 in the placebo condition and from 0.13 to 0.20 in the THC condition. st0 ranged from 0.03 to 0.21 and from 0.03 to 0.34 in the placebo and THC conditions, respectively. High values on this parameter are thought to represent more time spent encoding stimuli and executing motor responses.
We conducted two different types of DDM analyses. First, as described in detail below, we completed a model comparison analysis to assess which of the four main DDM parameters (v, a, Ter, z) showed evidence varying between the THC and placebo conditions. Each model considered in the comparison analysis was fit at the individual level, with all parameters estimated separately for each participant, due to concerns about potential biases in model selection analyses conducted with hierarchical Bayesian models (47). Once an optimal model was indicated by the model selection analysis, we then estimated a hierarchical Bayesian version of the model, in which all individual-level model parameters were assumed to follow normal distributions described by mean (μ) and standard deviation (σ) hyper-parameters. Hierarchical Bayesian models improve the estimation of individual-level parameters by allowing information about the group distribution to constrain individual-level parameter estimates (48, 49). In addition, posterior distributions for the group-level hyper-parameters can be used to make inferences about how DDM parameters vary across groups and conditions: differences in mean (μ) parameter posteriors indicate changes in the average level of a DDM parameter while differences in the standard deviation (σ) indicate changes in variability of that DDM parameter between individuals in the group.
All sampling from model parameter posteriors at both the individual and group level was conducted using the differential evolution Markov chain Monte Carlo method (50) with broad, uninformative priors (Supplementary Table S1). Convergence was determined by evaluating whether the Gelman-Rubin statistic (51) was <1.10 and by visual inspection of chains to ensure stability. Posterior predictive plots (Supplementary Figure S1) indicated that the model provided adequate fit to the GNG data.
Models that allowed all possible combinations of parameters of interest (v, a, Ter, z) to vary between the placebo and THC conditions were estimated. These comparisons involved 16 candidate models including a “null” model in which none of the parameters varied by experimental condition. Following individual-level Bayesian estimation of all candidate models, the models were compared on two information criterion metrics that assess model fit while penalizing for complexity: the deviance information criterion [DIC (52):] and Bayesian predictive information criterion [BPIC (53):]. The model that displayed the lowest value of each information criterion was selected as the optimal model for parsimoniously describing differences between the placebo and THC conditions.
Following hierarchical Bayesian estimation of the optimal model derived from the model-comparison procedure, we used posterior samples for the mean (μ) and standard deviation (σ) group-level parameters from the THC and placebo conditions to quantify evidence for differences in parameter means and parameter variability across the experimental conditions. As in our prior work (54, 55), evidence was represented as the proportion of the posterior difference distribution that was above 0 (P). P was computed by sampling without replacement from the samples for a given group-level parameter in each condition, subtracting each placebo sample from its corresponding THC sample, and counting the proportion of samples for which one condition was greater than the other. For interpretability we always computed the proportion of samples above 0 for the condition that had the greatest number of samples above 0, leading to P values that range between 0.5 and 1.0. P quantifies the probability that the posterior different distribution is consistent with the hypothesis that a difference exists. Although P can be interpreted on a continuous scale, we adopt our prior guidelines (55): P values >0.75 were interpreted as positive, but weak, evidence for a difference while P values >0.95 were considered strong evidence.
We also aimed to assess relations between individuals’ parameter differences across the experimental conditions (THC—placebo) and several relevant covariates. We subtracted individual-level posterior samples for parameters of interest in the placebo condition from those in the THC condition to create posteriors for each individual's experimental effect in the parameter. We then used a “plausible values” analysis (56–58) to compute the posterior distribution for the correlation coefficient (r value) between the posterior difference scores and covariate. This procedure first involves generating the posterior distribution for the sample's correlation coefficient by assessing the correlation between the covariate and each posterior sample. Next, the posterior for the population's correlation coefficient is estimated with the approach outlined by Ly et al. (56) using a uniform prior for the population's r value that spans values from −1 to 1. The density of this distribution above 0, relative to below 0, is then used to compute a P value for inference.
To assess whether cannabis use history affected acute responses to THC, we examined responses in relation to both cannabis use history (past month cannabis use frequency, past year cannabis use frequency, lifetime cannabis use frequency, and CUDIT-R total score) and subjective drug effects (DEQ “feel” and “high” scores). We examined the two parameters with the greatest variability after THC: drift rates (v.go, v.nogo) and the upper bound of the nondecision time distribution (st0), which primarily indexes variability in nondecision times. As both drift rates showed similar evidence of increased heterogeneity during acute THC as drift rates across experimental conditions typically reflect a single task-general drift rate factor (22, 23), we averaged the v.go and v.nogo rates to produce an average drift rate (v.avg) index for analyses. Posterior distributions for Pearson correlations were estimated with past year cannabis use frequency, past month cannabis use frequency, lifetime cannabis use frequency, CUDIT-R scores, or DEQ difference scores and within-person difference scores in drift rate (v.avg) or variability in nondecision time (st0) across THC and placebo conditions.
To assess relations between cannabis use history and subjective THC effects, we performed inferential correlation analyses using Bayes Factors (BFs) in JASP (59, 60). BFs represent the likelihood of the data given a specific hypothesis—such as the hypothesis that the effect size is not 0—compared to the likelihood of the data under the null hypothesis. For instance, a BF of 5 suggests that the data are five times more likely under the research hypothesis than under the null. Conversely, a BF of 0.50 implies that the data are two times more likely under the null hypothesis. Accordingly, BFs below 1 offer only weak or inconclusive support for the research hypothesis, while BFs above 1 provide support, with larger BF values indicating increasingly stronger or decisive evidence.
Descriptive statistics are presented in Table 1. On average, participants were 22 years of age with 15 years of education, and the sample had slightly more males. Regarding race, 60% of participants were White, 17% were Asian, 10% were Multiracial, 7% were Black, 3% were Native American, and 3% identified as “Other”. The majority of participants (77%) were Not Hispanic. Our sample captured significant variability in cannabis use. Indeed, past month frequency of cannabis use ranged from 0 to 25 times. Similarly, there was a wide range of past year frequency of cannabis use, with adolescents and young adults endorsing between 0 and 286 days of cannabis use in the past year (Supplementary Table S2) and between 12 and 800 days of cannabis use in their lifetime (Supplementary Table S3). Past year cannabis use frequency was strongly correlated with past month (r = 0.94) and lifetime (r = 0.60) cannabis use frequency. With respect to problem cannabis use, 5 participants reported CUDIT-R scores in the hazardous range. One participant met criteria for current mild CUD only, one met criteria for both current and past mild CUD, and 5 had only past CUD. Participants consumed a mean of 3.75 drinks per week, and 6 participants endorsed any past month nicotine use.
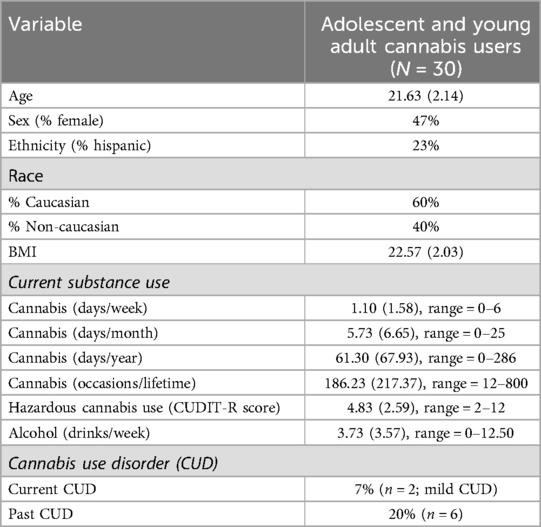
Table 1. Participants characteristics.
Participants reported feeling significant drug effects and high during THC sessions compared to placebo sessions (see Figure 1). Indeed, THC increased feel and high scores (Feel: THC (M = 28.90, SD = 21.80); placebo (M = 21.89, SD = 17.68); t(29) = 1.71, p = .049; High: THC (M = 22.98, SD = 23.94); placebo (M = 13.48, SD = 12.45); t(29) = 2.20, p = .02). Results of inferential correlation analyses suggested little evidence for associations between recent cannabis use and subjective drug effects. Specifically, there was weak evidence for correlations between past year cannabis use and high and feel scores (High: r = 0.08, BF = 0.25; Feel: r = 0.27, BF = 0.62). Results were similar for past month cannabis use, with little evidence for associations with subjective drug effects (High: r = 0.18, BF = 0.35; Feel: r = 0.32, BF = 0.91).
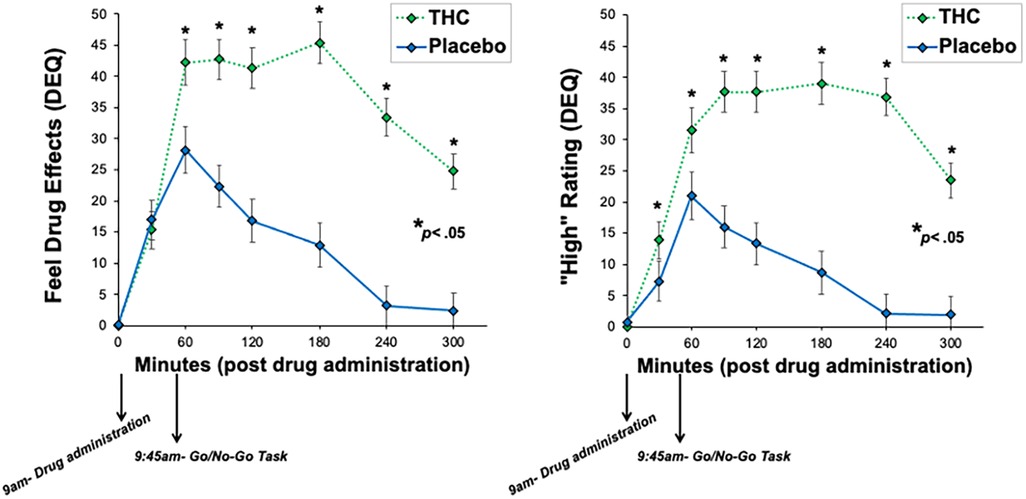
Figure 1. Subjective ratings of drug effects across the drug administration visits. THC significantly increased ratings of feel drug effects and high compared to placebo.
DIC and BPIC values for each model in the comparison analysis, zero-based for clarity, are displayed in Table 2. Both information criteria indicated clear inferiority of the null model, suggesting that there was evidence for performance differences between the conditions. Both DIC and BPIC indicated that the model allowing drift rates (v), boundary separation (a), and nondecision processes (t0/st0) to vary across conditions was the best-fitting model. The full model displayed worse fit, suggesting that the start point/bias (z) parameter value was not necessary to explain experimental differences. Hence, a model allowing v, a, and t0/st0 to vary across THC and placebo conditions was retained as the optimal model and estimated in a hierarchal Bayesian analysis.
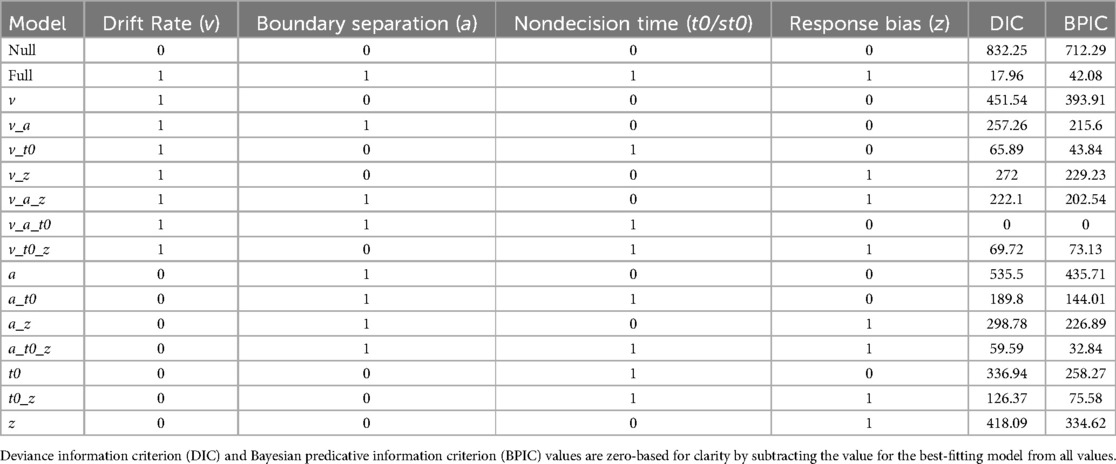
Table 2. Results from the model comparison analysis contrasting models that explain performance differences between the placebo and THC conditions using all possible combinations of parameters of interest.
After a burn-in period was completed, the hierarchal model achieved convergence following 120 iterations of 33 chains, leaving 3,960 posterior samples available testing differences between experimental conditions. Posterior distributions for group means and standard deviations in each experimental condition are displayed in Figure 2. Despite the results of the model selection indicating that several parameters displayed differences between placebo and THC conditions, there was little evidence for experimental effects in the group means of drift rates (v.go μ P = 0.61, v.nogo μ P = 0.62), boundary separation (a μ P = 0.64), or nondecision processes (t0 μ P = 0.73, st0 μ P = 0.64). Tests of group standard deviations revealed more substantial evidence for greater variability in drift rates (v.go σ P = 0.76, v.nogo σ P = 0.79) and in the upper bound of the nondecision time distribution (st0 μ P = 0.97) under THC condition relative to placebo. There was little evidence for experimental differences in the variability of boundary separation (a σ P = 0.56) or the lower bound of the nondecision time distribution (t0 σ P = 0.51). Taken together, these findings indicate relatively little evidence for systematic differences in group mean parameter values during acute THC relative to placebo. However, evidence for greater variability in drift rates and nondecision processes during acute THC, coupled with the results of the model comparison analyses supporting differences in all three types of parameters, suggests that THC acutely produces heterogeneous effects on the DDM parameters. To explore sources of this heterogeneity, we evaluated whether individuals’ difference scores for the experimental effect were related to cannabis use history and subjective drug effects.
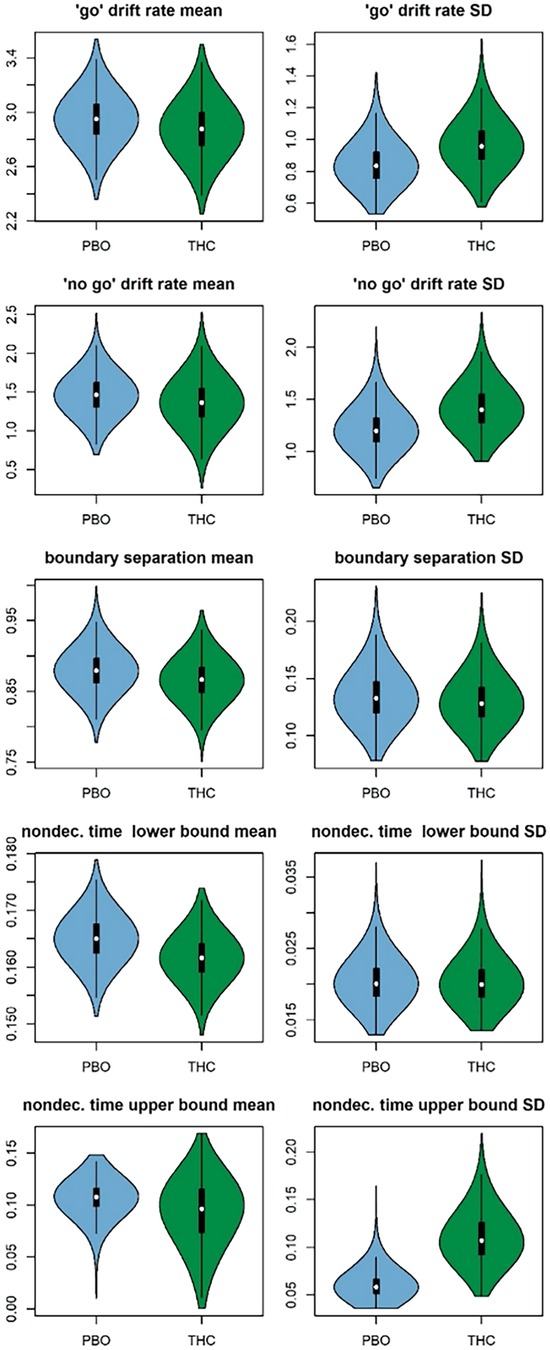
Figure 2. Posterior distributions for group means (left column) and standard deviations (SDs, right column) of each diffusion model parameter in the placebo (PBO; blue) and THC (green) conditions. Posteriors are displayed as violin plots that feature box plots of the posterior samples surrounded by kernel density plots of the same samples.
There was evidence that lower past year cannabis use was related to both poorer cognitive efficiency after THC (slower GNG drift rate) (v.avg r = 0.16, P = 0.88; Figure 3), and greater variability in time spent encoding stimuli or executing motor responses after THC (more variable non-decision times; st0 r = −0.20, P = 0.97; Figure 3). Effects were in a similar direction, albeit weaker, with respect to drift rate (v.avg r = 0.08, P = 0.74), when examining the effects of past month cannabis use. Participants with less past month cannabis use demonstrated strong evidence of greater variability in non-decision time in response to THC administration (st0 r = −0.21, P = 0.97). Results differed slightly when examining lifetime cannabis use frequency. Indeed, there was little evidence that lifetime cannabis use was related to cognitive efficiency after THC (drift rate) (v.avg r = −0.04, P = 0.61). However, similar to past year and past month use, lifetime cannabis use did associate with variability in time spent encoding stimuli or executing motor responses after THC (non-decision time variability; st0 r = −0.23, P = 0.98; Figure 4).
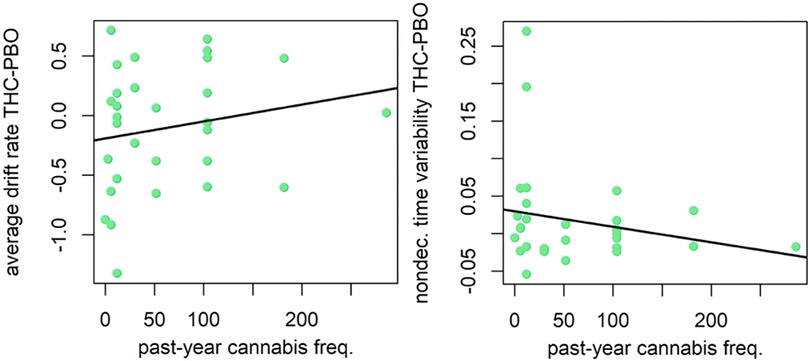
Figure 3. Correlation plot for difference in drift rate between THC and placebo (PBO) conditions, and past year cannabis use frequency (left). Correlation plot for difference in nondecision time variability between THC and placebo conditions, and past year cannabis use frequency (right). Participants with less past year cannabis use demonstrated poorer cognitive efficiency (slower GNG drift rate) and greater variability in time spent encoding stimuli or executing motor responses (more variable non-decision times) during THC condition.
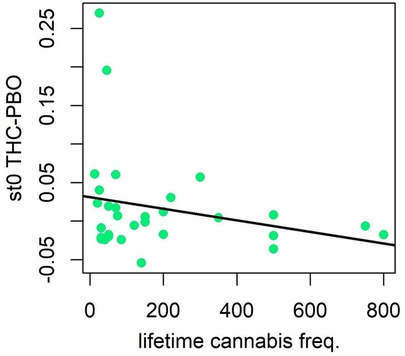
Figure 4. Correlation plot for difference in nondecision time variability between THC and placebo conditions, and lifetime cannabis use frequency. Participants with less lifetime cannabis use demonstrated greater variability in time spent encoding stimuli or executing motor responses (more variable non-decision times) during THC condition.
Regarding hazardous use, results were similar to past year cannabis use when examining relationships with CUDIT-R scores, but the magnitude of associations was smaller and evidence was weaker (see Figure 5). The correlation between CUDIT-R scores and cognitive efficiency was in the expected direction, but small in magnitude and relatively weak in evidence (v.avg r = 0.08, P = 0.75). Adolescents and young adults with less hazardous patterns of cannabis use demonstrated evidence of greater variability in non-decision times (st0 r = −0.13, P = 0.86) during the THC condition. Inspection of scatterplots of relations with the st0 parameter (Figures 3, 5) suggested that this parameter's relations with cannabis use history may have been driven by two “high-leverage” points that were 2.72 and 3.85 standard deviations above the group's mean difference score, respectively. However, analyses in which these two participants’ data were excluded continued to show effects in the same direction, albeit with slightly weaker evidence (past year use r = −0.10, P = 0.76; CUDIT-R r = −0.08, P = 0.70).
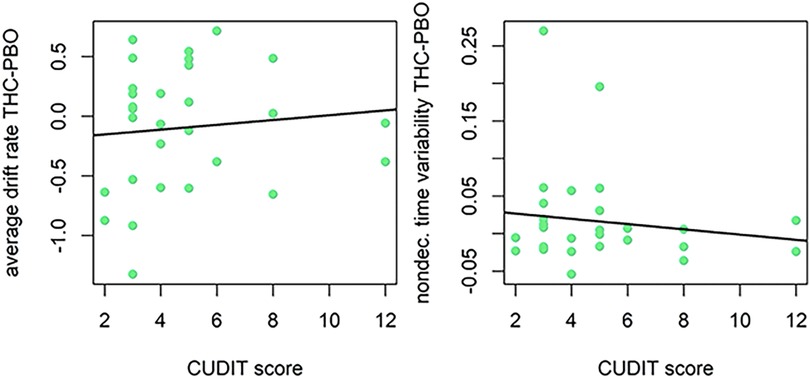
Figure 5. Correlation plot for difference in drift rate between THC and placebo (PBO) conditions, and CUDIT-R score (left). Correlation plot for difference in nondecision time variability between THC and placebo conditions, and CUDIT-R score (right). Participants with lower CUDIT-R scores (less frequent/hazardous cannabis use) demonstrated poorer cognitive efficiency (slower GNG drift rate), but this was a small effect. Participants with lower CUDIT-R scores (less frequent/hazardous cannabis use) demonstrated greater variability in time spent encoding stimuli or executing motor responses (more variable non-decision times) in response to THC administration.
There was evidence that individual differences in subjective drug effects impacted the acute neurocognitive effects of THC. Indeed, participants that reported higher DEQ “Feel” scores during THC (vs. placebo), demonstrated poorer cognitive efficiency in response to THC (v.avg r = −0.23, P = 0.96; Figure 6). Results did not support an effect of DEQ “Feel” difference scores on non-decision time (st0 r = 0.04, P = 0.66). Finally, participants that reported higher DEQ “High” scores during THC (vs. placebo) demonstrated poorer cognitive efficiency (v.avg r = −0.19, P = 0.92) in response to THC. Surprisingly, participants who reported greater “High” scores during THC had lesser increases in non-decision time variability (st0 r = −0.23, μ P = 0.97) during THC intoxication. The relation between “High” scores and st0 was also robust to the removal of the two high-leverage points (r = −0.20, P = 0.89; Figure 7).
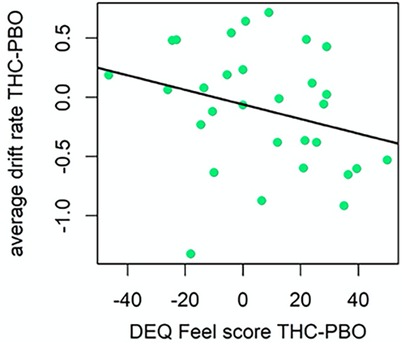
Figure 6. Correlation plot for difference in drift rate between THC and placebo (PBO) conditions, and difference in DEQ feel score between THC and placebo conditions (left). Participants with higher DEQ Feel scores during THC condition demonstrated poorer cognitive efficiency (slower GNG drift rate) during THC condition.
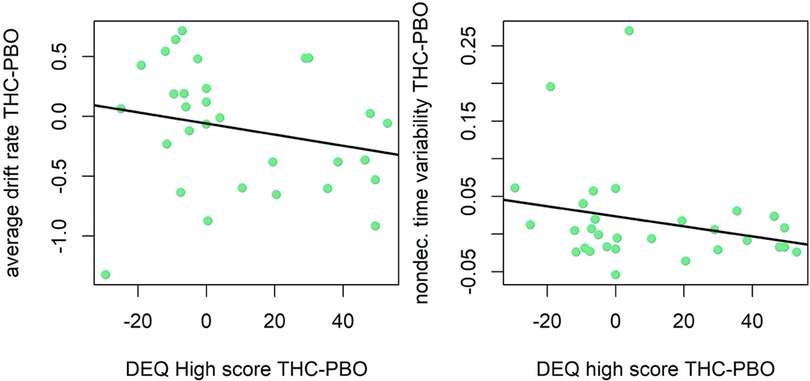
Figure 7. Correlation plot for difference in drift rate between THC and placebo (PBO) conditions, and difference in DEQ high score between THC and placebo conditions (left). Correlation plot for difference in nondecision time variability between THC and placebo conditions, and difference in DEQ High score between THC and placebo conditions (right). Participants with higher DEQ High scores during THC condition demonstrated poorer cognitive efficiency (slower GNG drift rate) and had lesser increases in variability in time spent encoding stimuli or executing motor responses (less variable non-decision times) in response to THC administration.
The current study sought to examine the influence of THC on neurocognitive performance in a sample of late adolescent and young adult occasional to regular cannabis users with considerable variability in their cannabis use history. Our sample was particularly well-positioned to test study aims and findings are likely to generalize to typical US adolescents and early adults, who vary in their cannabis use patterns (2, 61). We applied the DDM (27) to GNG data within a hierarchical Bayesian modeling framework in order to improve measurement reliability and validity by parsing THC's effects on DDM parameter estimates that index mechanisms that underlie behavioral performance. We also explored how individual differences in cannabis use history impacted acute THC effects on neurocognitive functioning. Overall, we found little evidence for systematic mean differences between THC and placebo conditions in any neurocognitive parameter. Interestingly, we found evidence for greater variability in THC relative to placebo across both drift rate (cognitive efficiency) and between-trial variability in nondecision time (motor response execution), suggesting heterogeneous effects of THC on GNG performance. Our hypothesis that poorer neurocognitive performance on GNG following THC administration would be stronger among individuals with less recent cannabis use and those who reported experiencing more subjective drug effects was also supported by evidence.
To our knowledge, this is the first study to apply a computational modeling approach, the DDM, to a behavioral task assessing neurocognition in a double-blind acute THC drug administration study. This represents an advancement from prior work because the DDM provides reliable and valid measures of several mechanisms that influence behavioral performance (22–24, 29, 62). Interestingly, our findings suggested that there were no systematic differences in group mean parameter values during the THC condition relative to placebo. This is consistent with two previous studies which utilized the same dose of THC (7.5 mg) and reported no main effects of THC on GNG performance (11, 15). Additionally, our results corroborate those from a prior study that used a slightly higher 10 mg dose of THC; Borgwardt and colleagues (2008) found no significant differences for mean inhibition errors or mean reaction times on GNG between placebo and THC conditions. However, Bhattacharyya and colleagues (2015) also used a 10 mg dose and reported that THC acutely increased errors of commission on GNG. Importantly, our sample differed with respect to participants’ cannabis use history. Whereas all participants in Bhattacharyya and colleagues’ (2015) study used fewer than 25 times in their lifetime, adolescents and early adults in the current study endorsed great variability in their use, ranging in using cannabis from 12 to 800 times in their lifetime. It may be that the main effect of THC intoxication on neurocognitive functioning at a relatively low dose is only detectable among individuals who are cannabis naïve, who use very infrequently, or who have had abstained from cannabis use for a long period of time. Importantly, results from the current study revealed greater between-person variability in drift rates and nondecision processes in the THC condition, suggesting that the acute effects of THC produce heterogeneous effects on some DDM parameters. Taken together with the extant mixed literature in this area, our findings support the notion that examination of individual differences that may impact the acute effects of THC on neurocognition is warranted.
The current study aimed to identify potential sources of heterogeneity by testing whether tolerance effects may account for individual differences in neurocognition following THC administration. Our data were well-positioned to test this question, as we recruited a sample of late adolescent and young adults with considerable variability in their cannabis use history. Notably, there was great variability in use patterns with the majority of the sample endorsing non-hazardous use, but 23% (n = 7) of the sample meeting criteria for a lifetime diagnosis of CUD. Consistent with our hypothesis, results revealed that participants with less past month and past year cannabis use demonstrated poorer cognitive efficiency (greater reductions in drift rates) in response to THC administration. On the other hand, lifetime cannabis use history was not related to acute THC effects on cognitive efficiency, providing preliminary evidence that perhaps more recent (compared to more distal) cannabis use is important to consider when examining tolerance effects on neurocognitive functioning in response to THC intoxication. Additionally, participants who endorsed low levels of past month, past year, and lifetime cannabis use, and low CUDIT-R scores displayed greater variability in time spent encoding stimuli or executing motor responses in response to THC administration (more variable non-decision times; st0 parameter). As the nondecision time parameter is difficult to attribute to any particular process, however (63), it is unclear which specific processes may underlie this pattern of increased nondecision time variability.
Our findings that some effects of THC on cognition appear to be moderated by recent use are consistent with one prior study which found that occasional cannabis users (weekly cannabis use or less) demonstrated poorer neurocognitive performance following ingestion of 35 mg THC among, while heavy cannabis users (use more than 4 days/week) generally did not display evidence of poorer neurocognition (12). Our results extend this work by utilizing the DDM to decompose several mechanisms of influence on behavioral task performance, and suggest that both cognitive efficiency and stimulus response encoding/motor response execution may be adversely impacted by THC among adolescents and young adults with less frequent cannabis use.
Further supporting our hypothesis, participants who endorsed strong drug “effect” and drug “high” on subjective effects measures demonstrated greater reductions in cognitive efficiency during THC intoxication. Surprisingly, adolescents and young adults who reported more strongly feeling “high” following THC ingestion demonstrated less nondecision time variability during THC intoxication, spending less time encoding stimuli and executing their motor response. Again, given previous research that has found that the nondecision time parameter is difficult to attribute to a particular neurocognitive or motor process (63), interpretation of this effect is challenging. Future studies are needed to replicate and further explore this result. Indeed, this is the first experimental study, to our knowledge, to demonstrate that individual differences in subjective drug effects may modify the acute effects of THC on neurocognition. Previous studies that fail to account for individual differences in tolerance effects likely obscure the acute, adverse effects of THC on neurocognition among individuals with lower tolerance.
Findings from the current study should be interpreted within the context of certain limitations. First, our study was limited by only one dose (7.5 mg) of THC, as it was drawn from a larger study which employed fMRI methodology during placebo and THC sessions, and employing fMRI methodology is expensive and time-intensive. Still, it may useful for future studies to use varying doses of THC. Second, our sample size was small, limiting statistical power. Although we employed Bayesian statistical methods and primarily examined within-person differences across experimental conditions to appropriately analyze our small sample, it would nonetheless be useful for future work to recruit larger sample sizes in order to replicate our results and ensure generalizability. Third, the GNG task was administered at 45 min post-THC administration close to peak drug effects (seen around 60 min, see Figure 1), but not during peak drug effects. Therefore, drug effects on task performance may have been greater during peak effects; although previous THC experimental studies using the same dose did not see significant effects of THC on GNG performance during peak intoxication (11, 15). Future research is needed to replicate our results. Fourth, the current sample captured normative cannabis use patterns among cannabis-using community adolescents and young adults. Therefore, results may not generalize to clinical populations with higher levels of psychopathology and future research with clinical samples is needed. Fifth, all three measures of cannabis use frequency (lifetime, past year, and past month) were strongly correlated, limiting our ability to disentangle the effects of longer-term cannabis use from recent cannabis use. Future studies may aim to recruit samples that are more varied with respect to recency of use (e.g., comparing participants who endorse lifetime cannabis use, but have ceased recent use to those who are actively using) to provide a more nuanced understanding of the role of cannabis use tolerance in modifying acute THC effects on neurocognitive functioning. Finally, while prior studies have found that development in brain regions and activations underlying cognitive efficiency appears to plateau or show only very slight ongoing improvements from mid-adolescence into young adulthood (30, 64, 65), it is possible that developmental effects influenced our findings. Future studies may aim to examine how individual differences in neurocognitive functioning during THC intoxication differ based on stages of brain development underlying these abilities.
Findings from the current study suggest that effects of THC on neurocognitive processing are heterogenous across individuals and are potentially influenced by individuals’ tolerance effects and subjective experiences of intoxication. In other words, individuals who use cannabis more frequently and/or who do not experience feeling the “effects” or “high” after ingestion of a 7.5 mg dose of THC do not show THC-induced weaknesses (at a 7.5 mg dose) in performance on the GNG, likely due to tolerance. Conversely, our findings demonstrate that adolescents and young adults who endorse infrequent cannabis use and/or strong subjective THC effects are particularly susceptible to display worse neurocognition, specifically in cognitive efficiency, even at a relatively low dose of 7.5 mg. Additionally, adolescents and young adults with infrequent cannabis use may show poorer ability to encode stimuli and execute their motor responses during THC intoxication. This could have critical public health implications, suggesting that a wide range of behaviors involving cognitive efficiency or motor response execution, like driving or catching oneself from falling, may be weakened at even low doses of THC among some adolescents who use cannabis infrequently. Importantly, these results do not suggest that adolescents and young adults should increase their cannabis use to avoid adverse impacts on neurocognitive functioning. Rather, it is likely that there are complex individual differences in tolerance to THC intoxication, that are explained in part by recent patterns of cannabis use and subjective drug effects. Future research should explore other factors (social context, mood state, etc.) that may also play a role in impacting the acute effects of THC on neurocognitive functioning across different dosages. Finally, our findings support growing consensus that evidence accumulation models, like the DDM, are fruitful in enhancing psychometrics of behavioral tasks of neurocognition (22–24).
The datasets presented in this article are not readily available because the study from which these data were obtained is ongoing. Therefore, the data collection is not yet complete and has not been prepared for data sharing. Requests to access the datasets should be directed to Natania Crane, bmNyYW5lM0B1aWMuZWR1.
The study involving humans was approved by University of Illinois at Chicago Institutional Review Board. The studies was conducted in accordance with the local legislation and institutional requirements. The participants provided their written informed consent to participate in this study.
KP: Conceptualization, Data curation, Writing – original draft, Writing – review & editing, Formal Analysis, Visualization. AW: Conceptualization, Formal Analysis, Methodology, Software, Validation, Visualization, Writing – original draft, Writing – review & editing. OA: Supervision, Writing – review & editing. KLP: Supervision, Writing – review & editing. HD: Supervision, Writing – review & editing. HK: Supervision, Writing – review & editing. NC: Conceptualization, Data curation, Formal Analysis, Funding acquisition, Investigation, Methodology, Project administration, Resources, Software, Supervision, Validation, Visualization, Writing – original draft, Writing – review & editing.
The author(s) declare financial support was received for the research, authorship, and/or publication of this article. This research was funded by the National Institute on Drug Abuse (NIDA) (K23DA048132; PI: NAC) and supported through the National Institutes of Health (NIH) through the UIC Center for Clinical and Translational Science (CCTS) (UL1TR002003). KJP was supported by National Institute on Alcohol Abuse and Alcoholism (NIAAA; T32 AA007477). ASW was supported by K23 DA051561. HdW was supported by DA02812. Its contents are solely the responsibility of the authors and do not necessarily represent the official views of NIDA, NIAAA, NIH.
The authors declare that the research was conducted in the absence of any commercial or financial relationships that could be construed as a potential conflict of interest.
The author(s) declared that they were an editorial board member of Frontiers, at the time of submission. This had no impact on the peer review process and the final decision.
The author(s) declare that no Generative AI was used in the creation of this manuscript.
All claims expressed in this article are solely those of the authors and do not necessarily represent those of their affiliated organizations, or those of the publisher, the editors and the reviewers. Any product that may be evaluated in this article, or claim that may be made by its manufacturer, is not guaranteed or endorsed by the publisher.
The Supplementary Material for this article can be found online at: https://www.frontiersin.org/articles/10.3389/fradm.2025.1541068/full#supplementary-material
2. Miech RA, Johnston LD, Patrick ME, O’Malley PM, Bachman JG. Monitoring the Future National Survey Results on Drug use, 1975–2023: Secondary School Students. Monitoring the Future Monograph Series. Ann Arbor, MI: Institute for Social Research, University of Michigan (2023). Available online at: https://monitoringthefuture.org/results/annual-reports/
3. U.S. Department of Health and Human Services, Substance Abuse and Mental Health Services Administration, Center for Behavioral Health Statistics and Quality. National Survey on Drug Use and Health 2023. Rockville, MD: U.S. Department of Health and Human Services, Substance Abuse and Mental Health Services Administration, Center for Behavioral Health Statistics and Quality (2023). Available online at: https://www.samhsa.gov/data/ (Accessed October 01, 2024).
4. Kalant H. A critique of cannabis legalization proposals in Canada. Int J Drug Policy. (2016) 34:5–10. doi: 10.1016/j.drugpo.2016.05.002
5. Wittchen H-U. Estimating harmful effects of cannabis and use for policy makers shifting from one mistake to the next? Addiction (Abingdon, England). (2010) 105(8):1334–5. doi: 10.1111/j.1360-0443.2010.02937.x
6. Crane NA, Wade NE. Cannabis and neuropsychology. In: Brown GG, King TZ, Haaland KY, Crosson B, editors. APA Handbook of Neuropsychology, Volume 1: Neurobehavioral Disorders and Conditions: Accepted Science and Open Questions (Vol. 1). Washington: American Psychological Association (2023). p. 627–47. doi: 10.1037/0000307-029
7. Duperrouzel JC, Granja K, Pacheco-Colón I, Gonzalez R. Adverse effects of Cannabis use on neurocognitive functioning: a systematic review of meta- analytic studies. J Dual Diagn. (2020) 16:43–57. doi: 10.1080/15504263.2019.1626030
8. Hall W, Lynskey M. Assessing the public health impacts of legalizing recreational cannabis use: the US experience. World Psychiatry. (2020) 19:179–86. doi: 10.1002/wps.20735
9. Hart C. Effects of acute smoked marijuana on complex cognitive performance. Neuropsychopharmacology. (2001) 25:757–65. doi: 10.1016/S0893-133X(01)00273-1
10. Weinstein A, Brickner O, Lerman H, Greemland M, Bloch M, Lester H, et al. A study investigating the acute dose— response effects of 13 mg and 17 mg Δ 9- tetrahydrocannabinol on cognitive—motor skills, subjective and autonomic measures in regular users of marijuana. J Psychopharmacol. (2008) 22:441–51. doi: 10.1177/0269881108088194
11. McDonald J, Schleifer L, Richards JB, De Wit H. Effects of THC on behavioral measures of impulsivity in humans. Neuropsychopharmacol. (2003) 28:1356–65. doi: 10.1038/sj.npp.1300176
12. Ramaekers J, Kauert G, Theunissen E, Toennes S, Moeller M. Neurocognitive performance during acute THC intoxication in heavy and occasional cannabis users. J Psychopharmacol. (2009) 23:266–77. doi: 10.1177/0269881108092393
13. Ramaekers JG, Kauert G, Van Ruitenbeek P, Theunissen EL, Schneider E, Moeller MR. High-potency marijuana impairs executive function and inhibitory motor control. Neuropsychopharmacol. (2006) 31:2296–303. doi: 10.1038/sj.npp.1301068
14. Bhattacharyya S, Atakan Z, Martin-Santos R, Crippa JA, Kambeitz J, Malhi S, et al. Impairment of inhibitory control processing related to acute psychotomimetic effects of cannabis. Eur Neuropsychopharmacol. (2015) 25:26–37. doi: 10.1016/j.euroneuro.2014.11.018
15. Pabon E, De Wit H. Impaired inhibition after delta-9-tetrahydrocannabinol in women not related to circulating estradiol levels. Pharmacol Biochem Behav. (2023) 225:173547. doi: 10.1016/j.pbb.2023.173547
16. Borgwardt SJ, Allen P, Bhattacharyya S, Fusar-Poli P, Crippa JA, Seal ML, et al. Neural basis of Δ-9-tetrahydrocannabinol and cannabidiol: effects during response inhibition. Biol Psychiatry. (2008) 64:966–73. doi: 10.1016/j.biopsych.2008.05.011
17. Enkavi AZ, Eisenberg IW, Bissett PG, Mazza GL, MacKinnon DP, Marsch LA, et al. Large-scale analysis of test–retest reliabilities of self-regulation measures. Proc Natl Acad Sci USA. (2019) 116:5472–7. doi: 10.1073/pnas.1818430116
18. Hedge C, Vivian-Griffiths S, Powell G, Bompas A, Sumner P. Slow and steady? Strategic adjustments in response caution are moderately reliable and correlate across tasks. Conscious Cogn. (2019) 75:102797. doi: 10.1016/j.concog.2019.102797
19. Miyake A, Friedman NP, Emerson MJ, Witzki AH, Howerter A, Wager TD. The unity and diversity of executive functions and their contributions to complex “frontal lobe” tasks: a latent variable analysis. Cogn Psychol. (2000) 41:49–100. doi: 10.1006/cogp.1999.0734
20. Nigg JT. Annual research review: on the relations among self-regulation, self-control, executive functioning, effortful control, cognitive control, impulsivity, risk-taking, and inhibition for developmental psychopathology. J Child Psychol Psychiatry. (2017) 58:361–83. doi: 10.1111/jcpp.12675
21. Karr JE, Areshenkoff CN, Rast P, Hofer SM, Iverson GL, Garcia-Barrera MA. The unity and diversity of executive functions: a systematic review and re-analysis of latent variable studies. Psychol Bull. (2018) 144:1147–85. doi: 10.1037/bul0000160
22. Löffler C, Frischkorn GT, Hagemann D, Sadus K, Schubert A-L. The common factor of executive functions measures nothing but speed of information uptake. Psychol Res. (2024) 88:1092–114. doi: 10.1007/s00426-023-01924-7
23. Weigard A, Clark DA, Sripada C. Cognitive efficiency beats top-down control as a reliable individual difference dimension relevant to self-control. Cognition. (2021) 215:104818. doi: 10.1016/j.cognition.2021.104818
24. Weigard A, Sripada C. Task-general efficiency of evidence accumulation as a computationally defined neurocognitive trait: implications for clinical neuroscience. Biol Psychiatry Glob Open Sci. (2021) 1:5–15. doi: 10.1016/j.bpsgos.2021.02.001
25. Heathcote A, Matzke D. Winner takes all! what are race models, and why and how should psychologists use them? Curr Dir Psychol Sci. (2022) 31:383–94. doi: 10.1177/09637214221095852
26. Smith PL, Ratcliff R. Psychology and neurobiology of simple decisions. Trends Neurosci. (2004) 27:161–8. doi: 10.1016/j.tins.2004.01.006
27. Ratcliff R. A theory of memory retrieval. Psychol Rev. (1978) 85:59–108. doi: 10.1037/0033-295X.85.2.59
28. Ratcliff R, Smith PL, Brown SD, McKoon G. Diffusion decision model: current issues and history. Trends Cogn Sci (Regul Ed). (2016) 20:260–81. doi: 10.1016/j.tics.2016.01.007
29. Voss A, Nagler M, Lerche V. Diffusion models in experimental psychology: a practical introduction. Exp Psychol. (2013) 60:385–402. doi: 10.1027/1618-3169/a000218
30. Paige KJ, Colder CR, Cope LM, Hardee JE, Heitzeg MM, Soules ME, et al. Clarifying the longitudinal factor structure, temporal stability, and construct validity of go/no-go task-related neural activation across adolescence and young adulthood. Dev Cogn Neurosci. (2024) 67:101390. doi: 10.1016/j.dcn.2024.101390
31. Weigard A, Soules M, Ferris B, Zucker RA, Sripada C, Heitzeg M. Cognitive modeling informs interpretation of go/no-go task-related neural activations and their links to externalizing psychopathology. Biol Psychiatry Cogn Neurosci Neuroimaging. (2020) 5:530–41. doi: 10.1016/j.bpsc.2019.11.013
32. Van Ravenzwaaij D, Dutilh G, Wagenmakers E-J. A diffusion model decomposition of the effects of alcohol on perceptual decision making. Psychopharmacology. (2012) 219:1017–25. doi: 10.1007/s00213-011-2435-9
33. Van Wel JHP, Kuypers KPC, Theunissen EL, Toennes SW, Spronk DB, Verkes RJ, et al. Single doses of THC and cocaine decrease proficiency of impulse control in heavy cannabis users. British J Pharmacology. (2013) 170:1410–20. doi: 10.1111/bph.12425
34. Harris PA, Taylor R, Thielke R, Payne J, Gonzalez N, Conde JG. Research electronic data capture (REDCap)—a metadata-driven methodology and workflow process for providing translational research informatics support. J Biomed Inform. (2009) 42(2):377–81. doi: 10.1016/j.jbi.2008.08.010
35. First M, Skodol A, Bender D, Oldham J. Structured Clinical Interview for DSM-5, Clinician Version (SCID-5-CV). Arlington: American Psychiatric Association (2016).
36. Cuttler C, Spradlin A. Measuring cannabis consumption: psychometric properties of the daily sessions, frequency, age of onset, and quantity of cannabis use inventory (DFAQ-CU). PLoS One. (2017) 12:e0178194. doi: 10.1371/journal.pone.0178194
37. Sobell LC, Kwan E, Sobell MB. Reliability of a drug history questionnaire (DHQ). Addict Behav. (1995) 20(2):233–41. doi: 10.1016/0306-4603(94)00071-9
38. Adamson SJ, Kay-Lambkin FJ, Baker AL, Lewin TJ, Thornton L, Kelly BJ, et al. An improved brief measure of cannabis misuse: the Cannabis use disorders identification test-revised (CUDIT-R). Drug Alcohol Depend. (2010) 110(1–2):137–43. doi: 10.1016/j.drugalcdep.2010.02.017
39. Johanson CE, Uhlenhuth EH. Drug preference and mood in humans: d-amphetamine. Psychopharmacology. (1980) 71:275–9. doi: 10.1007/BF00433062
40. Mayo LM, De Wit H. Acquisition of responses to a methamphetamine-associated cue in healthy humans: self-report, behavioral, and psychophysiological measures. Neuropsychopharmacol. (2015) 40:1734–41. doi: 10.1038/npp.2015.21
41. Macatee RJ, Schermitzler BS, Minieri JB, Moeller SJ, Afshar K, Preston TJ. Neurophysiological error processing and addiction self-awareness correlates of reduced insight in cannabis use disorder. Addiction. (2023) 118:2397–412. doi: 10.1111/add.16321
42. Macatee RJ, Albanese BJ, Crane NA, Okey SA, Cougle JR, Schmidt NB. Distress intolerance moderation of neurophysiological markers of response inhibition after induced stress: relations with cannabis use disorder. Psychol Addict Behav. (2018) 32:944–55. doi: 10.1037/adb0000418
43. Heathcote A, Lin YS, Reynolds A, Strickland L, Gretton M, Matzke D. Dynamic models of choice. Behav Res Methods. (2019) 51:961–85. doi: 10.3758/s13428-018-1067-y
44. Ratcliff R, Tuerlinckx F. Estimating parameters of the diffusion model: approaches to dealing with contaminant reaction times and parameter variability. Psychon Bull Rev. (2002) 9(3):438–81. doi: 10.3758/BF03196302
45. Lerche V, Voss A, Nagler M. How many trials are required for parameter estimation in diffusion modeling? A comparison of different optimization criteria. Behav Res Methods. (2017) 49:513–37. doi: 10.3758/s13428-016-0740-2
46. Donkin C, Brown SD, Heathcote A. The overconstraint of response time models: rethinking the scaling problem. Psychon Bull Rev. (2009) 16:1129–35. doi: 10.3758/PBR.16.6.1129
47. Evans NJ. Assessing the practical differences between model selection methods in inferences about choice response time tasks. Psychon Bull Rev. (2019) 26:1070–98. doi: 10.3758/s13423-018-01563-9
48. Boehm U, Marsman M, Matzke D, Wagenmakers E-J. On the importance of avoiding shortcuts in applying cognitive models to hierarchical data. Behav Res. (2018) 50:1614–31. doi: 10.3758/s13428-018-1054-3
49. Lee MD. How cognitive modeling can benefit from hierarchical Bayesian models. J Math Psychol. (2011) 55:1–7. doi: 10.1016/j.jmp.2010.08.013
50. Turner BM, Sederberg PB, Brown SD, Steyvers M. A method for efficiently sampling from distributions with correlated dimensions. Psychol Methods. (2013) 18(3):368. doi: 10.1037/a0032222
51. Gelman A, Rubin DB. Inference from iterative simulation using multiple sequences. Statist Sci. (1992) 7(4):457–72. doi: 10.1214/ss/1177011136
52. Spiegelhalter DJ, Best NG, Carlin BP, Van Der Linde A. Bayesian Measures of model complexity and fit. J R Stat Soc B: Stat Methodol. (2002) 64:583–639. doi: 10.1111/1467-9868.00353
53. Ando T. Predictive Bayesian model selection. Am J Math Manag Sci. (2011) 31:13–38. doi: 10.1080/01966324.2011.10737798
54. Weigard A, Heathcote A, Matzke D, Huang-Pollock C. Cognitive modeling suggests that attentional failures drive longer stop-signal reaction time estimates in attention deficit/hyperactivity disorder. Clin Psychol Sci. (2019) 7:856–72. doi: 10.1177/2167702619838466
55. Weigard A, Huang-Pollock C, Heathcote A, Hawk L, Schlienz NJ. A cognitive model-based approach to testing mechanistic explanations for neuropsychological decrements during tobacco abstinence. Psychopharmacology. (2018) 235:3115–24. doi: 10.1007/s00213-018-5008-3
56. Ly A, Marsman M, Wagenmakers E. Analytic posteriors for Pearson’s correlation coefficient. Stat Neerl. (2018) 72:4–13. doi: 10.1111/stan.12111
57. Ly A, Boehm U, Heathcote A, Turner BM, Forstmann B, Marsman M, et al. A flexible and efficient hierarchical Bayesian approach to the exploration of individual differences in cognitive-model-based neuroscience. In: Moustafa AA, editor. Computational Models of Brain and Behavior. Wiley (2017). p. 467–79. doi: 10.1002/9781119159193.ch34
58. Marsman M, Maris G, Bechger T, Glas C. What can we learn from plausible values? Psychometrika. (2016) 81:274–89. doi: 10.1007/s11336-016-9497-x
59. JASP Team. JASP (Version 0.12.2) [Computer software]. (2020). Available online at: https://jasp-stats.org (Accessed January 30, 2025).
60. Wagenmakers EJ, Love J, Marsman M, Jamil T, Ly A, Verhagen J, et al. Bayesian Inference for psychology. Part II: example applications with JASP. Psychon Bull Rev. (2018) 25:58–76. doi: 10.3758/s13423-017-1323-7
61. Patrick ME, Miech RA, Johnston LD, O’Malley PM. Monitoring the Future Panel Study Annual Report: National Data on Substance use among Adults Ages 19 to 60, 1976-2022 (PDF). Monitoring the Future Monograph Series. Ann Arbor, MI: Institute for Social Research, University of Michigan (2023). doi: 10.7826/ISR-UM.06.585140.002.07.0002.2023
62. Schubert A-L, Frischkorn G, Hagemann D, Voss A. Trait characteristics of diffusion model parameters. J. Intell. (2016) 4:7. doi: 10.3390/jintelligence4030007
63. Bompas A, Sumner P, Hedge C. Non-decision time: the Higgs Boson of decision. Psychol Rev. (2024). doi: 10.1037/rev0000487
64. Madsen KS, Johansen LB, Thompson WK, Siebner HR, Jernigan TL, Baaré WF. Maturational trajectories of white matter microstructure underlying the right presupplementary motor area reflect individual improvements in motor response cancellation in children and adolescents. NeuroImage. (2020) 220:117105. doi: 10.1016/j.neuroimage.2020.117105
Keywords: cannabis, δ9-tetrahydrocannabinol (THC), neurocognition and behavior, inhibition, Go/no-go, computational psychiatry, young adult, subjective drug effects
Citation: Paige KJ, Weigard AS, Ajilore O, Phan KL, de Wit H, Klumpp H and Crane NA (2025) Acute effects of Δ9-tetrahydrocannabinol on computational measures of neurocognitive processes are related to recent cannabis use among adolescents and young adults. Front. Adolesc. Med. 3:1541068. doi: 10.3389/fradm.2025.1541068
Received: 6 December 2024; Accepted: 10 February 2025;
Published: 4 March 2025.
Edited by:
Joanna Jacobus, University of California, San Diego, United StatesReviewed by:
April C. May, University of California, San Diego, United StatesCopyright: © 2025 Paige, Weigard, Ajilore, Phan, de Wit, Klumpp and Crane. This is an open-access article distributed under the terms of the Creative Commons Attribution License (CC BY). The use, distribution or reproduction in other forums is permitted, provided the original author(s) and the copyright owner(s) are credited and that the original publication in this journal is cited, in accordance with accepted academic practice. No use, distribution or reproduction is permitted which does not comply with these terms.
*Correspondence: K. J. Paige, a2pwYWlnZUBtZWQudW1pY2guZWR1
Disclaimer: All claims expressed in this article are solely those of the authors and do not necessarily represent those of their affiliated organizations, or those of the publisher, the editors and the reviewers. Any product that may be evaluated in this article or claim that may be made by its manufacturer is not guaranteed or endorsed by the publisher.
Research integrity at Frontiers
Learn more about the work of our research integrity team to safeguard the quality of each article we publish.