
94% of researchers rate our articles as excellent or good
Learn more about the work of our research integrity team to safeguard the quality of each article we publish.
Find out more
ORIGINAL RESEARCH article
Front. Vet. Sci. , 27 March 2023
Sec. Veterinary clinical, anatomical, and comparative pathology
Volume 10 - 2023 | https://doi.org/10.3389/fvets.2023.1148849
 Melanie Werner1,2
 Jasmin Weeger1Lina Hörner-Schmid1
 Karin Weber1Jelena Palić3
 Jonathan Shih4
 Jan S. Suchodolski4
 Rachel Pilla4Bianka Schulz1*
Objectives: While feline chronic bronchitis (CB) is known as neutrophilic bronchial inflammation (NI), feline asthma (FA) is defined as an eosinophilic airway inflammation (EI). Feline chronic bronchial disease refers to both syndromes, with similar clinical presentations and applied treatment strategies. Recent studies described alterations of the microbiota composition in cats with FA, but little is known about the comparison of the lung microbiota between different types of feline bronchial disease. The study aimed to describe the bacterial microbiota of the lower respiratory tracts of cats with FA and CB and to identify potential differences.
Methods: Twenty-two client-owned cats with FA (n = 15) or CB (n = 7) confirmed via bronchoalveolar-lavage (BALF)-cytology were included. Next-generation sequencing analysis of 16S rRNA genes was performed on bacterial DNA derived from BALF samples. QIIME was used to compare microbial composition and diversity between groups.
Results: Evenness and alpha-diversity-indices did not significantly differ between cats with FA and CB (Shannon p = 0.084, Chao 1 p = 0.698, observed ASVs p = 0.944). Based on a PERMANOVA analysis, no significant differences were observed in microbial composition between animals of both groups (Bray-Curtis metric, R-value 0.086, p = 0.785; unweighted UniFrac metric, R-value −0.089, p = 0.799; weighted Unifrac metric, R-value −0.072, p = 0.823). Regarding taxonomic composition, significant differences were detected for Actinobacteria on the phylum level (p = 0.026), Mycoplasma spp. (p = 0.048), and Acinetobacteria (p = 0.049) on the genus level between cats with FA and CB, with generally strong interindividual differences seen. There was a significant difference in the duration of clinical signs before diagnosis in animals dominated by Bacteriodetes (median 12 months, range 2–58 months) compared to animals dominated by Proteobacteria (median 1 month, range 1 day to 18 months; p = 0.003).
Conclusions and relevance: Lung microbiota composition is very similar in cat populations with spontaneous FA and CB besides small differences in some bacterial groups. However, with disease progression, the lung microbiome of cats with both diseases appears to shift away from dominantly Proteobacteria to a pattern more dominated by Bacteriodetes. A substantial proportion of cats tested positive for Mycoplasma spp. via sequencing, while none of them tested positive using classical PCR.
Feline asthma (FA) is considered a type-I allergic hypersensitivity reaction characterized by eosinophilic inflammation (EI), bronchial hyperreactivity, reversible airway obstruction, increased mucus production, bronchial wall edema, and smooth muscle hypertrophy (1–4). The hallmarks of feline chronic bronchitis (CB) are neutrophilic inflammation (NI) of the airways with local edema formation, hypertrophy of the mucosa and goblet cells, and increased mucus production (3, 5, 6). Both syndromes are often grouped under the umbrella term “feline chronic bronchial disease.” Approximately 1% of the cat population has been reported to be affected by these diseases (7, 8). While the clinical picture of FA has been further studied in recent years, also by establishing allergen-induced models in cats to investigate etiology, diagnostic parameters, and therapeutic options, CB in the cat has hardly been studied and the etiology is still unexplained (9–11). Preceding respiratory infections or changes in the microbial composition of the lung are discussed in humans with CB (12–18). Cats with FA appear to be younger than those with CB, and Siamese cats appear to be overrepresented in some studies, suggesting a genetic predisposition (19–22). There seems to be little difference in clinical presentation between the two conditions (8). Clinical presentation can range from mild clinical signs such as exercise intolerance, tachypnea, and cough to life-threatening dyspnea (20, 21, 23). The classic diagnostic workup of both conditions includes laboratory and radiographic examination, and bacteriological and cytological evaluation of bronchoalveolar-lavage-fluid (BALF) (6, 14, 20, 21, 23–25). In cats with chronic respiratory signs, an increased percentage (>7%) of neutrophils in BALF cytology with physiologic eosinophilic content is suggestive of CB, whereas an increased proportion of eosinophils (>18%) in BALF is considered typical for FA (6, 26). Secondary bacterial infections should be excluded by bacteriological examination in combination with PCR for Mycoplasma spp. (27–29). The healthy feline lung has traditionally been considered sterile for a long time. However, the respiratory tract is in constant contact with air from the environment, which inevitably leads to microbial colonization (30, 31). The warm and moist environment of the bronchial tubes and bronchioles provides an environment that allows the establishment of a physiological lung microbiome. The composition of the microbiota in the lower respiratory tract is thought to be determined by the balance of three factors: first, microbial immigration into the respiratory tract; second, elimination of microbes from the respiratory tract; and third, the relative rate of proliferation of each bacterial group, which is determined by regional growth conditions (32). These factors can all be influenced by various processes. However, culture-based detection methods cannot adequately capture the totality of microorganisms found in the respiratory tract (20, 26). Culture-independent methods, such as sequencing techniques, have the advantage of identifying microorganisms that cannot be cultured and are harbored in small proportions (33). The totality of lung microorganisms (including bacteria) evaluated by these methods is defined as the lung microbiome. In human medicine numerous studies have shown that the lung microbiome differs significantly between diseased and healthy individuals (14, 18, 32–36). The lung microbiome may not only influence individual susceptibility for development of respiratory disorders, but may also have an impact on disease progression as well as response to treatment (37). Recently, veterinary studies described alterations of the microbiota composition in cats with spontaneous and induced asthma compared to healthy individuals (31, 38).
Currently, no study is available evaluating the differences in the lung microbiome between cats with FA and CB. The aim of this study was to describe the composition of the bacterial microbiota of the lower respiratory tract of a cat population with FA and CB in more detail and to identify potential differences.
The study was approved by the Ethics Committee of the Faculty of Veterinary Medicine, Ludwig-Maximilian-University (Number: 119-09-04-2018). Cat owners were informed about the study in advance, and written informed consent was signed by each owner before participation in the study.
This was a prospective observational study, performed between 2018 and 2020. Client-owned cats that were presented to the Clinic of Small Animal Medicine for respiratory signs and received further diagnostic testing including BALF-sampling were eligible for inclusion into the study. Clinical signs considered suggestive for feline chronic bronchial disease included cough, dyspnea, and abnormal breath sounds like wheezing. Cats of any age, sex, and breed were included. Cats were excluded, if they had received glucocorticoids or antibiotics within the last 4 weeks. Chest radiographs were performed in all cats to evaluate lung pattern and to exclude patients with evidence of neoplasia, pneumonia, heart disease, and foreign bodies as causes of respiratory problems. A complete blood count with differentiation and a serum chemistry profile were performed in all cats. Fecal samples from all cats with access to the outdoors were analyzed using the Baermann technique to rule out lung worm infection.
A diagnosis of FA or CB was established by evaluation of BALF cytology. For BALF sample collection, cats were placed under general anesthesia and intubated with a sterile 3.5–4 French endotracheal tube. One to two aliquots of body-warm sterile sodium chloride solution of 3–4 ml (Isotonic saline solution, 0.9%; B Braun Vet Care, Germany) were blindly applied over a sterile polyvinyl catheter (CH 4.5, 1.0 × 1.5; B Braun Vet Care, Germany) that was advanced into the bronchial tree until resistance, then fluid was immediately aspirated back using mechanical suction. BALF was used to prepare slides for cytological examination, and Mycoplasma-spp.-PCR and bacteriological examination were performed in all cases. Cats were excluded, if BALF-cytology, Mycoplasma-spp.-PCR or bacterial culture indicated bacterial infection or if there was evidence of oropharyngeal contamination with squamous cells or Simonsiella spp. bacteria on cytology.
For cytological evaluation, both direct and cytocentrifuged smears were prepared (Hettich ROTOFIX 32A, Tuttlingen, Germany, 5 min at 95 g). The slides were stained with modified Wright's stain after air drying. To assess the type of inflammation, two cytospin preparations and at least two direct smears were assessed. Multiple fields on each slide were evaluated, and differential count was performed on the cytospin preparation that appeared more representative. All slides were evaluated by the same board-certified clinical pathologist, and a differential count of 100 cells was performed on each of several fields. A cutoff value of >20% eosinophils was used to support the diagnosis of FA. Values of >14% neutrophils and < 20% eosinophils were used to establish a diagnosis of CB.
Three to four milliliter of BAL was further processed within 1. Fifteen microgram acetylcysteine (200 mg/ml) was added as previously described (39), and the liquid was centrifuged at 10,000 g for 10 min. The supernatant was discarded. The pellet was subsequently frozen at −0°C until further use. The pellet was then resuspended in 800 μl lysis buffer (4% Natriumdodecylsulfat, 50 mM EDTA, 500 mM NaCL, 50 mM EDTA, 50 mM Tris-HCl). After incubation at 70°C for 20 min with periodic vortexing, all samples were centrifuged for 5 min at 5,000 g. After adding 200 μl of 10 m Mammoniumacetate to the supernatants, samples were incubated on ice for 5 min, followed by centrifugation at 5,000 g for 15 min at room temperature. One volume of chilled isopropanol was added to the supernatant in a new Eppendorf tube. We incubated the samples at 4°C for 30 min on ice and then centrifuged them at 16,000 g for 15 min. After washing with 70% ethanol, DNA pellets were resuspended in 150 μl of TrisEDTA (10 mM Tris and 1 mM EDTA), followed by 15 μl of proteinase K and 200 μl of ALBuffer (DNeasy Blood and Tissue kits, Qiagen). After the samples had been incubated for 10 min at 70°C, 200 μL of 100% ethanol was added to the tubes. Following the mixing of samples by gentle pipetting, the contents were transferred to a spin column using the DNeasy kit. DNA was purified according to the manufacturer's instructions and eluted in 200 μl of EBbuffer. Using fluorometry (Qubit dsDNA BR assay, Life Technologies, Carlsbad, CA), DNA concentrations were measured, and samples were stored at 80°C and sent on dry ice to Texas A&M University Gastrointestinal Laboratory for sequencing.
The V4 region of the 16S rRNA gene was sequenced at MR DNA laboratory (Shallowater, TX) using primers 515F (5′-GTGYCAGCMGCCGCGGTAA) (40) to 806RB (5′-GGACTACNVGGGTWTCTAAT) (41). Briefly, amplification was performed under the following conditions: 95°C for 5 min, followed by 30 cycles of 95°C for 30 s, 53°C for 40 s and 72°C for 1 min, and a final elongation step at 72°C for 10 min. After amplification, PCR products were checked in 2% agarose gel, and samples were multiplexed using unique dual indices and pooled together in equal proportions based on their molecular weight and DNA concentrations. Pooled samples were purified using calibrated Ampure XP beads and an Illumina DNA library was prepared. Sequencing was performed on a MiSeq following the manufacturer's guidelines. Raw sequences were deposited at the NCBI Sequence Read Archive under project number PRJNA916730.
Using QIIME 2 (Quantitative Insights Into Microbial Ecology 2) v 2019.7 (42), the sequences were processed and analyzed. DADA2 was used to create the amplicon sequence variant (ASV) table after the sequences were demultiplexed (43). Sequences containing < 0.01% of the total reads and assigned as chloroplasts, mitochondria, and low abundance ASVs were removed prior to downstream analysis. Prevalence-based filtering of putative contaminant ASVs was performed by the R package decontam (v0.99.1) (44). A DNA extraction blank was generated contemporaneously and processed in parallel with biological samples as a negative control. ASV tables were used as the input for the Contaminant() function (pss, method = “prevalence,” neg = “is.neg,” threshold = 0.5). Ggplot2 was used to visualize the contaminants generated and contaminants were filtered from the ASV table for further analysis. All samples were then rarefied to even sequencing depth, based on the lowest read depth of samples, to 646 sequences per sample.
QIIME2 was used to evaluate alpha diversity using Chao1 (richness), Shannon diversity, and observed ASVs metrics. Beta diversity was estimated using Bray-Curtis, Jaccard, and unweighted and weighted UniFrac distance matrices, and Principal Coordinate Analysis (PCoA) plots were generated in QIIME2 (45).
Statistical analysis was performed using Graph Pad Prism version 9 (Prism v.9, Graphpad Software Inc, La Jolla, California, US). All numerical data were tested for normality using the Shapiro-Wilk-test, and further tests were performed depending on whether they were normally distributed or not. Numerical data are shown as median and range. Age differences between groups were examined with an unpaired T-test. Binominal data (sex, occurrence of clinical signs) were evaluated with Fisher's-exact-test. The alpha and beta diversity metrics were computed using Qiime2. Alpha diversity indices (Observed ASVs, Shannon, Chao1) were calculated for each sample.
Comparison of alpha diversity indices (Chao1, Shannon's Diversity, and Observed ASVs) between the two groups FA and CB was performed dependent on normal distribution using unpaired t-test or Mann-Whitney-test and compared with each other. To identify compositional differences (beta diversity) in the microbiome between and within study groups, similarity analysis (ANOSIM) was conducted using the PRIMER 7 statistical software package (PRIMER-E Ltd., Lutton, UK), and PERMANOVA was carried out using QIIME2 based on Bray-Curtis metric, Jaccard metric, and the unweighted and weighted UniFrac distance matrices. The Shapiro-Wilk-test was used to assess the normality of individual bacterial abundances. The taxonomic analysis of paired samples was conducted using a 2-way RMANOVA-test. The Benjamin & Hochberg-method was used to adjust p-values for multiple comparisons at each taxonomic level. Significance was set at P < 0.05.
Twenty-two cats were included in the study. There were 15 cats in the FA group and seven cats in the CB group. Median age of all cats was 3.0 years (range 0.5–14.0). Eight cats were female neutered, one female, 13 male neutered. The population included 10 domestic shorthair cats, four Abyssinian, two Siamese, one Ragdoll, one Norwegian forest cat, one British shorthair, one Bengal, one Maine Coon, and one Turkish Van. Table 1 shows the distribution of these parameters between the two groups. Regarding the population parameters, there were no significant differences between the groups. Table 2 shows the primary clinical signs of the cats, the duration of the disease prior to presentation, results of BALF-cytology, and final diagnosis.
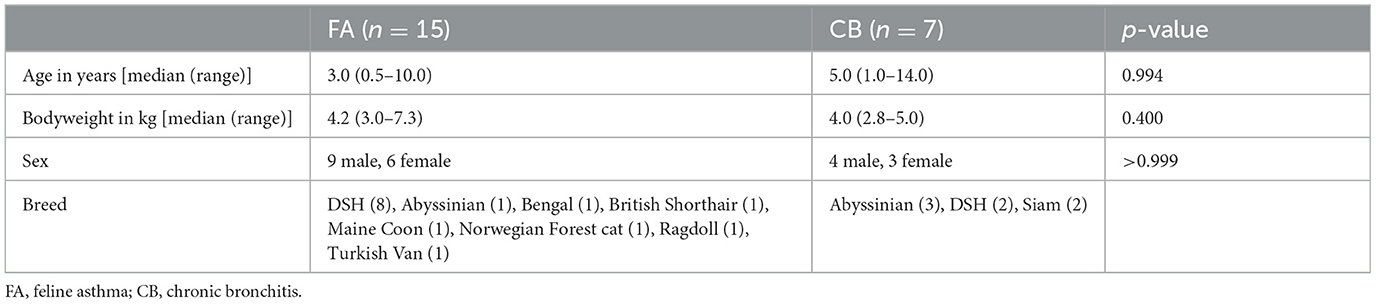
Table 1. Baseline parameters in cats with chronic bronchial disease.
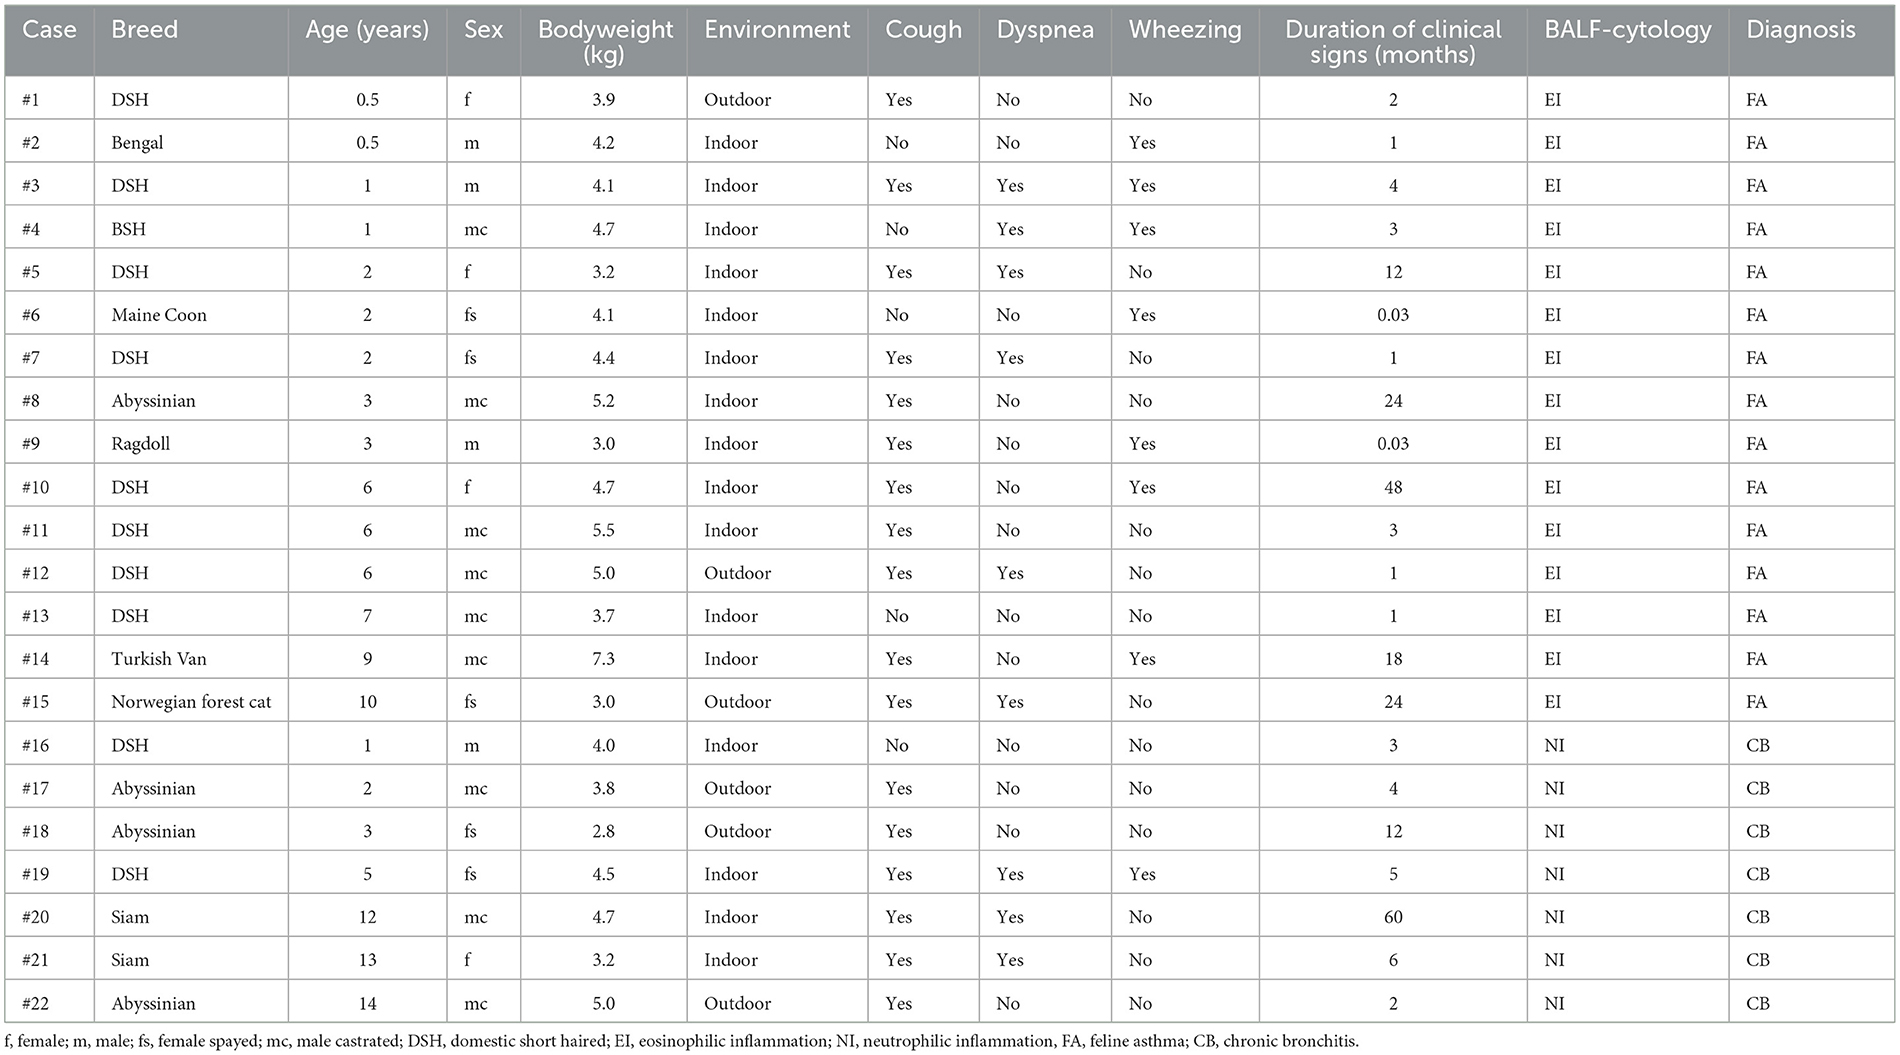
Table 2. Demographic data, clinical signs, BALF-cytology and final diagnosis of cats with chronic bronchial disease.
In the FA group, the Shannon diversity index median was 4.34 (range: 3.08–6.63), the Chao1 index median was 38 (range: 16.00–173.33), and the observed ASVs median was 37 (range: 16–62). In the CB group, Shannon diversity index median was 3.64 (range: 3.12–4.06), the Chao1 index median was 45.0 (range: 17.0–89.5), and the observed ASVs median was 36 (range: 17–79). Alpha diversity indices and evenness were not significantly different between cats in both groups (Shannon p = 0.084, Chao 1 p = 0.698, observed ASVs p = 0.944; Figure 1). Principal component analysis (PcoA) was utilized to evaluate the beta diversity of the bacterial populations. With the different methods used to determine beta diversity no significant differences in microbiota composition between animals in the FA and CB group on the basis of a PERMANOVA analysis (Bray-Curtis metric, R-value −0.086, p = 0.785; unweighted UniFrac metric, R-value −0.089, p = 0.799; weighted Unifrac metric R-value −0.072, p = 0.823) could be shown. Figure 2 shows the PcoA plots using an unweighted and weighted Unifrac analysis, the Bray-Curtis, and the Jaccard method, respectively. No clustering of cats with CB compared to the FA group can be seen in the graphs.
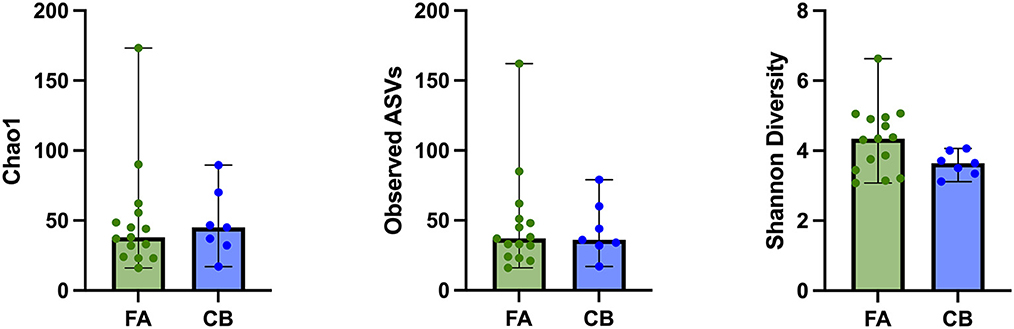
Figure 1. Alpha diversity indices of cats with feline asthma (FA; green dots) and chronic bronchitis (CB; blue dots). Alpha Diversity indices showed no significant difference between cats in the FA and CB group. Median is represented by the upper limit of the colored boxes, range is represented by the upper and lower thin lines.
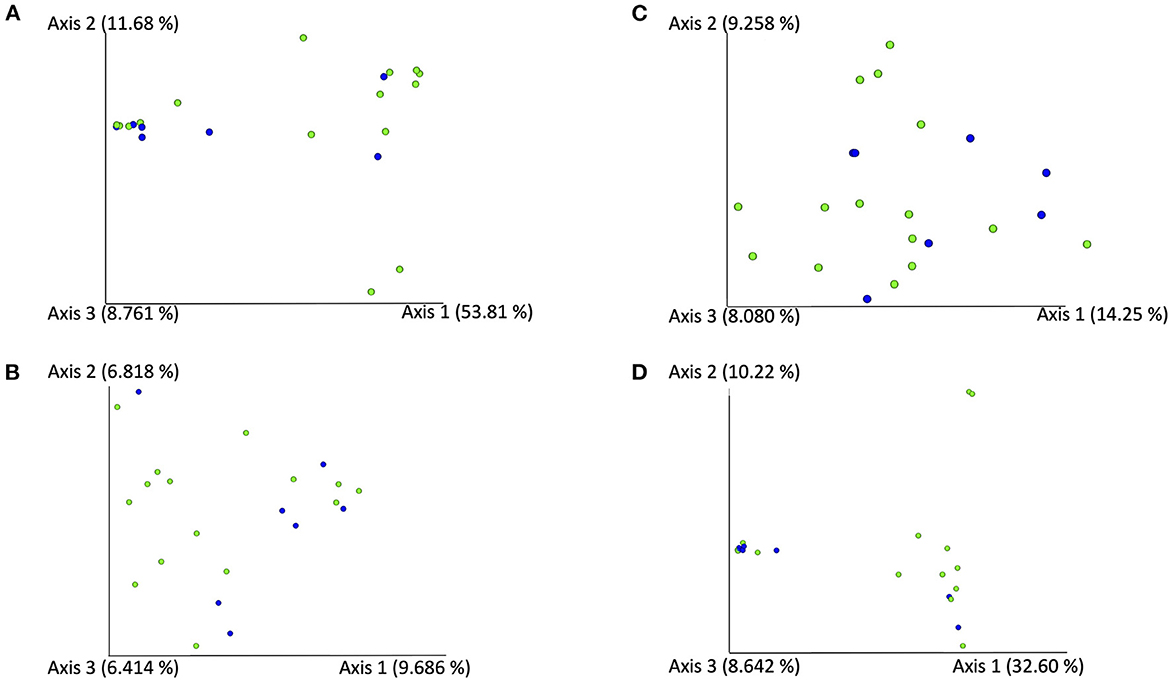
Figure 2. PCoA-Plots [using an unweighted (A) and weighted (B) Unifrac analysis using the Bray-Curtis (C), and the Jaccard method (D)] of BALF-samples of cats with feline asthma (green dots) and chronic bronchitis (blue dots).
Figure 3 shows the relative composition of the microbiota of all patients on the phylum, class, and order level. At the phylum level, Bacteroidetes, Proteobacteria, Firmicutes, and Actinobacteria dominated in all cats. At the phylum level, significant differences emerged only for the phylum Actinobacteria between the cats with FA and CB. Generally, strong interindividual differences were seen. With 2.29%, the median percentage of Actinobacteria was significantly higher in the FA (range 0.05–36.52%) compared to the CB group with 0.3% (range 0–4.58%) (p = 0.026) (Figure 4).
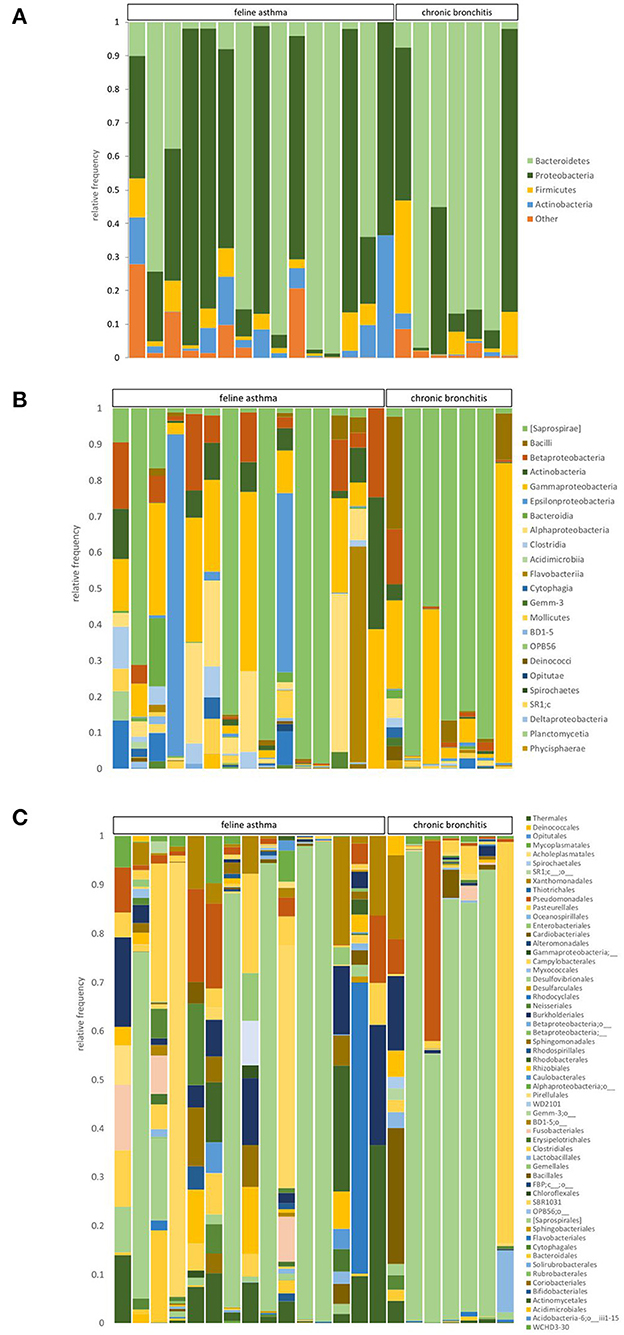
Figure 3. Relative abundance of taxa present in BALF samples of cats with feline asthma and chronic bronchitis on a phylum (A), class (B), and order (C) level.
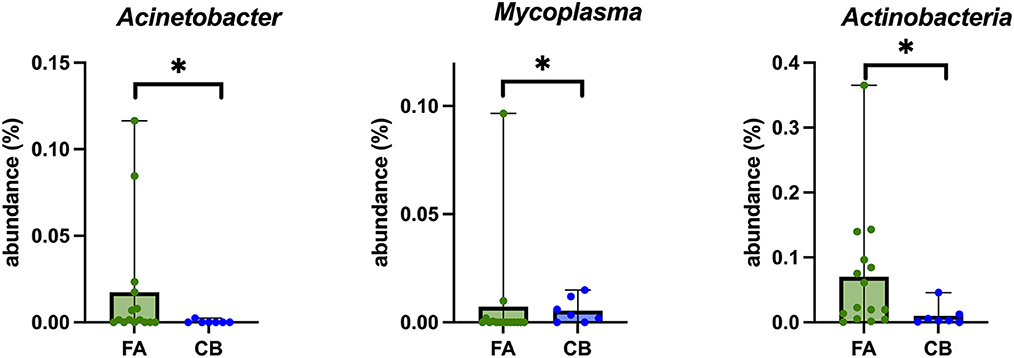
Figure 4. Box plots of bacterial taxonomic groups that were significantly different in BALF-samples of cats with feline asthma (FA; green dots) and chronic bronchitis (CB; blue dots). Median is represented by the upper limit of the colored boxes, range is represented by the upper and lower thin lines. *p < 0.05.
At the class level, the groups Saprospirae, Gammaproteobacteria, Alphaproteobacteria, and Epsilonproteobacteria were found to be the dominant groups. There were no significant differences between the FA and CB group regarding the dominant class groups. At the taxonomic level of order, the dominant orders were Saprospirales, Pasteurellales, Campylobacteriales, and Pseudomonadales. There was no significant difference between the two groups regarding the dominant orders. At the family level, the most abundant families in both cat populations were Chitinophagaceae, Pasteurellaceae, Helicobacteriaceae, and Xanthomonadaceae. There were also no significant differences between both groups. Regarding the taxonomic level of genus, the groups belonging to unclassified Chitinophagaceae, unclassified Pasteurellaceae, unclassified Helicobacteriaceae, and the genus Stenotrophomonas were frequently represented. Relative abundances of the four most prevalent taxa in the phylum, class, order, family, and genus level can be found in Table 3.
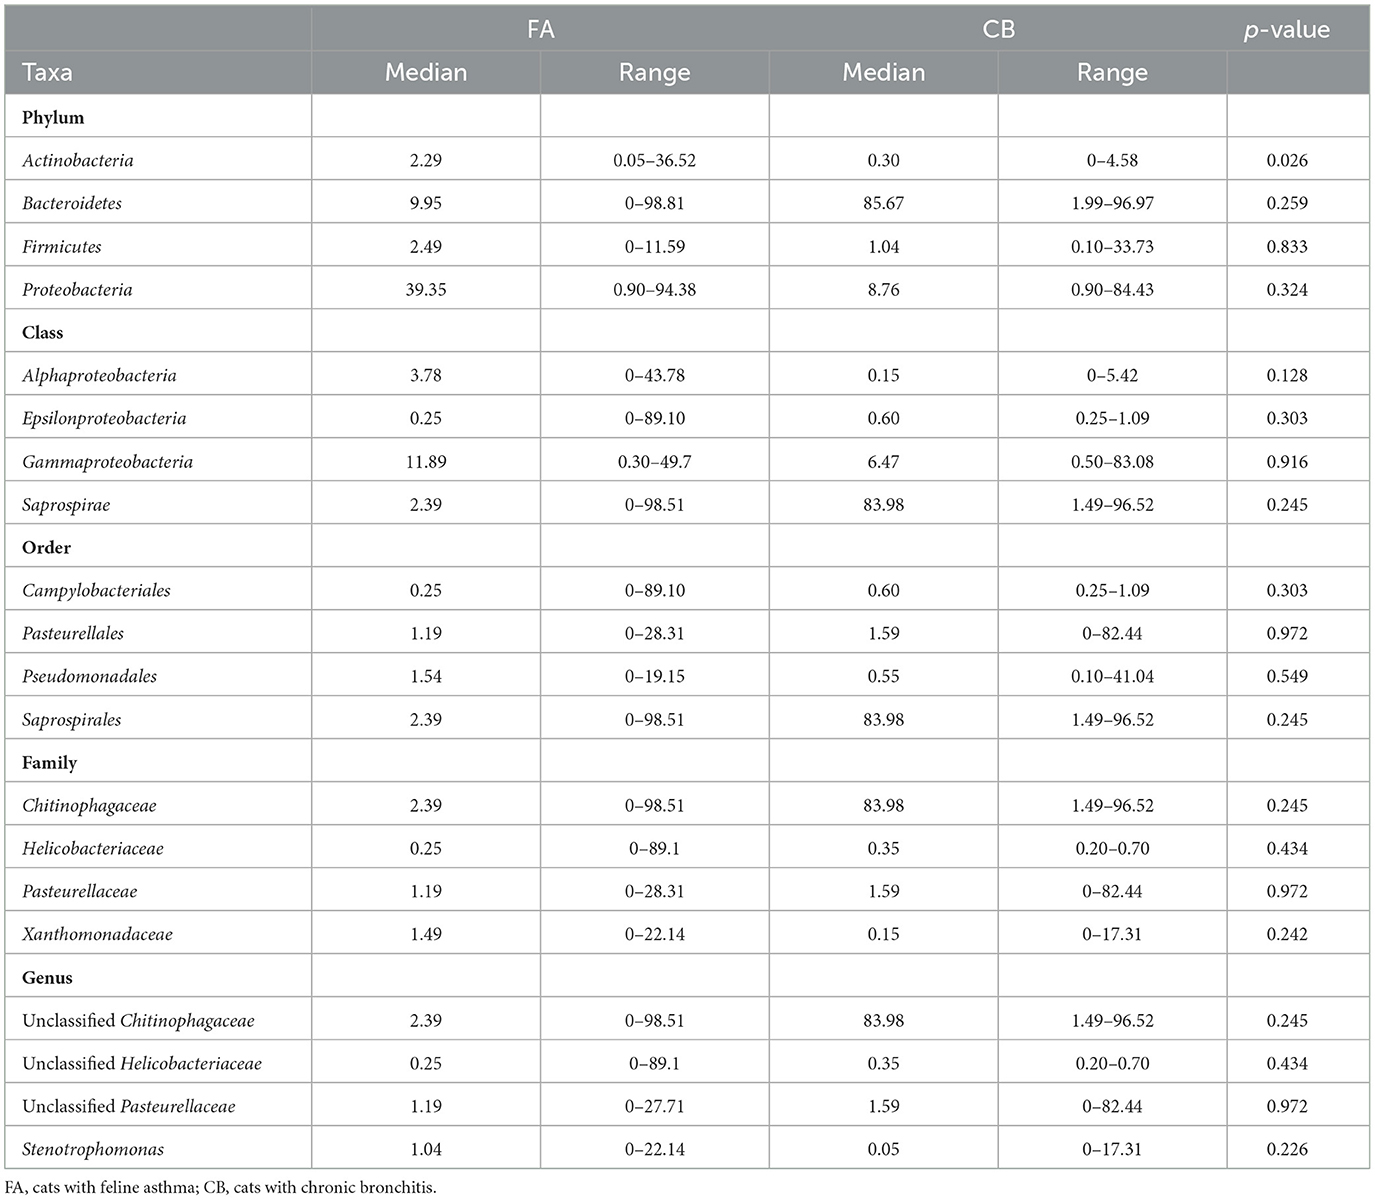
Table 3. Relative abundance (expressed in percentage) of the four most prevalent taxa at the levels phylum, class, order, family, and genus in cats with chronic bronchial disease.
There were significant differences between both groups for the genus Mycoplasma (p = 0.048), with a significantly higher proportion in the FA group (median 0%; range 0–9.65%) compared to the CB group (median 0.35%; range 0–1.49%) (Figure 4). However, this higher proportion could be explained by the fact that two cats in the FA group carried both a high proportion of Mycoplasma. In general, Mycoplasma spp. could be detected in 9/22 (40.9%) cats, in 4/15 cats (26.6%) with FA, and in 5/7 (71.4%) cats with CB. In addition, Acinetobacter spp. was also found in a significantly higher proportion in the FA group (median 0.15%; range 0–11.64%) compared to the CB group (median 0%; range 0–0.25%; p = 0.049) (Figure 4).
A clear separation was evident between cats that, regardless of the type of pulmonary inflammation, showed a predominance of Proteobacteria (11/22; 50%; 9/11 FA, 2/11 CB) or Bacteriodetes (11/22; 50%; 6/11 FA, 5/11 CB) as the main component of the microbiota composition at the phylum level. Therefore, data of the cats of these subgroups were investigated in terms of age, body weight, duration of clinical signs before presentation, and clinical signs. It was found that animals dominated by Bacteriodetes had significantly longer duration of clinical signs before presentation (median 12 months, range 2–58 months) compared to animals dominated by Proteobacteria (median 1 month, range 1 day to 18 months; p = 0.003) (Figure 5). In addition, the animals with a Bacteriodetes predominance showed cough as clinical sign significantly more often (11/11 cats) compared to cats with predominance of Proteobacteria (6/11 cats; p = 0.035). Regarding the other clinical signs and phenotypic data, there were no significant differences between the groups (data not shown).
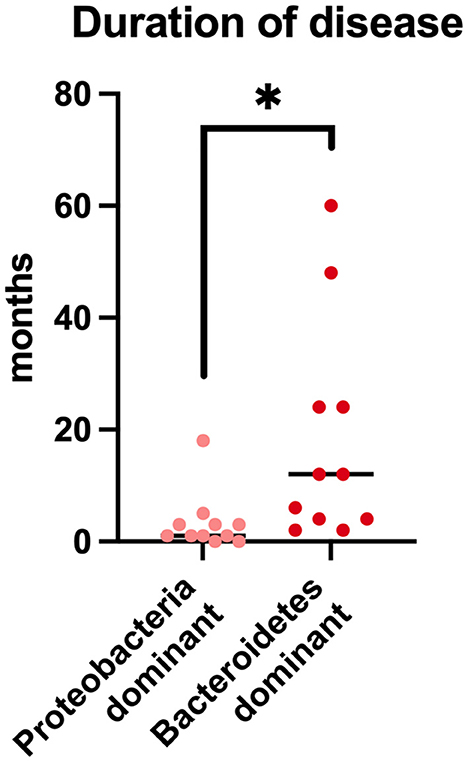
Figure 5. Duration of disease prior to presentation in cats with chronic bronchial disease and predominantly Protebacteria in BALF-samples in comparison to cats with predominantly Bacteriodetes in BALF-samples. *p < 0.05.
The present study is the first to compare the composition of the lung microbiome in cats with FA and CB. No significant differences could be detected in the diversity, richness, and evenness of the lung microbiota between the two disease groups. However, there were differences in the composition of individual bacterial groups that are described here for the first time.
The client-owned cat population included in this study appeared to be relatively young, with a median age of 3 years, and included more pedigreed than domestic shorthair cats. Animals in the FA group were slightly younger than animals in the CB group, although this was not significant. This distribution pattern is consistent with findings in other studies in which cats with FA were also slightly younger (19–21). In one study, healthy young cats were shown to have a stronger respiratory response to triggering agents compared with older animals, which may explain the occurrence of FA at a young age (19). Regarding the duration of the disease, there was no difference between the two groups. Besides that, the distribution of clinical signs was also similar between cats with FA and CB. This finding is in line with other publications and underlines that FA and CB are disorders that cannot be distinguished based on clinical signs (25). Moreover, hypotheses have been discussed, that both disorders might be two presentations of one disease complex (46).
In humans, alterations of the microbiota in various respiratory diseases, such as asthma, have been investigated, but results are still limited (13–15, 17, 47–49). In veterinary medicine, few studies have been focusing on the respiratory microbiome (31, 38, 50). Cats with FA are unique in the animal world, because they are the only known species to suffer from eosinophilic obstructive airway disease analogous to humans (51). The composition of the lung microbiota is thought to be based on the immigration of bacteria mainly by subclinical microaspiration from the airways, although other sources, including inhaled air and aspiration of gastric contents, may also make a small contribution. The clearance of members of the lung microbiota then depends, in turn, on the presence and effectiveness of many host-specific factors, including cough reflex, mucociliary clearance, and innate and adaptive immunity (52).
In the present study population, Bacteroidetes and Proteobacteria were the most abundant components at the phylum level. There was no difference in the proportional distribution of these groups between animals of the FA and the CB group. In humans, it is well-known that a healthy lung microbiome consists mainly of Bacteroidetes, and that a shift has been observed in human asthma, leading to a dominance of Proteobacteria in this disease in contrast to healthy individuals (47).
In two recently published veterinary studies, cats with experimentally induced and spontaneous FA were studied, and the lung microbiome was evaluated by 16S rRNA sequencing (31, 38). Cats with FA induced by Bermuda grass allergen were evaluated 6 and 36 weeks after induction. The lung microbiome was found to be significantly decreased in richness and beta diversity compared to findings before induction of the allergic response, which was more pronounced after 36 weeks. Thus, this study demonstrates that the lung microbiome appears to change progressively in cats with FA over time. Taxonomically, the number of cats carrying predominantly Proteobacteria or Bacteriodetes changed as well with an increase of Bacteriodetes and a decrease of Proteobacteria with increasing chronicity of the disease. In our study, regardless of the type of pulmonary inflammation, it was clearly evident that cats with a predominance of Bacteriodetes had been symptomatic for significantly longer periods of time compared to cats in which Proteobacteria were dominating. Thus, a change in the lung microbiota in a chronic disease process can be quite well-supported by our data. In addition, all cats with a dominant Bacteriodetes colonization showed cough, whereas cats in the group with a dominance of Proteobacteria frequently (45% of cases) showed no cough, but wheezing, acute dyspnea and other clinical signs. This finding could be an indication of the chronicity and severity of the disease in cats with an altered microbiome. In another recently published study, the lung microbiome of cats with spontaneous FA was evaluated in comparison to a healthy control group. This investigation also revealed a significant change in the microbiome of diseased compared to healthy cats. While healthy cats were dominated by the phylum Proteobacteria, Bacteroidetes predominated in asthmatic patients. Results of this study in accordance with data generated in the present study indicate that an evolution of the microbiota with a shift from the phylum Proteobacteria to Bacteriodetes can be interpreted as an abnormal change of the microbiome associated with progression of disease. In addition, the healthy control population of the cited study showed a microbiome dominated by Proteobacteria in all included healthy cats which was different from the more diverse composition of the microbiome of the present study in which partly Proteobacteria and partly Bacteriodetes dominated. In addition, the phylum Proteobacteria in the cited healthy control group appeared to consist mainly of Pseudomonaceae. This is quite contrary to the composition of this phylum in the present study where the composition is more diverse and not dominantly composed of Pseudomonaceae. From various studies investigating human and animal microbiota, it is known that changes in the microbiota can be a continuous process with a timely progression. Further studies would be desirable to evaluate whether early therapeutic intervention can help to restore normal lung microbiota. In addition, it would be interesting to evaluate the clinical response of cats with respiratory disease, depending on the lung microbiota composition. At present, it remains unclear, if changes of the airway microbiome might have an impact on clinical response of cats.
It was an interesting finding that Mycoplasma spp. was found in 41% of cats with chronic bronchial disease by 16S rRNA gene sequencing, whereas all cats had previously been tested negative by a targeted PCR method. In contrast, in culture, PCR, or microbiota analysis in healthy cats Mycoplasma spp. could not been detected in the lower airways (43, 47). Human infections with Mycoplasma have been shown to contribute to the development of chronic airway signs, exacerbate clinical signs, and complicate the management of asthmatic patients (53). Successful treatment of the infection has improved pulmonary function in asthmatic patients and resulted in an improved quality of life. It has been estimated that the prevalence of Mycoplasma in cats suffering from FA and CB can be up to 35% with culture dependent methods (39). Using sequencing methods, Mycoplasma spp. could be detected in 35% of cats with naturally occurring FA (38). Since Mycoplasma spp. is not considered a commensal symbiont of the lower airways, it must be assumed that in cats with inflammatory bronchial disease Mycoplasma spp. either have the ability to invade the lower airways by spreading from the upper airways in order to take advantage of an altered microbiota, or it may have been introduced into the lower airways by extension from the upper respiratory tract (32). Testing for Mycoplasma spp. in cats with asthma or CB is recommended due to the links between Mycoplasma spp. detection and asthma in humans and the high prevalence of Mycoplasma spp. in this and other studies. So far it is unknown, if targeted antimicrobial therapy against Mycoplasma spp. or other bacterial species might be beneficial in improving clinical outcomes in cats with chronic bronchial disease.
The study has several limitations. The most significant limitation is the fact that no healthy control group was included for comparison for ethical reasons. Evaluation and comparison of the results were only performed between the two diseased cat populations and compared to results derived from healthy cats described in other publications. Nevertheless, the authors are aware of the fact that that a comparison of results to data generated with a different sequencing set also has limitations.
Only cats without any antimicrobial treatment in the last 4 weeks prior to presentation were included. However, some cats had been treated with antibiotics in the months before. As known from studies in other organ systems, antimicrobial treatment can lead to a significant change in the microbiota of the individual, even when treatment had been given longer than 4 weeks ago. Accordingly, it cannot be excluded that a certain individual microbial composition could have been caused by pretreatments. Furthermore, the group size was small, especially in the CB group. Larger patient populations would be desirable in the future to reevaluate the findings.
Cat populations with spontaneous FA have the same lung microbiota composition as those with spontaneous CB. Evidence exists that the microbial composition changes with the duration of the disease. Compared to the classical PCR-based detection methods, sequencng methods have been found to be more effective in identifying Mycoplasma spp. as a microbial compotent.
The datasets presented in this study can be found in online repositories. The names of the repository/repositories and accession number(s) can be found below: https://www.ncbi.nlm.nih.gov/, PRJNA916730.
The animal study was reviewed and approved by the Ethics Committee of the Faculty of Veterinary Medicine, Ludwig-Maximilian-University (Number: 119-09-04-2018). Written informed consent was obtained from the owners for the participation of their animals in this study.
MW contributed to study design, study analysis and statistical analysis, and wrote the manuscript. JW, LH-S, and KW contributed to the study design, sample collection, and revision of the manuscript. JP contributed to study design, cytology of BALF-samples, and revision of the manuscript. JSh, JSu, and RP contributed to sample analysis, statistical analysis, and revision of the manuscript. BS contributed to study design, sample collection, study analysis, and revision of the manuscript. All authors contributed to the article and approved the submitted version.
JP was employed by Vet Med Labor GmbH, Division of IDEXX Laboratories.
The remaining authors declare that the research was conducted in the absence of any commercial or financial relationships that could be construed as a potential conflict of interest.
All claims expressed in this article are solely those of the authors and do not necessarily represent those of their affiliated organizations, or those of the publisher, the editors and the reviewers. Any product that may be evaluated in this article, or claim that may be made by its manufacturer, is not guaranteed or endorsed by the publisher.
1. Garrity S, Lee-Fowler T, Reinero C. Feline asthma and heartworm disease: clinical features, diagnostics and therapeutics. J Feline Med Surg. (2019) 21:825–34. doi: 10.1177/1098612X18823348
2. Grotheer M, Schulz B. Felines Asthma und chronische Bronchitis – Übersicht zu Diagnostik und Therapie. Tierärztl Prax Ausg K Kleintiere Heimtiere. (2019) 47:175–87. doi: 10.1055/a-0917-6245
3. Grotheer M, Hirschberger J, Hartmann K, Castelletti N, Schulz B. Comparison of signalment, clinical, laboratory and radiographic parameters in cats with feline asthma and chronic bronchitis. J Feline Med Surg. (2020) 22:649–55. doi: 10.1177/1098612X19872428
4. van Eeden ME, Vientós-Plotts AI, Cohn LA, Reinero CR. Serum allergen-specific IgE reactivity: is there an association with clinical severity and airway eosinophilia in asthmatic cats? J Feline Med Surg. (2020) 22:1129–36. doi: 10.1177/1098612X20907178
5. Williams K, Downing R, Ward E. Chronic Bronchitis and Asthma in Cats. St Louis, MO, USA: Saunders (2009) p. 650–8.
6. Nafe LA, DeClue AE, Lee-Fowler TM, Eberhardt JM, Reinero CR. Evaluation of biomarkers in bronchoalveolar lavage fluid for discrimination between asthma and chronic bronchitis in cats. Am J Vet Res. (2010) 71:583–91. doi: 10.2460/ajvr.71.5.583
7. Bay JD, Johnson LR. Feline Bronchial Disease/Asthma. Philadelphia, PA; St. Louis, MI: Mosby; Saunders (2004) p. 388–96. doi: 10.1016/B978-0-7216-8706-3.50057-8
8. Padrid P. Chronic bronchitis and asthma in cats. In: Bonagura JD, Twedt D, editors. Kirk's Current Veterinary Therapy XIV. St Louis, MO: Saunders (2009). p. 650–8
9. Moriello KA, Stepien RL, Henik RA, Wenholz LJ. Pilot study: prevalence of positive aeroallergen reactions in 10 cats with small-airway disease without concurrent skin disease. Vet Dermatol. (2007) 18:94–100. doi: 10.1111/j.1365-3164.2007.00573.x
10. Reinero CR, DeClue AE, Rabinowitz P. Asthma in humans and cats: is there a common sensitivity to aeroallegens in shared environments? Environ Res. (2009) 109:634–40. doi: 10.1016/j.envres.2009.02.001
11. Norris Reinero CR, Decile KC, Berghaus RD, Williams KJ, Leutenegger CM, Walby WF, et al. An experimental model of allergic asthma in cats sensitized to house dust mite or bermuda grass allergen. Int Arch Allergy Immunol. (2004) 135:117–31. doi: 10.1159/000080654
12. Abdel-Aziz MI, Brinkman P, Vijverberg SJH, Neerincx AH, Riley JH, Bates S, et al. Sputum microbiome profiles identify severe asthma phenotypes of relative stability at 12 to 18 months. J Allergy Clin Immunol. (2021) 147:123–34. doi: 10.1016/j.jaci.2020.04.018
13. Carr TF, Alkatib R, Kraft M. Microbiome in mechanisms of asthma. Clin Chest Med. (2019) 40:87–96. doi: 10.1016/j.ccm.2018.10.006
14. Chung KF. Potential role of the lung microbiome in shaping asthma phenotypes. Ann Am Thorac Soc. (2017) 14:S326–31. doi: 10.1513/AnnalsATS.201702-138AW
15. Huang YJ, Boushey HA. The microbiome in asthma. J Allergy Clin Immunol. (2015) 135:25–30. doi: 10.1016/j.jaci.2014.11.011
16. Huang YJ, Nariya S, Harris JM, Lynch SV, Choy DF, Arron JR, et al. The airway microbiome in patients with severe asthma: associations with disease features and severity. J Allergy Clin Immunol. (2015) 136:874–84. doi: 10.1016/j.jaci.2015.05.044
17. Kozik AJ, Huang YJ. The microbiome in asthma: role in pathogenesis, phenotype, and response to treatment. Ann Allergy Asthma Immunol Off Publ Am Coll Allergy Asthma Immunol. (2019) 122:270–5. doi: 10.1016/j.anai.2018.12.005
18. Loverdos K, Bellos G, Kokolatou L, Vasileiadis I, Giamarellos E, Pecchiari M, et al. Lung microbiome in asthma: current perspectives. J Clin Med. (2019) 8:1967. doi: 10.3390/jcm8111967
19. Hirt RA, Dederichs D, Boehler A, Hoffman AM. Relationship of age, sex, body weight, and hematologic and respiratory variables with airway reactivity in adult cats. Am J Vet Res. (2003) 64:26–31. doi: 10.2460/ajvr.2003.64.26
20. Dye JA, McKiernan BC, Rozanski EA, Hoffmann WE, Losonsky JM, Homco LD, et al. Bronchopulmonary disease in the cat: historical, physical, radiographic, clinicopathologic, and pulmonary functional evaluation of 24 affected and 15 healthy cats. J Vet Intern Med. (1996) 10:385–400. doi: 10.1111/j.1939-1676.1996.tb02086.x
21. Moise NS, Wiedenkeller D, Yeager AE, Blue JT, Scarlett J. Clinical, radiographic, and bronchial cytologic features of cats with bronchial disease: 65 cases (1980-1986). J Am Vet Med Assoc. (1989) 194:1467–73.
22. Oikonomidis IL, Theodorou K, Papaioannou E, Xenoulis PG, Adamama-Moraitou KK, Steiner JM, et al. Serial measurement of thyroid hormones in hospitalised dogs with canine parvoviral enteritis: incidence of non-thyroidal illness syndrome and its association with outcome and systemic inflammatory response syndrome. Vet J Lond Engl. (2021) 274:105715. doi: 10.1016/j.tvjl.2021.105715
23. Corcoran BM, Foster DJ, Fuentes VL. Feline asthma syndrome: a retrospective study of the clinical presentation in 29 cats. J Small Anim Pract. (1995) 36:481–8. doi: 10.1111/j.1748-5827.1995.tb02787.x
24. Venema CM, Williams KJ, Gershwin LJ, Reinero CR, Carey SA. Histopathologic and morphometric evaluation of the nasal and pulmonary airways of cats with experimentally induced asthma. Int Arch Allergy Immunol. (2013) 160:365–76. doi: 10.1159/000342992
25. Foster SF, Allan GS, Martin P, Robertson ID, Malik R. Twenty-five cases of feline bronchial disease (1995-2000). J Feline Med Surg. (2004) 6:181–8. doi: 10.1016/j.jfms.2003.12.008
26. Padrid PA, Feldman BF, Funk K, Samitz EM, Reil D, Cross CE. Cytologic, microbiologic, and biochemical analysis of bronchoalveolar lavage fluid obtained from 24 healthy cats. Am J Vet Res. (1991) 52:1300–7.
27. Chandler JC, Lappin MR. Mycoplasmal respiratory infections in small animals: 17 cases (1988-1999). J Am Anim Hosp Assoc. (2002) 38:111–9. doi: 10.5326/0380111
28. Jambhekar A, Robin E, Le Boedec K. A systematic review and meta-analyses of the association between 4 mycoplasma species and lower respiratory tract disease in dogs. J Vet Intern Med. (2019) 33:1880–91. doi: 10.1111/jvim.15568
29. Lee-Fowler T. Feline respiratory disease: what is the role of Mycoplasma species? J Feline Med Surg. (2014) 16:563–71. doi: 10.1177/1098612X14539087
30. Vientós-Plotts AI, Ericsson AC, Rindt H, Grobman ME, Graham A, Bishop K, et al. Dynamic changes of the respiratory microbiota and its relationship to fecal and blood microbiota in healthy young cats. Wilson BA, editor. PLoS ONE. (2017) 12:e0173818. doi: 10.1371/journal.pone.0173818
31. Vientós-Plotts AI, Ericsson AC, McAdams ZL, Rindt H, Reinero CR. Temporal changes of the respiratory microbiota as cats transition from health to experimental acute and chronic allergic asthma. Front Vet Sci. (2022). 9:983375. doi: 10.3389/fvets.2022.983375
32. Dickson RP, Huffnagle GB. The Lung microbiome: new principles for respiratory bacteriology in health and disease. PLoS Pathog. (2015) 11:e1004923. doi: 10.1371/journal.ppat.1004923
33. Shukla SD, Budden KF, Neal R, Hansbro PM. Microbiome effects on immunity, health and disease in the lung. Clin Transl Immunol. (2017) 6:e133. doi: 10.1038/cti.2017.6
34. Huang YJ, Charlson ES, Collman RG, Colombini-Hatch S, Martinez FD, Senior RM. The role of the lung microbiome in health and disease. A National Heart, Lung, and Blood Institute workshop report. Am J Respir Crit Care Med. (2013) 187:1382–7. doi: 10.1164/rccm.201303-0488WS
35. Lira-Lucio JA, Falfán-Valencia R, Ramírez-Venegas A, Buendía-Roldán I, Rojas-Serrano J, Mejía M, et al. Lung microbiome participation in local immune response regulation in respiratory diseases. Microorganisms. (2020) 8:E1059. doi: 10.3390/microorganisms8071059
36. Yagi K, Huffnagle GB, Lukacs NW, Asai N. The lung microbiome during health and disease. Int J Mol Sci. (2021) 22:10872. doi: 10.3390/ijms221910872
37. Denner DR, Sangwan N, Becker JB, Hogarth DK, Oldham J, Castillo J, et al. Corticosteroid therapy and airflow obstruction influence the bronchial microbiome, which is distinct from that of bronchoalveolar lavage in asthmatic airways. J Allergy Clin Immunol. (2016) 137:1398–405.e3. doi: 10.1016/j.jaci.2015.10.017
38. Vientós-Plotts AI, Ericsson AC, McAdams ZL, Rindt H, Reinero CR. Respiratory dysbiosis in cats with spontaneous allergic asthma. Front Vet Sci. (2022) 9:930385. doi: 10.3389/fvets.2022.930385
39. Schulz BS, Richter P, Weber K, Mueller RS, Wess G, Zenker I, et al. Detection of feline Mycoplasma species in cats with feline asthma and chronic bronchitis. J Feline Med Surg. (2014) 16:943–9. doi: 10.1177/1098612X14524969
40. Parada AE, Needham DM, Fuhrman JA. Every base matters: assessing small subunit rRNA primers for marine microbiomes with mock communities, time series and global field samples. Environ Microbiol. (2016) 18:1403–14. doi: 10.1111/1462-2920.13023
41. Apprill A, McNally S, Parsons R, Weber L. Minor revision to V4 region SSU rRNA 806R gene primer greatly increases detection of SAR11 bacterioplankton. Aquat Microb Ecol. (2015) 75:129–37. doi: 10.3354/ame01753
42. Bolyen E, Rideout JR, Dillon MR, Bokulich NA, Abnet CC, Al-Ghalith GA, et al. Author correction: reproducible, interactive, scalable and extensible microbiome data science using QIIME 2. Nat Biotechnol. (2019) 37:1091. doi: 10.1038/s41587-019-0209-9
43. Callahan BJ, McMurdie PJ, Rosen MJ, Han AW, Johnson AJA, Holmes SP. DADA2: High-resolution sample inference from Illumina amplicon data. Nat Methods. (2016) 13:581–3. doi: 10.1038/nmeth.3869
44. Davis NM, Proctor DM, Holmes SP, Relman DA, Callahan BJ. Simple statistical identification and removal of contaminant sequences in marker-gene and metagenomics data. Microbiome. (2018) 6:226. doi: 10.1186/s40168-018-0605-2
45. Lozupone C, Knight R. UniFrac: a new phylogenetic method for comparing microbial communities. Appl Environ Microbiol. (2005) 71:8228–35. doi: 10.1128/AEM.71.12.8228-8235.2005
46. Ybarra WL, Johnson LR, Drazenovich TL, Johnson EG, Vernau W. Interpretation of multisegment bronchoalveolar lavage in cats (1/2001–1/2011). J Vet Intern Med. (2012) 26:1281–7. doi: 10.1111/j.1939-1676.2012.01016.x
47. Huang YJ. The respiratory microbiome and innate immunity in asthma. Curr Opin Pulm Med. (2015) 21:27–32. doi: 10.1097/MCP.0000000000000124
48. Huang YJ, Nelson CE, Brodie EL, Desantis TZ, Baek MS, Liu J, et al. Airway microbiota and bronchial hyperresponsiveness in patients with suboptimally controlled asthma. J Allergy Clin Immunol. (2011) 127:372–81.e1–3. doi: 10.1016/j.jaci.2010.10.048
49. Shukla SD, Shastri MD, Chong WC, Dua K, Budden KF, Mahmood MQ, et al. Microbiome-focused asthma management strategies. Curr Opin Pharmacol. (2019) 46:143–9. doi: 10.1016/j.coph.2019.06.003
50. Vientós-Plotts AI, Ericsson AC, Rindt H, Reinero CR. Oral probiotics alter healthy feline respiratory microbiota. Front Microbiol. (2017) 8:1287. doi: 10.3389/fmicb.2017.01287
51. Bullone M, Lavoie JP. The equine asthma model of airway remodeling: from a veterinary to a human perspective. Cell Tissue Res. (2020) 380:223–36. doi: 10.1007/s00441-019-03117-4
52. Petersen C, Round JL. Defining dysbiosis and its influence on host immunity and disease. Cell Microbiol. (2014) 16:1024–33. doi: 10.1111/cmi.12308
Keywords: microbiota, cough, lung, eosinophilic, neutrophilic
Citation: Werner M, Weeger J, Hörner-Schmid L, Weber K, Palić J, Shih J, Suchodolski JS, Pilla R and Schulz B (2023) Comparison of the respiratory bacterial microbiome in cats with feline asthma and chronic bronchitis. Front. Vet. Sci. 10:1148849. doi: 10.3389/fvets.2023.1148849
Received: 20 January 2023; Accepted: 13 March 2023;
Published: 27 March 2023.
Edited by:
Cleverson D. Souza, Washington State University, United StatesReviewed by:
Ashenafi Feyisa Beyi, Iowa State University, United StatesCopyright © 2023 Werner, Weeger, Hörner-Schmid, Weber, Palić, Shih, Suchodolski, Pilla and Schulz. This is an open-access article distributed under the terms of the Creative Commons Attribution License (CC BY). The use, distribution or reproduction in other forums is permitted, provided the original author(s) and the copyright owner(s) are credited and that the original publication in this journal is cited, in accordance with accepted academic practice. No use, distribution or reproduction is permitted which does not comply with these terms.
*Correspondence: Bianka Schulz, Yi5zY2h1bHpAbWVkaXppbmlzY2hlLWtsZWludGllcmtsaW5pay5kZQ==
Disclaimer: All claims expressed in this article are solely those of the authors and do not necessarily represent those of their affiliated organizations, or those of the publisher, the editors and the reviewers. Any product that may be evaluated in this article or claim that may be made by its manufacturer is not guaranteed or endorsed by the publisher.
Research integrity at Frontiers
Learn more about the work of our research integrity team to safeguard the quality of each article we publish.