 C. P. Ferradas
 M.-C. Fok1
 N. Maruyama
 M. G. Henderson
- 1Geospace Physics Laboratory, NASA Goddard Space Flight Center, Greenbelt, MD, United States
- 2Department of Physics, Catholic University of America, Washington, DC, United States
- 3LASP, University of Colorado, Boulder, CO, United States
- 4Los Alamos National Laboratory, Los Alamos, NM, United States
- 5Cooperative Institute for Research in Environmental Sciences, Boulder, CO, United States
- 6Orion Space Solutions, Louisville, CO, United States
In this study we investigate the role of particle injections on the ring current development during the 7-8 September 2017 geomagnetic storm by applying a temporally and spatially varying data-driven outer boundary condition in numerical simulations of the ring current with the Comprehensive Inner Magnetosphere-Ionosphere model. We quantify the role of particle injections by comparing the results from two simulation runs: one with the model outer boundary condition defined by measurements at their original time cadence, namely, 1.5 min, and one with the same boundary condition smoothed in time with a 2-h running average window. The comparison between these two runs reveals that the observed particle injections enhanced the electric field remarkably, which had a significant effect on the ring current development, namely, they 1) strengthened the ring current, 2) skewed the ring current distribution dawnward, 3) delayed the formation of the symmetric ring current by prolonging the duration of the partial ring current, and 4) caused a O+-richer ring current with a O+ dominant ring current distribution at the inner edge. Furthermore, these effects enhanced the energy deposition to the plasmasphere and ionosphere via heating by the ring current ions.
1 Introduction
The ring current is one of the four major particle populations in the inner magnetosphere, the other three being the cold plasmasphere, the warm plasma cloak, and the relativistic radiation belts. The ring current is composed of ions and electrons of a few keV to a few hundred keV flowing around the Earth at geocentric distances of ∼two to six Earth radii (RE), and its spatial distribution overlaps with the other inner magnetospheric particle populations, creating a highly dynamic and complex environment. As the particle population carrying most of the plasma pressure in the inner magnetosphere, the ring current plays a crucial role in regulating the energy density in the inner magnetosphere (Daglis et al., 1999), and thus it exerts feedback to the magnetospheric magnetic field configuration.
The main source of ring current particles is understood to be the magnetotail plasma sheet, whereas the plasma sheet particles, in turn, originate either in the solar wind or in the ionosphere (Balsiger et al., 1980; Lennartsson and Shelley, 1986; Kistler, 2020). It is understood that the ring current development is the consequence of the transport of plasma sheet particles into the inner magnetosphere, this transport taking place in a variety of ways. The most invoked mechanism for this plasma transport is the earthward convection by the
Yet another mechanism responsible for the transport of particles to the inner magnetosphere is the one associated with inductive electric fields caused by magnetic field reconfigurations in the magnetotail during substorms. Energetic particle injections are often observed on the nightside during periods of substorm activity at geosynchronous orbit (Reeves and Henderson, 2001; Thomsen et al., 2001) and at lower L shells (Gkioulidou et al., 2014; Mitchell et al., 2018; Motoba et al., 2021). These injections have been largely studied for decades in relation to the development of the storm-time ring current (e.g., Ganushkina et al., 2000; Ganushkina et al., 2001; Liemohn et al., 2011). Evidence for this mechanism and its importance for the ring current buildup has come from measurements of the electric field in the near-Earth plasma sheet and inner magnetosphere. The statistical observations of the electric field made with the Combined Release and Radiation Effects Satellite (CRRES) mission revealed that during disturbed conditions, the electric field in the inner magnetosphere (L ∼ 2-8) is highly variable with timescales of several to tens of minutes (Rowland and Wygant, 1998). Similar findings were obtained with the Geotail spacecraft through a statistical study of the storm-time electric field in the near-Earth plasma sheet, where strong, intermittent bursts of highly fluctuating duskward electric fields were observed, with fluctuations at similarly short timescales (Hori et al., 2005).
Further evidence of the importance of this mechanism has come from the observed relationship between energetic particle injections and plasma sheet transient disturbances in the form of bursty bulk flows (BBFs), also commonly termed “bubbles”, and dipolarizations of the magnetic field in the near-Earth magnetotail, in the so-called magnetotail transition region at approximate distances of ∼8–20 RE on the nightside (Baumjohann et al., 1990; Angelopoulos et al., 1992; Runov et al., 2009; Gabrielse et al., 2014). A statistical study of particle injections observed by Time History of Events and Macroscale Interactions during Substorms (THEMIS) showed that overall injection occurrence rates increase with enhanced auroral activity, evidenced by a higher AL index (Gabrielse et al., 2014). Moreover, numerical modeling efforts have found that localized injections make a significant impact on the storm-time ring current development and intensity (e.g., Ganushkina et al., 2005; Ganushkina et al., 2013).
However, the effectiveness of particle injections in building the ring current has been challenged by observational and modeling investigations. On one side, the analysis of the observed relationship between BBFs and dipolarizations revealed that only a small fraction of BBFs are able to reach geosynchronous altitude, which is typically outside the radial extent of the ring current (McPherron, 1997). On the other hand, ring current simulations have shown that including substorm injections have little or limited effect in building up the ring current (Chen et al., 1993; Fok et al., 1996; Fok et al., 1999; Wolf et al., 1997; Liemohn et al., 2011). On the cause of the ring current buildup during the well-studied St. Patrick’s Day storm of 2013, Gkioulidou et al. (2014) estimated that the direct effects of particle injections could account for 30% of the ring current energy inside L = 5, by extrapolating the number of injections detected by the Van Allen Probes to local times across the nightside. Studying the same event, however, Menz et al. (2016) found that the ring current pressure buildup could be attributed to adiabatic convective transport, where most of the buildup occurred in the energy range with convective access from the tail source. All these results show that the question of whether the ring current buildup and structure are mainly the result of inductive electric fields and the associated particle injections or of large-scale electric fields and the associated convective transport of plasma from the plasma sheet source is still unresolved.
Additionally, more recent simulations with the Rice Convection Model (RCM)-Equilibrium with and without analytical bubble injections showed that while the injections are important in transporting plasma in the tail plasma sheet, they have only a minor effect inside geosynchronous orbit, where transport is mainly through large-scale convection (Yang et al., 2016). However, their simulations relied on analytically generated bubbles including the self-consistent magnetic field disturbances. In this study, we aim to revisit the question of the effects of particle injections on the ring current by using in situ measurements of particle fluxes to obtain a more realistic distribution of the injections.
In this paper, we investigate the ring current response during the storm of 7–8 September 2017. The focus of the study is to quantify the impact of the substorm-associated, short-timescale, spatially localized particle injections that were observed at geosynchronous orbit on the ring current development. Specifically, we focus on the impact on the ring current spatial distribution and ion composition. Furthermore, the ion composition can affect the energy deposition of the ring current ions to the thermal particles in the plasmasphere. Particularly, O+ are known to be a major source of heating to the thermal plasmasphere ions via Coulomb collisions (e.g., Fok et al., 1995). Therefore, since O+ plays a critical role in the ring current development during this storm due to the particle injections, as will be shown, we also investigate the effect of particle injections on the plasmaspheric heating by ring current ions. Our analysis is primarily based on simulations with the Comprehensive Inner Magnetosphere-Ionosphere (CIMI) model, using measurements at geosynchronous orbit from the Los Alamos National laboratory (LANL) and Geostationary Operational Environmental Satellites (GOES) spacecraft to establish the model outer boundary. A description of the event is given in Section 2. In Section 3, we present the observed signatures of substorm-related particle injections as seen from geosynchronous orbit. The modeling results of the ring current response are presented in Section 4. Section 5 contains a discussion of the results, and our conclusions are given in Section 6.
2 Event description
The geomagnetic storm of 7–8 September 2017 and the overall heliospheric and geospace disturbances observed on 4-10 September 2017 have been widely reported in a special issue of the American Geophysical Union’s Space Weather journal titled “Space Weather Events of 4–10 September 2017” (e.g., Redmon et al., 2018; Obana et al., 2019). The geomagnetic conditions on 7-8 September 2017 were influenced by the arrival of two interplanetary coronal mass ejections (ICMEs), which were observed by spacecraft located in the solar wind upstream of the magnetosphere late September 6th and late September 7th, respectively. The second of these ICMEs triggered a geomagnetic storm that exhibited a “double dip” profile of the Sym-H index (Zhang et al., 2008). Figure 1 shows the solar wind density (Nsw), velocity (Vsw), and dynamic pressure (Pdyn), the Geocentric Solar Magnetospheric (GSM) y- and z-components of the interplanetary magnetic field (IMF), and the AU, AL, planetary Kp, and Sym-H indices during the period of 1600 UT on September 7th through 0000 UT on September 9th. The solar wind data and geomagnetic indices were obtained from the OMNI data base. The beginning of the geomagnetic storm was signaled by the storm sudden commencement (SSC) (Kamide et al., 2002) evident as a sudden increase in the Sym-H index at 2300 UT on September 7th and the arrival of the ICME marked by the magenta dashed line in Figure 1. Around this time the IMF BZ turned southward sharply reaching a value of −32 nT and Vsw experienced a jump up to ∼700 km/s. During the storm first main phase, which lasted ∼2 h until ∼0110 UT, the Sym-H index decreased down to a peak value of −146 nT. Subsequently, the recovery phase lasted until ∼1130 UT, when the IMF BZ exhibited a second major southward turning. This second turning of the IMF BZ produced a second main phase, as seen by a second dip in Sym-H with a peak value of −115 nT at ∼1400 UT. Both main phases were accompanied by sustained auroral activity, evidenced by several peaks of the AL index that exceeded 2,000 nT in magnitude.
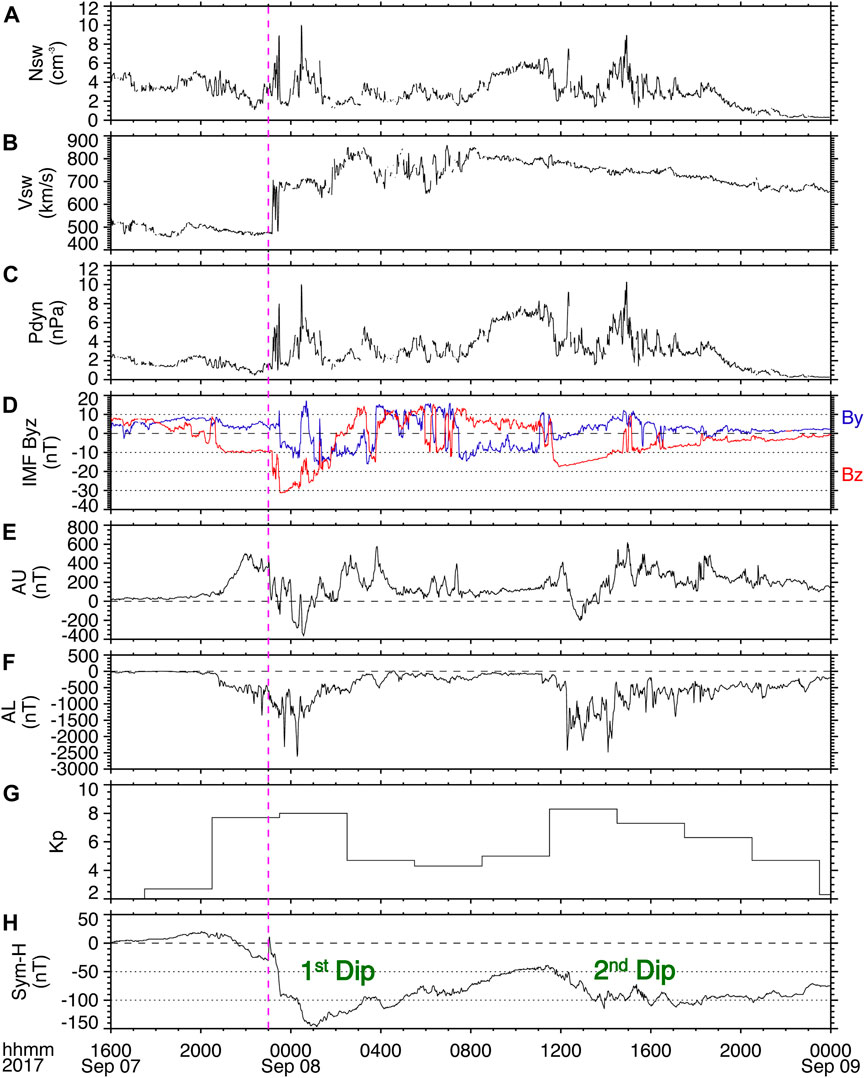
FIGURE 1. Solar wind parameters and geomagnetic indices during the 7-8 September 2017 double-dip geomagnetic storm. Solar wind (A) density, (B) speed, and (C) dynamic pressure, (D) the interplanetary magnetic field (IMF) y- and z-components, and the (E) AU, (F) AL, (G) Kp, and (H) Sym-H indices. The magenta dashed line indicates the arrival time of the interplanetary coronal mass ejection (ICME), and the two dips of the storm are labeled in green.
It is noteworthy that even though during the second dip of the storm the minimum Sym-H was not as large as during the first dip, there was a more disturbed AL index and a slightly higher maximum Kp value (8 during the first dip of the storm and 8+ during the second dip). Moreover, during the second dip the Sym-H index shows a very slow recovery compared to the first dip. Additionally, Obana et al. (2019) reported that the maximum increase in the cross polar cap potential drop during the first dip of the storm was 235 kV, whereas during the second dip of the storm it exceeded 246 kV. Figure 1E shows the first of a series of peaks of the AE index that were observed during the second dip of the storm shortly after 1200 UT on September 8th, which exceeded 2,000 nT. In their study of the same event, Yamauchi et al. (2018) reported the onset of a strong substorm shortly after 1200 UT from measurements of the geomagnetic horizontal H) component from ground magnetometer stations. The series of AE peaks nearing or exceeding 2,000 nT that are observed between ∼1,200 and ∼1400 UT indicate several disturbed auroral episodes that are likely associated with substorm activity. Also using ground magnetometer measurements, Jin et al. (2018) further reported two consecutive substorm onsets later in the early recovery phase, at ∼1,600 and ∼1700 UT, as the IMF BZ was gradually recovering to quiet time values. Following the second main phase of the storm, and during the remainder of the day on September 8th, the Sym-H recovered very slowly.
3 Particle injection signatures at geosynchronous orbit
For the remainder of the paper, we focus our attention on the second dip of the storm, which started with the abrupt southward turning of the IMF BZ at ∼1130 UT on September 8th. We focus on this period mainly for two reasons. First, as mentioned in the previous section, the second dip exhibited strong geomagnetic activity, especially auroral activity, as indicated by the AE and Kp indices, thus accounting for a more interesting period to study the effects of substorm-associated particle injections. And second, a highly structured cold electron density profile during the second main phase and a subsequent unexpectedly severe erosion of the plasmasphere have been reported using measurements from the Exploration of energization and Radiation in Geospace (ERG)/Arase satellite (Obana et al., 2019). Immediately after the second recovery phase starts, the plasmapause location was observed to be at L = 1.6-1.7, much deeper than predicted by empirical models of the plasmapause location that use the Dst index as input. For these two reasons, this study aims to determine the effect of short-timescale, localized injections on the ring current development during the second dip of the storm.
During this event, six geosynchronous satellites were well positioned, well distributed in magnetic local time (MLT), to provide good coverage at all MLT sectors of the substorm-associated particle injections throughout the period of interest. More specifically, these satellites are five Los Alamos National Laboratory (LANL) satellites, 1994-084, LANL-01A, LANL-02A, LANL-04A and LANL-97A, and the Geostationary Operational Environmental Satellites (GOES)-16 satellite. To consider the particle injections, we use particle data from the Magnetosphere Plasma Analyzer (MPA; Bame et al., 1993), Synchronous Orbit Particle Analyzer (SOPA; Belian et al., 1992), and Energetic Spectrometer for Particles (ESP; Meier et al., 1996) onboard the LANL satellites, and particle data from the Magnetospheric Particle Sensor-Low Energy (MPS-LO) and Magnetospheric Particle Sensor-High Energy (MPS-HI) (Dichter et al., 2015; Kress et al., 2019; Boudouridis et al., 2020) and magnetic field data from the Magnetometer (MAG; Loto’aniu et al., 2020) onboard the GOES-R (GOES-16) spacecraft.
Figures 2, 3 show the electron and ion fluxes for selected energy channels from the plasma instruments onboard the LANL-01A, GOES-16 and 1994-084 (Figure 2) and LANL-97A, LANL-04A and LANL-02A (Figure 3) geosynchronous satellites during the second dip of the storm. On both figures, the top three panels show the y- and z-components of the IMF, the solar wind dynamic pressure, and the AE index and are included for context to the features in the plasma measurements. As seen from both figures, starting at 1208 UT and throughout the rest of the day, multiple particle injections were observed at a wide range of MLTs. The injections are identified as sudden increases in the flux in more than one energy channel nearly simultaneously. The timings of these particle injections as observed by the geosynchronous satellites are labeled with colored dashed lines. The first particle injection signatures were observed by LANL-04A and LANL-02A on the duskside and by LANL-01A on the post-midnight sector, which are likely associated with the strong substorm onset measured by ground stations and reported by Yamauchi et al. (2018) shortly after 1200 UT. Over the following hours, enhanced auroral activity was evidenced by several peaks in the AE index, the two strongest ones reaching over 2,500 nT at ∼1220 UT and ∼1405 UT. During this time, several smaller-scale (not labeled) injections were observed by LANL-97A on the afternoon sector and by LANL-02A on the pre-midnight sector. Two lists of substorm onsets provided by the SuperMAG database through their website (https://supermag.jhuapl.edu/substorms/) report that several onsets occurred during roughly the period plotted in Figures 2, 3, namely, from 1059 UT on 8 September until the end of that day. One list reports seventeen onsets and the other reports nine. The substorm onset times in these two lists were determined using the SML index, a generalization of the AL index, and the substorm identification criteria established by Newell and Gjerloev (2011) and Forsyth et al. (2015), respectively. From the lists of seventeen and nine onsets, fifteen and nine onsets, respectively, that is all but two, were determined to be on the dawnside (between MLT = 0-12). Moreover, several of the onsets identified in these lists occurred within 10 min of the particle injection observations at geosynchronous orbit, that is at 1,208, 1,543, 2036, and 2237 UT, and thus the particle injections and the substorm onsets are most likely associated (e.g., Akasofu et al., 1974; Reeves and Henderson, 2001). This further suggests that the period during the second dip of the storm was characterized by persistently enhanced dawnside auroral activity and associated particle injections.
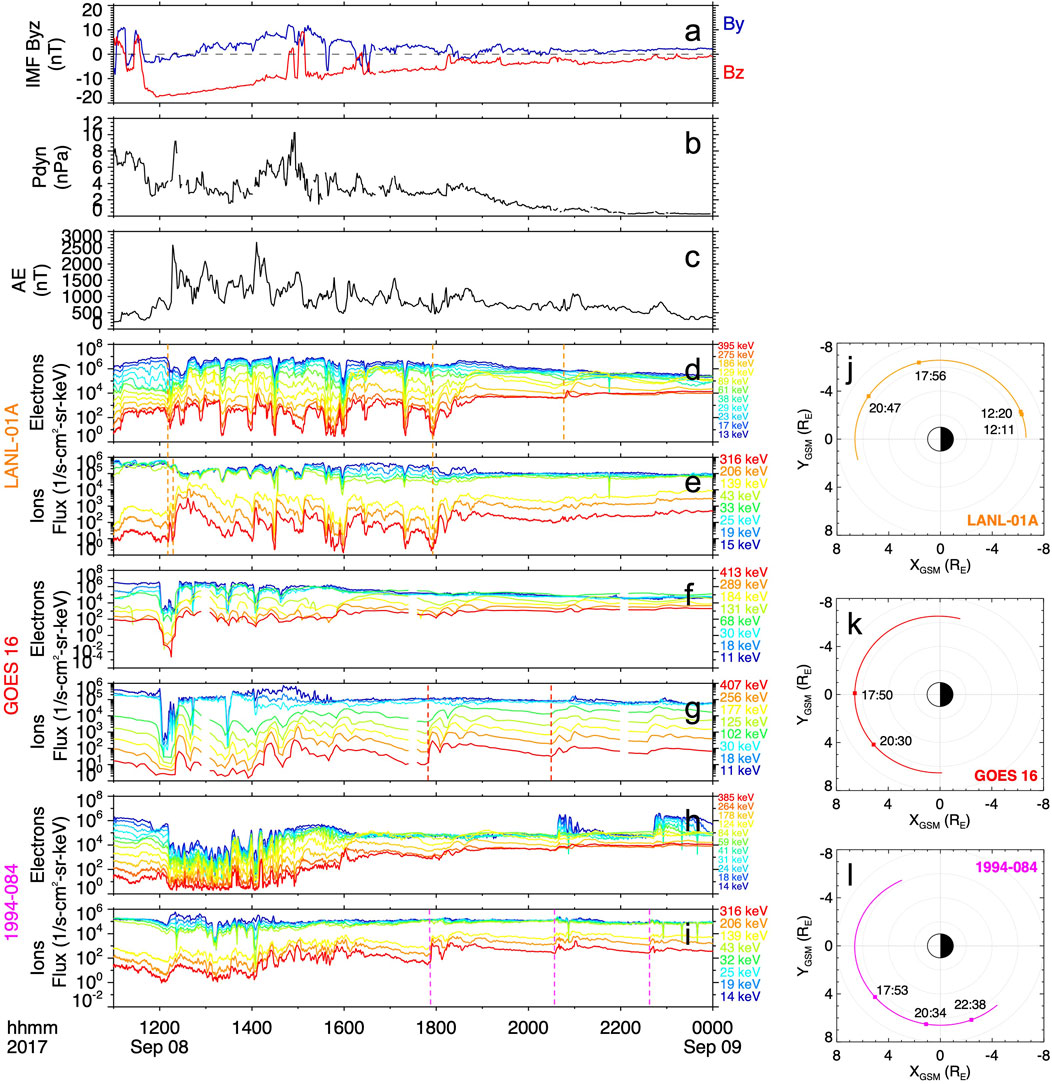
FIGURE 2. Geosynchronous measurements showing the particle injections detected during the second dip of the storm. (A) The IMF y- and z-components, (B) solar wind dynamic pressure, (C) AE index, and the ion and electron differential fluxes measured by the (D, E) LANL-01A, (F, G) GOES-16, and (H, I) 1994-084 geosynchronous satellites from 1100 UT on 8 September to 0000 UT on 9 September. The orbital path of the (J) LANL-01A, (K) GOES-16, and (L) 1994-084 satellites in the GSM X-Y plane during the total period of the plotted observations. The timings of the particle injection observations are indicated with colored dashed lines in the spectrograms and are labeled and indicated with squares in the plots of the orbital paths.
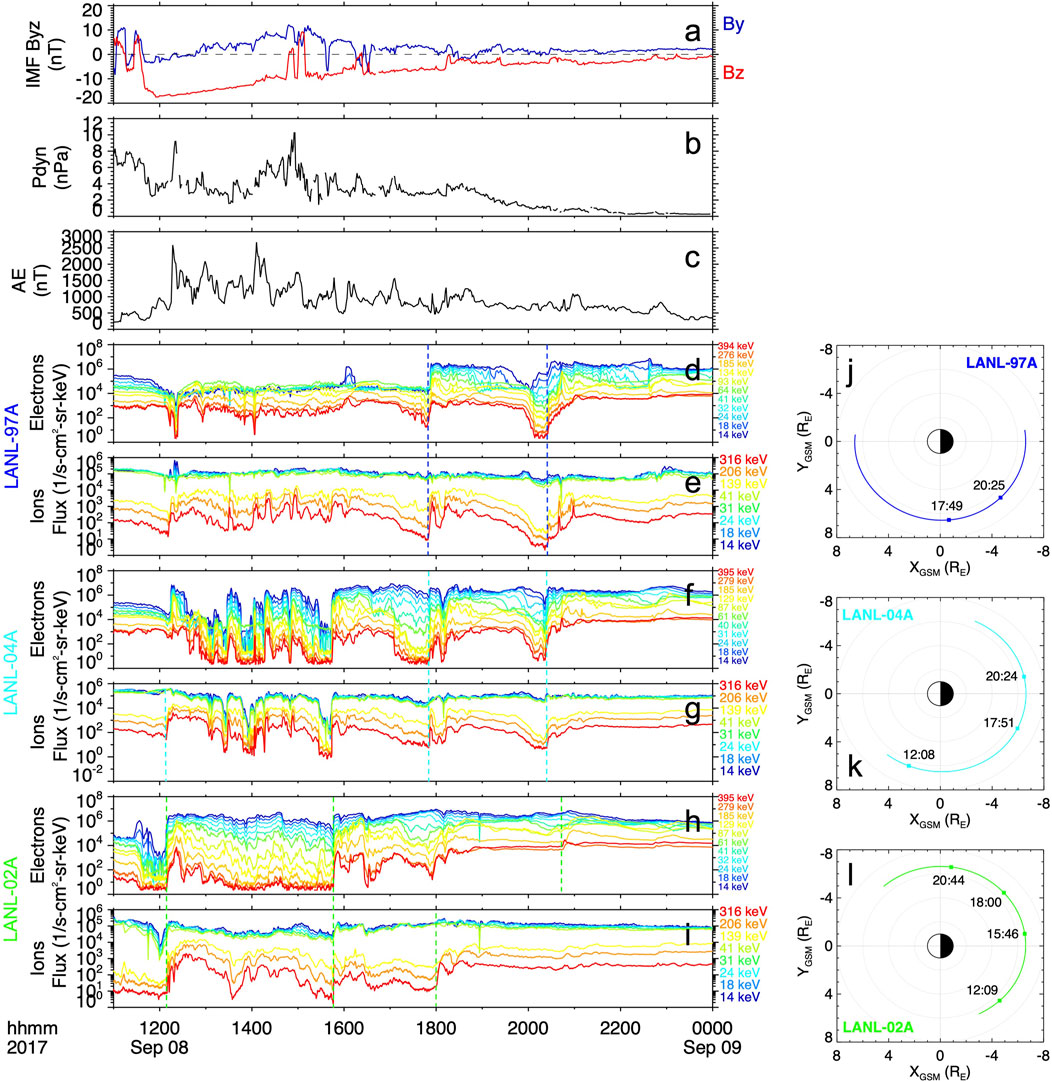
FIGURE 3. Geosynchronous measurements showing the particle injections detected during the second dip of the storm. (A) The IMF y- and z-components, (B) solar wind dynamic pressure, (C) AE index, and the ion and electron differential fluxes measured by the (D, E) LANL-97A, (F, G) LANL-04A, and (H, I) LANL-02A geosynchronous satellites from 1100 UT on 8 September to 0000 UT on 9 September. The orbital path of the (J) LANL-97A, (K) LANL-04A, and (L) LANL-02A satellites in the GSM X-Y plane during the total period of the plotted observations. The timings of the particle injection observations are indicated with colored dashed lines in the spectrograms and are labeled and indicated with squares in the plots of the orbital paths.
4 The simulated ring current development
To investigate how the substorm injections, as detected at geosynchronous orbit, impact the ring current development, we perform simulations with the Comprehensive Inner Magnetosphere-Ionosphere (CIMI) model (Fok et al., 2014; Fok et al., 2021). The results from these simulations are then compared to observations from the Van Allen Probes mission for validation.
4.1 The CIMI model
To determine the ring current development during the second dip of the storm, we use the CIMI model to simulate the ring current ion fluxes and the magnetospheric electric field. The CIMI model (Fok et al., 2014; Fok et al., 2021) combines the Comprehensive Ring Current Model (CRCM) (Fok et al., 2001) and the Radiation Belt Environment (RBE) model (Fok et al., 2008; Fok et al., 2011). CIMI is a kinetic model that calculates ion (0.1–500 keV) and electron (1 keV–6 MeV) distributions, the subauroral Region-2 field-aligned currents (FACs), the subauroral ionospheric potentials, and the cold plasmasphere distribution by solving three major equations: the bounce-averaged Boltzmann equation for the distribution functions of energetic ions and electrons, the conservation equation of plasmasphere particles, and the ionospheric current conservation equation for the ionospheric potential. The spatial domain of CIMI is confined in the closed field region bounded by the dayside magnetopause and a radial distance at the magnetic equator, i.e., 10 Earth radii (RE). In this study, we set the equatorial boundary at 6.6 RE with boundary conditions provided by observations at geosynchronous orbit. The model grid resolution is dictated by 53 grid steps in latitude and 48 in local time. Of particular interest for this study, the MLT bin size is thus 0.5 h. Since CIMI is a bounce-averaged model, it is adequate to use any point along a field line as a reference point. The commonly used reference points are the ionospheric foot point and the equatorial crossing. We chose to use the ionospheric foot points since magnetic field variations are negligible in the ionosphere but can vary greatly at the equator during storm times (Fok and Moore, 1997). Particle diffusion in energy and pitch angle due to interactions with plasma waves as well as losses due to charge exchange (ions only) and losses due to precipitation into the loss cone are accounted for by the model. Compared to previous versions of CIMI that were used to assess the role of particle injections on the ring current development (e.g., Fok et al., 1996; Fok et al., 1999), this version includes magnetosphere-ionosphere (MI) coupling, which is critical to simulate important mechanisms such as shielding, which has the effect of weakening the ring current. CIMI accounts for the electrodynamic coupling between the magnetosphere and the ionosphere through FACs, which are calculated from the pressure gradients of all ring current species based on the so-called Vasyliunas equation (Vasyliunas, 1970), by solving the ionospheric current conservation equation for the ionospheric potential,
4.2 Boundary conditions
In this study, we use the recently developed capability of CIMI of using a data-driven outer BC defined at the geosynchronous altitude (6.6 RE) in the near-Earth plasma sheet with measurements taken from geosynchronous satellites. To examine the effect of the short-timescale, spatially localized particle injections, whose signatures were observed at geosynchronous orbit, on the ring current development, we perform two simulation runs with CIMI using different outer BC. For Run 1, CIMI used a data-driven outer BC at 6.6 RE, where the boundary was defined by the energy distributions of the ion and electron fluxes measured by the six geosynchronous satellites (1994-084, LANL-01A, LANL-02A, LANL-04A, LANL-97A, and GOES-16) that are well distributed in MLT, thus providing optimal spatial coverage of all MLT sectors. The particle energy distributions measured by the six satellites at any given time were linearly interpolated in MLT to fill the model outer BC. Thus, at any given time, the data from all six satellites were used in creating the model outer boundary. The UT cadence of the BC is the same as the cadence of the measurements, that is ∼1.5 min. This temporally and spatially varying, data-driven outer boundary condition is a significant improvement in the modeling technique from previous studies that also used a data-driven outer boundary condition, since they employed temporally-varying but spatially uniform boundary conditions (Ganushkina et al., 2006; Liemohn and Jazowski, 2008; Liemohn et al., 2011). Including a spatially varying outer boundary in the model allows for a more realistic representation of the ring current, as it allows the model to capture not only the sudden changes due to particle injections but also the effects due to the locations where they occur.
For Run 2 the same data-driven BC used in Run 1 was smoothed in UT with a 2-h running average window. Starting with the measurements from the six satellites, these were individually smoothed in UT with a 2-h window before being linearly interpolated in MLT to create the model outer BC. Since the geosynchronous satellites virtually move solely in MLT with an orbital period of 24 h, by smoothing in UT we are effectively smoothing the measurements also in MLT. Several lengths of the smoothing window were tested, and the 2-h window provided the best balance between removing the short-timescale and localized nature of the injections and still providing a realistically varying distribution. Therefore, by smoothing the measured particle fluxes, the BC in Run 2 possesses realistic flux levels but lacks the sudden and localized changes at short timescales (few minutes) and at small spatial scales (few hours in MLT) characteristic of particle injections. For the remainder of the paper, we will refer to the BC in Run 1 as the “unsmoothed” BC and to the BC in Run 2 as the “smoothed” BC.
Figure 4 shows three plasma parameters, the ion perpendicular energy, the H+ density, and the O+ density at the model outer boundary, at 6.6 RE, on September 8 for the two runs. The BC parameters in Figure 4 are plotted at a 1.5 min cadence to match the geosynchronous measurements used to create the model outer boundary. However, the MLT resolution of the model BC is the same as that of the model, i.e., 0.5 h. Since the geosynchronous satellite plasma measurements do not provide the ion composition, the O+/H+ ratio in the model is estimated from the relation given by equation 5 in Young et al. (1982), which depends on the Kp and F10.7 indices. In general, during the whole day, and particularly during the period of interest during the second dip of the storm, Figure 4 shows that using the smoothed BC, the plasma parameters at geosynchronous orbit change much more smoothly in time and at larger MLT spatial scales compared to the dynamics of the realistic plasma parameters. Figure 4B-D show that the realistic BC captures the dynamics of the environment at geosynchronous altitudes, including the localized and short-timescale particle injection signatures observed during the second dip of the storm. We note that for both runs, starting shortly after the beginning of the second main phase, at around 1200 UT, and during several hours both the H+ and O+ densities were higher on the dawnside compared to the duskside, with several injections occurring on the dawnside. Moreover, at 1200 UT the ion perpendicular energy first increased to a few tens of keV at a wide range of MLTs, and then by 1400 UT it decreased to a few keV on the dawnside while remaining at tens of keV on the duskside. Such an increase in the perpendicular energy follows the injection of energetic ions at the beginning of the second main phase (Figure 2E; Figures 3G, I) and is consistent with variations in the near-Earth plasma sheet distributions during periods of substorm activity (e.g., Birn et al., 1997). Thus, during this period, both BCs exhibit a clear dawn-dusk asymmetry in the H+ and O+ densities and on the ion perpendicular energy.
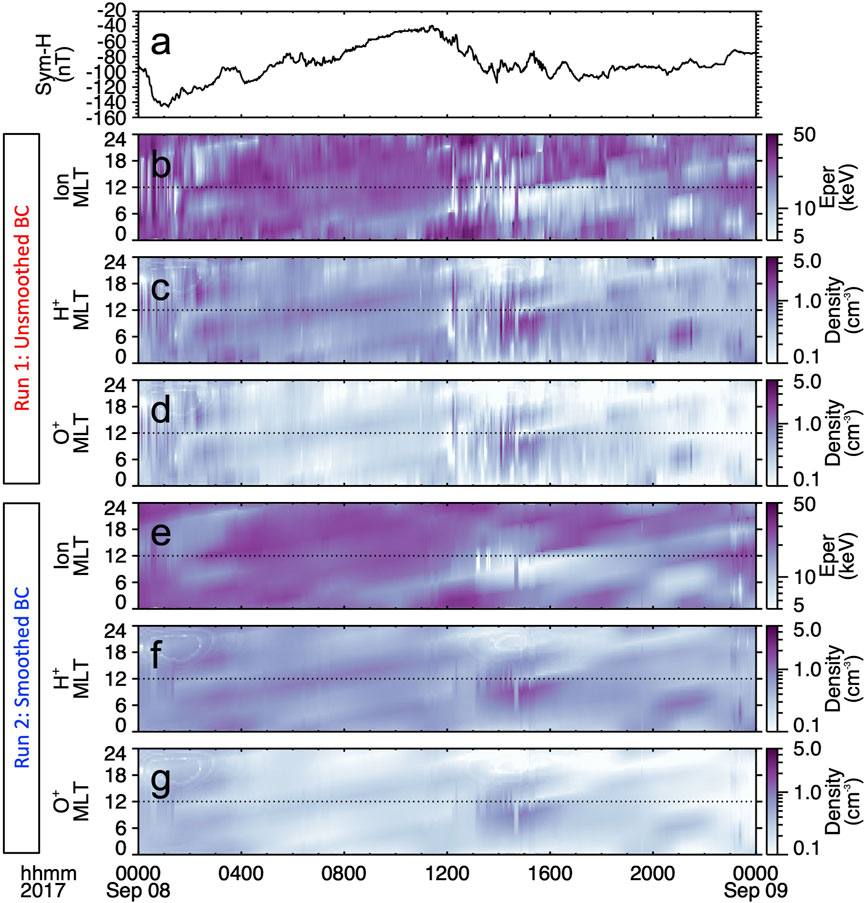
FIGURE 4. Model boundary conditions at geosynchronous orbit for two simulation runs performed with the CIMI model. (A) The Sym-H index, MLT-time spectrograms of the perpendicular energy, H+ density, and O+ density at 6.6 RE for (B–D) Run 1, with the unsmoothed data-driven boundary condition, and (E–G) Run 2, with the smoothed data-driven boundary condition.
4.3 Results
To study the ring current development during the storm, we first consider the total ring current energy. Figure 5 shows the temporal evolution of the ring current energy (RCE) from both runs along with the Dst index and its pressure-corrected version, Dst*. Here we compare the calculated RCE with the observed Dst* since it has been corrected by removing the effects from other current systems (Dessler and Parker, 1959; Sckopke, 1966; Gonzalez et al., 1994), and thus, it shows the ring current contribution more clearly. Still, all effects from currents besides the ring current cannot be fully removed (e.g., Liemohn, 2003). First, Figure 5 shows that the RCE from both runs follow the trends in Dst* reasonably well. Also, the unsmoothed run (Run 1) produced and overall stronger ring current than the smoothed run (Run 2). Further, the difference in RCE is larger during the second dip of the storm. The peak RCE during the first dip of the storm was 1.54 × 1031 for the smoothed run and 1.63 × 1031 for the unsmoothed run, that is about 6% higher. On the other hand, the peak RCE during the second dip was 1.42 × 1031 for the smoothed run and 1.64 × 1031 for the unsmoothed run, that is about 15% higher.
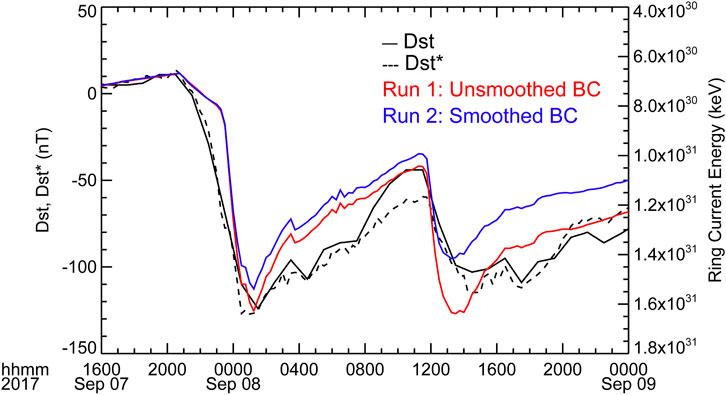
FIGURE 5. Measured Dst and Dst* indices and total simulated ring current energy for two runs performed with the CIMI model.
To further examine the ring current development, we consider the ion pressure. The ring current pressure distribution displays the strength and shape of the ring current as well as the location of the ring current peak pressure. The simulated equatorial distributions of the ring current pressure from both runs during the first several hours of the second dip of the storm are shown in Figure 6, for 0.1-500 keV H+ and O+. To help identify and quantify the differences between both runs, Figure 6 also shows the equatorial distributions of the log accuracy ratio, Log(Q), where the accuracy ratio, Q, is the ratio of the pressure in Run 1 to the pressure in Run 2 (Morley et al., 2018). Here we highlight two features of the ion pressure distributions related to their MLT asymmetry.
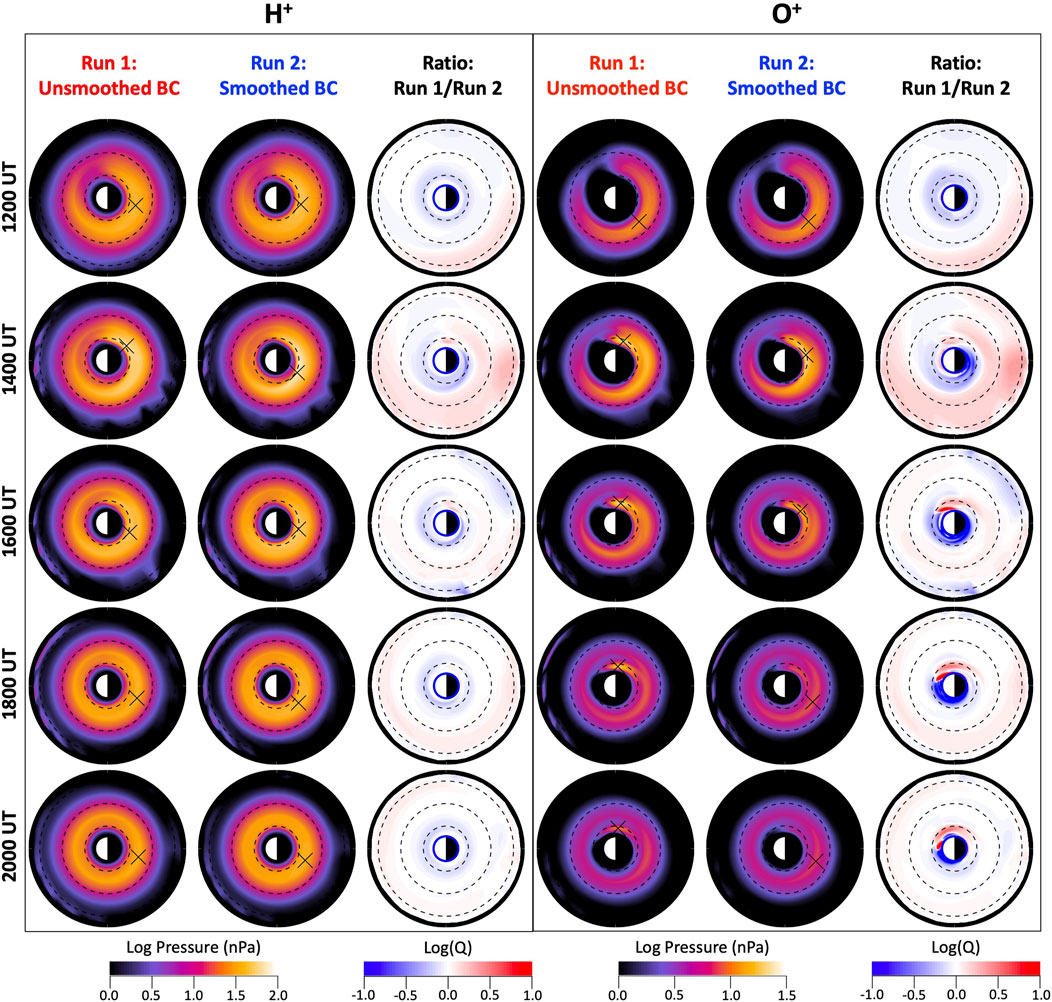
FIGURE 6. Equatorial maps of the simulated ring current ion pressures during the second dip of the storm. (left) H+ and (right) O+ pressure distributions in the equatorial plane inside 7 RE for both simulation runs performed with the CIMI model as well as for the ratio of the pressures from both runs, for selected times between 1200 and 2000 UT on 8 September. The black dashed curves mark L shells of 2, 4 and 6 RE.
The first one is a dawnside skewing of the region of ring current peak pressure. This feature can be seen for both H+ and O+. Figure 6 shows that at 1200 UT, the H+ ring current pressure peak (indicated with an X) is located on the pre-midnight sector (MLT = 23) for both runs. During the following hours, however, only the H+ pressure peak in the unsmoothed run moves toward the dawnside, remaining around L = 2.1 and MLT = 2.5 until around 1500 UT. In the subsequent hours, the pressure peak moves back westward to the pre-midnight sector and remains there until at least 2000 UT. Conversely, this dawnside shift in the H+ pressure distribution is not observed in the smoothed run, but the pressure peak remains on the pre-midnight sector. This dawnside skewing in the unsmoothed run can be seen in the plots of Log(Q) as regions of positive and negative values at low L on the dawnside and duskside, respectively. To better visualize this, Figure 7 shows the MLT distribution of the H+ and O+ ring current pressure at a fixed L shell, where the peak pressure occurs. The MLT where the peak pressure occurs, indicated with the vertical dashed lines, show this dawnside skewing of the region of H+ ring current peak pressure only for the unsmoothed run.
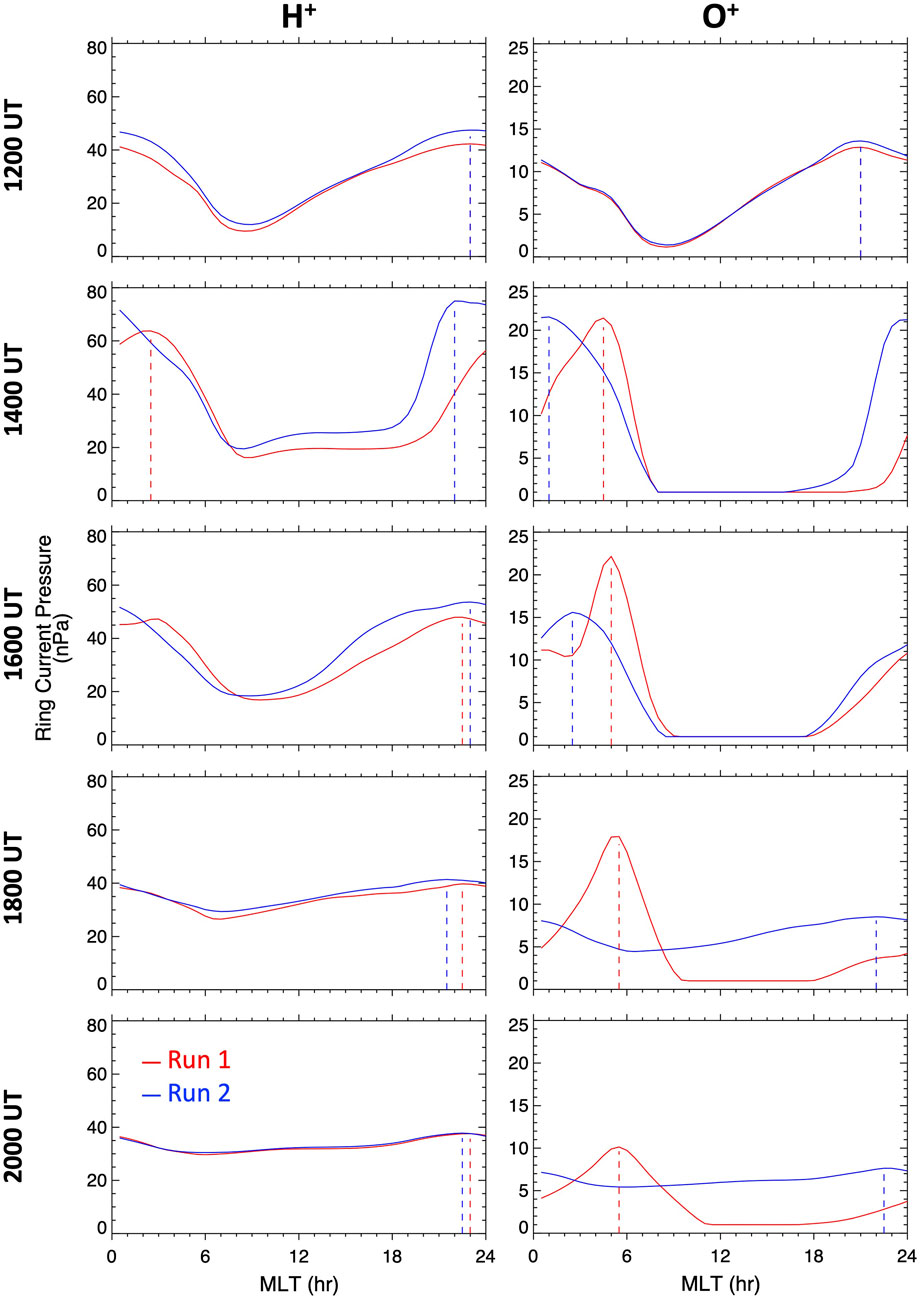
FIGURE 7. MLT distributions of the ring current ion pressures at the location of the peak pressure during the second dip of the storm. (left) H+ and (right) O+ pressure-MLT distributions at a fixed L shell, where the peak pressure occurred, from both runs, for selected times between 1200 and 2000 UT on 8 September. The vertical dashed lines indicate the MLT location of the pressure peak.
This feature is more clearly seen in the O+ ring current pressure distributions. Even though the O+ distributions for both runs exhibit a dawnside skewing, it is stronger and lasts longer for the unsmoothed run. Figures 6, 7 show that for both runs, like for H+, the O+ peak pressure lies on the pre-midnight sector at the beginning of the second dip of the storm. For the unsmoothed run, by 1400 UT the O+ peak has moved eastward to the dawnside to MLT = 4.5. However, while for H+ the peak shifts back westward at 1600 UT, the O+ pressure peak remains on the dawnside, moving slightly more toward dawn, until at least 2000 UT. For the smoothed run, on the other hand, the pressure peak also moves eastward although it does not move as far toward dawn reaching only MLT = 2.5. Moreover, by 1800 UT the pressure peak has moved westward back to the pre-midnight sector, where it remains.
The second feature is a longer duration of the asymmetric ring current, namely, the asymmetric ring current distribution lasted longer in the unsmoothed run than in the smoothed run. This feature was only seen for O+. While in both runs the O+ distributions started with a clear asymmetry at 1200 UT, with a pressure peak on the pre-midnight sector, by 2000 UT the distribution for the smoothed run was virtually symmetric. On the other hand, as seen from Figure 7, for the unsmoothed run, the O+ distribution in the region of peak pressure remained asymmetric until at least 2000 UT. This O+ ring current asymmetry is seen at low L, namely, L ∼ 2 (Figure 6), and is caused by the strong dawnside skewing and deeper penetration of the region of peak pressure. At higher L the ring current distribution is more symmetric resembling the distribution for the smoothed run.
The fact that O+ exhibit the dawnside skewing more clearly than H+ and also exhibit the long-lasting asymmetric ring current distribution calls for an explanation. Since the energy distributions for both ion species are assumed to be the same at the model outer boundary (since the geosynchronous instruments do not distinguish ion species), and the drift velocity is also the same for different ion species, the most obvious species-dependent mechanism is the charge exchange loss. The charge exchange ion lifetimes due to decay via charge exchange collisions with the neutral H atoms from the exosphere are strongly species dependent (e.g., Smith and Bewtra, 1978). While at energies above ∼50 keV the H+ lifetimes are longer than the O+ lifetimes, at lower energies the opposite is true. An examination of the mean energy of the ion distributions (not shown) shows that the dawnside ion populations have energies below ∼10 keV, where the O+ energies are lower than the H+ energies, and thus over time H+ will be lost at a faster rate than O+. The stronger dawnside skewing and the longer duration of the asymmetric ring current for O+ compared to H+ are thus most likely a consequence of the species dependent charge exchange loss rates.
To understand the ring current response during the storm, we examine the electric field, which plays a key role in the transport and energization of the ring current particles. Figure 8 shows the electric field and electric potential distributions for both simulation runs. The electric potential distributions are shown by isocontours shown every 4 kV. The overall patterns of the electric field and electric potential distributions during this period include two main sectors where the electric field is enhanced, namely, the duskside and the post-midnight sector (Rowland and Wygant, 1998; Califf et al., 2014), with the latter region exhibiting stronger electric fields. For the smoothed run, the electric field gradually weakens in both sectors, whereas for the unsmoothed run, the electric field gradually weakens on the duskside, but on the post-midnight sector it first intensifies reaching a peak around 1400 UT and it then gradually weakens in the consecutive hours. Besides this difference in the dynamics of the electric field between both runs, other differences are in the electric field intensity and smaller-scale spatial distribution. As seen from the plots of Log(Q) at 1200 UT, the electric field for the smoothed run is slightly more intense on the dusk sector and proportionate on the post-midnight sector compared to unsmoothed run. However, by 1400 UT, as the second main phase of the storm is under way, the peak electric fields for the unsmoothed run are higher on both sectors, the peak on the post-midnight sector being significantly higher (∼8 mV/m) than for the smoothed run (∼5 mV/m). Moreover, the Log(Q) plot shows a red-blue-red-blue pattern in the radially inward direction near midnight. This indicates alternating regions where the electric field intensity in the unsmoothed run is significantly higher and significantly lower than that in the smoothed run. This feature manifests both the smoother electric field spatial distribution in the smoothed run and the more structured one in the unsmoothed run. In the latter, the region of strongest electric field is outwardly adjacent to a region of much lower electric field, creating a steep radial gradient in the electric field magnitude in that sector. A similar feature happens inward of this region, near midnight at L = 2.5-3.0, thus creating the red-blue-red-blue pattern in the Log(Q) plot. This feature is an effect of the particle injections. Furthermore, at this time, the electric potential isocontours show a stronger dawnward particle drift motion near the post-midnight sector and a stronger radially inward drift motion near dawn. In the consecutive hours, while the electric field decreases more rapidly for the smoothed run, especially on the post-midnight sector, strong electric fields of up to ∼5 mV/m are seen to persist on the post-midnight sector until 1600 UT for the unsmoothed run. Moreover, this region of strong electric fields extends further toward dawn and exhibits a steeper gradient in the radial direction in the unsmoothed run compared to the smoothed run. The enhanced electric fields extending further dawnward in the unsmoothed run are likely associated with the particle injections observed by the LANL satellites at geosynchronous orbit after 1200 UT at different local times (see Figures 2-4), and responsible for the stronger dawnside skewing and longer duration of the asymmetric ring current.
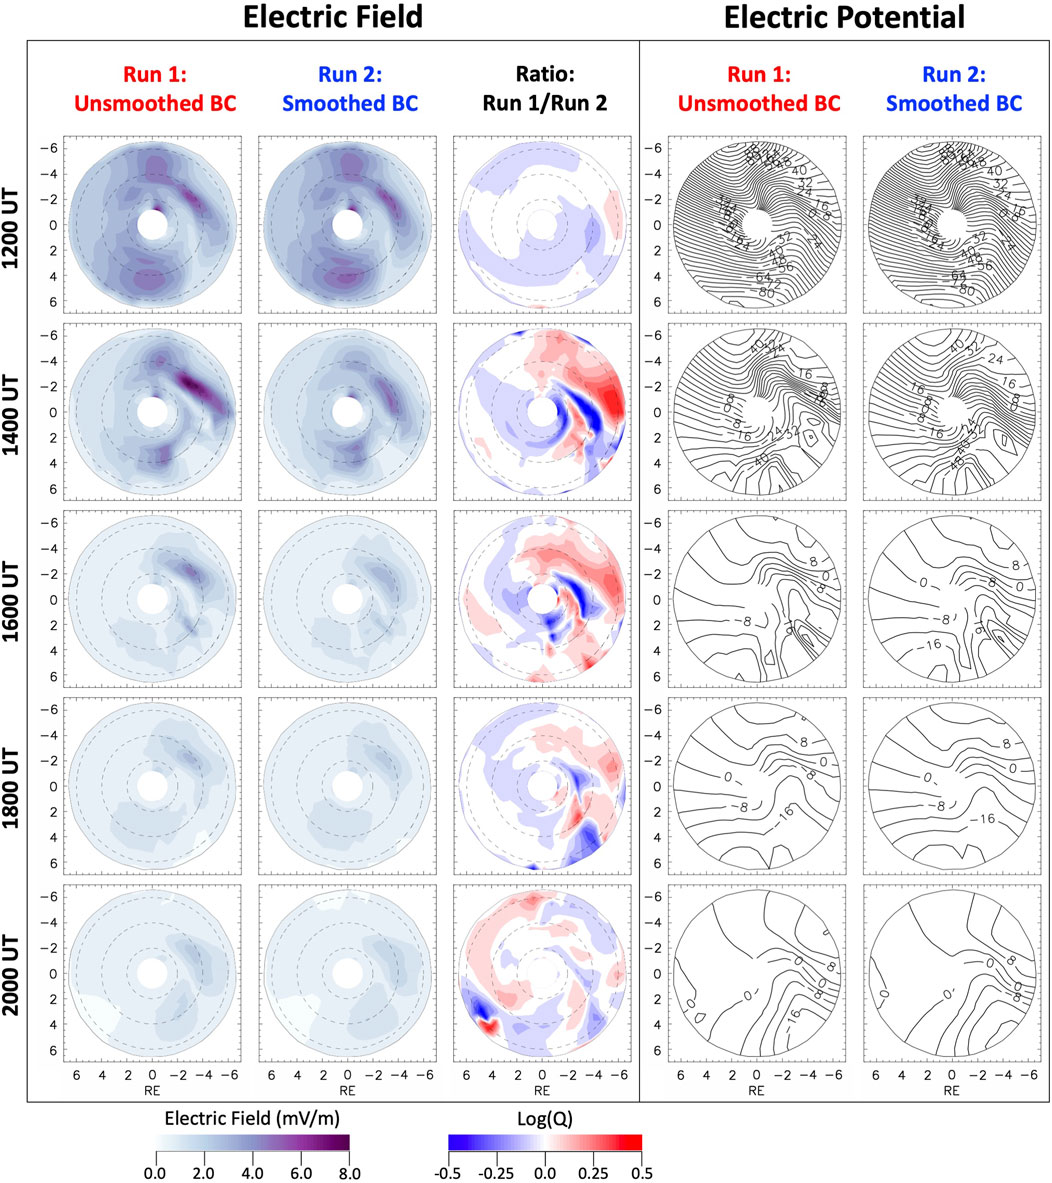
FIGURE 8. Equatorial maps of the simulated magnetospheric electric field and electric potential during the second dip of the storm. (left) Electric field distributions for both simulation runs performed with the CIMI model as well as for the ratio of the electric field from both runs, and (right) electric potential isocontours for both runs in the equatorial plane inside 7 RE for selected times between 1200 and 2000 UT on 8 September. The black dashed curves on the plots of the electric field mark L shells of 2, 4 and 6 RE.
One plasma parameter that is important for many magnetospheric processes, such as the generation of plasma waves, is the ion composition (e.g., Lee et al., 2021, and references therein). Therefore, we also investigate the ring current ion composition during the second dip of the storm. Figure 9 shows the O+/H+ pressure ratio distribution for both simulation runs. Both runs produce quite similar strongly H+-dominant distributions at the beginning of the second dip of the storm, with the strongest H+ dominance at low L shells. In the subsequent hours as the second recovery phase continues, however, the distributions show a changing ion composition, particularly near the inner edge of the ring current, where the deepest ion ring current access takes place inside L ∼ 2 near dawn. This population exhibits comparable H+ and O+ pressures and a narrow area where O+ dominates. While both runs produce a similar peak value of the O+/H+ pressure ratio, namely, about 6 (=0.78 log O+/H+ pressure ratio), the timing of these peak values and the duration of the O+ dominance are different for both runs. In the smoothed run, this peak value occurs at 1430 UT and the O+ dominance lasts until about 1945 UT, whereas in the unsmoothed run the peak occurs several hours later at 1815 UT and the O+ dominance lasts until about 2045 UT. The local time of the peak locations is also different, with the peak centered at MLT ∼4 for the smoothed run and at MLT ∼6.5 for the unsmoothed run. Moreover, the region of O+ dominance is slightly larger for the latter. All these differences are clearly seen in the plots of Log(Q) and become more significant as the second recovery phase progresses, with peak values of Log(Q) > 0.5 (a difference by a factor greater than 3) by 2000 UT. These differences follow from the differences discussed above on the O+ distributions in Figure 6, namely, the stronger dawnside skewing, and slower decay of the asymmetric O+ ring current for the unsmoothed run.
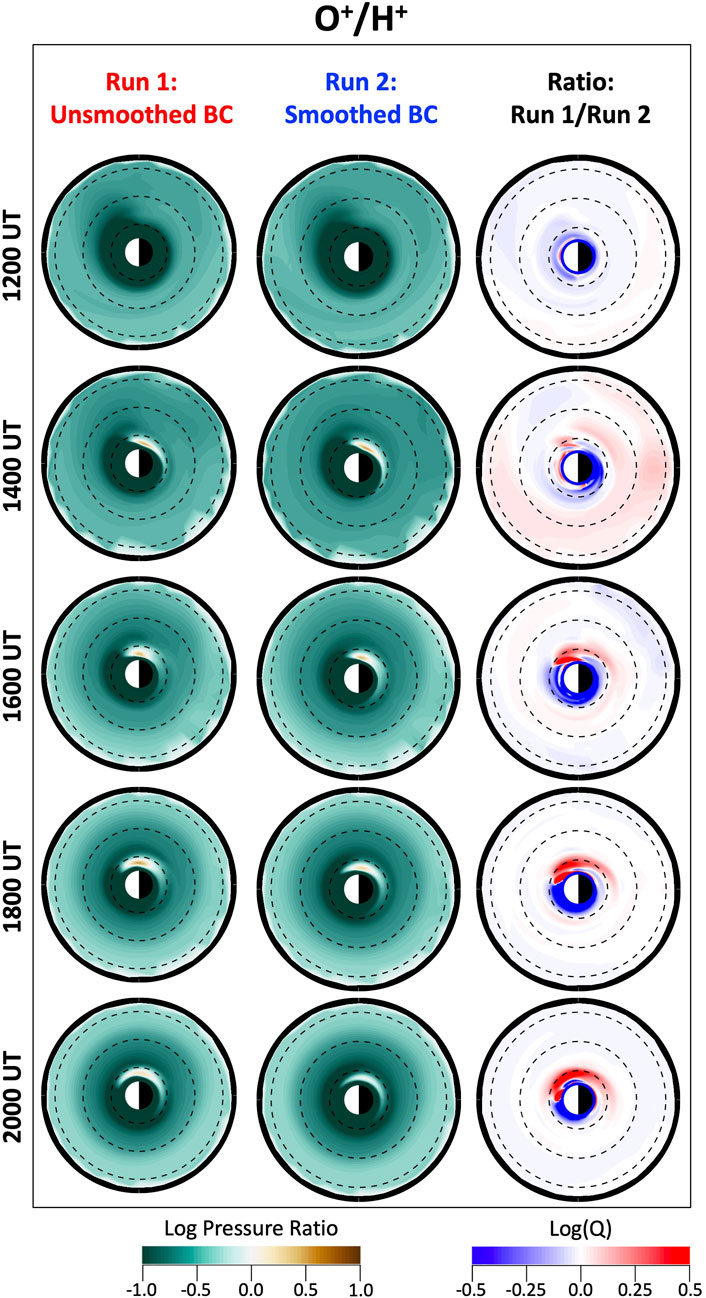
FIGURE 9. Equatorial maps of the simulated ring current O+/H+ pressure ratio during the second dip of the storm. O+/H+ pressure ratio distributions in the equatorial plane inside 7 RE for both simulation runs performed with the CIMI model as well as for the ratio of the O+/H+ pressure ratio from both runs for selected times between 1200 and 2000 UT on 8 September. The black dashed curves mark L shells of 2, 4 and 6 RE.
Since the ring current plays an important role in the coupling of the magnetosphere with the ionosphere, we further consider the impact of the ring current development on the broader magnetosphere and ionosphere. The magnetosphere-ionosphere (MI) coupling can take place via the generation of Region-2 FACs, which are the consequence of pressure gradients in the ring current, or via magnetospheric particle precipitation to the atmosphere (e.g., Vasyliunas, 1970; Wolf, 1970; Jaggi and Wolf, 1973; Blanc, 1988). These FACs are at the heart of the electrodynamic MI coupling. Here, however, we focus on another way MI coupling takes place, which is via transfer of heat flux from the heated plasmasphere down to the ionosphere along magnetic field lines (e.g., energetic coupling). This plasmaspheric heating occurs when ring current ions interact with the cold plasmaspheric particles via Coulomb collisions, transferring some of the ring current ion energy to the plasmaspheric particles. The energy deposited in the plasmaspheric particles is subsequently transported down to the subauroral ionosphere in the form of a heat flux where it produces significant electron temperature enhancements and the associated subauroral red (SAR) arcs (e.g., Fok et al., 1993; Kozyra et al., 1997). In addition, Fok et al. (1995) showed that O+ can be the main ring current ion species contributing to plasmasphere heating. In a follow-up study on this topic, Liemohn et al. (2000) found that the presence of O+, which is significantly enhanced during solar maximum, was responsible for the simulated large heating rates during the 4-7 June 1991 storm. Even though the 7-8 September 2017 storm occurred during the declining phase of the solar cycle, we have found that O+ played a critical role in the ring current development due to the effect of particle injections, and thus we evaluate the impact that the injections had on the plasmaspheric heating. Figure 10 shows the distributions of plasmaspheric electron and ion heating rates in the equatorial plane and at an altitude of 100 km in the northern ionosphere for both simulation runs. The heating rates shown are produced by the ring current H+ and O+ combined. It is helpful to bear in mind that the locations of the peak heating rate do not necessarily coincide with the locations of the ring current peak pressure in Figure 6. This is because the heating rate not only depends on the ring current intensity, but it is also proportional to the plasmaspheric density.
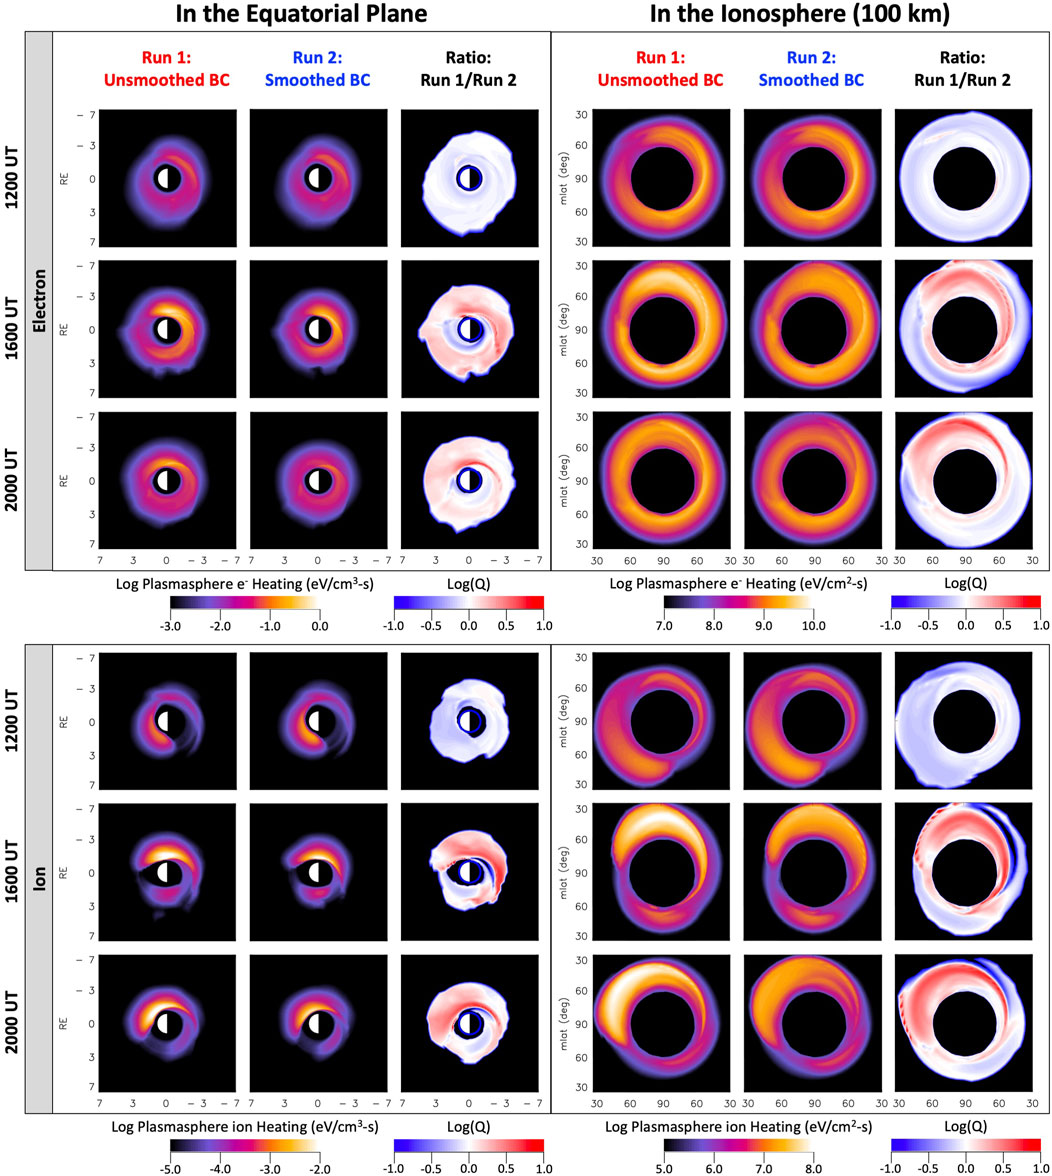
FIGURE 10. Equatorial plane and ionospheric maps of the simulated plasmaspheric heating rate during the second dip of the storm. Plasmaspheric (top) electron and (bottom) ion heating rate distributions (left) in the equatorial plane inside 7 RE and (right) in the northern ionosphere at an altitude of 100 km and at magnetic latitudes higher than 30° for both simulation runs performed with the CIMI model for three representative times, namely, 1200, 1600 and 2000 UT, on 8 September.
Figure 10 shows a significant difference in the plasmaspheric electron and ion heating rate distributions between both runs. We first consider the plasmasphere electron heating. At the beginning of the second dip of the storm, at 1200 UT, the heating rate distributions in the equatorial plane are quite similar for both runs, with peak heating rates located on the post-midnight sector and peak value slightly higher for the smoothed run. However, during the storm’s second dip some clear differences between both runs follow the patterns observed in the pressure distributions, namely, the region of peak heating rate extends further eastward toward dawn and the peak rate remains high for a longer period for the unsmoothed run. At 1600 UT, the dawnside skewing of the ring current pressure yields enhanced plasmaspheric heating rate on the post-midnight and dawn sectors for both runs. Even though this enhancement is similar in magnitude for both runs, with peak heating rate value of ∼1 eV cm-3 s-1, the region of peak heating rate is larger, and it extends farther eastward toward dawn for the unsmoothed run. Four hours later, at 2000 UT, as the ring current weakens, the heating rates also decrease for both runs, although the decrease is more significant for the smoothed run, with the peak heating rate up to 4 times lower than for the unsmoothed run (Log(Q) ∼ 0.6).
The heating rate distributions in the ionosphere illustrate the consequence to the subauroral ionosphere of the electron energy deposition rates of the distributions shown in the equatorial plane. We note that the heating rates displayed in the ionosphere are given in units of eV cm-2 s-1, that is units of power per unit area, different from the units in equatorial distributions of power per unit volume. This means that the heating rates in the ionosphere will be proportional to the rates at the equator scaled by the length of the magnetic field lines connecting the plasmasphere to the subauroral ionosphere. The overall distributions and dynamics of the heating rate in the ionosphere resemble those in the equatorial plane. At 1,600 and 2000 UT, the heating rate distributions for the unsmoothed run are skewed toward dawn but with significant energy deposition on the duskside and on the dayside as well. The region of strong energy deposition is located around MLAT = 60° near dusk and gradually at lower latitudes toward later local times and into the post-midnight sector, reaching as low as MLAT ∼35° on the dawnside. Compared to the unsmoothed run, the distributions for the smoothed run show overall weaker energy deposition. Also, the dawnside skewing does not last as long, which can be seen from the fact that by 2000 UT the peak heating rate has moved to the pre-midnight sector. Additionally, the region of peak heating rate on the dawnside extends to lower latitudes, down to MLAT ∼35°, for the unsmoothed run, as seen from the plots of Log(Q).
Even though most of the energy transferred from the ring current ions to the plasmasphere via Coulomb collisions is to the plasmaspheric electrons (Fok et al., 1991), owing to the significantly lower conductivity of ions, less energy deposition to the plasmaspheric ions can still have a significant impact on the ion temperature (Fok et al., 1993). Figure 10 shows that for the unsmoothed run, the maximum ion heating rate in the equatorial plane was of the order of 10−2 eV cm-3 s-1, about two orders of magnitude lower than that for electrons. Furthermore, in contrast with the plasmaspheric electron heating rate distributions, the distributions for ions in both runs are skewed toward the dayside throughout the second dip of the storm. At 1,600 and 2000 UT, the distributions for both runs remain strongly skewed toward dawn, although the smoothed run exhibits lower heating rates, a smaller region of peak heating rate, and a fainter dawnside skewing of the distribution. In the ionosphere, the ion energy deposition for the unsmoothed run is stronger across the dawnside by up to a factor of six (Log(Q) ∼ 0.8), and extends down to lower latitudes, as low as 30°, compared with the smoothed run.
4.4 Validation with Van Allen Probes observations
To assess the performance of the CIMI model during the storm and validate the modeling results, in this section we compare the simulated differential ion flux and electric field from both CIMI runs to Van Allen Probes observations. Figure 11A shows the orbital paths of RBSP-A and RBSP-B projected on the GSM X-Y plane during September 8th. The apogees of both spacecraft are located near MLT = 13, the orbits traversing mostly the dayside inner magnetosphere. Thus, both Van Allen Probes are unfortunately not well positioned to examine the regions of interest on the nightside, where the distributions of the ring current pressure and the electric field are enhanced. Nevertheless, with this comparison we seek to validate the overall performance of the model.
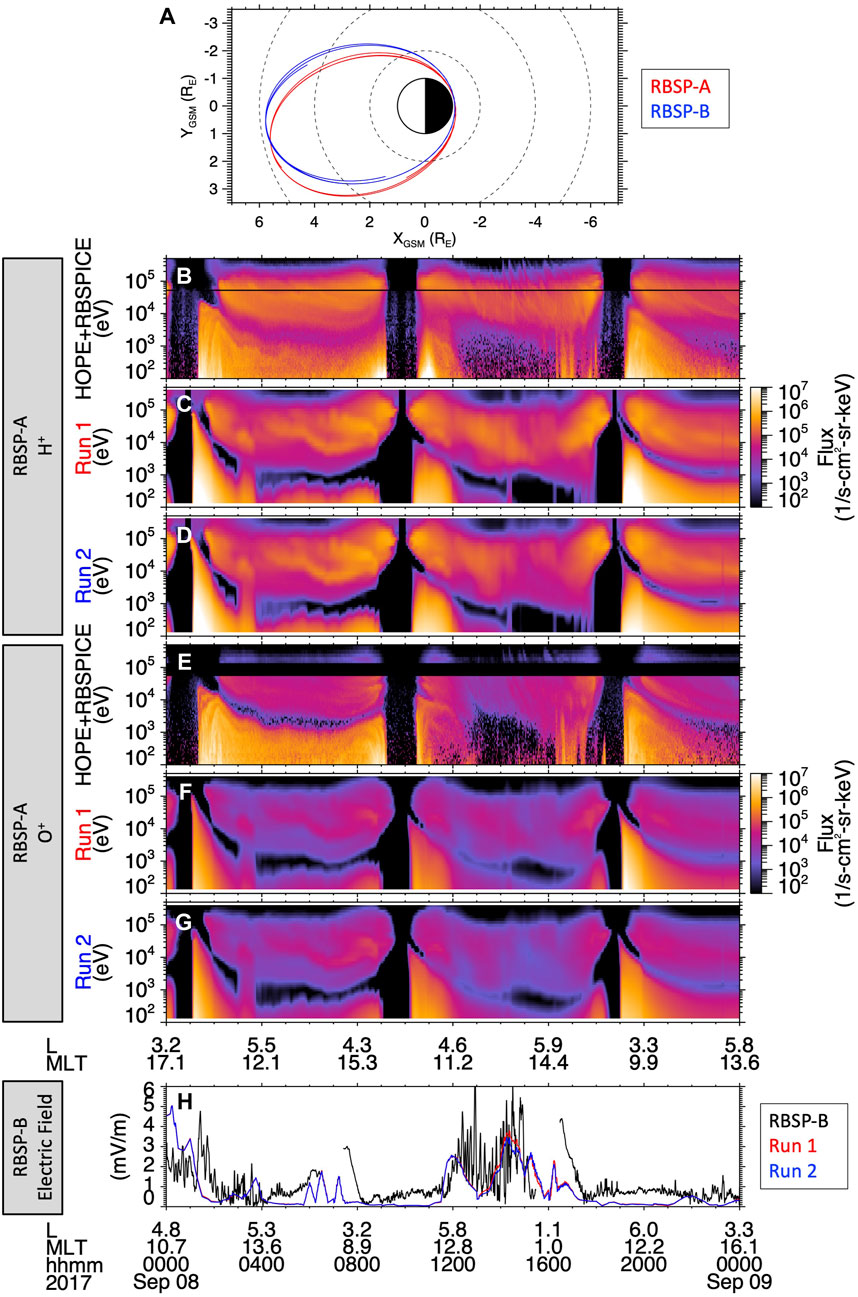
FIGURE 11. Comparison of observed and simulated H+ and O+ differential flux and electric field during the whole day on 8 September. (A) The orbital path of both Van Allen Probes in the GSM X-Y plane. Energy-time spectra of the H+ differential flux (B) measured by the HOPE and RBSPICE mass spectrometers onboard RBSP-A, and from (C) Run 1 and (D) Run 2 simulated with the CIMI model. (E–G) Similar to panels (B–D) but for O+. (H) Electric field measured by the EFW instrument onboard RBSP-B and from both simulation runs with the CIMI model.
Figures 11B-G show the comparison of the simulated H+ and O+ differential fluxes with those measured by the HOPE and RBSPICE instruments onboard RBSP-A during September 8th. We focus the comparison on the overall energy-L shell-MLT ion distributions as well as on the flux levels. First, the comparison shows that overall both CIMI runs capture the energy-L shell-MLT distribution of the observed ion populations. Due to the elliptical shape of the Van Allen Probes orbit as the satellites traverse a range of L shells in the inner magnetosphere, the measured energy-time ion spectra exhibit two main populations separated by a spectral gap or ion flux minimum. The first population at lower energies corresponds to the ions drifting eastward dominated by the ExB drift, and the second higher-energy population corresponds to the ions drifting westward dominated by the gradient-curvature drift (Korth et al., 1999; Friedel et al., 2001). The spectral gap separating these two populations in the spectrograms varies in energy along the satellite orbit, appearing at lower energies at higher L, and is the consequence of forbidden regions of ions with given energies at these locations and the significantly long ion drift times exceeding the ion lifetimes (e.g., Buzulukova et al., 2003; Ferradas et al., 2021). Both CIMI runs capture the general energy-, L shell-, and MLT-dependence of the two H+ and O+ populations and of the spectral gap. However, there are some discrepancies, the main one being the energy dependence of the spectral gap. Though the model reproduces the trends of the gap’s energy dependence, the minimum flux of the modeled gap is at a lower energy during the first orbit and part of the second. This might indicate that the electric field is not at the right intensity or configuration during these periods on the dayside. Even so, during the last part of the second orbit and during the third orbit, the energy of the spectral gap matches the observations reasonably well.
Second, we consider the flux intensity in the comparison with the observed H+ and O+ fluxes. In general, the flux intensities from both runs are very similar, especially at high L values, when the satellite traverses the dayside, where the ring current distributions are more alike (Figure 6). Both runs do a good job at reproducing the energy dependence of the fluxes of both ion species over the three orbits, that is, the higher fluxes of the low-energy population and the lower fluxes of the high-energy population, especially at low L shells. Moreover, both runs capture the dynamics of the H+ and O+ flux levels in the low-energy population, that is, their measured decrease from the first orbit to the second and subsequent increase from the second orbit to the third. This latter flux enhancement comes after the period of particle injections during the second dip of the storm. This data-model comparison also yields some discrepancies, a notorious one being the underestimation of the O+ fluxes for both the low-energy and high-energy populations. One possible cause for this is that CIMI underestimates the O+/H+ ratio at the model outer boundary, which is given by the relation provided by Young et al. (1982) that depends on Kp and F10.7. Another possible source of this discrepancy is hinted at by the ion pitch angle distributions (PADs). An examination of the measured PADs (not shown) show that the low-energy and high-energy populations have distinct PADs (e.g., Yue et al., 2017), where the low-energy populations have PADs that are predominantly field-aligned at high L shells and become progressively isotropic and perpendicular toward low L shells. The parallel component at these energies is much stronger for O+ than for H+ and indicates that these ions are of ionospheric source. The high-energy populations, on the other hand, display PADs that are perpendicular, with signatures of ions freshly transported from the nightside plasma sheet possessing more isotropic distributions. Since in our model the only source is the nightside plasma sheet, it is possible that the model does not account for ions that have reached the location of the satellite directly from the ionosphere. Even though it is generally understood that the main source of warm and energetic plasma in the inner magnetosphere is the nightside plasma sheet, there has been evidence that under disturbed conditions direct access from the ionosphere can occur (Delcourt et al., 1994; Wodnicka and Banaszkiewicz, 1997; Gkioulidou et al., 2019).
Finally, Figure 11H shows the comparison between the modeled and the observed electric field along the RBSP-B orbit, where the observed electric field has been smoothed with a 3 min running window. For the electric field, we use measurements from RBSP-B instead of RBSP-A because starting in late Spring of 2016 the DC electric field data quality for RBSP-A is often unreliable due to degradation of the preamplifiers in some of the EFW instrument booms. During the second dip of the storm between 1,200 and 1500 UT, EFW measured large amplitude electric fields exceeding 5 mV/m. A closer look at the electric and magnetic field measurements (not shown) shows the presence of waves in two frequency ranges, corresponding to 10-180 s and 5-15 min. Further analysis beyond the scope of this paper is required to investigate the nature and impact of these waves on the different plasma populations, e.g., on the plasmasphere and the ring current. However, it is worth noting that even though the IMF BZ component was stronger during the first dip of the storm than during the second dip, the observed electric field is overall stronger during the second dip of the storm. By and large, both runs represent the measured electric field very well, with the main exception of the periods around perigee, where measuring the electric field accurately becomes challenging due to the relatively strong electric fields induced by the rapid motion of the spacecraft. Both runs capture the main time variations in the strength of the electric field from orbit to orbit, the decrease throughout the first orbit, the sudden increase over the second orbit, during the second dip of the storm, and the subsequent decline during the third orbit.
5 Discussion
In this study, we have investigated how the particle injections that occurred during the second dip of the ICME-driven storm of 7–8 September 2017 affected the ring current development. To achieve this, our analysis consisted of simulations with the CIMI kinetic model with a realistic, temporally and spatially varying data-driven outer BC at geosynchronous orbit defined by measurements from LANL and GOES-R satellites. The observations from the geosynchronous satellites captured the highly disturbed conditions during the second dip of the storm as evidenced by substorm-associated particle injections. Therefore, to isolate the effect that the particle injections had on the ring current development, we performed two simulation runs with different data-driven outer BC. Run 1 includes a BC defined by particle flux measurements at their original time cadence of about 1.5 min. This BC captures the short-timescale, localized features associated with the particle injections. Run 2 includes the same data-driven BC but smoothed in time with a 2-h smoothing window. This smoothed BC captures the realistic density levels and energy distributions of the source population but without the short-timescale, localized dynamics of particle injections. Thus, the comparison between these two runs exposes the effects of the short-timescale and localized nature of particle injections on the ring current development. This section discusses some of the main findings of the present study.
Before discussing the comparison between the simulation runs, we point out that even though the data-driven BC is a new feature of the CIMI model, the basic idea of using measurements to define the outer BC in inner magnetosphere simulations is not new. For instance, BCs defined by measurements of the plasma sheet density and temperature from different sources where the particle energy distribution was assumed to have a functional form, such as a Kappa or Maxwellian distribution, were used by several studies (e.g., Jordanova et al., 1998; Kozyra et al., 1998; Liemohn et al., 2001; Ebihara et al., 2005a; Ebihara et al., 2009; Chen et al., 2015). However, such a characterization often departs significantly from the real particle source spectrum (Åsnes et al., 2008; Espinoza et al., 2018). These and other studies, however, have highlighted the important role of the plasma sheet density in the ring current buildup (Kozyra and Liemohn, 2003; Ebihara et al., 2005b). Moreover, recent studies have addressed the role of the outer BC on the modeling of ring current dynamics. A recent study of the parameters controlling the electron ring current dynamics performed a sensitivity analysis of different processes, including changes in the BC, and found that the impact of the variance in the BC was confined to high L shells, near the boundary, whereas the electron lifetimes had a much more significant effect (Haas et al., 2022). Another recent study introduced an improved BC to simulate the electron ring current fluxes with the RAM-SCB kinetic model coupled with the BATS-R-US MHD code, where an empirically derived model of electron fluxes at geosynchronous orbit was used to better characterize the <40 keV electron fluxes at the model outer boundary (Denton et al., 2015; Denton et al., 2016; Denton et al., 2019). They found that the new BC enhanced the accuracy of the simulated electron fluxes inside geosynchronous orbit, especially in the outer region (L > 4) (Yu et al., 2022). Nevertheless, modeling efforts employing a temporally and spatially varying data-driven BC to address the role of particle injections on the ring current development are missing.
The first finding from this study is that the unsmoothed run produced a stronger ring current than the smoothed run. This result of an evident effect of particle injections on the ring current buildup is not new although it contrasts previous results that also assessed this effect. The disagreements, however, are reasonable when considering the different methods in modeling the substorm-associated particle injections. Fok et al. (1996) represented a series of substorm injections by stretching and collapsing the magnetic field lines in their simulations to assess their effect on the ring current development. They further used H+ measurements from the Active Magnetospheric Particle Tracer Explorer-Charge Composition Explorer (AMPTE-CCE) at L ∼ 6.75 with a time cadence of 16 h to define the model outer BC and found that the RCE did not change significantly due to the substorm-associated activity. In a subsequent effort, Fok et al. (1999) improved their representation of the model outer BC by using a 3D test particle code to backtrack particles from a representative distribution grid to a source region at L = 12. This provided particle distributions to the inner magnetosphere that were more realistically influenced by substorm activity in the plasma sheet. When the modeled substorm activity was accompanied by strong convection during storm periods, their simulations yielded a stronger ring current. These results suggest that an accurate representation of the changes in the plasma sheet source associated with substorm particle injections, including their short timescales, are critical to assessing their effect on the ring current dynamics. Another more recent study by Liemohn et al. (2011) tested the necessity of transient spikes in the storm time ring current model outer BC by applying three smoothing window sizes, namely, 20 min, 1 h, and 3 h, to their data-driven model outer BC. They found that the RCE increased slightly with increased smoothing window size, contrary to the findings of the present study. However, the findings from the two studies can be reconciled by considering the different approach in defining the outer BC. Liemohn et al. (2011) used a spatially uniform BC, employing data from the geosynchronous satellite that measured the highest hot ion density among those satellites that were close to midnight MLT. This implies that during the times when the smoothed density at the boundary was higher than the unsmoothed density, the higher density value was applied to the entire boundary. Thus, these periods had a significant effect on the model by providing a stronger source population to the ring current over the entire nightside. On the other hand, the present study uses a spatially varying BC, employing data from multiple geosynchronous satellites. Thus, any density enhancements in the smoothed BC over the unsmoothed BC are not necessarily applied to the whole outer boundary, but they can be localized enhancements, according to the measurements from each satellite. Furthermore, Liemohn et al. (2011) also ran a different set of simulations, where the model outer BC was smoothed by despiking the measured density instead of averaging it. That is, the minimum value within the smoothing window was utilized to build the model outer BC rather than the average value. The reduced densities in this set of runs naturally yielded a reduction in the RCE, and this reduction was more significant with increasing smoothing window size, consistent with the results from the present study. The comparison between the Liemohn et al. (2011) study and the present study suggests that the effects of a spatially varying BC are significant.
Another relevant study by Yang et al. (2016) quantified the effects of bubble injections on the ring current development using the RCM-E model and found the effect to be minor partly because the dominant effect of the gradient-curvature drift in the inner magnetosphere helped the bubbles blend into the background. However, their simulations relied on analytically generated bubbles, which represents a limitation in their model when comparing with observations, although their setup of the magnetic and electric fields were consistent with that of bubbles. The present study, on the other hand, has the advantage of using particle fluxes taken directly from measurements and thus the characterization of particle injections is more realistic. However, the limitations of our model come from the use of empirically derived models to determine the electric field at the model outer boundary and the magnetic field throughout the simulation domain, whereas these were more self-consistently derived in the Yang et al. (2016) study. The use of an empirical magnetic field model implies that our model does not capture the effects from magnetic field reconfigurations during substorms, i.e., the induced impulsive electric fields associated with injections. Instead, our model captures the effects of the electric coupling between the magnetosphere and ionosphere via field aligned currents, which are generated by the pressure gradients of ring current particles and affect the ionospheric potential. Even though these are limitations of the model used, they do not necessarily represent limitations for the present study, since our objective is to quantify the pure effect of the realistic BC from geosynchronous measurements on the ring current development while keeping the electric and magnetic fields the same. Another possible limitation in our model is the ability of the outer BC to resolve the MLT extent of particle injections. The injections introduced in the model have an azimuthal extent comparable to the spacecraft separation, that is ∼4 h in MLT. This is within the of 2–5 RE scale size range of fast flow channels associated with bubble injections reported by several studies using measurements from a variety of satellite missions (e.g., Angelopoulos et al., 1997; Kauristie et al., 2000; Nakamura et al., 2001; Nakamura et al., 2004). Still, it remains to be tested whether increasing the MLT resolution of the BC (by, for example, increasing the number of geosynchronous satellites) has significant effects on the ring current development. In consideration of the differences in the model and model setup, and the associated limitations in each model, the comparison between our results and those from the Yang et al. (2016) study further emphasizes the importance and impact of a realistic model BC. Furthermore, the impact of particle injections could have been greater if, alongside a realistic data-driven BC, a self-consistent magnetic field model was used. A second finding from this study is that the unsmoothed run produced a strong dawnside skewing of the H+ and O+ partial ring current distribution, as seen from the dawnward skewing of the region of peak pressure, as well as a longer-lasting O+ partial ring current that delayed the formation of the symmetric ring current. These features of MLT asymmetry in the ring current distribution are most likely the consequence of differences in the distribution and strength of the electric field. Since the electric field plays a key role in the ion transport and energization, it is especially significant that the unsmoothed run produced overall stronger electric fields than the smoothed run. The substorm-associated particle injections observed at geosynchronous orbit, captured by the unsmoothed BC, were responsible for these enhanced electric fields. During the second dip of the storm, when strong auroral activity and several particle injections were observed, the electric field was intensified significantly on the nightside and predominantly on the post-midnight sector for several hours. This resulted in both H+ and O+ injected from the nightside plasma sheet reaching deeper into the inner magnetosphere on the dawnside. Similar electric field enhancements associated with substorm activity and their effect displacing particle populations in the inner magnetosphere have been reported before. For example, Ganushkina et al. (2000) and Ganushkina et al. (2001) found in their simulations that large-scale convective electric fields alone could not reproduce the formation of intense ion nose structures, but impulsive electric fields associated with substorm activity were necessary.
These strong electric fields on the post-midnight sector associated with the particle injections can also be responsible for the severe erosion of the plasmasphere observed to occur progressively by the Arase satellite during the second main phase of the storm and after the second recovery phase starts (not shown). Obana et al. (2019) found that the plasmasphere erosion was related to the penetration of the convection electric field during this period lasting for several hours, as evidenced by dynamic variations of the equatorial electrojet (EEJ). They further suggested that the observed high-frequency variations could be caused by substorms. Our simulation results support their findings and further suggest that the substorm-associated particle injections were responsible for the enhanced electric field, which likely caused the severe plasmasphere erosion.
Another finding is that the particle injections affected the ring current ion composition, especially near the inner edge of the ring current. The enhanced electric field distribution and modified electric potential pattern in the unsmoothed run, further implies that the energy-dependent drift access to the inner magnetosphere was also modified, changing the ion distributions, as already discussed above. These distributions, in the absence of ion losses, should be the same for different ion species. However, since the ion lifetimes due to charge exchange losses are species dependent, the resultant H+ and O+ distributions are different, especially at low L shells, where ions take longer to access and thus the effects of charge exchange are more notorious. More specifically, in both runs the longer O+ charge exchange lifetimes at energies below ∼50 keV compared to H+ (e.g., Smith and Bewtra, 1978; Ferradas et al., 2015) brought about a O+ dominance near the inner edge of the ring current. Moreover, in this particular storm we have seen that one of the effects of the particle injections observed during the second dip of the storm in the unsmoothed run was the stronger skewing of the ring current distribution toward the dawnside, where deep ion access was observed. Consequently, the global O+/H+ pressure ratio distributions for the unsmoothed run show that the O+/H+ pressure ratio remained larger than one for a longer period at the low L shells, where the deepest access occurred, indicating a more strongly O+-dominant ring current. Conversely, in both the unsmoothed and smoothed runs, the model underestimated the O+ fluxes at all energies, but especially at low energies, as can be seen from the comparison with the Van Allen Probes measurements. Two possible explanations for this might be that the model underestimates the O+/H+ ratio at the outer boundary or that the assumption that the energy distributions of both ion species at the outer boundary are the same is not correct. Since the LANL and GOES-R particle instruments used to define the data-driven BC in the model do not discriminate ion species, the energy distributions for both ion species at the model outer boundary were assumed to be the same. However, Geotail observations of the energy spectra of different ion species in the near-Earth plasma sheet during several geomagnetic storms have shown that different ions do not necessarily have equivalent energy distributions (Pandya et al., 2018). This result stresses the importance of mass spectrometers, such as HOPE and RBSPICE, that distinguish ion mass and provide information about the plasma ion composition.
Finally, due to the role that the ring current plays in MI coupling, the modeled effects of particle injections on the ring current development also had an impact on the plasmasphere and the ionosphere. The ring current ions effectively transferred energy to the cold plasmaspheric ions and electrons via Coulomb collisions, which in turn transferred energy to the ionosphere in the form of a heat flux. Since the unsmoothed run produced a stronger skewing of the ring current ions toward dawn, this resulted in stronger plasmaspheric heating especially on the dawnside and on the pre-noon sector, where the heating rates prevailed for a longer period. Consequently, in the ionosphere the energy deposition extended to lower latitudes and was more significant in these MLT sectors. Moreover, the impact on plasmaspheric heating was observed to be more significant on the ions than on the electrons.
6 Conclusion
We have studied the effects of substorm-associated particle injections on the ring current development during the second dip of the storm of 7–8 September 2017. Simulations with the CIMI model indicate that particle injections had a significant and broad effect on the ring current development and its coupling to the plasmasphere and ionosphere. These effects are evident from the comparison between the unsmoothed and smoothed simulation runs and are summarized as follows.
1. The particle injections contributed to a stronger ring current, evidenced by increasing the total RCE at the peak of the second dip of the storm by 15% (Figure 5).
2. As the ring current evolved, the H+ and O+ asymmetric ring current exhibited a stronger dawnside skewing and the O+ ring current remained asymmetric for a longer period, slowing down the development of an O+ symmetric ring current (Figures 6, 7). This was the result of changes in the convection potential pattern and enhanced electric field in the post-midnight and dawn sectors (Figure 8), which allowed for a deeper dawnside ion access. In turn, the modified potential and enhanced electric field were the direct consequence of the short-timescale, localized particle injections captured by the model outer BC in the unsmoothed run.
3. As the modified potential pattern and enhanced electric fields effectively modified the ion distributions, the species- and energy-dependent charge exchange losses affected the ring current ion composition, producing an overall higher abundance of O+. Moreover, the region of O+ dominance at the low L shells near dawn was larger and the O+ dominance lasted longer (Figure 9).
4. The effects on the ring current development mentioned previously further impacted the plasmaspheric heating (Figure 10). The plasmaspheric electron and ion heating rates were significantly higher especially on the dawnside and the region where this energy deposition occurred extended farther inward. Furthermore, the period of enhanced plasmaspheric heating lasted longer. Consequently, in the ionosphere the energy deposition was stronger and extended to lower latitudes on the dawnside.
Data availability statement
The datasets presented in this study can be found in online repositories. The names of the repository/repositories and accession number(s) can be found below: https://doi.org/10.5281/zenodo.7328829.
Author contributions
CF: Conceptualization, Formal Analysis, Investigation, Methodology, Software, Validation, Visualization, Writing–original draft, Writing–review and editing. M-CF: Conceptualization, Formal Analysis, Investigation, Methodology, Software, Writing–review and editing. NM: Conceptualization, Formal Analysis, Investigation, Methodology, Writing–review and editing. MH: Data curation, Formal Analysis, Investigation, Methodology, Writing–review and editing. SC: Data curation, Formal Analysis, Investigation, Methodology, Writing–review and editing. ST: Data curation, Formal Analysis, Investigation, Methodology, Writing–review and editing. BK: Data curation, Formal Analysis, Investigation, Methodology, Writing–review and editing.
Funding
The author(s) declare financial support was received for the research, authorship, and/or publication of this article. This material is based upon work supported by the National Aeronautics and Space Administration under Grant No. 80NSSC21K0584 issued through the Heliophysics Guest Investigator (H-GI) Open Program. The work of MF was supported by the NASA H-GI Open Program under Work Breakdown Structure (WBS) 955518.02.01.07.90. The work of SC was supported by NSF grant number AGS 2140934.
Acknowledgments
The authors would like to acknowledge the LANL MPA, SOPA, and ESP, the GOES-R MPS-LO and MPS-HI, and the Van Allen Probes HOPE, RBSPICE, and EFW instrument teams for providing the data utilized in this study. CF would like to thank Donald Fairfield for insightful discussions.
Conflict of interest
The authors declare that the research was conducted in the absence of any commercial or financial relationships that could be construed as a potential conflict of interest.
The author(s) declared that they were an editorial board member of Frontiers, at the time of submission. This had no impact on the peer review process and the final decision.
Publisher’s note
All claims expressed in this article are solely those of the authors and do not necessarily represent those of their affiliated organizations, or those of the publisher, the editors and the reviewers. Any product that may be evaluated in this article, or claim that may be made by its manufacturer, is not guaranteed or endorsed by the publisher.
References
Akasofu, S. I., DeForest, S., and McIlwain, C. (1974). Auroral displays near the foot of the field line of the ATS-5 satellite. Planet. Space Sci. 22 (1), 25–40. doi:10.1016/0032-0633(74)90121-4
Angelopoulos, V., Baumjohann, W., Kennel, C. F., Coroniti, F. V., Kivelson, M. G., Pellat, R., et al. (1992). Bursty bulk flows in the inner central plasma sheet. J. Geophys. Res. 97 (A4), 4027–4039. doi:10.1029/91JA02701
Angelopoulos, V., Phan, T. D., Larson, D. E., Mozer, F. S., Lin, R. P., Tsuruda, K., et al. (1997). Magnetotail flow bursts: association to global magnetospheric circulation, relationship to ionospheric activity and direct evidence for localization. Geophys. Res. Lett. 24 (18), 2271–2274. doi:10.1029/97GL02355
Åsnes, A., Friedel, R. W. H., Lavraud, B., Reeves, G. D., Taylor, M. G. G. T., and Daly, P. (2008). Statistical properties of tail plasma sheet electrons above 40 keV. J. Geophys. Res. Space Phys. 113 (A3), 3202. doi:10.1029/2007JA012502
Axford, W. I. (1969). Magnetospheric convection. Rev. Geophys. 7 (1–2), 421–459. doi:10.1029/RG007i001p00421
Balsiger, H., Eberhardt, P., Geiss, J., and Young, D. T. (1980). Magnetic Storm Injection of 0.9- to 16-keV/e Solar and Terrestrial Ions Into the High-Altitude Magnetosphere. J. Geophys. Res. 85, 1645–1662. A4. doi:10.1029/ja085ia04p01645
Bame, S. J., McComas, D. J., Thomsen, M. F., Barraclough, B. L., Elphic, R. C., Glore, J. P., et al. (1993). Magnetospheric plasma analyzer for spacecraft with constrained resources. Rev. Sci. Instrum. 64 (4), 1026–1033. doi:10.1063/1.1144173
Baumjohann, W., Tz Paschmann, G., and Jhr, H. L. (1990). Characteristics of high-speed ion flows in the plasma sheet. J. Geophys. Res. Space Phys. 95, 3801–3809. A4. doi:10.1029/JA095IA04P03801
Belian, R. D., Gisler, G. R., Cayton, T., and Christensen, R. (1992). High-Z energetic particles at geosynchronous orbit during the great solar proton event series of october 1989. J. Geophys. Res. Space Phys. 97, 16897–16906. A11. doi:10.1029/92JA01139
Birn, J., Thomsen, M. F., Borovsky, J. E., Reeves, G. D., McComas, D. J., and Belian, R. D. (1997). Characteristic plasma properties during dispersionless substorm injections at geosynchronous orbit. J. Geophys. Res. Space Phys. 102, 2309–2324. A2. doi:10.1029/96JA02870
Blanc, M. (1988). Magnetosphere-ionosphere coupling. Comput. Phys. Commun. 49 (1), 103–118. doi:10.1016/0010-4655(88)90219-6
Boudouridis, A., Rodriguez, J. V., Kress, B. T., Dichter, B. K., and Onsager, T. G. (2020). Development of a bowtie inversion technique for real-time processing of the GOES-16/-17 SEISS MPS-HI electron channels. Space weather. 18 (4). doi:10.1029/2019SW002403
Buzulukova, N. Y., Kovrazhkin, R. A., Glazunov, A. L., Sauvaud, J. A., Ganushkina, N. Y., and Pulkkinen, T. I. (2003). Stationary nose structures of protons in the inner magnetosphere: observations by the ION instrument onboard the Interball-2 satellite and modeling. Cosmic Res. 41 (1), 3–12. doi:10.1023/a:1022343327565
Califf, S., Li, X., Blum, L., Jaynes, A., Schiller, Q., Zhao, H., et al. (2014). THEMIS measurements of quasi-static electric fields in the inner magnetosphere. J. Geophys. Res. Space Phys. 119 (12), 9939–9951. doi:10.1002/2014JA020360
Chen, M. W., Lemon, C. L., Guild, T. B., Keesee, A. M., Lui, A., Goldstein, J., et al. (2015). Effects of modeled ionospheric conductance and electron loss on self-consistent ring current simulations during the 5–7 April 2010 storm. J. Geophys. Res. Space Phys. 120 (7), 5355–5376. doi:10.1002/2015JA021285
Chen, M. W., Lyons, L. R., and Schulz, M. (1994). Simulations of phase space distributions of storm time proton ring current. J. Geophys. Res. 99, 5745–5759. A4. doi:10.1029/93ja02771
Chen, M. W., Schulz, M., and Lyons, L. R. (1997). Modeling of ring current formation and decay: a review. Geophys. Monogr. Ser. 98, 173–186. doi:10.1029/GM098P0173
Chen, M. W., Schulz, M., Lyons, L. R., and Gorney, D. J. (1993). Stormtime transport of ring current and radiation belt ions. J. Geophys. Res. Space Phys. 98, 3835–3849. A3. doi:10.1029/92JA02608
Daglis, I. A., Thorne, R. M., Baumjohann, W., and Orsini, S. (1999). The terrestrial ring current: origin, formation, and decay. Rev. Geophys. 37 (4), 407–438. doi:10.1029/1999RG900009
Delcourt, D. C., Moore, T. E., and Chappell, C. R. (1994). Contribution of low-energy ionospheric protons to the plasma sheet. J. Geophys. Res. Space Phys. 99 (A4), 5681–5689. doi:10.1029/93JA02770
Denton, M. H., Henderson, M. G., Jordanova, V. K., Thomsen, M. F., Borovsky, J. E., Woodroffe, J., et al. (2016). An improved empirical model of electron and ion fluxes at geosynchronous orbit based on upstream solar wind conditions. Space weather. 14 (7), 511–523. doi:10.1002/2016SW001409
Denton, M. H., Taylor, M. G. G. T., Rodriguez, J. V., and Henderson, M. G. (2019). Extension of an empirical electron flux model from 6 to 20 Earth radii using cluster/RAPID observations. Space weather. 17 (5), 778–792. doi:10.1029/2018SW002121
Denton, M. H., Thomsen, M. F., Jordanova, V. K., Henderson, M. G., Borovsky, J. E., Denton, J. S., et al. (2015). An empirical model of electron and ion fluxes derived from observations at geosynchronous orbit. Space weather. 13 (4), 233–249. doi:10.1002/2015SW001168
Dessler, A. J., and Parker, E. N. (1959). Hydromagnetic theory of geomagnetic storms. J. Geophys. Res. 64 (12), 2239–2252. doi:10.1029/jz064i012p02239
Dichter, B. K., Galica, G. E., McGarity, J. O., Tsui, S., Golightly, M. J., Lopate, C., et al. (2015). Specification, design, and calibration of the space weather suite of instruments on the NOAA GOES-R Program spacecraft. IEEE Trans. Nucl. Sci. 62 (6), 2776–2783. doi:10.1109/TNS.2015.2477997
Ebihara, Y., and Ejiri, M. (2000). Simulation study on fundamental properties of the storm-time ring current. J. Geophys. Res. 105, 15843–15859. A7. doi:10.1029/1999ja900493
Ebihara, Y., Fok, M.-C., Sazykin, S., Thomsen, M. F., Hairston, M. R., Evans, D. S., et al. (2005a). Ring current and the magnetosphere-ionosphere coupling during the superstorm of 20 November 2003. J. Geophys. Res. Space Phys. 110, 9–22. A9. doi:10.1029/2004JA010924
Ebihara, Y., Fok, M.-C., Wolf, R. A., Thomsen, M. F., and Moore, T. E. (2005b). Nonlinear impact of plasma sheet density on the storm-time ring current. J. Geophys. Res. Space Phys. 110, 2208. A2. doi:10.1029/2004JA010435
Ebihara, Y., Nishitani, N., Kikuchi, T., Ogawa, T., Hosokawa, K., Fok, M.-C., et al. (2009). Dynamical property of storm time subauroral rapid flows as a manifestation of complex structures of the plasma pressure in the inner magnetosphere. J. Geophys. Res. Space Phys. 114. A1. doi:10.1029/2008JA013614
Espinoza, C. M., Stepanova, M., Moya, P. S., Antonova, E. E., and Valdivia, J. A. (2018). Ion and electron κ distribution functions along the plasma sheet. Geophys. Res. Lett. 45 (13), 6362–6370. doi:10.1029/2018GL078631
Ferradas, C. P., Reeves, G. D., Larsen, B. A., Skoug, R. M., Zhang, J.-C., Funsten, H. O., et al. (2021). The effects of the location and the timing of local convection electric field enhancements in the formation of ion multiple-nose structures. J. Atmos. Solar-Terrestrial Phys. 216, 105534. doi:10.1016/j.jastp.2020.105534
Ferradas, C. P., Zhang, J.-C., Kistler, L. M., and Spence, H. E. (2015). Heavy-ion dominance near Cluster perigees. J. Geophys. Res. Space Phys. 120 (12), 10,485–10,505. doi:10.1002/2015JA021063
Fok, M.-C., Buzulukova, N. Y., Chen, S. H., Glocer, A., Nagai, T., Valek, P., et al. (2014). The comprehensive inner magnetosphere-ionosphere model. J. Geophys. Res. A Space Phys. 119 (9), 7522–7540. doi:10.1002/2014JA020239
Fok, M.-C., Craven, P. D., Moore, T. E., and Richards, P. G. (1995). Ring current-plasmasphere coupling through Coulomb collisions, 161–171. doi:10.1029/GM093P0161
Fok, M.-C., Glocer, A., Zheng, Q., Horne, R. B., Meredith, N. P., Albert, J. M., et al. (2011). Recent developments in the radiation belt environment model. J. Atmos. Solar-Terrestrial Phys. 73 (11–12), 1435–1443. doi:10.1016/J.JASTP.2010.09.033
Fok, M.-C., Horne, R. B., Meredith, N. P., and Glauert, S. a. (2008). Radiation Belt Environment model: application to space weather nowcasting. J. Geophys. Res. 113, 1–12. doi:10.1029/2007JA012558
Fok, M.-C., Kang, S.-B., Ferradas, C. P., Buzulukova, N. B., Glocer, A., and Komar, C. M. (2021). New developments in the comprehensive inner magnetosphere-ionosphere model. J. Geophys. Res. Space Phys. 126 (4), e2020JA028987. doi:10.1029/2020ja028987
Fok, M.-C., Kozyra, J. U., Nagy, a. F., and Cravens, T. E. (1991). Lifetime of ring current particles due to coulomb collisions in the plasmasphere. J. Geophys. Res. 96 (90), 7861–7867. doi:10.1029/90JA02620
Fok, M.-C., Kozyra, J. U., Nagy, A. F., Rasmussen, C. E., and Khazanov, G. V. (1993). Decay of equatorial ring current ions and associated aeronomical consequences. J. Geophys. Res. Space Phys. 98, 19381–19393. A11. doi:10.1029/93JA01848
Fok, M.-C., and Moore, T. E. (1997). Ring current modeling in a realistic magnetic field configuration. Geophys. Res. Lett. 24 (14), 1775–1778. doi:10.1029/97GL01255
Fok, M.-C., Moore, T. E., and Delcourt, D. C. (1999). Modeling of inner plasma sheet and ring current during substorms. J. Geophys. Res. 104, 14557–14569. A. doi:10.1029/1999JA900014
Fok, M.-C., Moore, T. E., and Greenspan, M. E. (1996). Ring current development during storm main phase. J. Geophys. Res. Space Phys. 101, 15311–15322. A7. doi:10.1029/96JA01274
Fok, M.-C., Wolf, R. A., Spiro, R. W., and Moore, T. E. (2001). Comprehensive computational model of Earth’s ring current. J. Geophys. Res. 106, 8417–8424. A5. doi:10.1029/2000JA000235
Forsyth, C., Rae, I. J., Coxon, J. C., Freeman, M. P., Jackman, C. M., Gjerloev, J., et al. (2015). A new technique for determining substorm onsets and phases from indices of the electrojet (SOPHIE). J. Geophys. Res. Space Phys. 120 (12), 10,592–10,606. doi:10.1002/2015JA021343
Friedel, R. H. W., Korth, H., Henderson, M. G., Thomsen, M. F., and Scudder, J. D. (2001). Plasma sheet access to the inner magnetosphere. J. Geophys. Res. 106, 5845–5858. A4. doi:10.1029/2000JA003011
Gabrielse, C., Angelopoulos, V., Runov, A., and Turner, D. L. (2014). Statistical characteristics of particle injections throughout the equatorial magnetotail. J. Geophys. Res. Space Phys. 119 (4), 2512–2535. doi:10.1002/2013JA019638
Ganushkina, N. Y., Amariutei, O. A., Shprits, Y. Y., and Liemohn, M. W. (2013). Transport of the plasma sheet electrons to the geostationary distances. J. Geophys. Res. Space Phys. 118 (1), 82–98. doi:10.1029/2012JA017923
Ganushkina, N. Y., Pulkkinen, T. I., Bashkirov, F., Baker, D. N., and Li, X. (2001). Formation of intense nose structures. Geophys. Res. Lett. 28 (3), 491–494. doi:10.1029/2000gl011955
Ganushkina, N. Y., Pulkkinen, T. I., and Fritz, T. (2005). Role of substorm-associated impulsive electric fields in the ring current development during storms. Ann. Geophys. 23 (2), 579–591. doi:10.5194/angeo-23-579-2005
Ganushkina, N. Y., Pulkkinen, T. I., Milillo, A., and Liemohn, M. (2006). Evolution of the proton ring current energy distribution during 21-25 April 2001 storm. J. Geophys. Res. Space Phys. 111 (11), 1–15. doi:10.1029/2006JA011609
Ganushkina, N. Y., Pulkkinen, T. I., Sergeev, V. A., Kubyshkina, M. V., Baker, D. N., Turner, N. E., et al. (2000). Entry of plasma sheet particles into the inner magnetosphere as observed by Polar/CAMMICE. J. Geophys. Res. 105, 25205–25219. A11. doi:10.1029/2000JA900062
Gkioulidou, M., Ohtani, S., Ukhorskiy, A. Y., Mitchell, D. G., Takahashi, K., Spence, H. E., et al. (2019). Low-energy (<keV) O+ ion outflow directly into the inner magnetosphere: van allen Probes observations. J. Geophys. Res. Space Phys. 124 (1), 405–419. doi:10.1029/2018JA025862
Gkioulidou, M., Ukhorskiy, A. Y., Mitchell, D. G., Sotirelis, T., Mauk, B. H., and Lanzerotti, L. J. (2014). The role of small-scale ion injections in the buildup of Earth’s ring current pressure: Van Allen Probes observations of the 17 March 2013 storm. J. Geophys. Res. Space Phys. 119, 7327–7342. doi:10.1002/2014ja020096
Goldstein, J., Valek, P. W., McComas, D. J., and Redfern, J. (2022). Average ring current response to solar wind drivers: statistical analysis of 61 Days of ENA images. J. Geophys. Res. Space Phys. 127 (1), e2021JA029938. doi:10.1029/2021JA029938
Gonzalez, W. D., Joselyn, A., Kamide, Y., Kroehl, H. W., Rostoker, G., Tsurutani, B. T., et al. (1994). What is a geomagnetic storm? J. Geophys. Res. 99, 5771–5792. doi:10.1029/93ja02867
Haas, B., Shprits, Y. Y., Allison, H. J., Wutzig, M., and Wang, D. (2022). Which parameter controls ring current electron dynamics. Front. Astronomy Space Sci. 0, 166. doi:10.3389/FSPAS.2022.911002
Hori, T., Lui, A. T. Y., Ohtani, S., Cson Brandt, P., Mauk, B. H., McEntire, R. W., et al. (2005). Storm-time convection electric field in the near-Earth plasma sheet. J. Geophys. Res. Space Phys. 110 (A4), 4213. doi:10.1029/2004JA010449
Jaggi, R. K., and Wolf, R. A. (1973). Self-consistent calculation of the motion of a sheet of ions in the magnetosphere. J. Geophys. Res. 78 (16), 2852–2866. doi:10.1029/ja078i016p02852
Jin, H., Zou, S., Chen, G., Yan, C., Zhang, S., and Yang, G. (2018). Formation and evolution of low-latitude F region field-aligned irregularities during the 7–8 september 2017 storm: hainan coherent scatter phased array radar and digisonde observations. Space weather. 16 (6), 648–659. doi:10.1029/2018SW001865
Jordanova, V. K., Farrugia, C. J., Janoo, L., Quinn, J. M., Torbert, R. B., Ogilvie, K. W., et al. (1998). October 1995 magnetic cloud and accompanying storm activity: ring current evolution. J. Geophys. Res. 103, 79–92. October 1995. doi:10.1029/97JA02367
Kamide, Y., Shue, J. H., and Brittnacher, M. (2002). Solar wind density and auroral electrojets during geomagnetic storms. COSPAR Colloq. Ser. 14, 263–266. C. doi:10.1016/S0964-2749(02)80166-4
Kauristie, K., Sergeev, V. A., Kubyshkina, M., Pulkkinen, T. I., Angelopoulos, V., Phan, T., et al. (2000). Ionospheric current signatures of transient plasma sheet flows. J. Geophys. Res. Space Phys. 105, 10677–10690. A5. doi:10.1029/1999JA900487
Kistler, L. M. (2020). Ionospheric and solar wind contributions to the storm-time near-earth plasma sheet. Geophys. Res. Lett. 47 (23), e2020GL090235. doi:10.1029/2020GL090235
Korth, H., Thomsen, M. F., Borovsky, J. E., and McComas, D. J. (1999). Plasma sheet access to geosynchronous orbit. J. Geophys. Res. 104, 25047–25061. A11. doi:10.1029/1999ja900292
Kozyra, J. U., Jordanova, V. K., Borovsky, J. E., Thomsen, M. F., Knipp, D. J., Evans, D. S., et al. (1998). Effects of a high-density plasma sheet on ring current development during the November 2–6, 1993, magnetic storm. J. Geophys. Res. Space Phys. 103, 26285–26305. A11. doi:10.1029/98JA01964
Kozyra, J. U., and Liemohn, M. W. (2003). Ring current energy input and decay. Space Sci. Rev. 109 (1–4), 105–131. doi:10.1023/b:spac.0000007516.10433.ad
Kozyra, J. U., Nagy, A. F., and Slater, D. W. (1997). High-altitude energy source(s) for stable auroral red arcs. Rev. Geophys. 35 (2), 155–190. doi:10.1029/96RG03194
Kress, B. T., Rodriguez, J. V., and Onsager, T. G. (2019). “The GOES-R space environment in situ suite (SEISS): measurement of energetic particles in geospace,” in The GOES-R series: a new generation of geostationary environmental satellites (Netherlands: Elsevier), 243–250. doi:10.1016/B978-0-12-814327-8.00020-2
Lee, J. H., Blum, L. W., and Chen, L. (2021). On the impacts of ions of ionospheric origin and their composition on magnetospheric EMIC waves. Front. Astronomy Space Sci. 8, 122. doi:10.3389/fspas.2021.719715
Lennartsson, W., and Shelley, E. G. (1986). Survey of 0.1- to 16-keV/e plasma sheet ion composition. J. Geophys. Res. 91, 3061–3076. doi:10.1029/JA091iA03p03061
Liemohn, M. W. (2003). Yet another caveat to using the Dessler-Parker-Sckopke relation. J. Geophys. Res. Space Phys. 108, 1251. A6. doi:10.1029/2003JA009839
Liemohn, M. W., Ilie, R., Ganushkina, N. Y., Ridley, A. J., Kozyra, J. U., Thomsen, M. F., et al. (2011). Testing the necessity of transient spikes in the storm time ring current drivers. J. Geophys. Res. Space Phys. 116, 4226. A4. doi:10.1029/2010JA015914
Liemohn, M. W., and Jazowski, M. (2008). Ring current simulations of the 90 intense storms during solar cycle 23. J. Geophys. Res. Space Phys. 113, 0–17. A3. doi:10.1029/2008JA013466
Liemohn, M. W., Kozyra, J. U., Richards, P. G., Khazanov, G. V., Buonsanto, M. J., and Jordanova, V. K. (2000). Ring current heating of the thermal electrons at solar maximum. J. Geophys. Res. Space Phys. 105, 27767–27776. A12. doi:10.1029/2000JA000088
Liemohn, M. W., Kozyra, J. U., Thomsen, M. F., Roeder, J. L., Lu, G., Borovsky, J. E., et al. (2001). Dominant role of the asymmetric ring current in producing the stormtime Dst*. J. Geophys. Res. 106, 10883–10904. A6. doi:10.1029/2000ja000326
Loto’aniu, P. T. M., Califf, S., Redmon, R. J., and Singer, H. J. (2020). “Magnetic field observations from the GOES-R series,” in The GOES-R series: a new generation of geostationary environmental satellites, 251–259. doi:10.1016/B978-0-12-814327-8.00021-4
Maynard, N. C., and Chen, A. J. (1975). Isolated cold plasma regions: observations and their relation to possible production mechanisms. J. Geophys. Res. 80 (7), 1009–1013. doi:10.1029/ja080i007p01009
McPherron, R. L. (1997). “The role of substorms in the generation of magnetic storms,” in Magnetic storms, geophysical monograph series 98. Editors Y. Kamide, J. K. A. B. T. Tsurutani, and W. D. Gonzalez (Washington, United States: American Geophysical Union AGU, 131–147. doi:10.1029/GM098P0131
Meier, M. M., Belian, R. D., Cayton, T. E., M∼mr, M. M., Beuan, R. D., Chrtstensen, R. A., et al. (1996). The energy spectrometer for particles (ESP): instrument description and orbital performance. AIP Conf. Proc. 383 (1), 203. doi:10.1063/1.51533
Menz, A. M., Kistler, L. M., Mouikis, C. G., Spence, H. E., Skoug, R. M., Funsten, H. O., et al. (2016). The role of convection in the buildup of the ring current pressure during the 17 March 2013 storm. J. Geophys. Res. Space Phys. 122, 475–492. doi:10.1002/2016JA023358
Mitchell, D. G., Gkioulidou, M., and Ukhorskiy, A. Y. (2018). Energetic ion injections inside geosynchronous orbit: convection- and drift-dominated, charge-dependent adiabatic energization (W = qEd). J. Geophys. Res. Space Phys. 123 (8), 6360–6382. doi:10.1029/2018JA025556
Morley, S. K., Brito, T. V., and Welling, D. T. (2018). Measures of model performance based on the log accuracy ratio. Space weather. 16 (1), 69–88. doi:10.1002/2017SW001669
Motoba, T., Ohtani, S., Gkioulidou, M., Ukhorskiy, A. Y., Lanzerotti, L. J., and Claudepierre, S. G. (2021). Superposed epoch analysis of dispersionless particle injections inside geosynchronous orbit. J. Geophys. Res. Space Phys. 126 (8), e2021JA029546. doi:10.1029/2021JA029546
Nakamura, R., Baumjohann, W., Mouikis, C., Kistler, L. M., Runov, A., Volwerk, M., et al. (2004). Spatial scale of high-speed flows in the plasma sheet observed by Cluster. Geophys. Res. Lett. 31 (9). doi:10.1029/2004GL019558
Nakamura, R., Baumjohann, W., Schödel, R., Brittnacher, M., Sergeev, V. A., Kubyshkina, M., et al. (2001). Earthward flow bursts, auroral streamers, and small expansions. J. Geophys. Res. Space Phys. 106, 10791–10802. A6. doi:10.1029/2000JA000306
Newell, P. T., and Gjerloev, J. W. (2011). Evaluation of SuperMAG auroral electrojet indices as indicators of substorms and auroral power. J. Geophys. Res. Space Phys. 116 (12), 1–12. doi:10.1029/2011JA016779
Obana, Y., Maruyama, N., Shinbori, A., Hashimoto, K. K., Fedrizzi, M., Nosé, M., et al. (2019). Response of the ionosphere-plasmasphere coupling to the september 2017 storm: what erodes the plasmasphere so severely? Space weather. 17 (6), 861–876. doi:10.1029/2019SW002168
Pandya, M., Veenadhari, B., Nosé, M., Kumar, S., Reeves, G. D., and Lui, A. T. Y. (2018). Characteristics of storm time ion composition in the near-Earth plasma sheet using Geotail and RBSP measurements. Earth, Planets Space 70 (1), 203–216. doi:10.1186/s40623-018-0977-3
Redmon, R. J., Seaton, D. B., Steenburgh, R., He, J., and Rodriguez, J. V. (2018). September 2017's geoeffective space weather and impacts to caribbean radio communications during hurricane response. Space weather. 16 (9), 1190–1201. doi:10.1029/2018SW001897
Reeves, G. D., and Henderson, M. G. (2001). The storm-substorm relationship: ion injections in geosynchronous measurements and composite energetic neutral atom images. J. Geophys. Res. Space Phys. 106 (4), 5833–5844. doi:10.1029/2000ja003017
Rowland, D. E., and Wygant, J. R. (1998). Dependence of the large-scale, inner magnetospheric electric field on geomagnetic activity. J. Geophys. Res. Space Phys. 103, 14959–14964. A7. doi:10.1029/97ja03524
Runov, A., Angelopoulos, V., Sitnov, M. I., Sergeev, V. A., Bonnell, J., McFadden, J. P., et al. (2009). THEMIS observations of an earthward-propagating dipolarization front. Geophys. Res. Lett. 36 (14), 14106. doi:10.1029/2009GL038980
Sckopke, N. (1966). A general relation between the energy of trapped particles and the disturbance field near the Earth. J. Geophys. Res. 71 (13), 3125–3130. doi:10.1029/JZ071I013P03125
Smith, P. H., and Bewtra, N. K. (1978). Charge exchange lifetimes for ring current ions. Space Sci. Rev. 22. doi:10.1007/bf00239804
Stern, D. P. (1975). The motion of a proton in the equatorial magnetosphere. J. Geophys. Res. 80 (4), 595–599. doi:10.1029/ja080i004p00595
Thomsen, M. F., Birn, J., Borovsky, J. E., Morzinski, K., McComas, D. J., and Reeves, G. D. (2001). Two-satellite observations of substorm injections at geosynchronous orbit. J. Geophys. Res. 106, 8405–8416. A5. doi:10.1029/2000ja000080
Tsyganenko, N. A., and Sitnov, M. I. (2005). Modeling the dynamics of the inner magnetosphere during strong geomagnetic storms. J. Geophys. Res. Space Phys. 110, 1–16. A3. doi:10.1029/2004JA010798
Vasyliunas, V. M. (1970). “Mathematical models of magnetospheric convection and its coupling to the ionosphere,” in Particles and fields in the magnetosphere, 60–71. doi:10.1007/978-94-010-3284-1_6
Volland, H. (1973). A semiempirical model of large-scale magnetospheric electric fields. J. Geophys. Res. 78 (1), 171–180. doi:10.1029/JA078i001p00171
Weimer, D. R. (2001). An improved model of ionospheric electric potentials including substorm perturbations and application to the Geospace Environment Modeling November 24, 1996, event. J. Geophys. Res. 106, 407–416. A1. doi:10.1029/2000JA000604
Wodnicka, E. B., and Banaszkiewicz, M. (1997). Outflowing ionospheric oxygen-ion motion in a reconfigurating magnetosphere. Ann. Geophys. 15 (1), 5–16. doi:10.1007/S00585-997-0005-6
Wolf, R. A. (1970). Effects of ionospheric conductivity on convective flow of plasma in the magnetosphere. J. Geophys. Res. Space Phys. 75 (25), 4677–4698. doi:10.1029/ja075i025p04677
Wolf, R. A., Freeman, J. W., Hausman, B. A., Spiro, R. W., Hilmer, R. V., and Lambour, R. L. (1997). Modeling convection effects in magnetic storms. Geophys. Monogr. Ser. 98, 161–172. doi:10.1029/GM098P0161
Yamauchi, M., Sergienko, T., Enell, C. F., Schillings, A., Slapak, R., Johnsen, M. G., et al. (2018). Ionospheric response observed by EISCAT during the 6–8 september 2017 space weather event: overview. Space weather. 16 (9), 1437–1450. doi:10.1029/2018SW001937
Yang, J., Toffoletto, F. R., and Wolf, R. A. (2016). Comparison study of ring current simulations with and without bubble injections. J. Geophys. Res. Space Phys. 121 (1), 374–379. doi:10.1002/2015JA021901
Young, D. T., Balsiger, H., and Geiss, J. (1982). Correlations of magnetospheric ion composition with geomagnetic and solar activity. J. Geophys. Res. 87, 9077–9096. A11. doi:10.1029/ja087ia11p09077
Yu, Y., Su, S., Cao, J., Jordanova, V. K., and Denton, M. H. (2022). Improved boundary conditions for coupled geospace models: an application in modeling spacecraft surface charging environment. Space weather. 20, e2022SW003178. doi:10.1029/2022SW003178
Yue, C., Bortnik, J., Thorne, R. M., Ma, Q., An, X., Chappell, C. R., et al. (2017). The characteristic pitch angle distributions of 1 eV to 600 keV protons near the equator based on van allen Probes observations. J. Geophys. Res. Space Phys. 122 (9), 9464–9473. doi:10.1002/2017JA024421
Keywords: particle injections, ring current, geomagnetic storms, substorms, geosynchronous orbit, plasmasphere heating, Van Allen Probes
Citation: Ferradas CP, Fok M-C, Maruyama N, Henderson MG, Califf S, Thaller SA and Kress BT (2023) The effects of particle injections on the ring current development during the 7-8 September 2017 geomagnetic storm. Front. Astron. Space Sci. 10:1278820. doi: 10.3389/fspas.2023.1278820
Received: 16 August 2023; Accepted: 13 November 2023;
Published: 28 November 2023.
Edited by:
Jay R. Johnson, Andrews University, United StatesReviewed by:
Michael W. Liemohn, University of Michigan, United StatesAnthony Sciola, Johns Hopkins University, United States
Copyright © 2023 Ferradas, Fok, Maruyama, Henderson, Califf, Thaller and Kress. This is an open-access article distributed under the terms of the Creative Commons Attribution License (CC BY). The use, distribution or reproduction in other forums is permitted, provided the original author(s) and the copyright owner(s) are credited and that the original publication in this journal is cited, in accordance with accepted academic practice. No use, distribution or reproduction is permitted which does not comply with these terms.
*Correspondence: C. P. Ferradas, Y3Jpc3RpYW4uZmVycmFkYXNhbHZhQG5hc2EuZ292