by Hong H, Ma L, Smith DB, Lu H, Yan C, Xia K and Williams MA (2022) Front. Soil Sci. 2:984927. doi: 10.3389/fsoil.2022.984927
Due to a production error, there were mistakes in the Figures 4 and 5 captions. The Figure 4 caption was incorrectly captured as the Figure 5 caption, and the Figure 5 caption was incorrectly captured as the Figure 4 caption. The correct figure captions appear below.

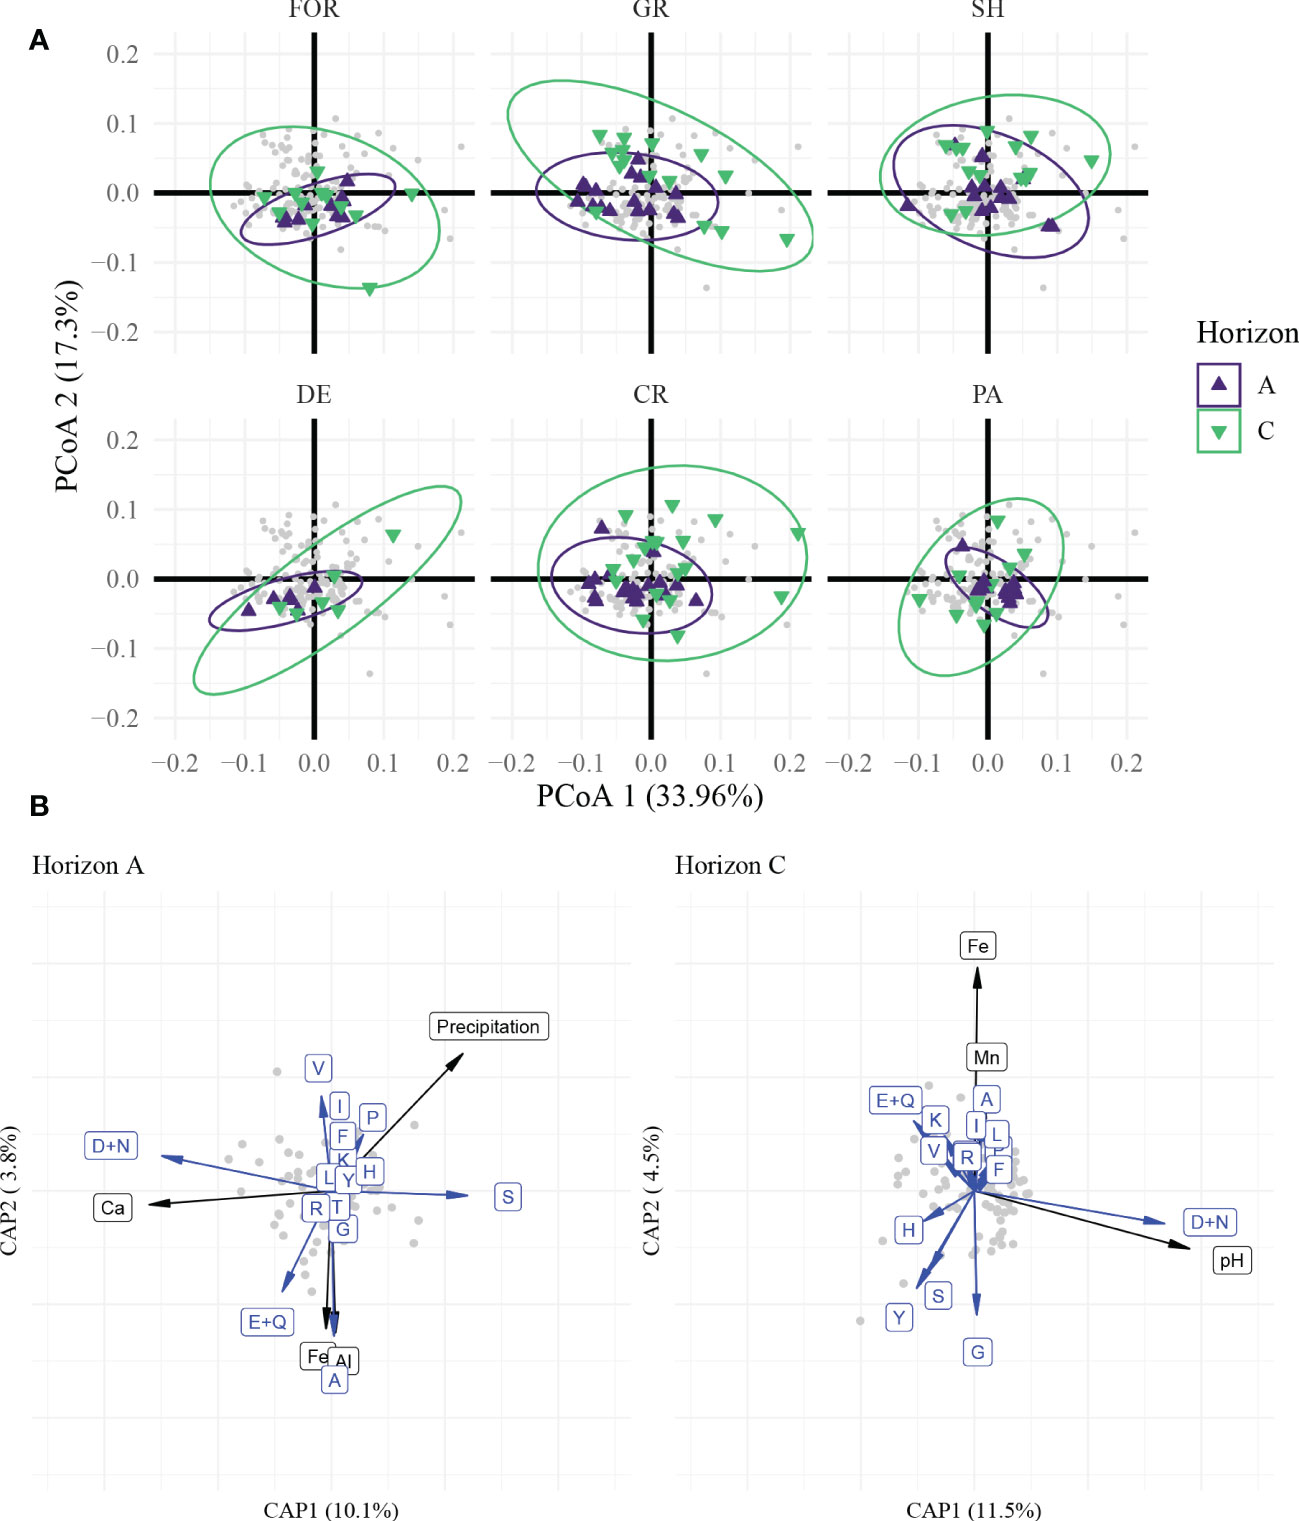
Figure 4 Molecular diversity and environmental factor changes under the influence of selective decomposition of HAAs during pedogenesis, revealed by multidimensional sorting. (A) PCoA-based sorting on the molar ratio of HAAs. Samples from different vegetation types were exhibited separately. Colors represent different soil layers. FOR, evergreen or mixed forest; GR, grassland/herbaceous; SH, shrubland; DE, deciduous forest; CR, small grains or crop; PA, pasture/hay. Samples from fallow or low intensity residential are not shown here due to the small sample size. (B) Driving factors of HAAs in different soil layers exhibited by dbRDA. A-horizonal and C-horizonal samples were fitted separately to compare the changes in environmental factors. The single letters in blue represent the corresponding amino acids. A, Ala; R, Arg; G, Gly; H, His; I, Ile; L, Leu; K, Lys; M, Met; F, Phe; P, Pro; S, Ser; T, Thr; Y, Tyr; V, Val; D, Asp; N, Asn; E, Glu; Q, Gln. Black labels represent specific environmental factors. Data were transformed by log1p (HAAs) or log (environmental factors).

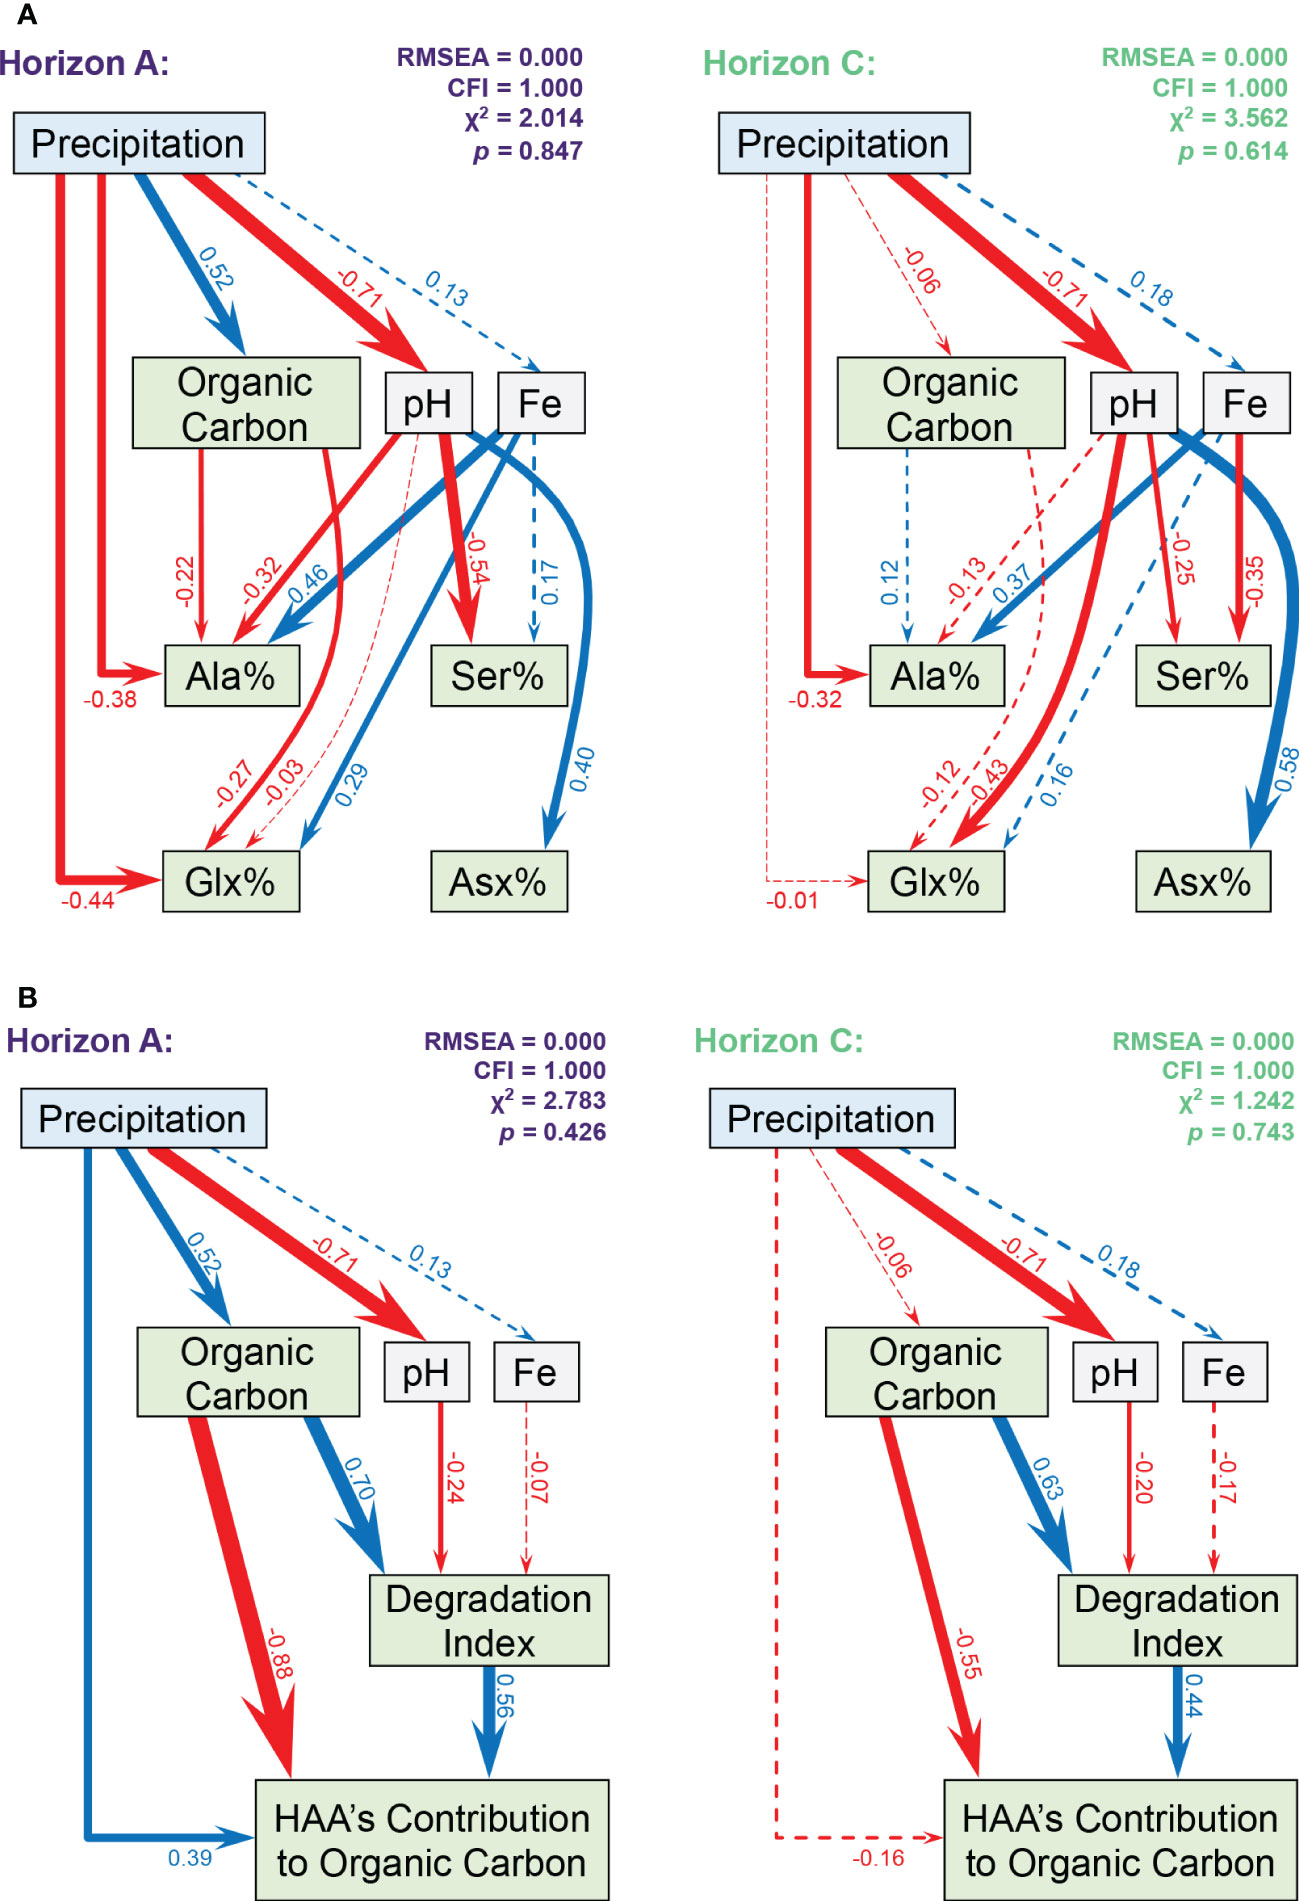
Figure 5 Model describing precipitation, but not temperature, as a proximate and distal mechanism controlling soil HAA composition Path diagrams comparing the direct and indirect effects of precipitation on (A) HAA composition and (B) HAA’s contribution to organic carbon pool in horizon A (n = 84) and horizon C (n = 81). Red and blue paths represent the negative and positive relationships, respectively. Solid and dashed paths indicate significant and insignificant relationships, respectively. The paths’ thickness is scaled based on the standardized path coefficients as shown adjacent to the arrows.
Due to a production error, there was a mistake in the Results, Abundance and composition of HAAs, paragraph 3. An in-text citation for Figure S3 was missed out. The correct paragraph appears below.
“The top ten dominant amino acids detected were: Gly > Asx > Ala > Glx > Ser > Thr > Pro > Lys > Val > Leu (Figures S4, S7). However, in spite of these trends in average composition, there was considerable variation between observations. For example, Asx ranged from 8.6 to 27.4, and Gly from 7.2-25.9 mol%. In both A- and C-horizon soils, 53-65% of the HAAs are neutral amino acids, while acidic, basic, and aromatic amino acids consist of 24-36%, 6-10%, and 4-5% of HAAs, respectively. The overall composition of HAAs was different between the A- and C horizons (Figures 3, S3; MRPP, p< 0.0001). For example, the mol% of Asx and Ser were 21% more and 40% less in the A compared to the C horizon, respectively (Figure S4).”
Due to a production error, there was a mistake in the Results, AA signatures of vegetation-ecosystem type associated with soil horizon, paragraph 2. An in-text citation for Figure S5 was incorrectly written as Figure S4. The correct paragraph appears below.
“PCoA1 was positively correlated with Gly (r = 0.79) but negatively correlated with Ile (r = -0.83), Leu (r = -0.77), Val (r = -0.77), Phe (r = -0.69), and Pro (r = -0.62). Among these HAAs, Ile, Leu, Phe and Pro differed significantly between horizons, while the effect of VET was not significant (Table S1). These HAAs, furthermore, were all found to be relatively enriched in the A horizon (Figure S5). The interaction term between VET and horizon was significant in describing the distribution of the relative molar ratios of Ile, Leu, and Phe. In the A horizon, Ile, and Phe had greater mol % in evergreen or mixed forest, grassland, and shrubland compared to that of pasture/hay. Leu was higher in evergreen or mixed forest but lower in pasture/hay. The effect of VET, however, did not have a significant effect on differences in the C horizon. PCoA2 was highly described by variation in Asx with an extremely strong positive correlation (r = 0.94). Both horizon and VET significantly influenced the pattern of Asx (Table S1), which was relatively enriched in the C compared to A horizon; and also, in cropland and pasture/hay, while depleted in the evergreen and mixed forests.”
Due to a production error, there was a mistake in the Discussion, The continental-wide pattern of amino acids across soil horizon, paragraph 2. An in-text citation for Figure S7 was incorrectly written as Figure S6. The correct paragraph appears below.
“In line with this study, a separate recent study of soils with different development ages observed that His, Lys, and Arg tended to be more dominant in mineral compared to that of the whole soil organic pools. This points to their possible role as persistent or long-lived OM (1, 19), perhaps most important in soils with high CEC. Non-polar HAAs (e.g., Pro, Leu, Ile) in our study in contrast, were most positively correlated with total soil organic C content (Figure S7), suggesting that these residues may accumulate to increase SOM. Non-polar HAAs, however, declined with pedogenesis in two ecosystems suggesting that they may be part of newer pools of accumulating rather than older pools of decomposed OM in soil (19).”
Due to a production error, there was a mistake in the Discussion, The continental-wide pattern of amino acids across soil horizon, paragraph 4. An in-text citation for Figures S3 and S5 was incorrectly written as Figures S2 and S4. The correct paragraph appears below.
“The overall HAAs dominant in A-horizon and their compositional profile reported in the present study
(Figures 2A, S3, S5) are coincident with those previously reported (1, 27, 30, 46–48). In general, many biologically dominant AA remain dominant in soil, but the broad descriptions of relative amino acids found in soil herein, describe how the mol% composition of AA can vary considerably across soil gradients, for example, by 2X for AA such as Asx, 6X for AA such as proline, and from non-detectable
up to ~2-3 mol% for Met and Phe. These AAs, on the other hand, may be good indicators of environmental changes. For example, Asx was positively related to soil pH in both the A and C horizons (Figures S15 and S16). Soil pH was found to be one of the strongest drivers of HAA composition, and this relationship is important both biologically and chemically.”
Due to a production error, there was a mistake in the Discussion, The roles taken by surface vegetation on HAAs’ composition, paragraph 1. An in-text citation for Figure S5 was incorrectly written as Figures S4. The correct paragraph appears below.
“Above-ground plant litter, dead roots, and the turnover of these OMs processed by the decomposer community, contributed to most of the HAAs in the soil (3). Acidic AA such as Asp are common constituents of fresh plant tissue, root tissue and root exudates (54–56); and positively charged amino acids such as Lys and His in free forms and enriched in peptides may bind to negative mineral and organic surfaces to support their relative enrichment (Figure S5) in the C horizons.”
Due to a production error, there was a mistake in the Discussion, The roles taken by surface vegetation on HAAs’ composition, paragraph 3. An in-text citation for Figure S5 was incorrectly written as Figures S4. The correct paragraph appears below.
“Ser was relatively more abundant on the surface compared to the subsurface soil (Figure S5, LMMs, F1,90.1 = 5.90, p = 0.017), which might be related to the presence of Ser-rich microbes, such as methanotrophs and archaea in the surface. Ser is a versatile AA highly utilized in metabolic pathways and important to the formation of nucleic acids, which are likely to be relatively more common because of higher microbial activity (especially fungi) and turnover in the A compared to the C horizon. Ser-rich microbes, such as methanotrophs and archaea on the surface may also contribute to Ser in soil. It has been observed that Ser was relatively greater within the mineral associated rather than the organic-associated soil pools. (1, 19), which would tend to be lower in the A relative to the C horizon. Hence, Ser content may be an indicator of less processed OM. This otherwise relatively polar and soluble amino acid would likely be susceptible to decomposition.”
Due to a production error, there was a mistake in the Discussion, Direct and indirect drivers of the accrual of amino acids, paragraph 5. An in-text citation for Figure S14 was incorrectly inserted. The correct paragraph appears below.
“It is important to note that precipitation but not temperature, among climate factors, was found to play a major role in determining the HAAs’ characteristics in this study, as some soil warming experiments have shown (62). This does not mean that the role of temperatures can be ignored. Perhaps temperature interacts in a complex way with precipitation and soil minerals. The temperature may also influence the long-term succession of surface vegetation and thus the composition of HAAs. Also, we note that even after accounting for VET and environmental factors, there is still about 70% of the variance in HAAs that is not explained, which suggests that there are deeper mechanisms involved in discerning the pattern of HAA. This outcome indicates a need for more mechanistic and comparative studies across ecosystems and even continents.”
In addition, the ORCID ID for Mark A. Williams was not present in the published article. The ORCID ID for Mark A. Williams appears below.
Mark A. Williams: https://orcid.org/0000-0002-4766-9399
The publisher apologizes for these mistakes. The original article has been updated.
Keywords: proteinaceous amino acids, soil horizon, pH, vegetation type, soil organic matter, Metal-associated organic matter, mineralogy
Citation: Frontiers Production Office (2023) Erratum: Precipitation-derived effects on the characteristics of proteinaceous soil organic matter across the continental United States. Front. Soil Sci. 3:1143273. doi: 10.3389/fsoil.2023.1143273
Received: 12 January 2023; Accepted: 12 January 2023;
Published: 14 February 2023.
Approved by:
Frontiers Editorial Office, Frontiers Media SA, SwitzerlandCopyright © 2023 Frontiers Production Office. This is an open-access article distributed under the terms of the Creative Commons Attribution License (CC BY). The use, distribution or reproduction in other forums is permitted, provided the original author(s) and the copyright owner(s) are credited and that the original publication in this journal is cited, in accordance with accepted academic practice. No use, distribution or reproduction is permitted which does not comply with these terms.
*Correspondence: Frontiers Production Office, cHJvZHVjdGlvbi5vZmZpY2VAZnJvbnRpZXJzaW4ub3Jn
