 Edward Luy
 James Smith
 Iain Grundke
 Colin Sonnichsen
 Arnold Furlong
 Vincent Sieben
- 1Department of Electrical and Computer Engineering, Dalhousie University, Halifax, NS, Canada
- 2Dartmouth Ocean Technologies Inc., Dartmouth, NS, Canada
Autonomous in situ sensors are required to monitor high-frequency nutrient fluctuations in marine environments on a mass-scale. We present a submersible, dual-chemistry sensor that performs multiple colourimetric assays simultaneously on a fluid sample for multi-parameter in situ analysis. Based on a highly configurable architecture that has been successfully deployed for several multi-month periods, the sensor utilizes 10 solenoid valves, 4 syringes, 3 stepper motors, 2 LEDs, 4 photodiodes, and “inlaid” microfluidics to permit optical measurements of microliter fluid volumes. Fluid pathways are machined into a modular two-layer microfluidic lab-on-chip (LOC) fabricated from poly (methyl methacrylate) (PMMA) with two parallel inlaid optical cells of 10.4 mm and 25.4 mm path lengths (1.7 µl and 4 μl, respectively). Different LOC designs can be used to implement a wide variety of colorimetric assays. We demonstrate application of our dual-chemistry sensor towards simultaneous measurement of nitrate and dissolved orthophosphate: two nutrients fundamental to primary production. The performance of the dual-species nitrate and phosphate “NP Sensor” is characterized first in a controlled laboratory environment. Combined nutrient standards containing nitrate and phosphate concentrations ranging from 2.5 µM–100 µM
1 Introduction
Without targeted policy intervention, eutrophication is projected to increase substantially throughout the 21st century (Sinha et al., 2017; Wolf and Klaiber, 2017) with global health and economic impact (Dodds et al., 2009). Between 2000–2019, agricultural use of nitrogen (N) and phosphorus (P) from fertilizers increased approximately 34% globally, from 81 to 108 million tons and from 32 to 43 million tons respectively (FAOSTAT, 2022). These two nutrient elements are fundamental towards stimulating plant growth and maximizing harvest production, and their use has increased with population-driven food demands with potentially harmful consequences on the environment (Burton et al., 2020). Consequently, the dominant sources of both N and P across Earth’s ecosystems are now anthropogenic (Guignard et al., 2017), with widespread nutrient pollution threatening land and marine environments (Wurtsbaugh et al., 2019). A closed-loop system of nitrogen and phosphorus application can maximize food productivity without contributing to further nutrient pollution, but requires visibility on N and P fluxes to comprehensively recover and recycle nutrients (Willett et al., 2019). Significant losses of N and P due to runoff prevent effective recovery and can have cascading effects on the aquatic ecosystem.
In aquatic environments, the abundance of N or P limits energy production for almost all organisms (Quan and Falkowski, 2009). Ecosystem structure can be significantly impacted from nutrient enrichment through biomass proliferation and disruption of the natural food chain (Ardón et al., 2021). Areas of extreme nutrient abundance, referred to as eutrophic zones, stimulate growth of many species of organisms, some of which may be toxic. Nutrient loading has been linked to the blooming of certain harmful species of algae (also referred to as Harmful Algal Blooms, HABs), including P. minimum and H. akashiwo: observed in close proximity to phosphate-enriched effluent discharge (Garrett et al., 2011), and Alexandrium fundyense: correlated to nitrogen loading and warmer water temperature (Hattenrath et al., 2010). A study performed in Lake Erie in 2019 showed that differing concentrations and ratios of N and P stimulated different genera and strains of cyanobacteria (Jankowiak et al., 2019). Management efforts to minimize HAB production should therefore monitor both nitrogen- and phosphorus-based fluxes (Anderson et al., 2002; Jankowiak et al., 2019).
Efforts to monitor nitrogen- and phosphorus-based fluxes in aquatic environments have resulted in the development of in situ sensors, where sampling and analysis occur simultaneously and the need for manual labor is minimized. Nitrogen and phosphorus each may exist in aquatic environments under many forms; as such, total N and P monitoring requires a combination of several highly complicated techniques. For example, a minimum of three EPA commissioned techniques may be needed for total nitrogen and phosphorus measurement, including EPA methods 351.2, 353.2, and 365.2. Application of these techniques on an in situ platform, however, requires the following techniques: colorimetry, cadmium-reduction, hydrolysis, and persulfate digestion, along with a tightly regulated temperature-control process. The high degree of complexity presents a challenge for these analysis platforms whereby size and power consumption budgets must be quite constrained for wide-scale feasibility. Consequently, development of automated in situ sensors have focused on the most abundant fixed forms of N or P that directly limit primary production: nitrate (
The gold-standard approaches toward nitrate and dissolved orthophosphate measurement rely on reagent-based colorimetry and have been shown to achieve nanomolar limits of detection (Murphy et al., 2021; Morgan et al., 2022). These techniques have been applied towards benchtop & portable nutrient detection platforms (McCaul et al., 2021), mixing one or several specifically crafted reagents with sample to generate a colored complex. The amount of color produced is proportional to the concentration of the selected species and can be quantified using optical techniques. However, the fluid consumption rate (i.e., the volume of fluid consumed per measurement) limits the total possible number of samples before servicing; therefore, many sensors utilize microfluidics to maximize fluid efficiency. A wide array of microfluidic sensors have been presented in recent literature, applied to measure nutrients (Clinton-Bailey et al., 2017; Beaton et al., 2022; Morgan et al., 2022), pH (Yin et al., 2021), silicate (Cao et al., 2018), or various other key ocean variables. Furthermore, these microfluidic platforms have been demonstrated to deep ocean depths (> 4,800 m) (Beaton et al., 2022), have performed thousands of samples per deployment (Grand et al., 2017), and present significant potential towards widespread ocean monitoring (Fukuba and Fujii, 2021; Li et al., 2022). However, these analyzers are typically limited to a single species per instrument, and multiplexed data collection may suffer from challenges of sample synchronization spatially and temporally. Similarly, combined N and P measurements requires doubling the financial investment in instrument purchases as two units are required instead of a single, dual-chemistry system.
To provide insight into the environmental impact of nitrogen and phosphorus fluxes, we present a microfluidic sensor designed to measure both nitrate and dissolved orthophosphate simultaneously in situ within the same instrument. For simplicity, dissolved orthophosphate will be referred to simply as “phosphate” henceforth. Our dual chemistry “NP Sensor” is derived from a submersible phosphate analyzer architecture described in a previous publication, which was deployed in the Bedford Basin in Nova Scotia, Canada to acquire over 300 in situ dissolved orthophosphate measurements (Morgan et al., 2022) and has since been deployed for several multi-month periods. The novel NP Sensor combines the “fluid engine” of our previous design with a custom designed lab-on-chip that was built to perform two chemistries within the same instrument. Both nutrients are measured using two different reagent-based colourimetric assays: a modified Griess assay for nitrate detection via vanadium (III) chloride reduction to nitrite (Nightingale et al., 2018; Murphy et al., 2021), and the phosphomolybdenum blue (PMB) assay for phosphate (Grand et al., 2017; Morgan et al., 2022). A detailed discussion on the specificity of these assays in the context of marine environments can be found in the Supplementary Material.
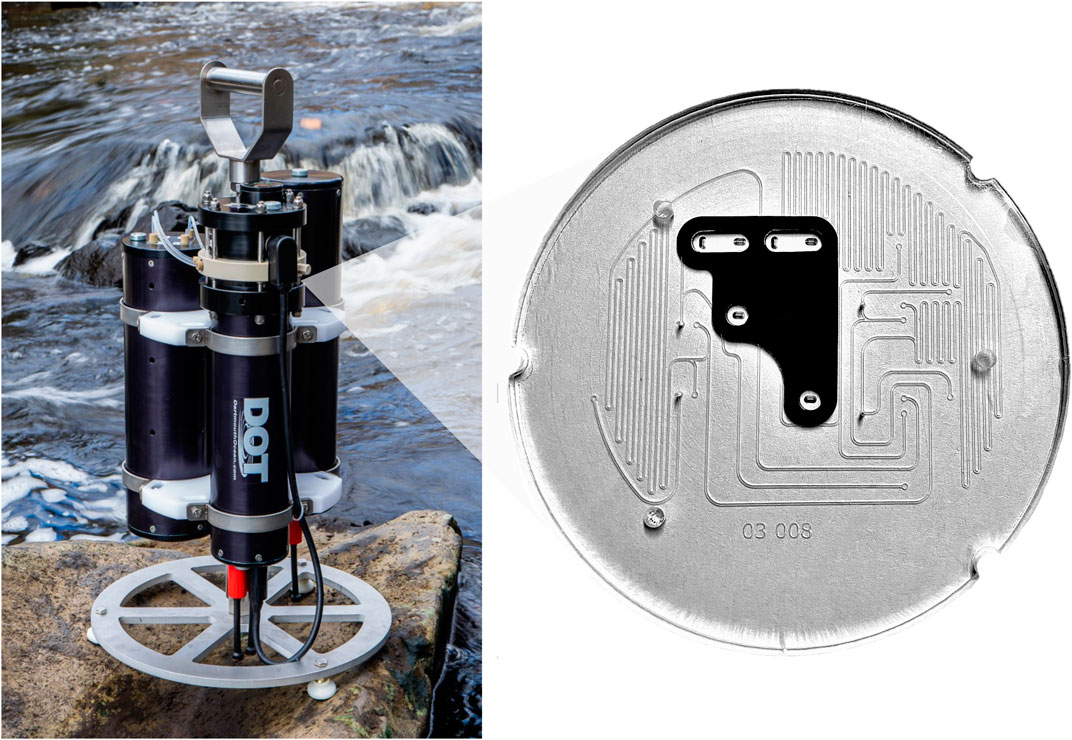
Figure 1 presents the NP Sensor under typical deployment conditions. Several configurations have been used to deploy the sensor. For example, Figure 1A shows a photograph of the NP Sensor in a “quad bracket” retrieved after a vertical profile, packaged with accompanying fluids, power, and CTD. The external battery canister provides power to the sensor and contains 12 D-cell batteries (Lithium thionyl chloride) in a pressure-tolerant container. Similarly, the perforated reagent canister supplies reagents and standards to the sensor for nutrient measurements, while also capturing dispelled waste. The functionality of each instrument in the tri-cannister assembly has been pressure tested at a nearby facility to a depth rating of at least 200 m (Hydrostatic External Pressure Test, ESL Technology Inc., Dartmouth NS).
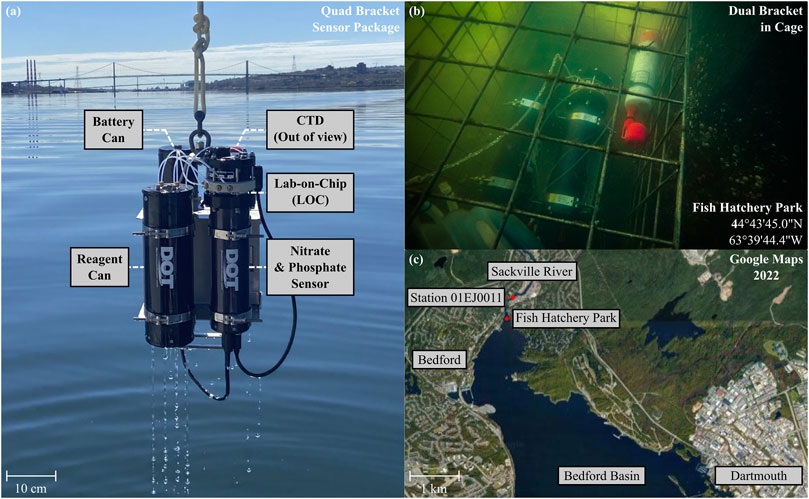
FIGURE 1. (A) Photograph of the NP Sensor retrieved after a deployment in Nova Scotia, Canada. A quad bracket sensor package is shown, consisting of a Battery Can, Reagent Can, CTD (RBR Brevio3, out-of-view), and NP Sensor. (B) Underwater photograph of the NP Sensor obtained during a stationary shallow-river deployment in Sackville River (Fish Hatchery Park, Bedford). (C) Google Maps snapshot of the deployment location and surrounding area (Nova Scotia, Canada).
In this work, we initially characterize the performance of the sensor in a controlled laboratory environment through a series of benchmark tests prior to field application. Each test was designed to analyze a different aspect of the sensor’s performance, and successive tests added further levels of complexity towards implementation of the full field deployment protocol. The first test evaluated the stability and dynamic range of both optical cells. This “dye” test consisted of a simultaneous calibration of both optical cells, where either optical cell was injected with varying concentrations of a different (premixed) dyed fluid. The second test added on-chip mixing and color-development via a benchtop nitrate and phosphate calibration at room temperature. Finally, using the full protocol, the sensor was submerged in a temperature-controlled bath to repeat the nitrate and phosphate calibration at various fixed temperature conditions. These results were used to calibrate sensor measurements for a wide range of deployment conditions, and to assess the temperature-dependent reaction kinetics of both colourimetric assays prior to field applications.
Following benchtop calibrations, the NP Sensor was deployed in the Sackville River at Fish Hatchery Park in Nova Scotia, Canada, for a period of 8 days in August 2022 to acquire simultaneous nitrate and phosphate measurements. Figure 1B shows a photograph of the sensor package during the deployment, resting on the bottom of the river. Fish Hatchery Park is located at the northern inlet of the Bedford Basin (Figure 1C) and connects the basin to the Sackville River, which acts as the primary freshwater source to the basin (Kepkay et al., 1993; Shi and Wallace, 2018). To permit maximum sampling frequency, expanded fluid reservoirs were tied to the sensor without use of a reagent canister. An RBR Brevio3 CTD (RBR Ltd., Canada) collected accessory salinity, temperature, and depth measurements during the deployment, while a Xeos iridium beacon (Xeos Technologies Inc., Dartmouth Canada) was used to track the location of the package as a security measure. The results from the Fish Hatchery Park deployment will be discussed, with a focus on tidal induced saltwater/freshwater mixing dynamics. Furthermore, results from this deployment will be contextualized using orthophosphate measurement data collected simultaneously from the Bedford Basin. Finally, the in situ accuracy of the sensor will be discussed through analysis of repeated on-board standard measurements. Ultimately, we demonstrate a novel sensor for monitoring aquatic environments with sufficient spatial and temporal resolution by performing two chemistries on a single lab-on-chip platform with nanomolar performance. We believe this architecture will pave the way for future multi-parameter environmental monitoring over a wide array of chemistries.
2 Materials and methods
2.1 Sensor description
The NP Sensor architecture is based on the orthophosphate sensor system described in our previous work (Morgan et al., 2022), with differences noted here. All alterations to the previous system that were needed to realize the combined dual-species instrument will be highlighted as such. Sensor electronics were distributed across 3 custom printed-circuit-boards (PCBs), responsible for automation, data processing and logging, and controlling the various sub-instruments needed to propagate fluids. A total of three stepper motors were used to actuate four syringes, each used to propagate the various types of fluid used during sensor activity. Our syringes were custom-built to better withstand wide temperature fluctuations that may occur during a deployment and were driven using a custom syringe-pump assembly. A separate, pressure compensated “solenoid can” housed a total of 10 solenoid valves (LFN series, Lee Company, Connecticut, United States) which were operated using a “spike-and-hold” approach to minimize power consumption when active. The solenoid valves were used to route fluid through the various fluid paths and vias machined into our custom lab-on-chip (LOC) platform for dual-species analysis. Fluid channels had a square cross-section, with nominal dimensions of 400 µm by 400 µm. In Figure 1A, the LOC is shown sandwiched between the main sensor body (below) and the solenoid can (above).
The fluid schematic of the dual-chemistry instrument is shown in Figure 2. Fluids may enter or exit the sensor through one of six fluid ports. In Figure 2A, these ports are labelled NR, T, S, PR1, PR2, and W, and are named according to their function during the NP protocol. Ports NR, PR1, and PR2 were used to draw in the modified Griess reagent for the nitrate assay (nitrate reagent–NR), and the two phosphate reagents required for the phosphomolybdenum blue assay to quantify phosphate. Similarly, ports T and S were used to draw in either calibration standards of known nitrate and phosphate concentration, or sample water during deployments. Finally, the waste port W was used to eject consumed fluids from the sensor into a waste reservoir. Each port except the sample intake S was connected to their respective fluid reservoir via 1/8 tubing (fluorinated ethylene propylene, FEP, Cole-Parmer Canada). The sample intake, however, was designed to draw directly from the surrounding environment. A disposable 0.45 µm syringe filter (Sarstedt Inc., PN 83.1826) was attached to the sample intake via a luer-lock connection for use during field deployments. This pore size was used to prevent clogging of microfluidic channels and valve pathways from large particulates, while also eliminating optical losses from scattering when analyzing highly-turbid samples (Hansen and Koroleff, 1999). The sample intake filter can be installed or replaced underwater if desired but could lead to small amounts of unfiltered water entering the fluid pathways. All filter installations were performed on land as a precaution.
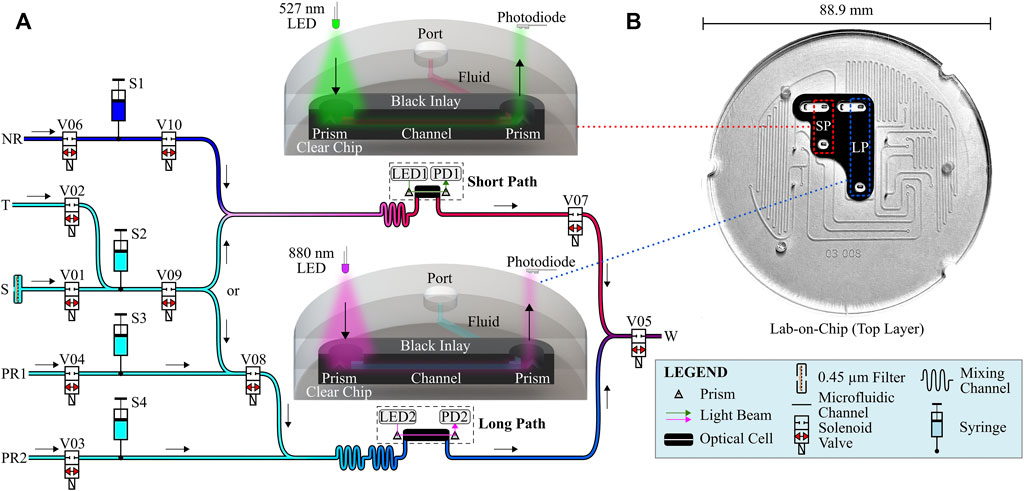
FIGURE 2. (A) Dual-chemistry sensor fluid schematic. Two parallel optical cells enable measurement of two different colorimetric assays simultaneously. (B) Lab-on-chip top layer perspective view. Microfluidic channels are sealed after bonding to the bottom layer. Inlaid optical cells are highlighted with dashed stroke rectangles.
Four syringes were responsible for fluid propagation throughout the sensor and are arbitrarily labelled in Figure 2A for reference. S1 was used to push nitrate reagent through the short path measurement cell and was controlled using the first of three stepper motors. Similarly, S3 and S4 were used to push phosphate reagent 1 and phosphate reagent 2, respectively, through the long path measurement cell and were both controlled by the second stepper motor. Finally, S2 was used to push either sample or standard fluid through both short and long path measurement cells and was driven by the third stepper motor.
Two parallel inlaid optical cells were used to obtain measurements. Figure 2B shows a photograph of the top layer of the bilayer lab-on-chip. Both inlaid optical cells are highlighted by dashed-stroked rectangles. For each optical cell, light emissions from one of two light sources within the sensor are directed towards the top 45°C prism. A portion of the light reflected off the prism is directed through the corresponding fluid channel (directly downward from the prism in the photograph), where the fluid channel crosses the clear-black material, towards the bottom prism. Light transmitted through the fluid sample is then measured using a light detector. Light sources and detectors are fixed to a PCB in the sensor mounted directly above the chip.
Nitrate measurements used the “short path” optical cell of path length 10.4 mm to interrogate a fluid volume of just under 2 µl. A green light-emitting diode (LED) centered at λ1 = 527 nm (Cree C503B-GAN-CB0F0791-ND, FWHM ≈ 50 nm, Durham, NC, United States) was directed through the short path optical cell for measurement using a photodiode (TSL257, AMS, Premstaetten, Austria). Similarly, the “long path” optical cell was used to measure phosphate using an infrared LED centered at λ2 = 880 nm (MTE8800NK2, FWHM ≈ 60 nm, Marktech Optoelectronics, New York, United States) and a second photodiode. Two reference photodiodes also were used to monitor and subtract light fluctuations in the LEDs.
2.2 Sensor protocols
A detailed description of the sensor protocols used to perform each series of experiments can be found in the Supplementary Material. A custom-built scripting language was used to operate basic sensor functions, including actuation of motors, actuation of solenoid valves, LED intensities, fluid volume tracking, data processing, and data logging. A typical protocol to acquire nutrient measurements of a fluid sample followed the following sequence of steps. First, logging of engineering-related metrics is enabled, which includes statistics regarding power draw, internal temperature, and valve-related parameters. Next both short and long path LEDs are assigned their own output intensity levels ranging from 0.0–100.0. LED intensities are typically determined prior to field deployments in a controlled setting to obtain a wide dynamic measurement range through the respective measurement cell without saturating the photodiode. Next, fluid propagation of the various reagents/samples/standards occurs according to valve and pump commands. Finally, after pumping, photodiode measurements are recorded during stopped flow for a set period of time (depending on the type of measurement) to acquire the necessary measurement data to produce concentration measurements.
2.3 Chemistry
Unless otherwise stated, chemicals were of analytical grade and supplied by Fisher Chemical (Waltham, MA, United States). Benchtop optics calibrations with stable fluids used red food dye and copper (II) sulfate standards that ranged from 0.00125%–0.05% and 0.625 mM–25 mM, respectively. Five concentrations of red food dye were prepared to characterize the performance of the short path measurement cell. First, a 0.05% (v/v) red food dye stock solution was prepared by diluting 0.5 ml of red food colouring (commercial food colouring, Club House Canada) with Milli-Q to a total volume of 1 L and mixing thoroughly. Four more standards were prepared through serial dilutions to produce a total of five standards of the following red food dye concentrations: 0.05%, 0.025%, 0.0125%, 0.0025%, and 0.00125%. Similarly, five concentrations of copper (II) sulfate were prepared to characterize the performance of the long path measurement cell. First, a 25.0 mM stock of copper (II) sulfate was made by adding 3.1217 g of copper (II) sulfate pentahydrate (
Simultaneous nitrate and phosphate calibrations used mixed standards containing both nitrate and dissolved orthophosphate, otherwise referred to as “NP standards”. Six combined standards were prepared to evaluate the full dual-species protocol. To prepare the dual-nutrient standards, a stock solution containing 1,000 µM
Finally, the preparation of the nitrate reagent, and of both phosphate reagents, used for each colourimetric assay followed previous works (Murphy et al., 2021; Morgan et al., 2022). Nitrate Reagent was prepared such that 2.5000 g of vanadium (III) chloride, 15 ml of concentrated hydrochloric acid (HCl), 0.1250 g of NEDD (N-(1-Naphthyl)ethylenediamine dihydrochloride, CAS-No. 1465–25–4, Sigma Aldrich) and 1.2500 g of sulfanilamide (CAS-No. 63–74–1, Fisher) was mixed with Milli-Q to a total volume of 500 ml. Similarly, Phosphate Reagent 1 was prepared such that 0.5600 g of ammonium molybdate (VI) tetrahydrate (
3 Results and discussion
3.1 Stable dye calibration
Figure 3 shows the results from a benchtop calibration using stable fluids. Standards of red food dye (RFD) and copper (II) sulfate (
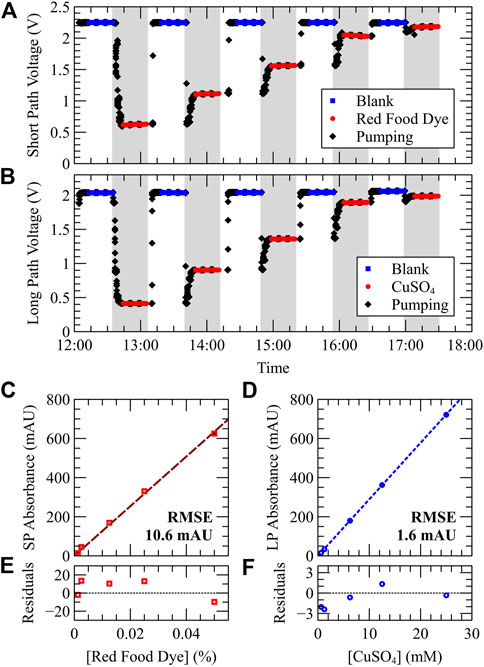
FIGURE 3. Simultaneous calibration of both short and long path optical channels using stable standards. Standards of red food dye (emulating Azo dye for nitrate) or
Figures 3C,D plot absorbance vs. dye concentration for each fluid. Small error bars are shown, computed as the standard deviation of each triplicate absorbance measurement, indicating a strong precision between repeated measurements. Error bars in Figures 3C,D are small in magnitude with a maximum relative error of 4.8%. In the short path data, the largest error observed was 4.8 mAU on the 25 mM standard, but most standard errors were less than 1 mAU. In the long path data, the largest error observed was 0.8 mAU. A linear fit was applied to both datasets showing high correlation (R2 > 0.999). The root-mean-square error of the red food dye and
The molar attenuation coefficient for red food dye and copper (II) sulfate can be calculated by dividing the slope of their absorbance vs. concentration calibration curve by the optical path length. The short and long path optical cells had lengths of 1.04 cm and 2.54 cm, respectively. Using the convention
Based on the data in Figure 3, the combined optical and fluidic stability of the system can be assessed and used to calculate theoretical limits of detection (LODs) for each optical cell. The average photodiode noise observed throughout 15 independent blank measurements was 0.5 mV ± 0.3 mV for the short path and 0.47 mV ± 0.14 mV for the long path. Using three times the photodiode noise [according to the triple-sigma literature method for LOD analysis (Shrivastava and Gupta, 2011)], and a typical blank baseline value of 2 V to convert to absorbance units, an LOD of 0.3 mAU and 0.31 mAU is calculated for both short and long paths and is consistent with previously-reported findings (Morgan et al., 2022). Using the correlation slopes provided in Figures 3C,D, the theoretical LOD of 0.00003% RFD and 11 µM
3.2 NP calibration at room temperature
After dye calibration, a dual chemistry nitrate and phosphate calibration was performed. A series of six calibration standards, each containing varying amounts of nitrate and phosphate, were analyzed from most-to-least concentrated. Figure 4 shows the results from a benchtop nitrate and phosphate calibration at room temperature. Figure 4A shows the raw short path photodiode voltage data during the test, and was used to measure the nitrate concentration of the standard. Figure 4B shows the raw long path voltage data during the same test, and was used to measure the phosphate concentration of the standard. In Figures 4A,B, the unshaded and shaded regions denote blank and sample measurements, respectively. Blue (square) data points correspond to photodiode measurements during stopped flow after flushing with blank. Red (circle) data points correspond to stopped-flow photodiode measurements after pumping standard and reagent into the optical cell. In Figure 4A, standard and nitrate reagent combine to produce the mixed sample in the short optical path. In Figure 4B, standard and both phosphate reagents combine to produce the mixed sample in the long optical path. The raw voltage time-series data begins with the first sample triplicate measurement with its prior blank measured before the test began (data not shown). The usual pattern is then observed whereby blank triplicates precede each sample triplicate.
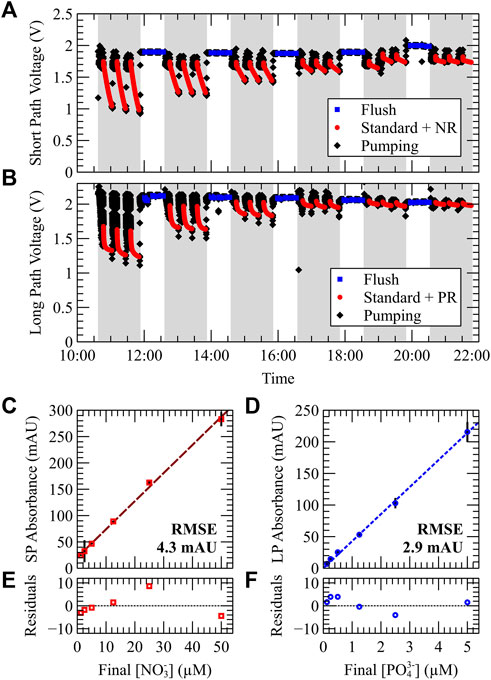
FIGURE 4. Simultaneous dual-nutrient calibration of the NP sensor using six calibration standards at room temperature. Each standard contained a mixture of nitrate and phosphate in a 10:1 concentration ratio. (A,B) Raw photodiode output voltage measured by both short and long path optical cells. For each concentration, three Milli-Q blanks are taken (white regions), followed by three repeated sample measurements (voltage drops). (C,D) Short and long path absorbance plotted against the final nitrate and phosphate concentration of the mixed sample (standard + reagent). (C) Short path absorbance vs. nitrate concentration. (D) Long path absorbance vs. phosphate concentration. (E,F) Residuals of the data in (C,D).
Figure 4C plots short path absorbance vs. the final nitrate concentration in the measurement cell after mixing with reagent. The mixing ratio between standard and reagent was 1:1; therefore, the reported concentrations of Figure 4C are half those of the prepared standards. A linear regression was applied, and a relationship between short path absorbance and nitrate concentration of A = 0.0053 [
Residual analysis of both nitrate and phosphate regression fits are shown in Figures 4E,F, respectively. The magnitude of the largest residual was 8.6 mAU (nitrate) and 4.1 mAU (phosphate); these occurred for nitrate and phosphate standard concentrations of 50 μM and 5 µM (feed concentrations). Therefore, over the tested range of nitrate and phosphate standard concentrations, a maximum error in accuracy of 3.2 µM and 0.19 µM is observed at room temperature conditions for either measurement cell. It should be noted that while the accuracy of our nitrate detection is ∼1/20 that of phosphate, the concentration range is 10 times larger. Similarly, the optical path length is 10.4 mm while that of the phosphate cell is 25.4 mm. This trade-off between accuracy and range was chosen to accommodate typical deployment conditions whereby nitrate concentrations are typically higher than phosphate.
These results can be used to determine the limit of detection (LOD) and limit of quantification (LOQ) of our sensor for both nutrient assays, where the limit of quantification instead uses 10x the blank baseline noise and is considered a more practical metric for sensor performance (Shrivastava and Gupta, 2011). The nitrate LOD and LOQ results are as follows. An average error of 0.4 mV was measured over 15 repeated blank measurements; using a blank baseline of 2 V, this corresponds to an LOD of 0.26 mAU. Using the slope of the calibration curve shown in Figure 4C, 0.0053 AU/µM, a feed concentration LOD of 97 nM and LOQ of 324 nM is determined for our instrument at room temperature conditions. Similarly, the phosphate LOD and LOQ results are as follows. An average error of 0.5 mV was measured over 15 repeated blank measurements; using a conservative but typical blank baseline of 2 V, this corresponds to an LOD of 0.3 mAU. Using the slope of the calibration curve shown in Figure 4D, 0.0428 AU/µM, a feed concentration LOD of 15 nM and LOQ of 49 nM is determined. These limits for phosphate detection compare well with the results of our previous study at room temperature: LOD = 15.2 nM and LOQ = 50.8 nM (Morgan et al., 2022).
3.3 NP calibration at fixed temperatures
The properties of both color development assays must be characterized at a variety of temperatures before deployment. Using the dual chemistry protocol, three calibrations were performed, each at a fixed temperature: T = 5°C, 10°C, and 15°C. The results of the temperature characterization of our system are shown in Figures 5, 6. In Figure 5A, short path absorbance vs. sample nitrate concentration is plotted for each of the three temperature calibrations. A linear regression with forced-zero intercept is applied to each data set with parameters outlined in Table 1. An exponential relationship between measurement sensitivity S and temperature T was then determined from each calibration slope:
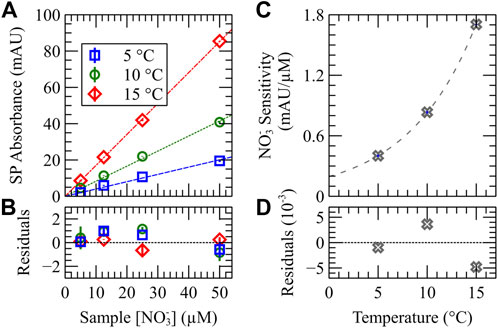
FIGURE 5. Nitrate data from a dual NP temperature calibration study. A four-sample calibration curve was performed at three fixed temperatures, 5°C, 10°C, and 15°C. (A) Short path absorbance measurements plotted vs. final nitrate concentration in the mixed sample. (B) Residuals from the data in (A). (C) Sensitivity vs. temperature relationship for the nitrate assay; an exponential fit is applied to the data with residuals in (D).

FIGURE 6. Phosphate data from a dual NP temperature calibration study. A four-sample calibration curve was performed at three fixed temperatures, 5°C, 10°C, and 15°C. (A) Long path absorbance measurements plotted vs. final phosphate concentration in the mixed sample. (B) Residuals from the data in (A). (C) Sensitivity vs. temperature relationship for the phosphate assay; a linear fit is applied to the data with residuals in (D).
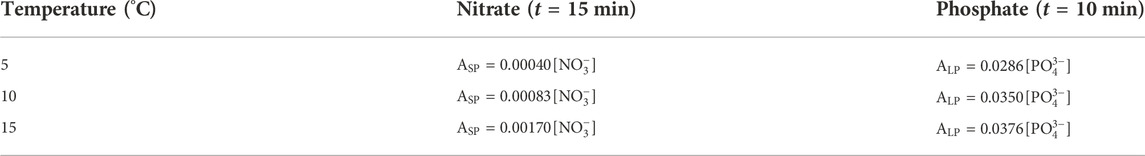
TABLE 1. Dual-chemistry nitrate and phosphate temperature study linear regressions. Numerical values have units of AU/µM. Regression coefficients are expressed in terms of the final nutrient concentration in the optical cell after mixing with reagent.
Figure 6 shows the phosphate results from the same dual chemistry temperature calibration study. Figure 6A plots long path absorbance vs. sample phosphate concentration for each temperature calibration. A linear regression with forced-zero intercept is applied to each data set with parameters outlined in Table 1. For each temperature, the most concentrated sample was omitted from the applied fit to optimize sensor performance for “typical” environment conditions (i.e. [
In summary of the phosphate results, when measuring samples of feed phosphate concentration 5 µM or lower, a relationship between sensitivity vs. temperature of
3.4 Field deployment: Sackville River, NS
In August 2022, a 1-week shallow water deployment was performed at a junction between Sackville River and the northern tip of the Bedford Basin (44°43′45.0″N, 63°39′44.4″W). A sensor package containing the NP Sensor, battery pack, and fluids was deployed with an RBR Brevio3 CTD and a Xeos iridium beacon (Xeos Technologies Inc., Dartmouth Canada). A large, perforated cage was used to contain the various instruments without causing water stagnation and sat on the bottom of the river. The depth of the NP Sensor ranged from 0.3 m–2.0 m depending on tides and precipitation, while the water temperature ranged from 17°C–24°C.
Figure 7 combines sensor data measured in situ throughout the Sackville River deployment. In Figures 7A,B, nutrient measurements obtained from the NP Sensor are shown with accompanying temperature and depth measurements from the CTD. For each nutrient measurement, the ratio of measured nitrate to dissolved orthophosphate was computed and plotted in Figure 7C. Water level and discharge measurements obtained from a sensor located approximately 400 m upstream from our deployment location are overlaid to contextualize N:P fluxes [obtained from the Government of Canada, Station 01EJ0011, 44° 43′ 53″ N 63° 39′ 37″ W, (Government of Canada, 2022)]. Finally, Figure 7D plots the measured nitrate and phosphate concentration of an on-board standard. The on-board standard was analyzed periodically throughout the course of the deployment as a method of in situ performance assessment.
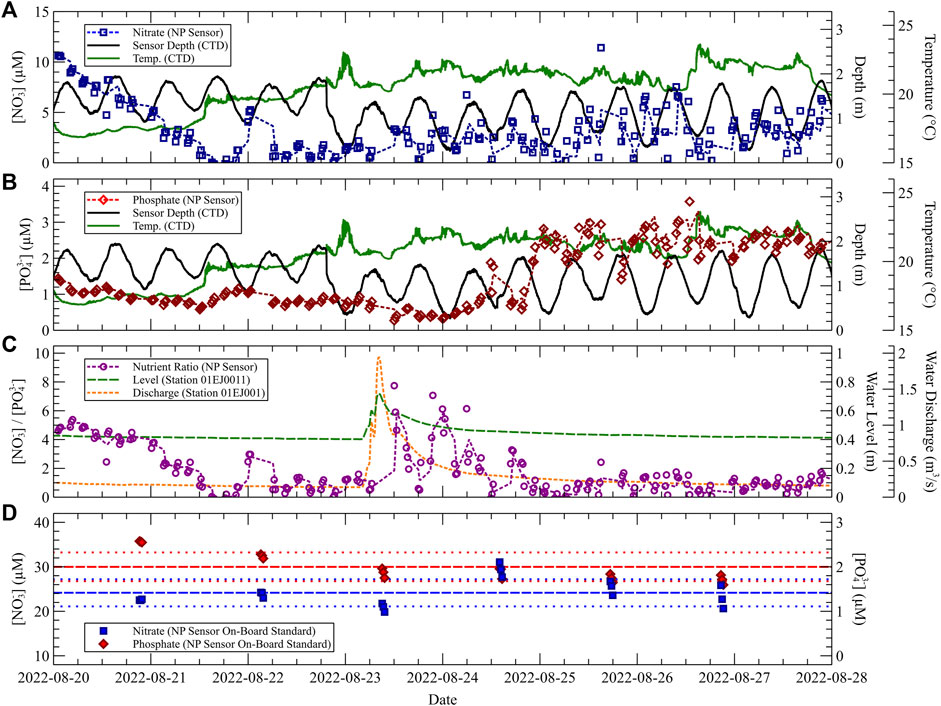
FIGURE 7. Measurement data from an 8-day deployment at Fish Hatchery Park. Depth and temperature CTD measurements are overlaid with NP Sensor measurements. (A) Nitrate measurements and moving average curve (dashed line, n = 3). (B) Phosphate measurements and moving average. (C) Nitrate to phosphate ratio with water level and discharge data retrieved from the Government of Canada (Station 01EJ0011). (D) Nitrate and phosphate measurements of an on-board standard that contained 25 µM [
In Figure 7A, the measured nitrate concentration at the start of the deployment was high (roughly 10 µM) and dropped over the course of the first two days towards near-zero. Over the next few days, an out-of-phase pattern between nitrate concentration and water depth can be observed, where the lowest sensor measurements typically occurred at high tide (and highest measurements at low tide). Finally, over the last three days, nitrate levels are observed to fluctuate more drastically in comparison to the previous 5 days. Similarly, in Figure 7B, the measured phosphate concentration over the first two days began at roughly 1.5 µM and dropped on average until the mid-point of the second day. The measured phosphate levels remained relatively consistent throughout the course of the first four days compared to the fluctuations observed in the nitrate results. However, a sharp increase in measured phosphate is observed beginning on the 24th. Phosphate concentrations spiked up to roughly 3 µM and remained high from the 25th until the end of the deployment.
A Fast Fourier Transform (FFT) analysis of the phosphate measurement data revealed a frequency peak corresponding to a period of 12.7 h: consistent with the corresponding 12.3 h peak observed in the tidal data captured by the CTD within a 3.2% difference. The phase difference between phosphate and tidal measurements appears to be roughly 180°C (out-of-phase). On the other hand, FFT analysis of the nitrate measurement data did not show this tidal frequency peak. We speculate that phosphate concentrations at our deployment location measured out-of-phase with tides due to dilution from water sourced by the Bedford Basin which was of relatively low phosphate concentration. This argument is supported by external data obtained from a DOT Phosphate Sensor deployed off the Centre for Ocean Ventures and Entrepreneurship’s Stella Maris Multi-Sensor Seabed Platform (MSSP) during the same period. Deployed at a depth that ranged between 8 m–10 m, the sensor measured phosphate concentrations below 1 µM in the Bedford Basin throughout our 8-day deployment in the river. A study by Shi and Wallace in 2018 demonstrated two-layer flow in the Sackville River, where the top layer is comprised of freshwater discharge by the river towards the basin, while the bottom layer is comprised of higher salinity water sourced by the basin (Shi and Wallace, 2018). Our sensor was stationed on the bottom of the river and therefore was most influenced by dilution from the basin.
The measured concentrations of both nitrate and phosphate are used in Figure 7C to calculate the measured nitrate-to-phosphate ratio (N:P ratio) over time. A spike in the N:P ratio is observed beginning midday on August 23rd and corresponded with a significant rainfall event that persisted throughout the day. At the same time, water level and discharge data obtained from the Government of Canada at Station 01EJ0011 (400 m upstream) indicates a corresponding spike in water level and discharge from the Sackville River. As the water level and discharge data returns to the previous levels reported the day prior, the measured N:P ratio also returns to the pre-spike levels. It should also be noted that the N:P ratio observed during the first 1.5 days of the deployment was also high on average. While not shown, a similar spike in water level and discharge occurred a few days prior on August 17th. From these findings, we speculate that nitrate concentrations in the river are most influenced not by tidal behavior, but instead by loading through runoff and/or sediment disruption.
A total of 18 individual standard measurements were made throughout the 8-day deployment: these results are plotted in Figure 7D. Standard measurements were performed in triplicate and occurred at 6 intervals each (approximately) 30 h apart. The concentration of the on-board standard was [
4 Conclusion
A dual-species microfluidic sensor was developed and deployed to measure both nitrate and dissolved orthophosphate simultaneously in situ. After proof-of-concept benchtop testing of the “NP Sensor” with fixed-temperature studies, the sensor was deployed in the Sackville River at the mouth of the Bedford Basin in Nova Scotia, Canada. A total of 592 measurements were performed, including periodic in situ verification checks via measurement of an on-board combined nutrient standard, over the course of eight days in the river. A distinct out-of-phase relationship between measured dissolved orthophosphate levels and tide was observed through fast Fourier transform (FFT) analysis of NP Sensor and accompanying CTD water level measurements. Similarly, a spike in the measured nitrate to dissolved orthophosphate (N:P) ratio occurred concurrently with a significant rainfall event on the 23rd of August, which may be indicative of runoff and dominant nitrogen-based fertilizer application in the surrounding area. Future optimization efforts will include a comprehensive study of salinity effects on the modified Griess assay, along with the inclusion of a micro-heater in the lab-on-chip to accelerate reaction rates and improve detection limits in cold environments. We anticipate that multi-chemistry lab-on-chip systems, like the one presented, will be extremely useful in aquatic environments for providing the necessary spatial and temporal resolution to observe and manage our impact on local ecosystems.
Data availability statement
The raw data supporting the conclusion of this article will be made available by the authors, without undue reservation.
Author contributions
EL performed experimental work; EL conducted field work assisted by IG; EL, JS, IG, CS, and VS designed and fabricated the various instruments used in the manuscript; EL wrote the original manuscript draft; EL, JS, IG, CS, AF, and VS reviewed and edited the manuscript; VS and AF acquired funding and supervised the project.
Funding
Gratitude is expressed towards Canada’s Ocean Supercluster (OSC), the National Research Council of Canada’s Industrial Research Assistance Program (NRC IRAP), the Natural Sciences and Engineering Research Council (NSERC), and Canada First Research Excellence Fund (CFREF) through the Ocean Frontier Institute (OFI) for funding.
Acknowledgments
Acknowledgements are extended to Anadiuska Rondon Vivas for bottle sample AutoAnalyzer analysis, and to Heather Daurie from the Dalhousie Water Lab for the Centre of Water Resources Studies for supplying Milli-Q. water. Finally, acknowledgments go to the team of staff and contractors from Dartmouth Ocean Technologies Inc., involved with the project, including Lee Miller, Merle Pittman, Connor Mackie, Mark Wright, Kirk Phelan, and Tom Knox.
Conflict of interest
EL, JS, IG, CS, AF, and VS were employed by Dartmouth Ocean Technologies Inc. VS and AF also declare shareholdings in Dartmouth Ocean Technologies Inc.
Publisher’s note
All claims expressed in this article are solely those of the authors and do not necessarily represent those of their affiliated organizations, or those of the publisher, the editors and the reviewers. Any product that may be evaluated in this article, or claim that may be made by its manufacturer, is not guaranteed or endorsed by the publisher.
Supplementary material
The Supplementary Material for this article can be found online at: https://www.frontiersin.org/articles/10.3389/fsens.2022.1080020/full#supplementary-material
References
Anderson, D. M., Glibert, P. M., and Burkholder, J. M. (2002). Harmful algal blooms and eutrophication: Nutrient sources, composition, and consequences. Estuaries 25, 704–726. doi:10.1007/BF02804901
Ardón, M., Zeglin, L. H., Utz, R. M., Cooper, S. D., Dodds, W. K., Bixby, R. J., et al. (2021). Experimental nitrogen and phosphorus enrichment stimulates multiple trophic levels of algal and detrital-based food webs: a global meta-analysis from streams and rivers. Biol. Rev. 96, 692–715. doi:10.1111/brv.12673
Beaton, A. D., Schaap, A. M., Pascal, R., Hanz, R., Martincic, U., Cardwell, C. L., et al. (2022). Lab-on-Chip for in situ analysis of nutrients in the deep sea. ACS Sens. 7, 89–98. doi:10.1021/acssensors.1c01685
Burton, L., Jayachandran, K., and Bhansali, S. (2020). Review—the “real-time” revolution for in situ soil nutrient sensing: A review. J. Electrochem. Soc. 167, 037569. doi:10.1149/1945-7111/ab6f5d
Cao, X., Zhang, S.-W., Chu, D.-Z., Wu, N., and Ma, H.-K. (2018). Development of lab-on-chip spectrophotometric silicate sensor in situ analysis of seawater. Guang Pu Xue Yu Guang Pu Fen Xi/Spectrosc. Spectr. Anal. 38, 895–900. doi:10.3964/j.issn.1000-0593(2018)03-0895-06
Clinton-Bailey, G. S., Grand, M. M., Beaton, A. D., Nightingale, A. M., Owsianka, D. R., Slavik, G. J., et al. (2017). A lab-on-chip analyzer for in situ measurement of soluble reactive phosphate: Improved phosphate blue assay and application to fluvial monitoring. Environ. Sci. Technol. 51, 9989–9995. doi:10.1021/acs.est.7b01581
Dodds, W. K., Bouska, W. W., Eitzmann, J. L., Pilger, T. J., Pitts, K. L., Riley, A. J., et al. (2009). Eutrophication of U.S. Freshwaters: Analysis of potential economic damages. Environ. Sci. Technol. 43, 12–19. doi:10.1021/es801217q
FAOSTAT (2022). Fertilizers by nutrient. License: CC BY-NC-SA 3.0 IGO. Extracted from: https://www.fao.org/faostat/en/#data/RFN/visualize (Date of Access 04 28, 2022).
Fukuba, T., and Fujii, T. (2021). Lab-on-a-chip technology for in situ combined observations in oceanography. Lab. Chip 21, 55–74. doi:10.1039/D0LC00871K
Garrett, M., Wolny, J., Truby, E., Heil, C., and Kovach, C. (2011). Harmful algal bloom species and phosphate-processing effluent: field and laboratory studies. Mar. Pollut. Bull. 62, 596–601. doi:10.1016/j.marpolbul.2010.11.017
Government of Canada (2022). Real time hydrometric data graph for SACKVILLE RIVER AT BEDFORD (01EJ001) [NS] - water level and flow - environment Canada. Available at: https://wateroffice.ec.gc.ca/report/realtime_e.html?stn=01EJ001 (Accessed October 3, 2022).
Grand, M. M., Clinton-Bailey, G. S., Beaton, A. D., Schaap, A. M., Johengen, T. H., Tamburri, M. N., et al. (2017). A lab-on-chip phosphate analyzer for long-term in situ monitoring at fixed observatories: Optimization and performance evaluation in estuarine and oligotrophic coastal waters. Front. Mar. Sci. 4. doi:10.3389/fmars.2017.00255
Guignard, M. S., Leitch, A. R., Acquisti, C., Eizaguirre, C., Elser, J. J., Hessen, D. O., et al. (2017). Impacts of nitrogen and phosphorus: From genomes to natural ecosystems and agriculture. Front. Ecol. Evol. 5, 1–3. doi:10.3389/fevo.2017.00070
Hansen, H. P., and Koroleff, F. (1999). “Determination of nutrients,” in Methods of seawater analysis, 159–228. doi:10.1002/9783527613984.ch10
Hattenrath, T. K., Anderson, D. M., and Gobler, C. J. (2010). The influence of anthropogenic nitrogen loading and meteorological conditions on the dynamics and toxicity of Alexandrium fundyense blooms in a New York (USA) estuary. Harmful Algae 9, 402–412. doi:10.1016/j.hal.2010.02.003
Jankowiak, J., Hattenrath-Lehmann, T., Kramer, B. J., Ladds, M., and Gobler, C. J. (2019). Deciphering the effects of nitrogen, phosphorus, and temperature on cyanobacterial bloom intensification, diversity, and toxicity in Western Lake Erie. Limnol. Oceanogr. 64, 1347–1370. doi:10.1002/lno.11120
Kepkay, P., Niven, S., and Milligan, T. (1993). Low molecular weight and colloidal DOC production during a phytoplankton bloom. Mar. Ecol. Prog. Ser. 100, 233–244. doi:10.3354/meps100233
Li, Z., Liu, H., Wang, D., Zhang, M., Yang, Y., and Ren, T. (2022). Recent advances in microfluidic sensors for nutrients detection in water. TrAC Trends Anal. Chem. 158, 116790. doi:10.1016/j.trac.2022.116790
Luy, E. A., Morgan, S. C., Creelman, J. J., Murphy, B. J., and Sieben, V. J. (2020). Inlaid microfluidic optics: absorbance cells in clear devices applied to nitrite and phosphate detection. J. Micromech. Microeng. 30, 095001. doi:10.1088/1361-6439/ab9202
McCaul, M., Magni, P., Jordan, S. F., McNamara, E., Satta, A., Diamond, D., et al. (2021). Nutrient analysis in arctic waters using a portable sensing platform. Front. Sens. 2, 1–10. doi:10.3389/fsens.2021.711592
Morgan, S., Luy, E., Furlong, A., and Sieben, V. (2022). A submersible phosphate analyzer for marine environments based on inlaid microfluidics. Anal. Methods 14, 22–33. doi:10.1039/D1AY01876K
Murphy, B. J., Luy, E. A., Panzica, K. L., Johnson, G., and Sieben, V. J. (2021). An energy efficient thermally regulated optical spectroscopy cell for lab-on-chip devices: Applied to nitrate detection. Micromachines 12, 861. doi:10.3390/mi12080861
Nightingale, A. M., Hassan, S.-U., Evans, W. H. G., M Coleman, S., and Niu, X. (2018). Nitrate measurement in droplet flow: Gas-mediated crosstalk and correction. Lab. Chip 18, 1903–1913. doi:10.1039/C8LC00092A
Quan, T. M., and Falkowski, P. G. (2009). Redox control of N:P ratios in aquatic ecosystems. Geobiology 7, 124–139. doi:10.1111/j.1472-4669.2008.00182.x
Shi, Q., and Wallace, D. (2018). A 3-year time series of volatile organic iodocarbons in Bedford Basin, Nova Scotia: A northwestern atlantic fjord. Ocean. Sci. 14, 1385–1403. doi:10.5194/os-14-1385-2018
Shrivastava, A., and Gupta, V. (2011). Methods for the determination of limit of detection and limit of quantitation of the analytical methods. Chron. Young Sci. 2, 21–25. doi:10.4103/2229-5186.79345
Sinha, E., Michalak, A., and Balaji, V. (2017). Eutrophication will increase during the 21st century as a result of precipitation changes. Science 357, 405–408. doi:10.1126/science.aan2409
Sjösten, A., and Blomqvist, S. (1997). Influence of phosphate concentration and reaction temperature when using the molybdenum blue method for determination of phosphate in water. Water Res. 31, 1818–1823. doi:10.1016/S0043-1354(96)00367-3
Willett, W., Rockström, J., Loken, B., Springmann, M., Lang, T., Vermeulen, S., et al. (2019). Food in the anthropocene: the EAT–lancet commission on healthy diets from sustainable food systems. Lancet 393, 447–492. doi:10.1016/S0140-6736(18)31788-4
Wolf, D., and Klaiber, H. (2017). Bloom and bust: Toxic algae’s impact on nearby property values. Ecol. Econ. 135, 209–221. doi:10.1016/j.ecolecon.2016.12.007
Wurtsbaugh, W., Paerl, H., and Dodds, W. (2019). Nutrients, eutrophication and harmful algal blooms along the freshwater to marine continuum. WIREs Water 6, e1373. doi:10.1002/wat2.1373
Yin, T., Papadimitriou, S., Rérolle, V. M. C., Arundell, M., Cardwell, C. L., Walk, J., et al. (2021). A novel lab-on-chip spectrophotometric pH sensor for autonomous in situ seawater measurements to 6000 m depth on stationary and moving observing platforms. Environ. Sci. Technol. 55, 14968–14978. doi:10.1021/acs.est.1c03517
Keywords: nitrate, phosphate, sensor, microfluidics, in situ, submersible, deployment, spectrophotometry
Citation: Luy E, Smith J, Grundke I, Sonnichsen C, Furlong A and Sieben V (2022) Two chemistries on a single lab-on-chip: Nitrate and orthophosphate sensing underwater with inlaid microfluidics. Front. Sens. 3:1080020. doi: 10.3389/fsens.2022.1080020
Received: 25 October 2022; Accepted: 25 November 2022;
Published: 07 December 2022.
Edited by:
Chang-Hyung Choi, Daegu Haany University, South KoreaReviewed by:
Tugba Ozer, Yıldız Technical University, TurkeyQinshu Kang, Huazhong Agricultural University, China
Copyright © 2022 Luy, Smith, Grundke, Sonnichsen, Furlong and Sieben. This is an open-access article distributed under the terms of the Creative Commons Attribution License (CC BY). The use, distribution or reproduction in other forums is permitted, provided the original author(s) and the copyright owner(s) are credited and that the original publication in this journal is cited, in accordance with accepted academic practice. No use, distribution or reproduction is permitted which does not comply with these terms.
*Correspondence: Edward Luy, ZWRkeS5sdXlAZGFydG1vdXRob2NlYW4uY29t; Vincent Sieben, c2llYmVuQGRhbC5jYQ==