
94% of researchers rate our articles as excellent or good
Learn more about the work of our research integrity team to safeguard the quality of each article we publish.
Find out more
ORIGINAL RESEARCH article
Front. Water, 28 February 2025
Sec. Water and Climate
Volume 7 - 2025 | https://doi.org/10.3389/frwa.2025.1520258
 Shanshan Sun1*†
 Shiqin Xu2†
 Lingcheng Li3†
 Yihua Lin4,5†Hongbo Liu6†
 Viviana Maggioni7†
 Yan Xu8†
 Congsheng Fu9†
Introduction: Rising concerns about climate change underscore the need to understand precipitation and evapotranspiration variability across multiple temporal scales.
Methods: This study evaluates historical simulations from Phase Six of the Coupled Model Intercomparison Project (CMIP6) for precipitation (Pr), evapotranspiration (ET), and its components—soil evaporation (Es), transpiration (Et), and interception loss (Ei)—from 1981 to 2014, focusing on the temporal agreement of the mean seasonal cycle and interannual variability. We assess these variables using observation-based estimates from three Pr datasets (CRU4.0, GPCP v2.3, ERA5) and four land surface flux datasets (GLEAM v3.3a, GLDAS v2.0, ERA5-Land, MERRA-Land). Pearson’s correlation coefficients (r) are used to identify “consensus regions”.
Results and discussion: The results indicate that consensus regions of the mean seasonal cycle for Pr cover 92.9% of global land area, decreasing to 81.7% at the interannual scale. For ET and its components, the consistency of the mean seasonal cycle is observed over 79.0% of land area for ET, 55.5% for Es, 57.7% for Et, and 65.1% for Ei, with values dropping to 38.1%, 11.7%, 23.4%, and 21.2%, respectively, at the interannual scale. The multi-model means generally correlate better with observations than individual CMIP6 models. Across latitudes, Pr and ET exhibit the highest performance in reproducing the observed mean seasonal cycle, while Es and Et demonstrate the lowest performance. CESM2 shows the highest consistency in reproducing the mean seasonal cycle for Pr, while CMCC-CM2-HR4 performs best for ET and its components. Despite relatively high correlations with the observed mean seasonal cycle, the individual models and multi-model mean underestimates Pr in tropical regions and overestimates ET, Es, and Ei, while underestimating Et in general. The agreement between CMIP6 simulations and observational datasets deteriorates at the interannual scale. These findings highlight the need to improve Pr and ET simulations in CMIP6 models, particularly in tropics.
The growing concerns over climate change have highlighted the importance of understanding precipitation variability across multiple temporal scales. As the primary source of moisture driving terrestrial hydrological processes (Bellucci et al., 2015; Wang et al., 2017), precipitation’s temporal patterns are crucial in hydrological studies (Abed-Elmdoust et al., 2016; Singhal et al., 2024). Observation-based precipitation datasets, however, can differ significantly depending on their origin, whether they come from ground-based gauges (e.g., CRU; Harris et al., 2020), satellite remote sensing (e.g., GPCP; Adler et al., 2003), or reanalysis products (e.g., ERA5 data; Hersbach et al., 2020). Each source has inherent limitations—such as varying measurement accuracy, spatial resolution, and temporal coverage—which can lead to temporal inconsistencies across datasets. These variations can ultimately introduce substantial uncertainty in hydrological assessments and climate analyses.
A high-quality simulation of historical precipitation is fundamental to the effective use of climate models for future projections, as it builds confidence in the models’ ability to capture temporal variability. However, models such as those from the CMIP5 (Taylor et al., 2012) and CMIP6 (Eyring et al., 2016) frameworks still exhibit significant uncertainties. These uncertainties stem from factors such as initial condition errors, parameterization schemes, and model structure limitations (Rivera and Arnould, 2020; Tian and Dong, 2020; Li J. et al., 2021). Specifically, the ability of General Circulation Models (GCMs) to simulate interannual and longer-term precipitation variability remains particularly challenging, which may be attributable to the difficulties in representing complex ocean–atmosphere interactions (Brown et al., 2016; Dieppois et al., 2016) and land-surface processes (Granato-Souza et al., 2020). Consequently, even the latest CMIP5 and CMIP6 models tend to underestimate precipitation variability across various time scales (Ault et al., 2012; Martin et al., 2014; Zhu and Yang, 2021). Therefore, validations of model simulations against observation-based datasets provide basis for identifying biases and could lead to potential improvements on future climate projections.
Similar to precipitation, considerable uncertainties also persist in ET datasets derived from various sources. Currently, direct measurements of global land fluxes, including ET, are lacking, resulting in substantial uncertainties in the available datasets. Widely-used ET datasets are typically generated either by numerical algorithms assimilated with observational data (e.g., ERA5-Land in Hersbach et al., 2020), data-driven products (e.g., FLUXCOM-X-BASE in Nelson et al., 2024), or model-assisted products (e.g., GLDAS v2.0 in Kumar et al. (2006); MERRA-Land in Reichle (2012); GLEAM v3.3a in Martens et al. (2017)). Model-assisted flux products rely on land process schemes or models, which could be soil-vegetation-atmosphere transfer schemes (SVAT-based models in Kumar et al. (2006)), energy-balance models (Martens et al., 2017), or catchment-scale water-balance models (Koster et al., 2000; Reichle, 2012). The choice of numerical schemes could significantly influence the variability of these ET products (Miralles et al., 2016).
Temporal inconsistencies are evident both among observation-based precipitation datasets from different sources and between model outputs and these datasets, highlighting challenges in accurately representing precipitation variations at different time scales. Akinsanola et al. (2017) compare five gridded datasets over West Africa—GPCC and CRU (gauge-based), CHIRPS (gauge and satellite-based), TRMM (satellite-based), and PERSIANN (satellite-based)—using GPCC as the benchmark. They find that while these datasets show relative consistency in capturing decadal-scale regional averages, significant inconsistencies emerge at annual and seasonal scales, particularly for CHIRPS and PERSIANN. Gehne et al. (2016) similarly demonstrate that global precipitation datasets, including satellite-based products (GPCP, CMORPH) and reanalysis datasets (ERA-Interim, MERRA), align well when examining broad, continental averages, but substantial discrepancies appear at finer spatial scales, such as regional or sub-regional areas. Tang et al. (2020) further highlight that despite improvements in recent satellite products like GPM IMERG, inconsistencies persist in capturing short-term precipitation patterns in regions like tropical rainforests and mountainous areas compared to reanalysis datasets like ERA5 and MERRA2. Rivera and Arnould (2020) demonstrate that while CMIP6 models reasonably capture decade-scale precipitation trends over Southwestern South America, they struggle with consistency at seasonal and interannual scales compared to observational datasets like GPCC and CRU. Li et al. (2022) extend this finding by showing that CMIP6 models maintain relative consistency with global land precipitation means on an interannual basis but exhibit substantial biases at seasonal and monthly scales, particularly in specific regions such as the tropics and high latitudes. Such discrepancies underscore the ongoing challenges in accurately representing precipitation dynamics across different sources and timescales.
The temporal variations in ET also exhibit considerable inconsistencies both among observation-based datasets and between model outputs and these datasets, presenting challenges in accurately representing ET temporal dynamics across different time scales. Bai (2023) compares multiple remote sensing ET models and finds significant discrepancies particularly at seasonal and monthly scales, with notable divergences in regions like arid and semi-arid areas as well as tropical zones. Xu et al. (2019) evaluate twelve ET products, including those derived from machine learning, remote sensing, and land surface models, and reveal substantial inconsistencies at monthly and seasonal time scales across the conterminous United States. Miralles et al. (2016) provide a comprehensive evaluation of global ET datasets from multiple sources (satellite-based, reanalysis, and hybrid), showing that while these datasets align reasonably well in capturing the annual time series of global means, they exhibit considerable biases in reproducing interannual and seasonal variability in specific region including the Amazon and Siberia. Zhang et al. (2023) highlight that ET estimates derived from energy-balance and water-balance approaches diverge significantly in humid regions like Southeast Asia and the eastern United States, leading to temporal discrepancies primarily at monthly and seasonal scales. Wang et al. (2021) focus on CMIP6 models and demonstrate that while these models capture broad, long-term ET trends when evaluating global means, they fail to match the observed seasonal and monthly time scales of ET in specific regions such as tropical rainforests (e.g., Amazon, Central Africa), arid and semi-arid zones (e.g., Sahara, Central Asia), high-latitude areas (e.g., Northern Europe, Siberia), and monsoon regions (e.g., South Asia, Southeast Asia). Analyze both global land averages and regional patterns and show that CMIP6 models struggle to simulate land surface energy and water fluxes accurately over the historical period, with biases becoming evident at interannual and seasonal scales in regions like Europe and East Asia. These studies collectively illustrate that temporal inconsistencies at different time scales in ET estimates persist across various observation-based datasets and between models and observations in regions with diverse climate conditions such as tropical rainforests, arid zones, and humid areas.
In this study, we evaluate the performance of CMIP6 historical simulations by comparing their variability and mean values against multiple observation-based Pr and ET datasets. Specifically, our investigation focuses on two primary objectives: (1) to assess the temporal consistency among observation-based datasets with respect to the mean seasonal cycle and interannual variability on a global scale, and (2) to evaluate the ability of CMIP6 historical simulations in capturing temporal variations and mean values within regions where observation-based estimates exhibit temporal consistency. It should be emphasized that this analysis is intended to identify regions where temporal consistency exists across datasets, rather than to validate the physical accuracy or representativeness of the data. Such agreements reflect the current status quo of dataset development and modeling practices; however, alignment among datasets may arise from shared limitations or biases rather than accurate representation of physical processes.
The remainder of this paper is organized as follows: First, we describe the datasets and methodologies employed in our analysis. Secondly, we identify “consensus regions” based on observation-based estimates and evaluate the performance of CMIP6 models within these regions. Finally, we present our findings and discuss their broader implications in the concluding section.
The CRU TS monthly precipitation time series is derived from quality-controlled station precipitation anomalies, which are interpolated into grids using the angular distance weighting (ADW) method. The gridded actual precipitation is generated by combining anomalous and climatological information, resulting in data at a 0.5° x 0.5° spatial resolution (Harris et al., 2020).
GPCP is a component of the Global Energy and Water Cycle Exchanges (GEWEX) program hosted by the World Climate Research Program (WCRP). It synthesizes satellite and rain gauge data to estimate terrestrial precipitation (Adler et al., 2003). In version 2.3, land precipitation estimates have been improved by incorporating more sampling datasets in the assimilation process. The original GPCP v2.3 data are provided at a spatial resolution of 2.5° x 2.5° (Adler et al., 2003).
The ERA5 dataset represents a state-of-the-art precipitation dataset developed by the European Centre for Medium-Range Weather Forecasts (ECMWF) using a weakly coupled model assimilation system constrained by observational data (Bonavita et al., 2016; Hersbach et al., 2018). Compared to its earlier versions, ERA5 offers improved credibility due to advancements in model physics and assimilation techniques. The original dataset is available at a spatial resolution of 0.25° x 0.25° (Hersbach et al., 2020).
GLEAM v3.3a integrates satellite observations with physically-based numerical algorithms to estimate land ET and related hydrological variables (Martens et al., 2017). The land cover types are determined using the Global Vegetation Continuous Fields dataset derived from Moderate Resolution Imaging Spectroradiometer (MODIS) observations (Hansen and Song, 2017; Song et al., 2018). The model adjusts surface soil moisture through assimilation of both satellite-based and in-situ observations (Rodell et al., 2004; Wagner et al., 2012). The dynamics of root zone soil moisture are computed using a multi-layer drainage balance algorithm. ET components such as transpiration and soil evaporation are estimated by applying a stress factor (S) to potential evaporation (Ep), while interception loss is modeled separately (Miralles et al., 2016). The dataset is presented at a spatial resolution of 0.25° x 0.25°.
GLDAS v2.0 combines observed atmospheric forcings with prescribed land configurations—such as soil properties and vegetation indices—to run offline land models that generate terrestrial variables (Rodell et al., 2004). In this study, the Noah3.6 land model is used, which is driven by the Princeton V2.2 meteorological dataset (Kumar et al., 2006). The dataset has a spatial resolution of 0.25° x 0.25°.
The ERA5-Land dataset, developed by the European Centre for Medium-Range Weather Forecasts (ECMWF), is designed for reconstructing high-resolution land surface variables. It employs a loosely coupled land-atmosphere data assimilation system driven by observational constraints (Hersbach et al., 2018). The Tiled ECMWF Scheme for Surface Exchanges over Land (TESSEL) is utilized to simulate land processes, enhanced by improvements in soil hydrology, vegetation structures, and snow dynamics (Balsamo et al., 2015). These enhancements lead to better simulations of soil moisture and land surface fluxes. The original dataset is available at a spatial resolution of 0.1° x 0.1° (Hersbach et al., 2020).
The MERRA-Land product is derived from NASA’s Modern Era Retrospective-analysis for Research and Applications (MERRA) initiative. MERRA-Land’s precipitation forcings are adjusted using gauge- and satellite-based data from the NOAA Climate Prediction Center (GPCP version 2.1). Land hydrology simulations are performed using the enhanced Catchment land surface model, “Fortuna-2.5,” which incorporates improved vegetation interception and snow dynamics, leading to better global latent heat fluxes and accurate soil moisture and runoff estimates (Reichle et al., 2011; Reichle, 2012). The dataset is available at a spatial resolution of 0.7° x 0.5°.
The CMIP6 represents the latest collaborative effort within the scientific community, led by the World Climate Research Programme’s (WCRP) Working Group on Coupled Modeling (WGCM). The CMIP6 historical simulations aim to reproduce climate variability from 1850 to 2014. This extensive project integrates various external forcings, including greenhouse gases (GHGs), land-use and land-cover (LULC) changes, solar irradiance, and volcanic radiative effects, based on observational data (Eyring et al., 2016). By incorporating these diverse factors, CMIP6 offers a comprehensive framework for analyzing the complex drivers of climate dynamics, providing valuable insights to the broader climate research community.
In this study, historical outputs from 14 CMIP6 models, listed in Table 1, are utilized. Snow sublimation is included within the Es and Ei variables. Therefore, the sum of Es (evspsblsoi), Et (tran), and Ei (evspsblveg) from the land is expected to closely correspond to the total ET (evspsbl) from the atmosphere. Models in which the absolute difference between the sum of the three ET components and atmospheric ET does not exceed 10% of atmospheric ET are used in this analysis, as shown in Table 2. For consistency, the first ensemble member (r1i1p1f1) is selected for each model.
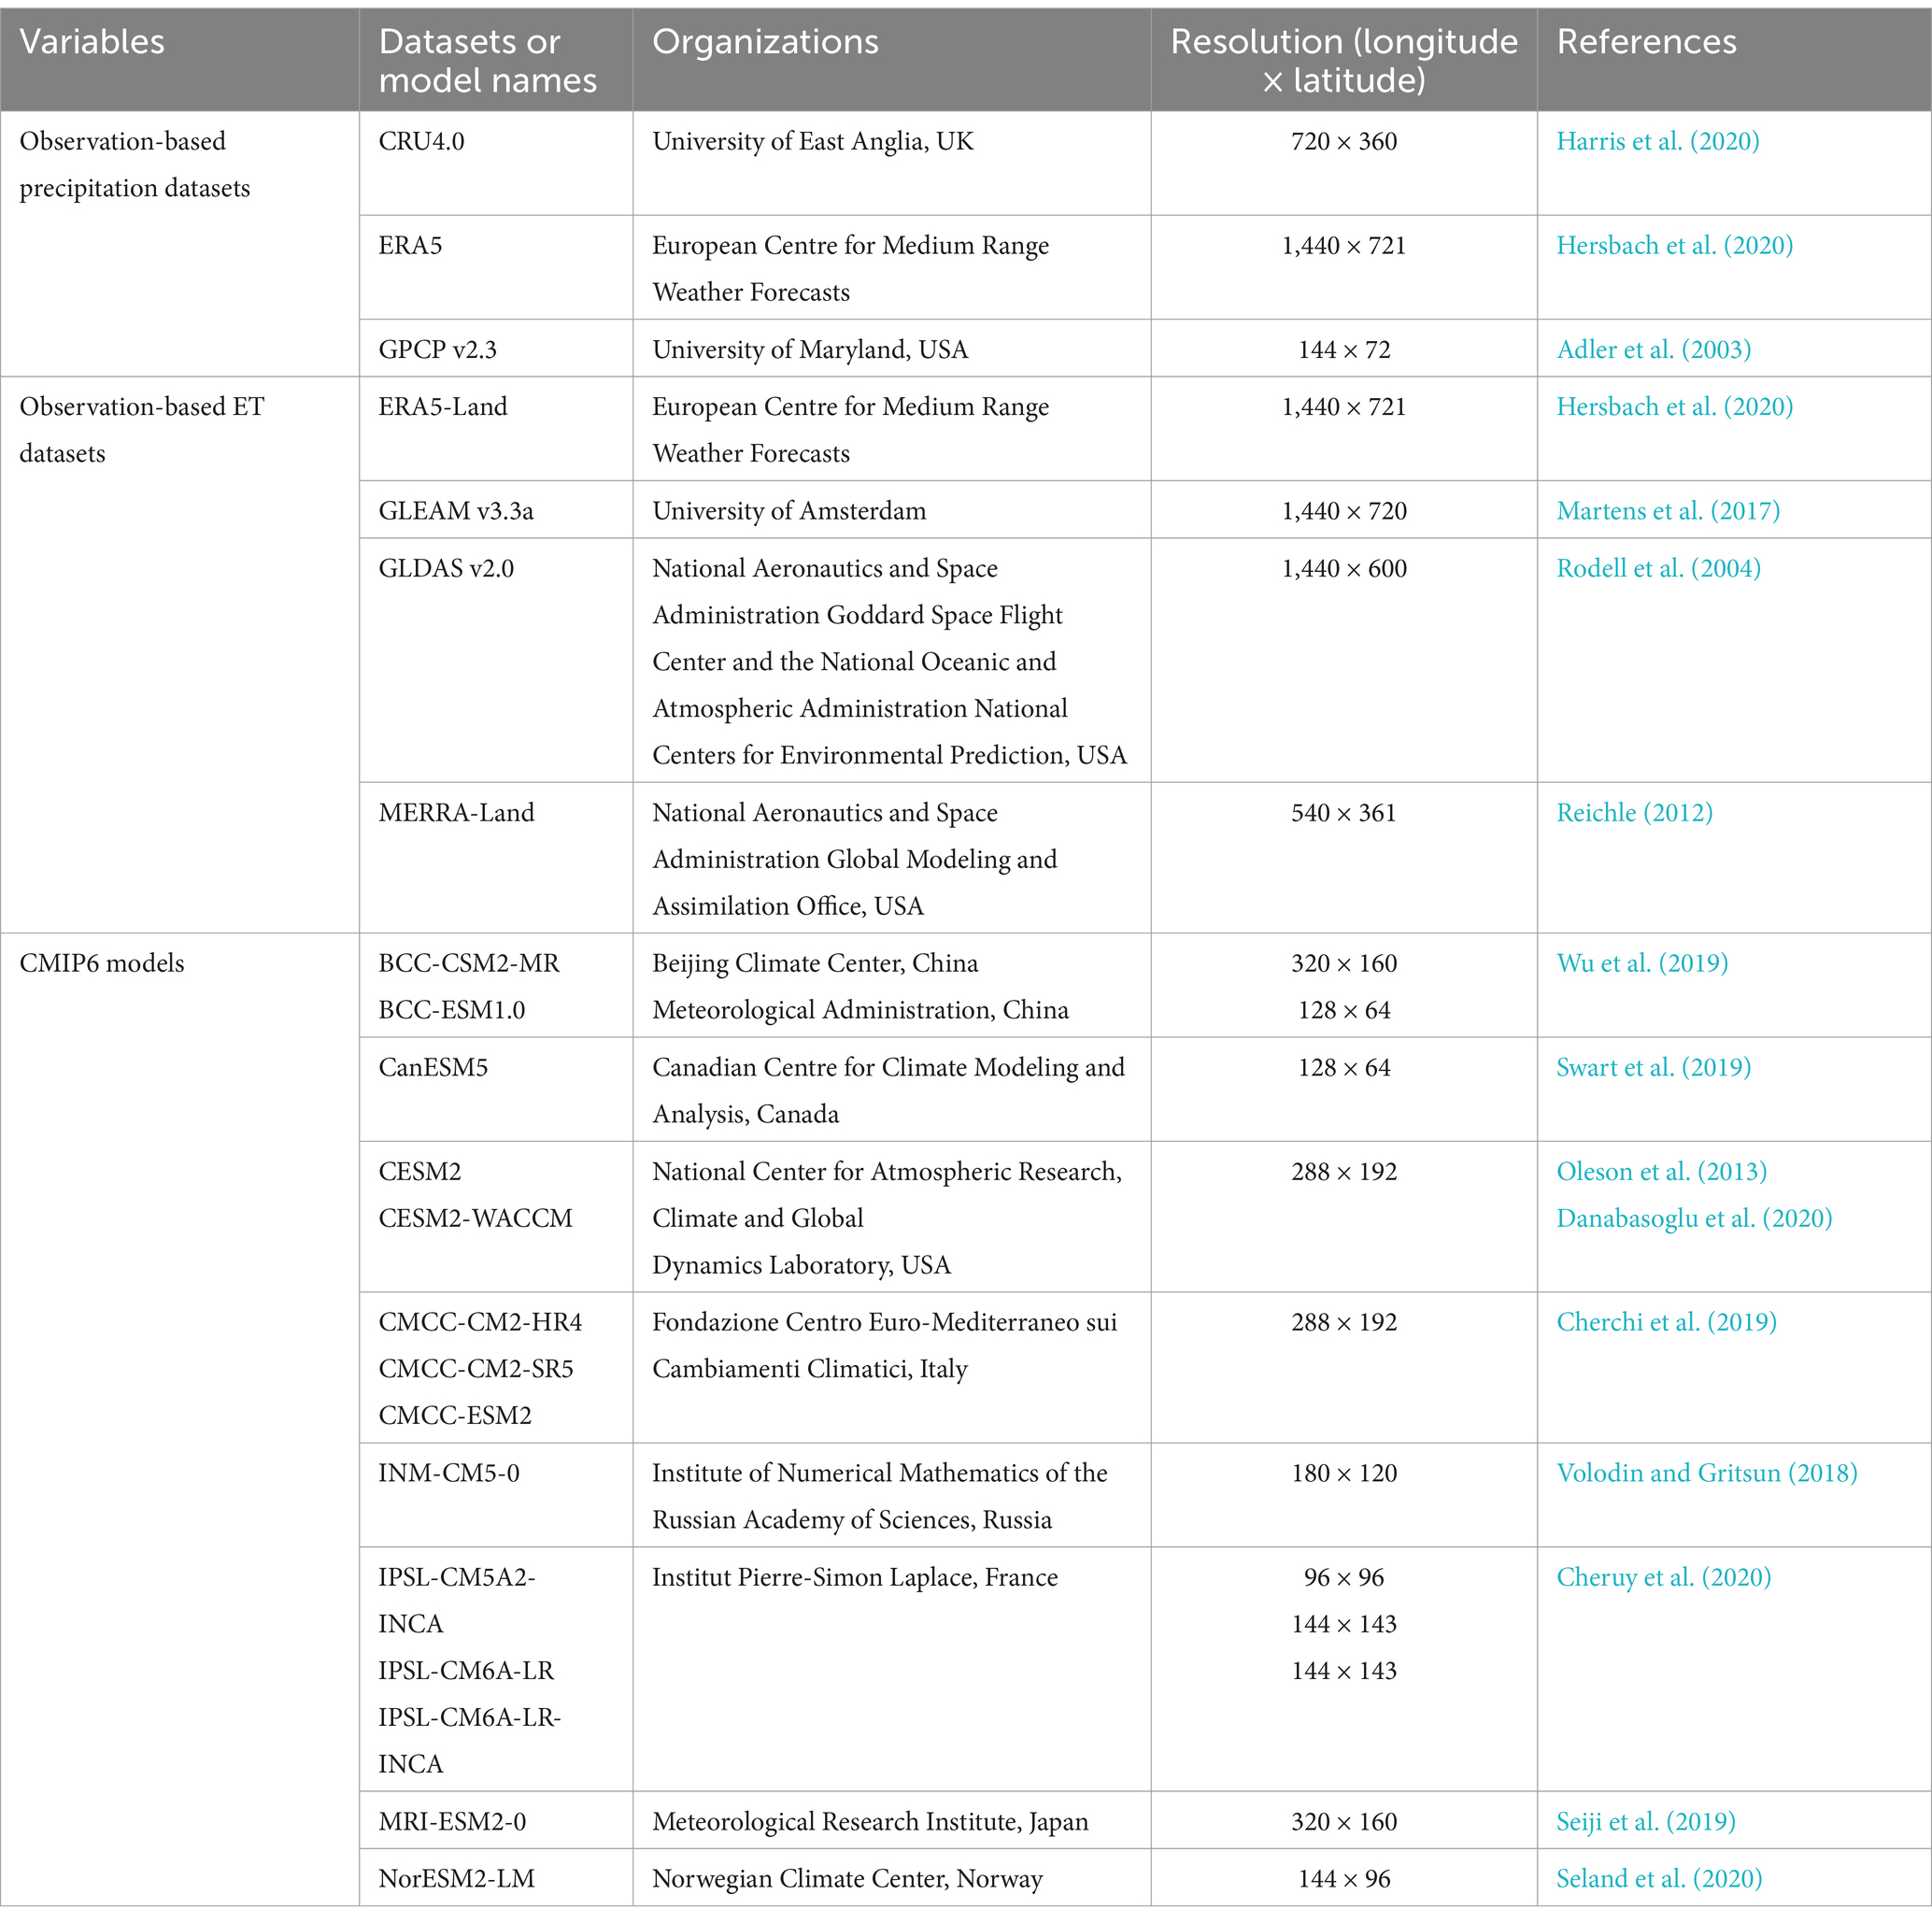
Table 1. Introduction to observation-based datasets and CMIP6 models.
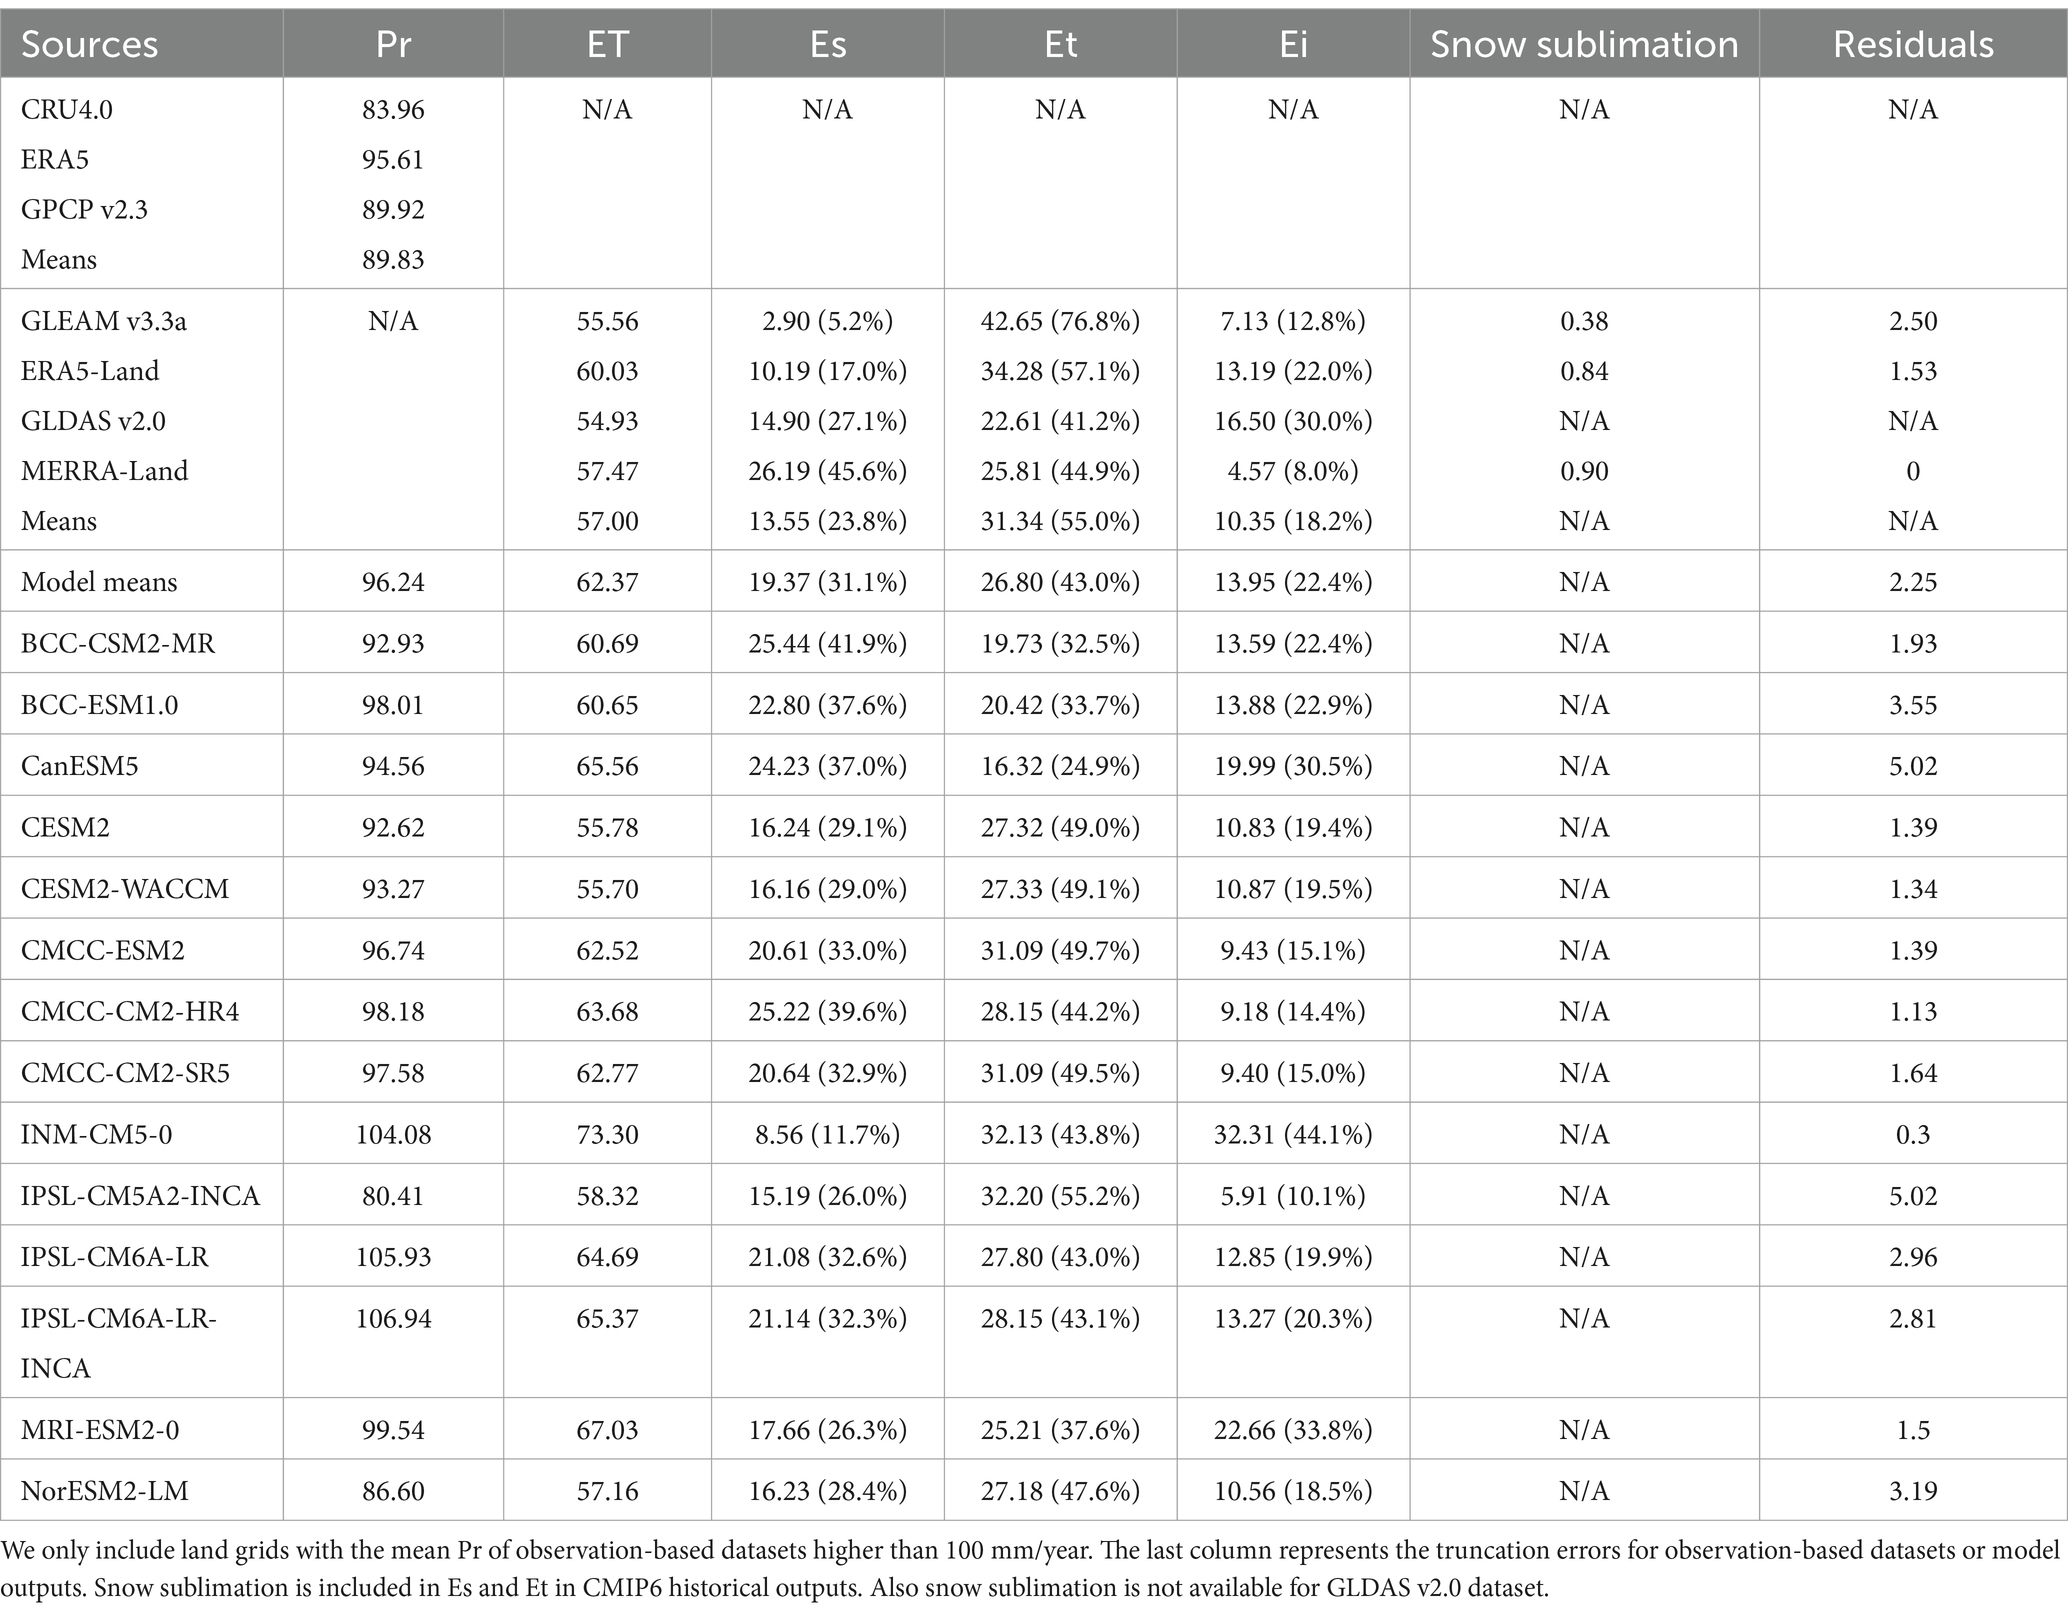
Table 2. Means of land Pr, ET, and its components averaged from June 1981 to May 2014 in the unit mm/month from the 60°S to 60°N.
We evaluate the CMIP6 model simulations against observation-constrained reanalysis data using monthly data spanning June 1981 to May 2014. To facilitate comparison, both the reanalysis datasets and CMIP6 model outputs are re-gridded to a resolution of 1.25° × 0.94° using bilinear interpolation. The analysis focuses exclusively on land grids where the average of three observation-based Pr datasets exceeds 100 mm/year, thereby excluding hyper-arid regions (Noy-Meir, 1973). Additionally, ocean, lakes, small islands, and ice shelves are excluded from the study. The research domain extends from 60°S to 60°N.
The 396-month time series is transformed into two forms: a 12-month mean time series, representing the mean seasonal cycle, and a 33-year annual mean time series, representing interannual variability. Temporal performance is then evaluated with respect to the mean seasonal cycle and interannual variability using non-lagged Pearson correlation coefficients (r). The non-lagged r between each set of observation-based estimates, as well as between models (model means and individual models) and observation means, is calculated as follows:
In Equation (1), and represent the time series values for two observation-based estimates or for the observation means and model outputs. The terms and are the means of the respective time series. The variable denotes the number of data points, with 12 for the 12-month time series and 33 for the annual time series.
The threshold values for the correlation coefficient r for 12-month and 33-year time series at a significance level of p < 0.05 is approximately 0.576 and 0.344. These threshold values are used to identify “consensus regions” where all observation-constrained Pr or ET and its three components exhibit positive, statistically significant correlations. After identifying these regions, the temporal variability of the model means and individual models is assessed by comparing their correlations with the observed mean seasonal cycle and interannual variability within the identified consensus regions by observations. Grids within these consensus regions that show significant correlations (p < 0.05) between models and observation means are considered temporally consistent.
The multi-model mean demonstrates superior temporal consistency with the observational mean across all examined variables when compared to individual model outputs. Within these regions, we calculate their relative differences for each of the four seasons: June–July–August (JJA), September–October–November (SON), December–January–February (DJF), and March–April–May (MAM). For each season, the relative difference between the multi-model means and observations is determined as follows:
where MMCMIP6 is model mean from the selected 14 CMIP6 models and OM is observation mean. The methodology employed in this study is comprehensively illustrated in Figure 1.
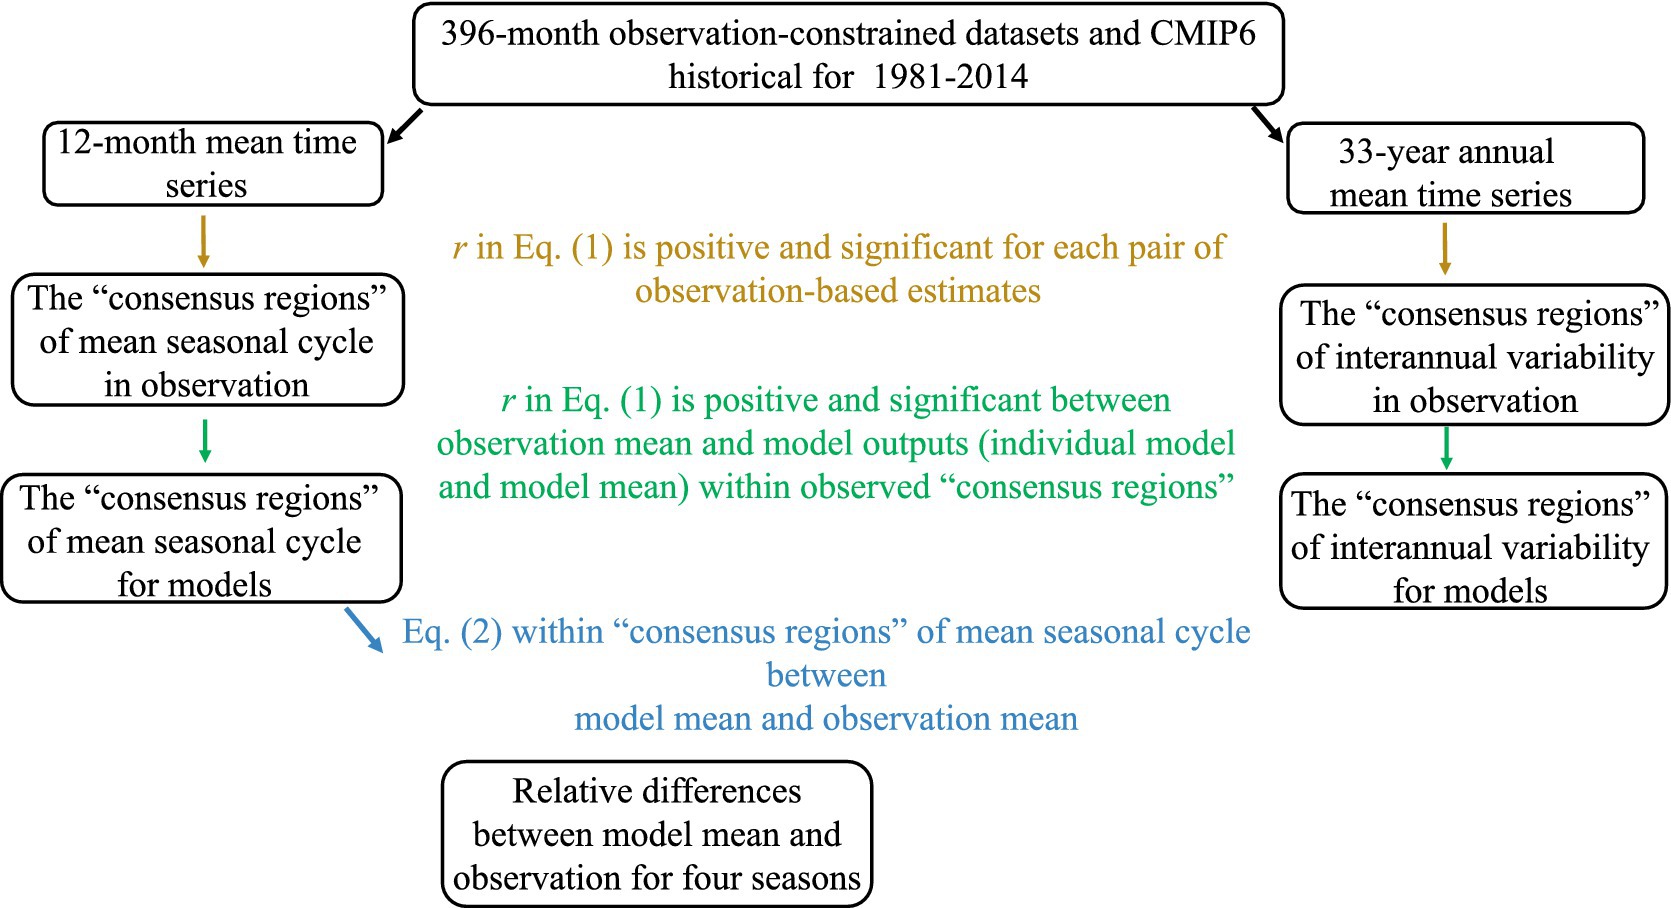
Figure 1. A flowchart illustrating the methodology employed in this study.
High consistencies among the three Pr datasets are observed across 92.2% of the studied land areas, with the notable exception in parts of northern Europe, as shown in Figure 2. In contrast, ET demonstrates consistency in the mean seasonal cycle across only 79% of the land areas in study, with significant inconsistencies occurring predominantly in the tropics, particularly within regions such as the Amazon basin, central Africa, and Southeast Asia. In these tropical zones, considerable disparities are also evident in Es and Et across different datasets. Only Ei in the tropics shows relatively high correlations between datasets, indicating that this component is more robustly represented. Outside the tropics, Es inconsistencies are also present in the eastern and southeastern United States, eastern Asia, parts of Western Australia, and Patagonia in South America. Et inconsistencies extend to central Eurasia and southern Asia, the western United States, and Australia. In comparison, Ei exhibits inconsistencies mainly in central Eurasia, southern China, southern Australia, and the southern extremity of South America.
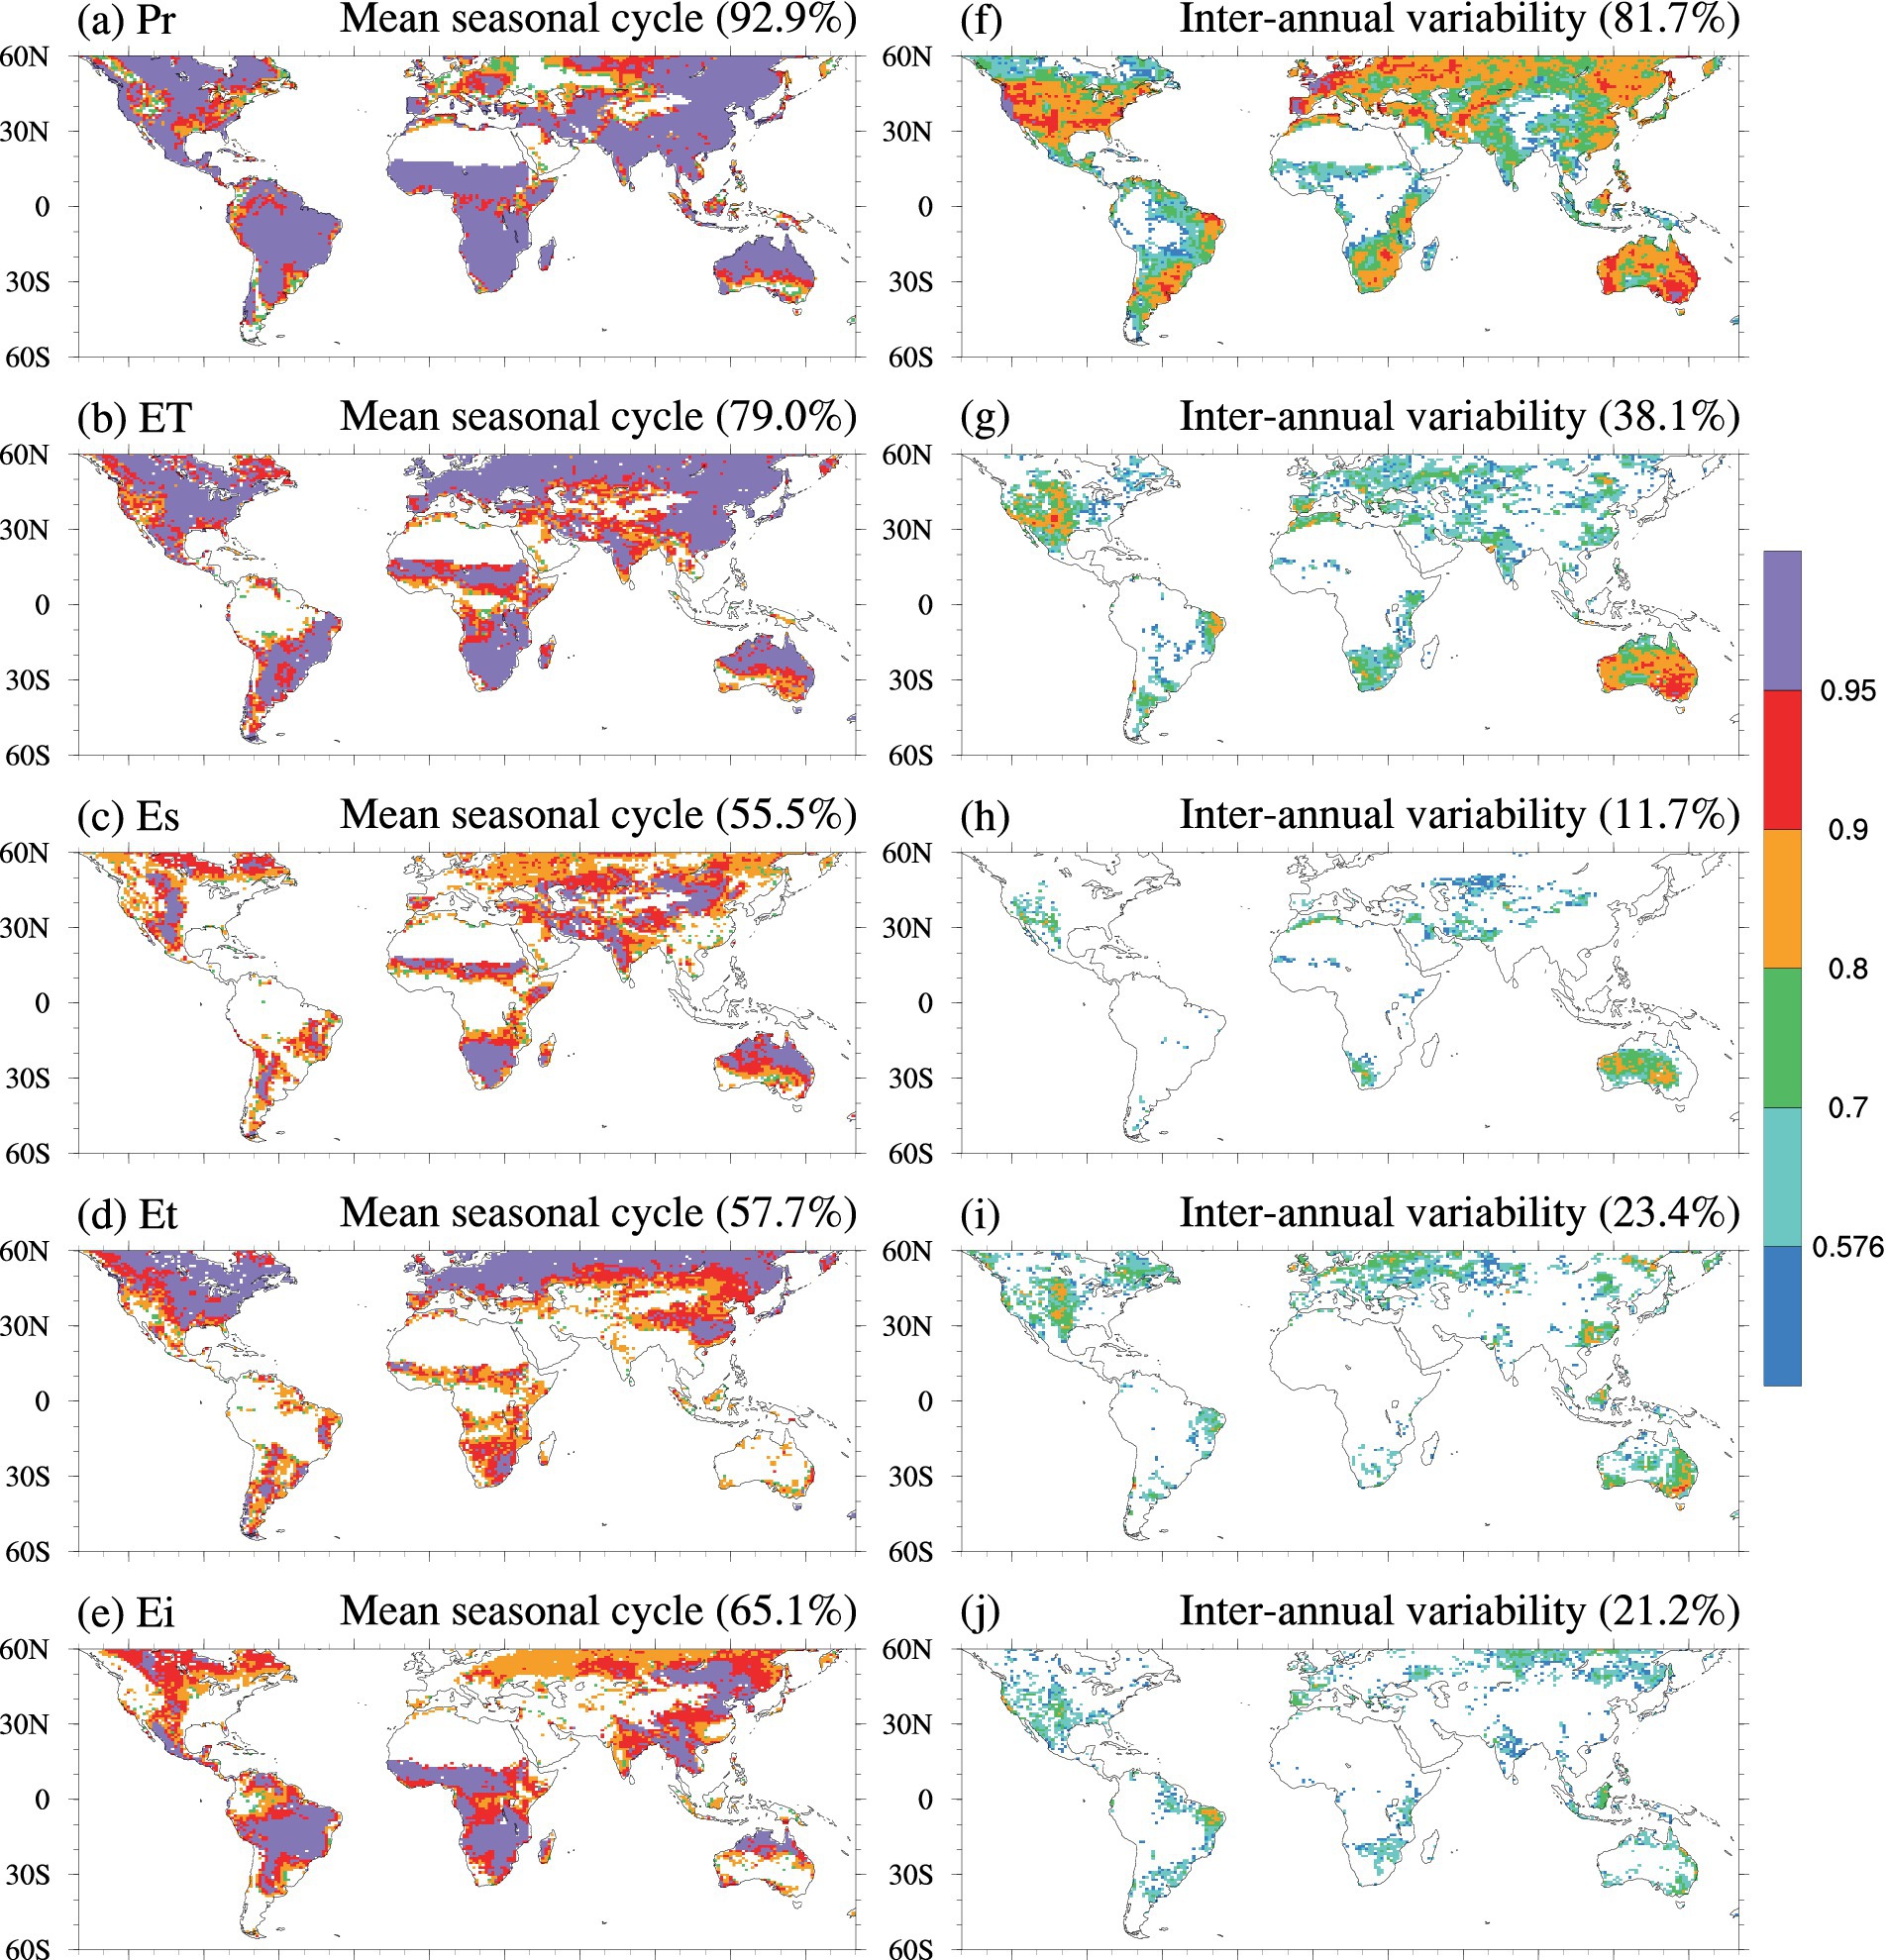
Figure 2. Spatial distributions of the mean correlations between each pair of Pr datasets (CRU4.0, GPCP v2.3, ERA5) and each pair of surface fluxes datasets (GLEAM v3.3a, GLDAS v2.0, MERRA-Land, ERA5-Land) based on the mean seasonal cycle (a–e) and 33-year annual time series (f–j). Only grid cells where mean precipitation of the observation-based datasets exceeds 100 mm/year and all correlation values are both positive and statistically significant (p < 0.05) are displayed. The percentages in parentheses indicate the proportion of significant grid cells relative to the total area under study.
Interannual consistency among datasets decreases significantly for both Pr and ET, reflecting more discrepancies in reconstructing long-term variability compared to the mean seasonal cycle. While some regions, such as most of North America, Eurasia, and Australia, maintain moderate to high correlations for Pr, many tropical areas, including the Amazon basin and Central Africa, exhibit low consistency among datasets. The decline in interannual consistency is even more pronounced for ET, where regions with relatively high agreement drop to 38.1%, concentrated in areas like Australia, the western and central United States, and scattered locations across Eurasia, South America, and Africa. For Es, Et, and Ei, consistencies decrease markedly across most regions, reducing areas of high consistency to 11.7, 23.4, and 21.2% of the studied regions, respectively. These observed patterns underscore the reduced agreements of datasets in capturing variability over longer time scales.
The CRU + GPCP and GPCP+ERA5 pairs dominate for both the mean seasonal cycle and interannual variation of Pr, as depicted in Figure 3a. Within regions of consistency in the mean seasonal cycle, the GPCP+ERA5 pair exhibits the strongest agreement across high-latitude regions of North America, the Amazon, southern Africa, middle and southern Eurasia, and most of Australia, covering 31.6% of the consensus regions. In contrast, the CRU + GPCP pair shows the highest correlations in 49.7% of the remaining regions, except for northern Europe, where the CRU + ERA5 pair outperforms both of these combinations. The spatial distributions of the CRU + GPCP and GPCP+ERA5 pairs at the interannual time scale largely mirror their distribution within the consensus regions for the mean seasonal cycle, although their absolute coverage decreases. Specifically, the CRU + GPCP and GPCP+ERA5 pairs account for 67.4 and 27.4% of the interannual variation, respectively. Only scattered areas in North America, South America, and central Eurasia show the highest correlations for the CRU + ERA5 pair, which represents a minor 5.2% of the consensus regions.
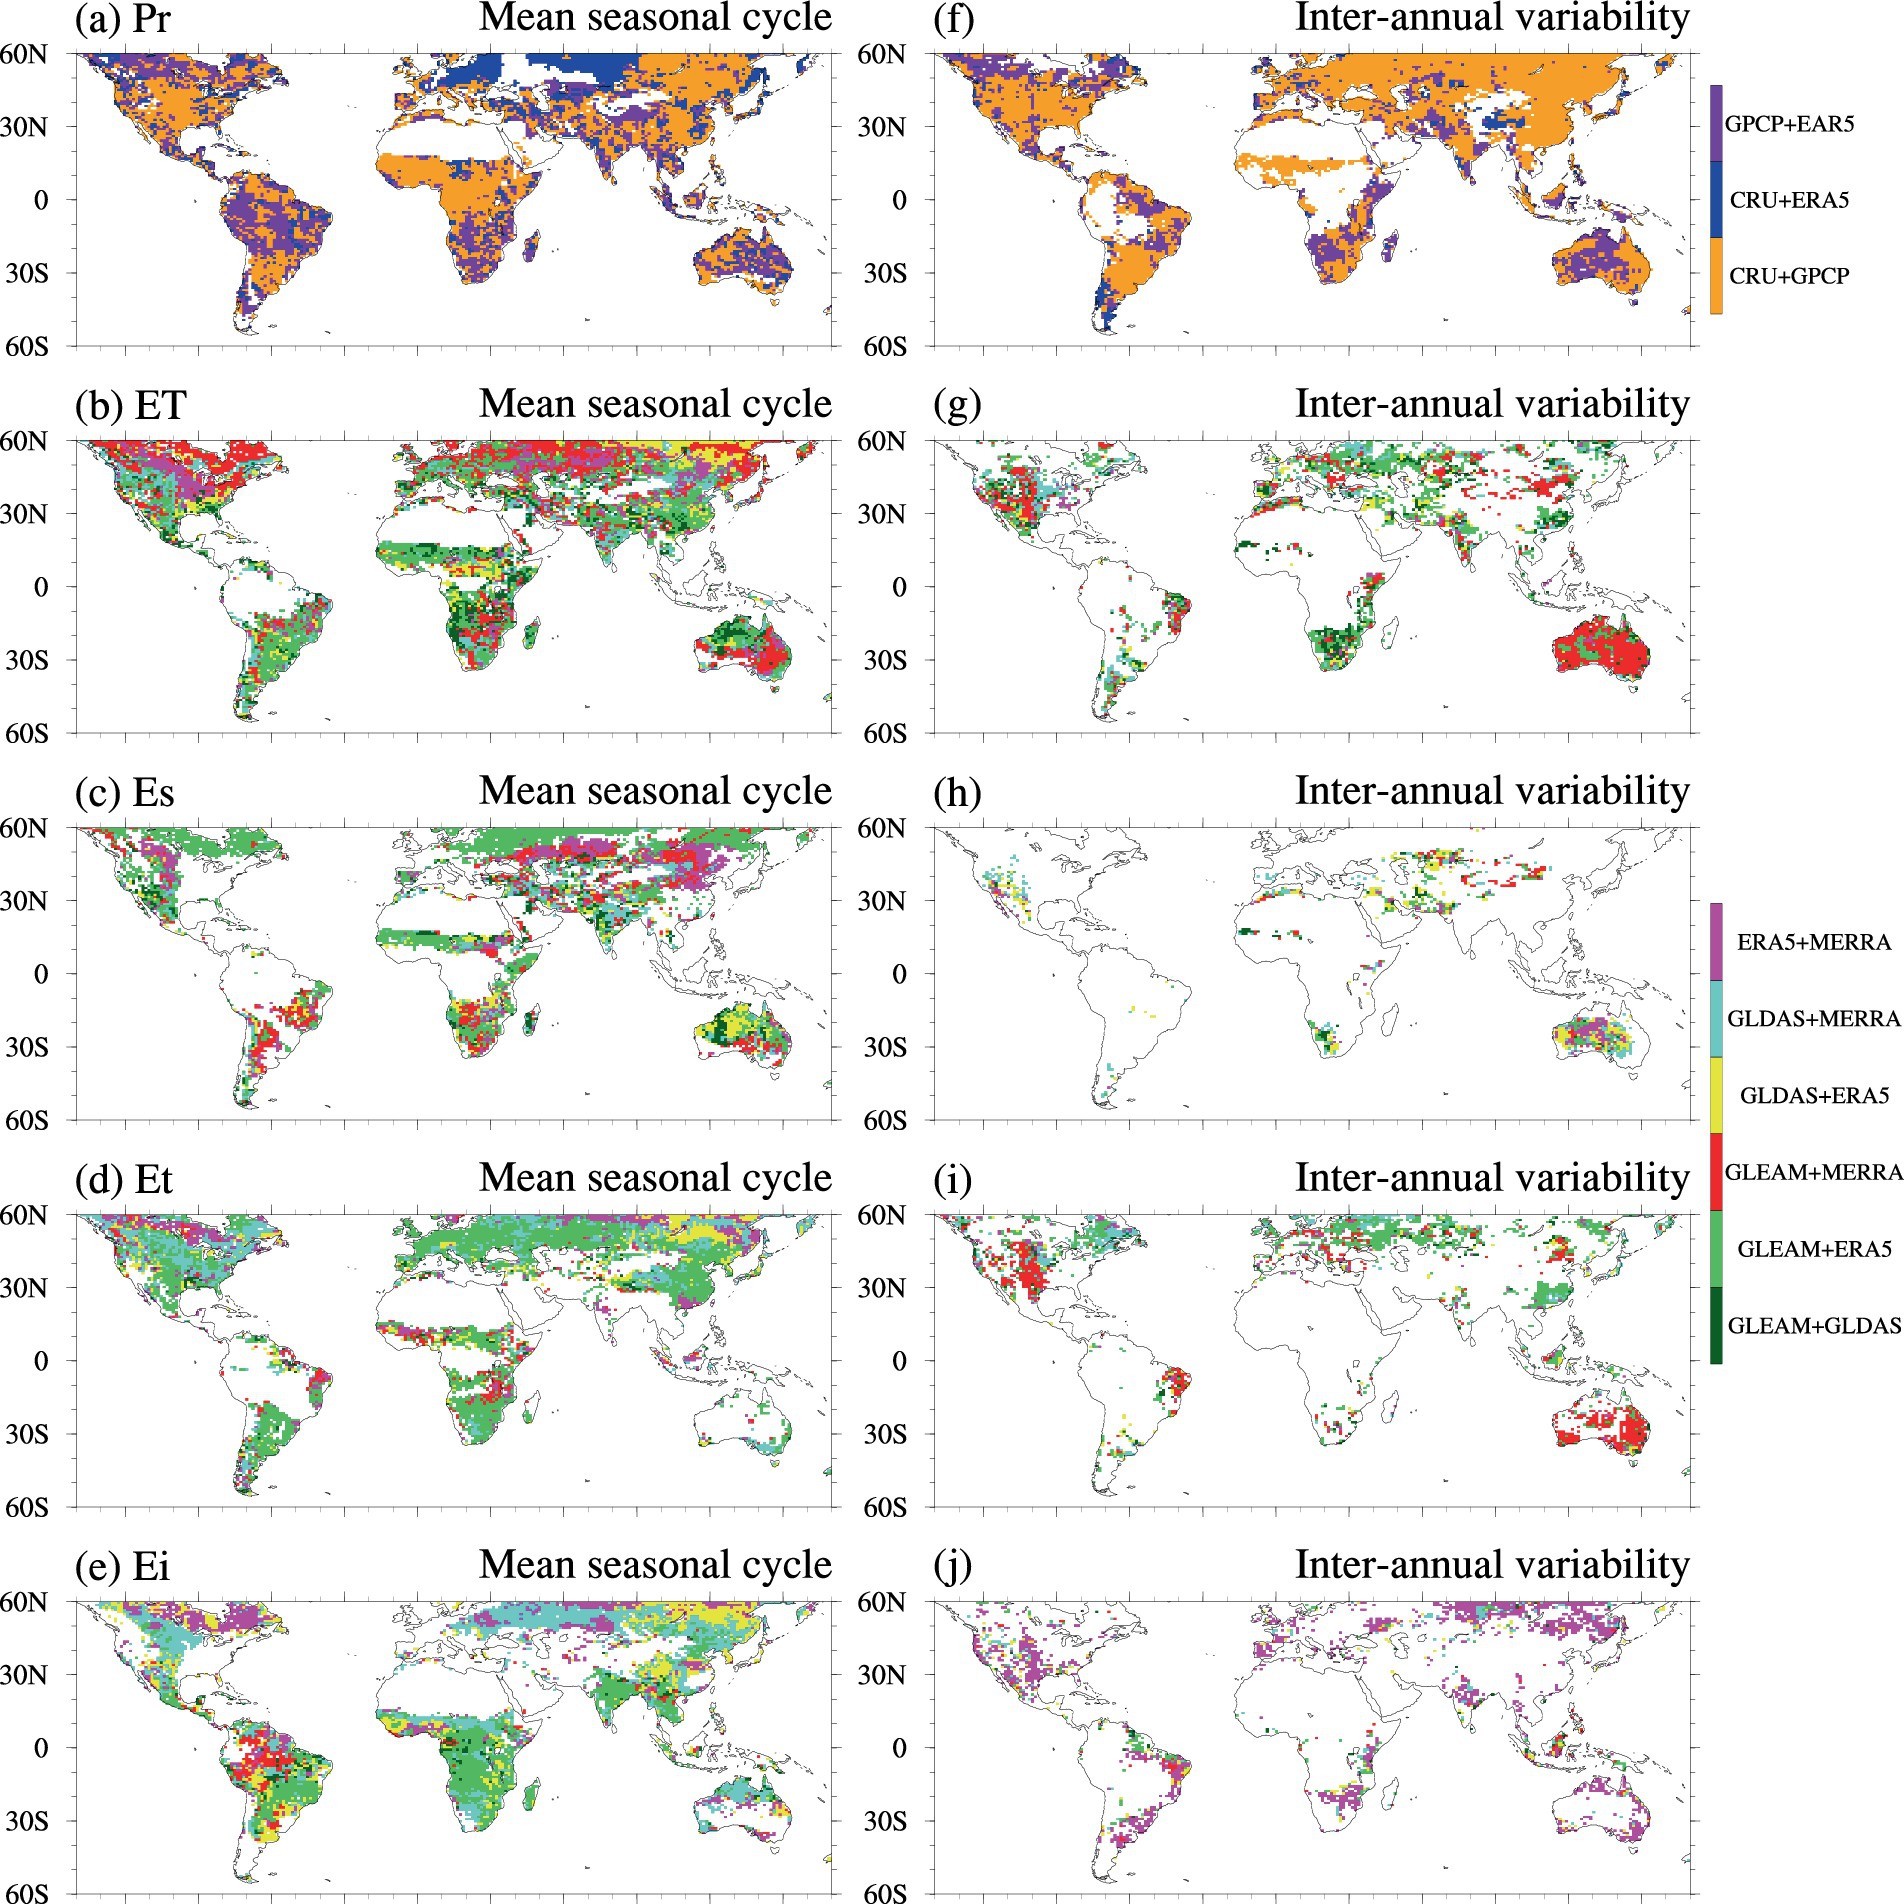
Figure 3. Spatial distributions of maximum correlation coefficient among the three correlation coefficients between Pr datasets and the six correlation coefficients between surface flux datasets based on the mean seasonal cycle (a–e) and annual time series (f–j). Only grids within of the consensus regions identified in Figure 1 are shown. The spatial coverage percentages for all dataset pairs are provided in Supplementary Table S1.
Overall, for ET, the GLEAM+ERA5 pair demonstrates the most robust performance across multiple metrics, particularly for consistency in the mean seasonal cycle. Specifically, for ET, Es, and Et, the GLEAM+ERA5 pair stands out, providing the highest correlations and covering 30.1, 37.8, and 48.3% of the consensus regions, respectively. For Ei, GLEAM+ERA5 is only outperformed by the GLDAS+MERRA pair, which covers 30.1% of the consensus regions. Regarding interannual variations, the highest correlations emerge from various combinations: GLEAM+MERRA, GLDAS+ERA5, GLEAM+ERA5, and ERA5 + MERRA, covering 31.1, 27.7, 39.1, and 66.4% of the consensus regions for ET, Es, Et, and Ei, respectively.
A comprehensive summary of the temporal consistencies for each dataset pair within the consensus regions shown in Figures 2, 3, is provided by Figure 4. In general, the correlation coefficients for the mean seasonal cycle across all dataset pairs are higher than those for interannual variations. Notably, Pr and ET exhibit the best performance in terms of median values and whisker ranges regarding the mean seasonal cycle. As depicted in Figure 4a, the CRU + GPCP pair shows the highest median and the lowest spread for both the mean seasonal cycle and interannual variations in Pr, followed by the GPCP+ERA5 pair. However, the differences between these three dataset pairs are minimal. In contrast, the CRU + ERA5 pair consistently exhibits the lowest values. Although the ranking order of these three dataset pairs remains consistent across both time scales, the differences between them become more pronounced at the interannual time scale, primarily driven by the greater reduction in correlation observed for the CRU + ERA5 pair. For ET and its three components, Figure 4b reveals that the GLEAM+ERA5 pair ranks highest in terms of both the mean seasonal cycle and interannual consistencies of ET and Et, as well as the consistency in the mean seasonal cycle for Es. However, for Ei at both time scales, and for Es at the interannual scale, the top-ranking dataset pairs are GLDAS+MERRA, ERA5 + MERRA, and GLDAS+ERA5. The GLEAM+GLDAS pair shows the lowest median values for ET and its components in the mean seasonal cycle. In contrast, at the interannual scale, the dataset pairs with the lowest medians are ERA5 + MERRA (ET), GLEAM+MERRA (Es), GLDAS+ERA5 (Et), and GLEAM+GLDAS (Ei). While the GLEAM+ERA5 pair emerges as the top-ranking dataset for most surface flux variables in terms of the mean seasonal cycle, and GLEAM+GLDAS shows the lowest median values for all surface flux variables at this scale, no single dataset pair consistently exhibits the highest or lowest values across all surface flux variables at the interannual time scale.

Figure 4. Boxplots of the correlation coefficients between each pair of Pr datasets and each pair of surface flux datasets within the regions shown in Figure 2. Panel (a) corresponds to Figures 2 (a–e) and panel (b) corresponds to Figures 2 (f–j). The boxplots of different colors correspond to different dataset pairs. The boxplots illustrate the interquartile range (IQR), with the horizontal lines representing the 25th percentile (Q1), median (Q2), and the 75th percentile (Q3). The whiskers extend to the smallest and largest values within 1.5 times the IQR from Q1 and Q3, respectively. This same convention is applied to the boxplots in Supplementary Figure S2. Values closer to 1.0 indicate better temporal consistency between these two datasets.
The relative differences in correlations of the mean seasonal cycle and interannual variability for each dataset pair outside the consensus regions closely mirror those observed within the consensus regions (Supplementary Figures S1, S2). Notably, for surface fluxes, the ranking of annual correlations generally corresponds with the ranking of mean seasonal cycle correlations for ET, Et, and Ei, except for Es.
The CMIP6 models analyzed in this study generally capture the mean seasonal cycle of observation-assisted Pr and ET means, as illustrated in Supplementary Figures S3–S4. For Pr, the CESM2 model covers the largest portion (91.5%) of the “consensus region” for reproducing the mean seasonal cycle, second only to the multi-model mean (95.2%). For ET, the multi-model mean exhibits significant consistency with observational data in 96.8% of the consensus regions. The two best-performing models for ET are CMCC-CM2-HR4 (95.5%) and CMCC-CM2-SR5 (95.0%). However, interannual variability is generally poorly represented, as shown in Figures S5 and S6.
The performance of CMIP6 models in reconstructing the mean seasonal cycle of Es vary considerably. The spatial coverage ranges from 92.5% (CMCC-CM2-HR4) to 58.5% (IPSL-CM5A2-INCA), as shown in Figure 5. The multi-model mean shows the highest coverage at 97.7%. For models with spatial coverages below 80%, the discrepancies between observations and models are primarily due to temporal inconsistencies in the western United States, Europe, central Eurasia, the Indian Peninsula, and southern Australia. The IPSL-CM5A2-INCA model shows significant observation-model inconsistencies across most of North America and Eurasia, resulting in the lowest spatial coverage. Regarding interannual variability, even the multi-model mean indicates that only 6.5% of areas show relatively high consistency as shown in Supplementary Figure S7.

Figure 5. Spatial distribution of correlation coefficients between the mean seasonal cycle of observation-based Es datasets and CMIP6 models [including the multi-model mean in subplot (a) and individual models from subplots (b) to (o)] within the Es consensus regions identified in Figure 2 (c). Gray areas represent regions where correlations between observation-based datasets and models are not statistically significant (p ≥ 0.05). The values in parentheses indicate the percentage of the consensus region area where significant model-observation correlations (p < 0.05) are shown.
For For transpiration in Figure 6, most CMIP6 models capture the mean seasonal cycle based on observation, especially in high latitudes. The best-performing models are CMCC-CM2-HR4 and BCC-CSM2-MR, which cover 95.4 and 90.9% of the consensus regions, respectively. Most models show spatial coverages greater than 80%, except for INM-CM5-0 (67.9%) and CanESM5 (73.4%). The most noticeable temporal discrepancies in the mean seasonal cycle occur primarily in low- and mid-latitude regions, including the Amazon border, the Sahel, and the southern border of central Africa. However, for INM-CM5-0 and CanESM5, these discrepancies extend into high-latitude areas within western North America and Eurasia. Regarding interannual variability in Supplementary Figure S8, the multi-model mean covers 10.7% of the consistency regions. None of the individual models achieve more than 10% spatial coverage for observation-model consistency at the interannual timescale.
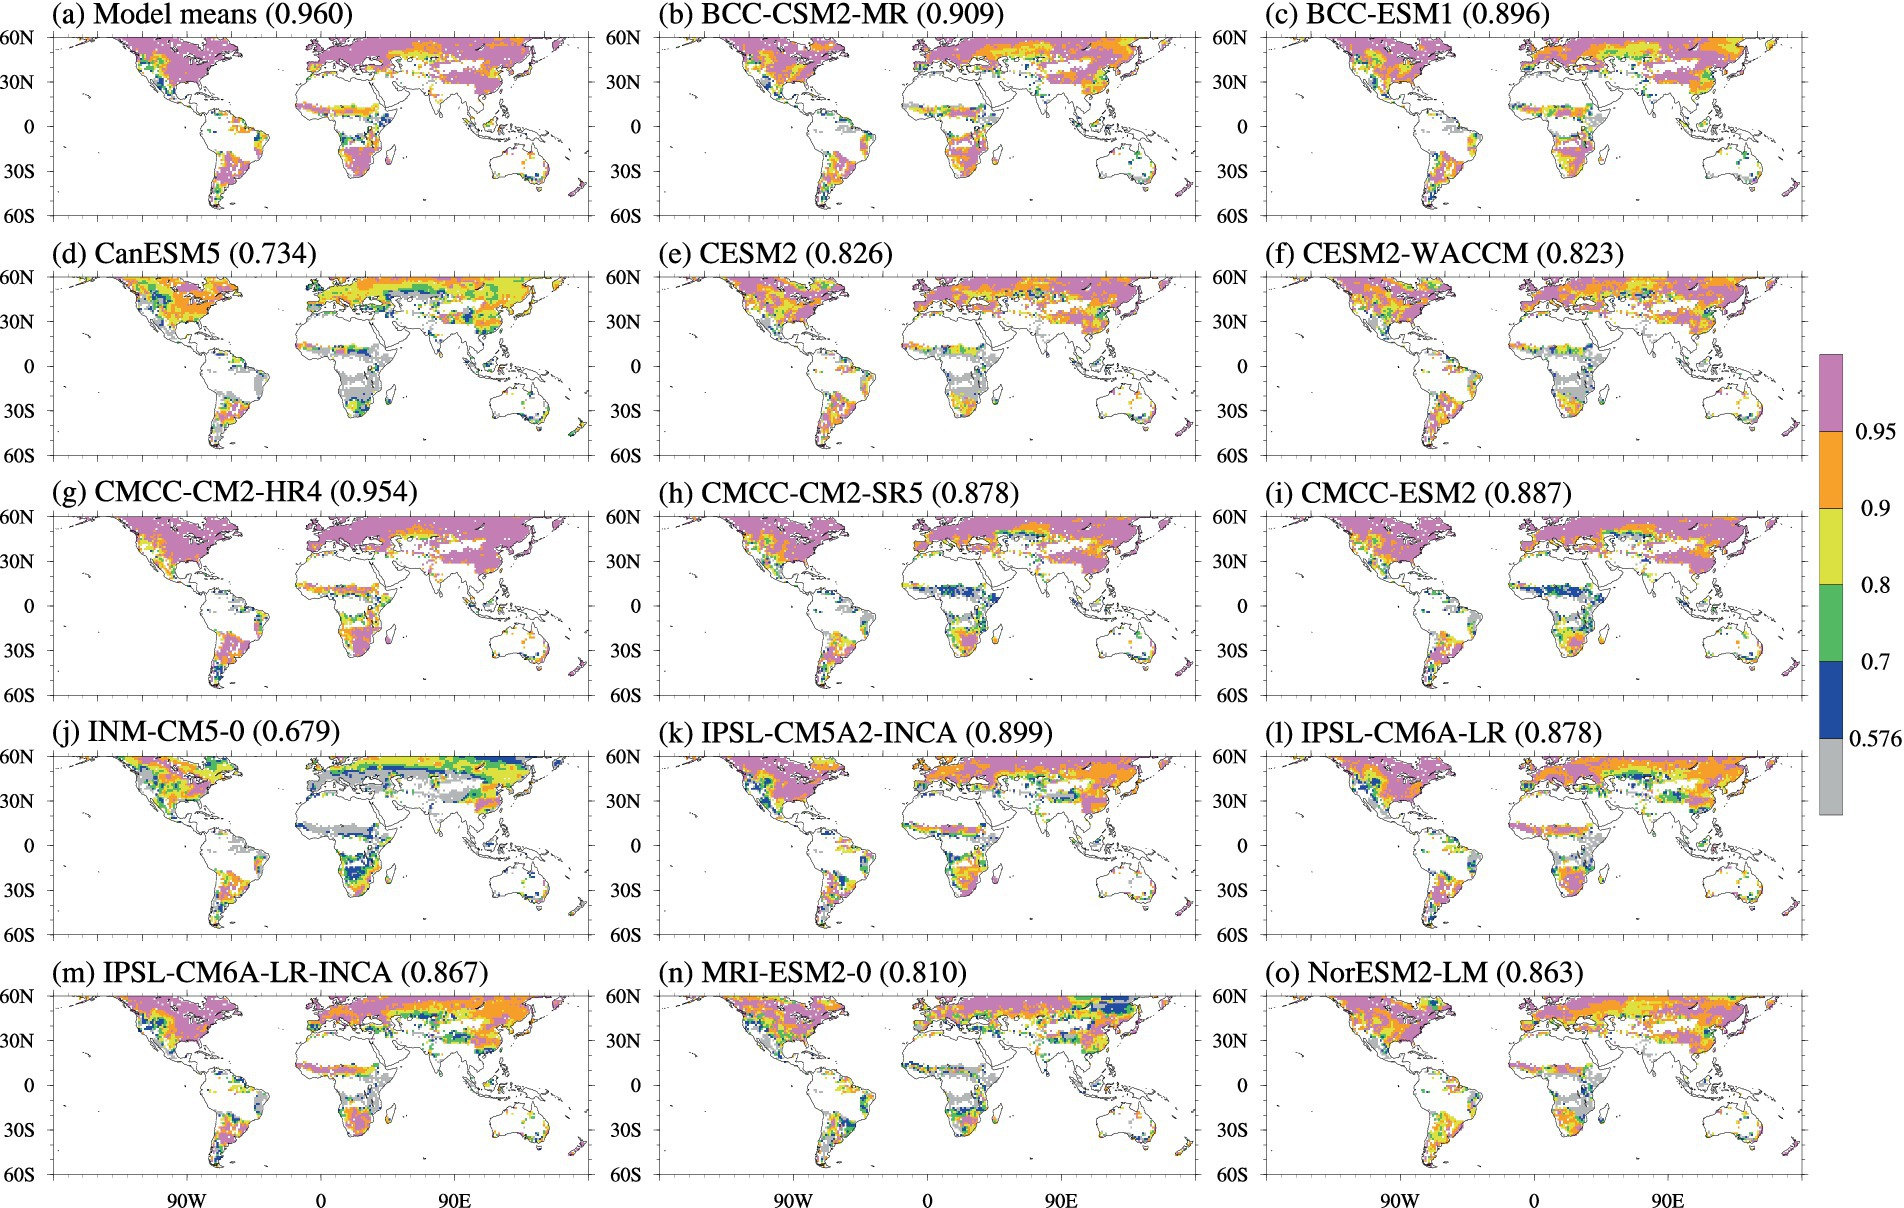
Figure 6. Spatial distribution of correlation coefficients between the mean seasonal cycle of observation-based Et datasets and CMIP6 models [including the multi-model mean in subplot (a) and individual models from subplots (b) to (o)] within the Et consensus regions identified in Figure 2 (d). Gray areas represent regions where correlations between observation-based datasets and models are not statistically significant (p ≥ 0.05). The values in parentheses indicate the percentage of the consensus region area where significant model-observation correlations (p < 0.05) are shown.
The mean seasonal cycle of Ei is generally well reconstructed in most models, as shown in Figure 7. CESM2-WACCM and CESM2 are the best-performing models, with observation-model consistency coverages of 96.6% and 96.5%, respectively. The most challenging regions for reconstructing the mean seasonal cycle in interception loss are in the Amazon and central Africa. The observation-model discrepancies in these areas are especially pronounced in IPSL-CM5A2-INCA and INM-CM5-0. These two models are the only ones with spatial coverages below 90%, at 88.6% and 64.2%, respectively. For interannual variations, only scattered grids show significant observation-model correlations, and none of the models achieve spatial coverages exceeding 10% as shown in Supplementary Figure S9.
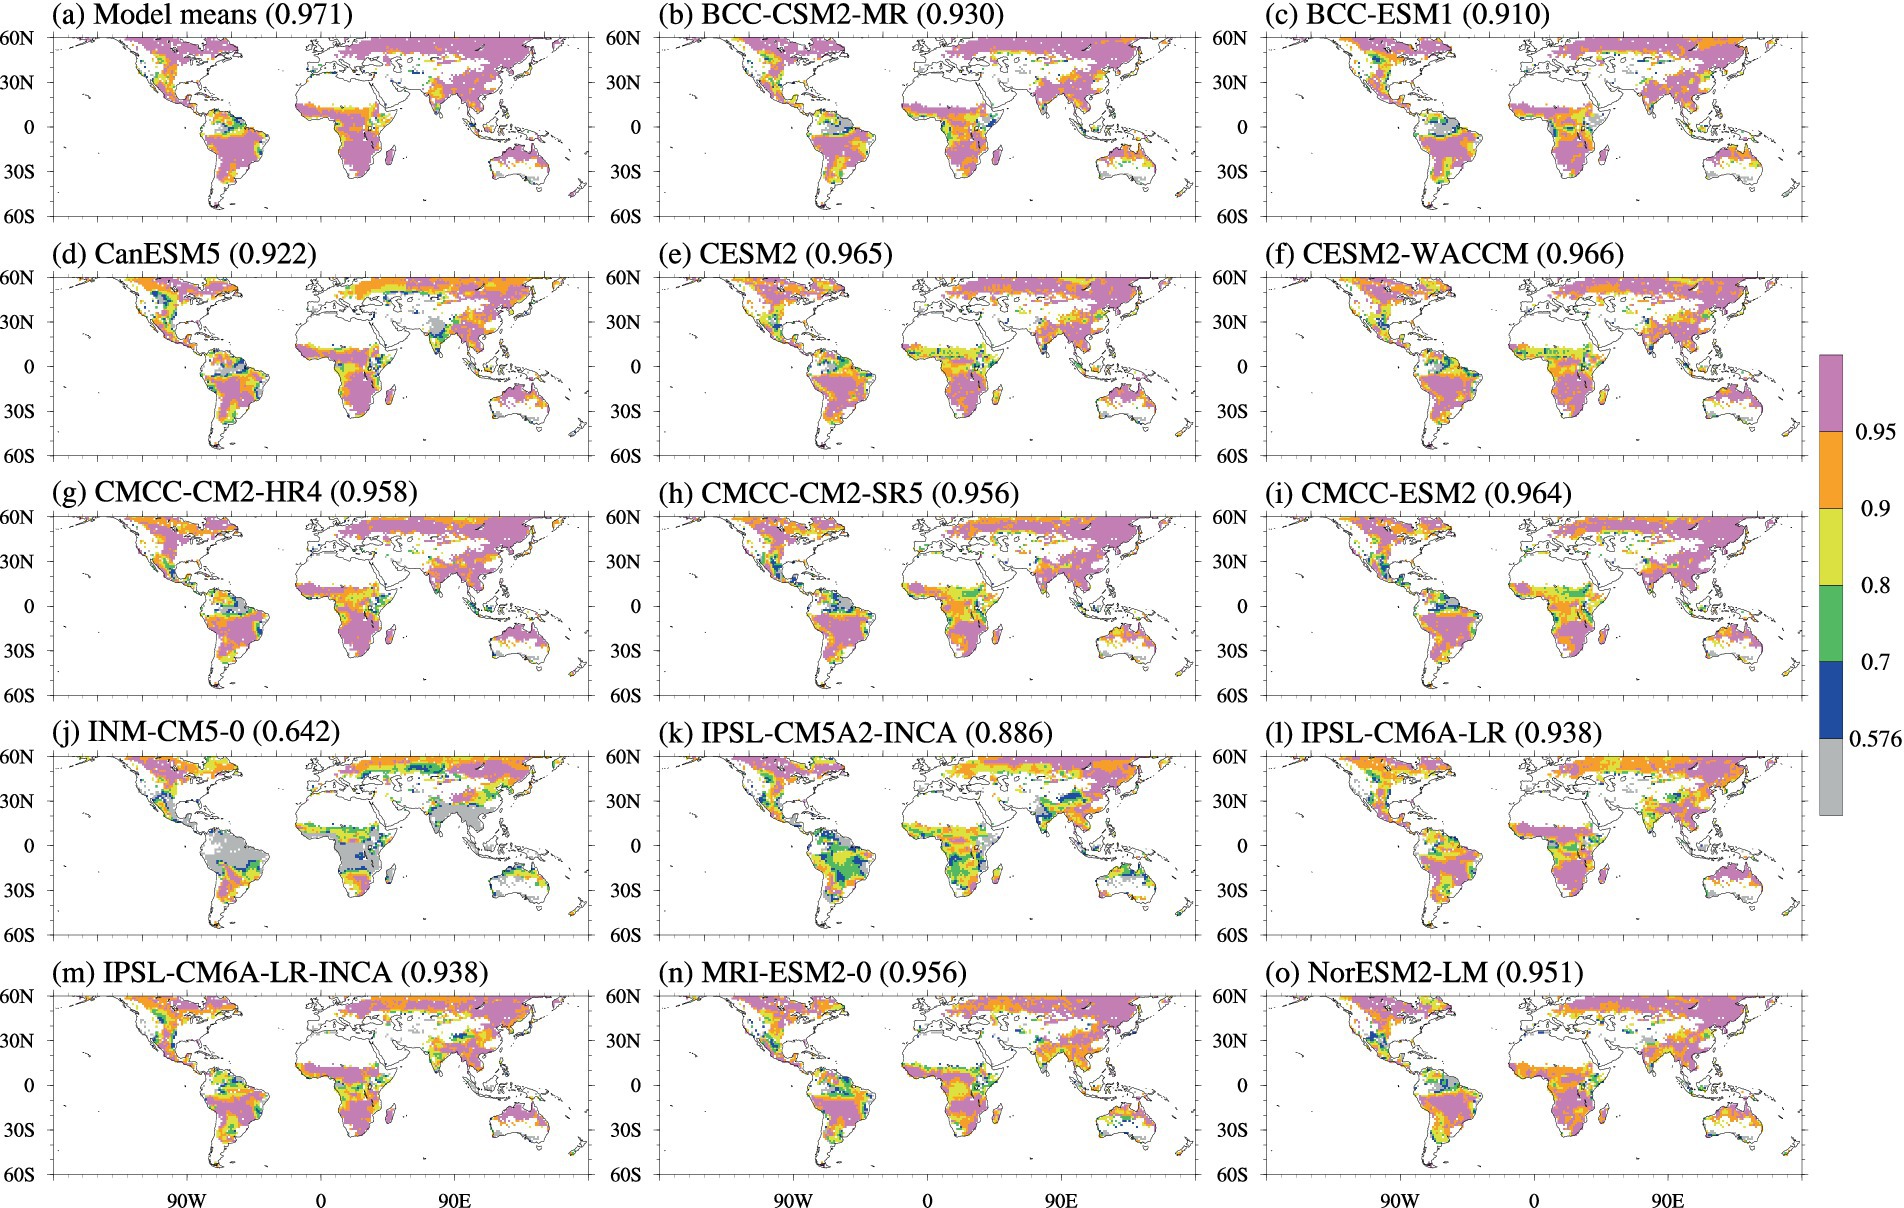
Figure 7. Spatial distribution of correlation coefficients between the mean seasonal cycle of observation-based Ei datasets and CMIP6 models [including the multi-model mean in subplot (a) and individual models from subplots (b) to (o)] within the Ei consensus regions identified in Figure 2 (e), Gray areas represent regions where correlations between observation-based datasets and models are not statistically significant p < 0.05. The values in parentheses indicate the percentage of the consensus region area where significant model-observation correlations (p < 0.05) are shown.
The multi-model means generally perform well and also demonstrates the highest performance compared to individual models across most latitudinal bands, as shown in Figure 8. However, for all five variables, the latitudinal band south of approximately 30°S consistently shows low agreement with observational data in several individual models. This inconsistency may be due to the complex topography of the high-altitude mountainous regions in South America, where models struggle to accurately capture the mean seasonal cycle of Pr and surface flux. Outside these latitudinal bands, the Pr simulations generally perform well across most CMIP6 models. The simulations of ET and Ei also show better performance than those of Es and Et overall, with only a few models displaying inconsistencies in the tropics and midlatitudes. For Es, the most noticeable inconsistencies occur within the latitudinal range of approximately 20°S to 40°N. In contrast, ET exhibits the most pronounced issues primarily between 20°S and 20°N. Overall, Es is the variable with the lowest consistency among the simulated outputs when compared to observational data.
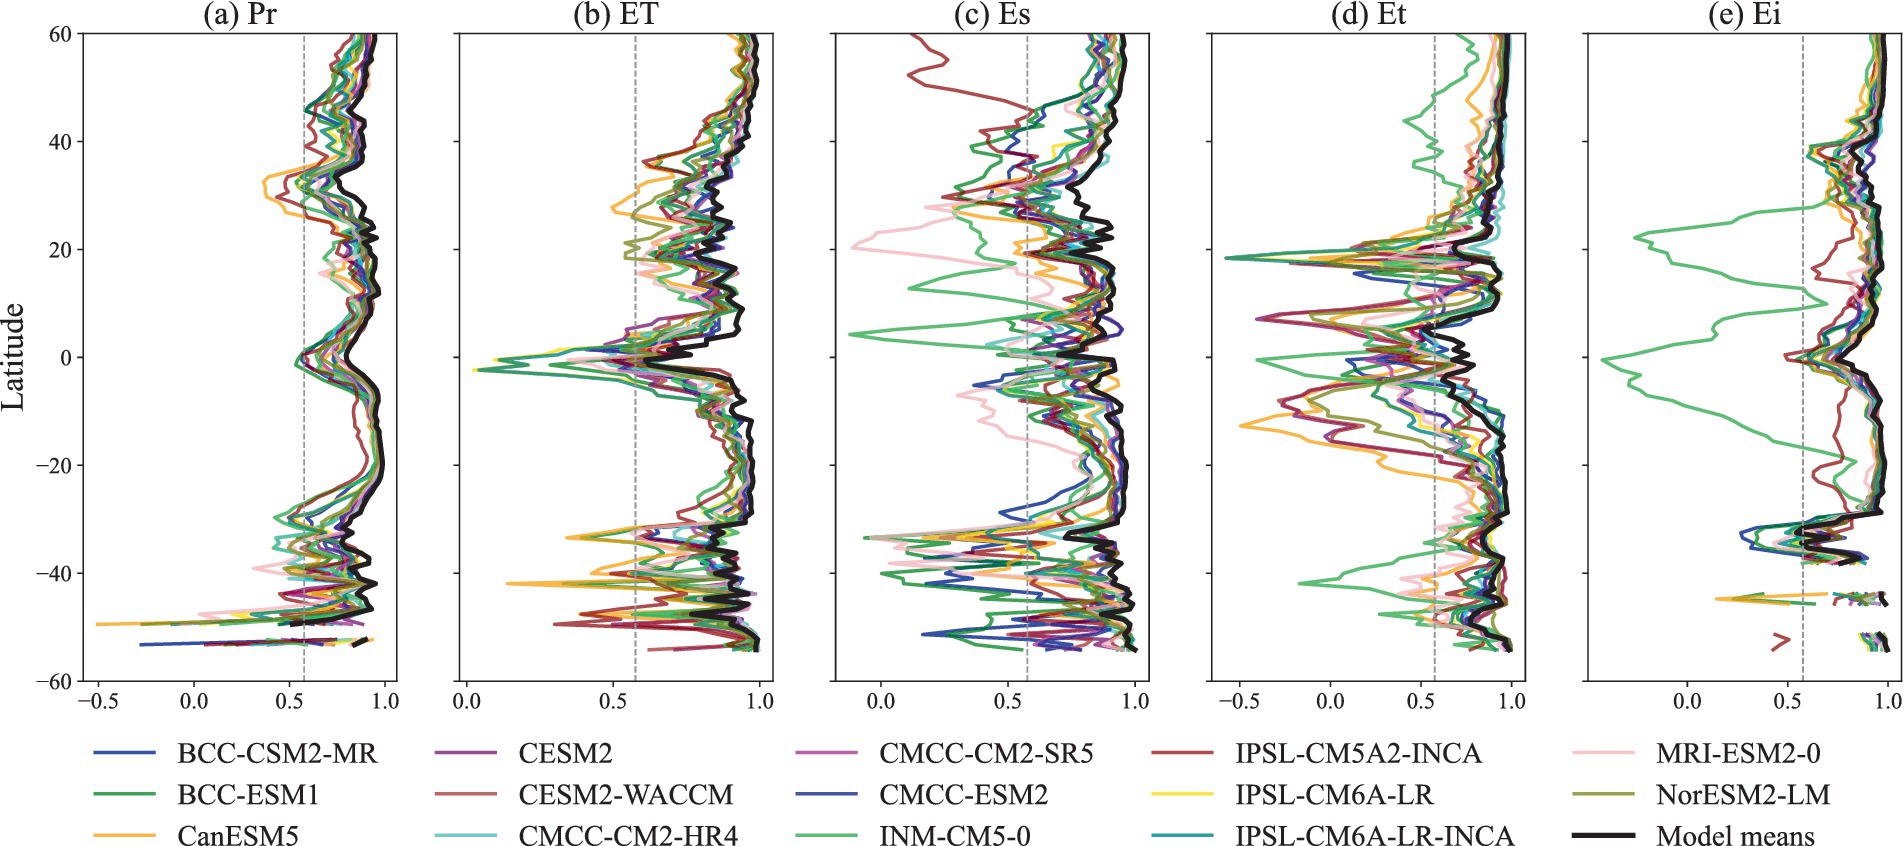
Figure 8. Latitudinal averages of the correlations between model means (or individual models) and observational means within the consensus regions identified in Figure 2, corresponding to subplots (a–e), respectively. The dashed lines at X = 0.546 indicate the threshold for statistical significance at p ≥ 0.05.
In regions where the multi-model means demonstrate significant and positive correlations with observational means in terms of the mean seasonal cycle, Pr exhibits substantial underestimation in the tropics, particularly during the JJA season, where it exceeds 50% as shown in Figure 9. Conversely, the most severe overestimation occurs in southern Africa and Australia, surpassing 70%. In the remaining three seasons, the underestimation of Pr diminishes, and most consensus regions display overestimations. For ET, notable overestimations persist in southern Africa and Australia across all four seasons, with the Sahel region experiencing ET overestimations exceeding 70% during the MAM season. Es generally shows overestimations across most consensus regions in all four seasons. In contrast, Et demonstrates underestimation in most regions throughout all four seasons, with exceptions noted in southern Africa and the southern tip of South America during the JJA and SON seasons. For Ei, the consensus region is predominantly characterized by flux overestimations.
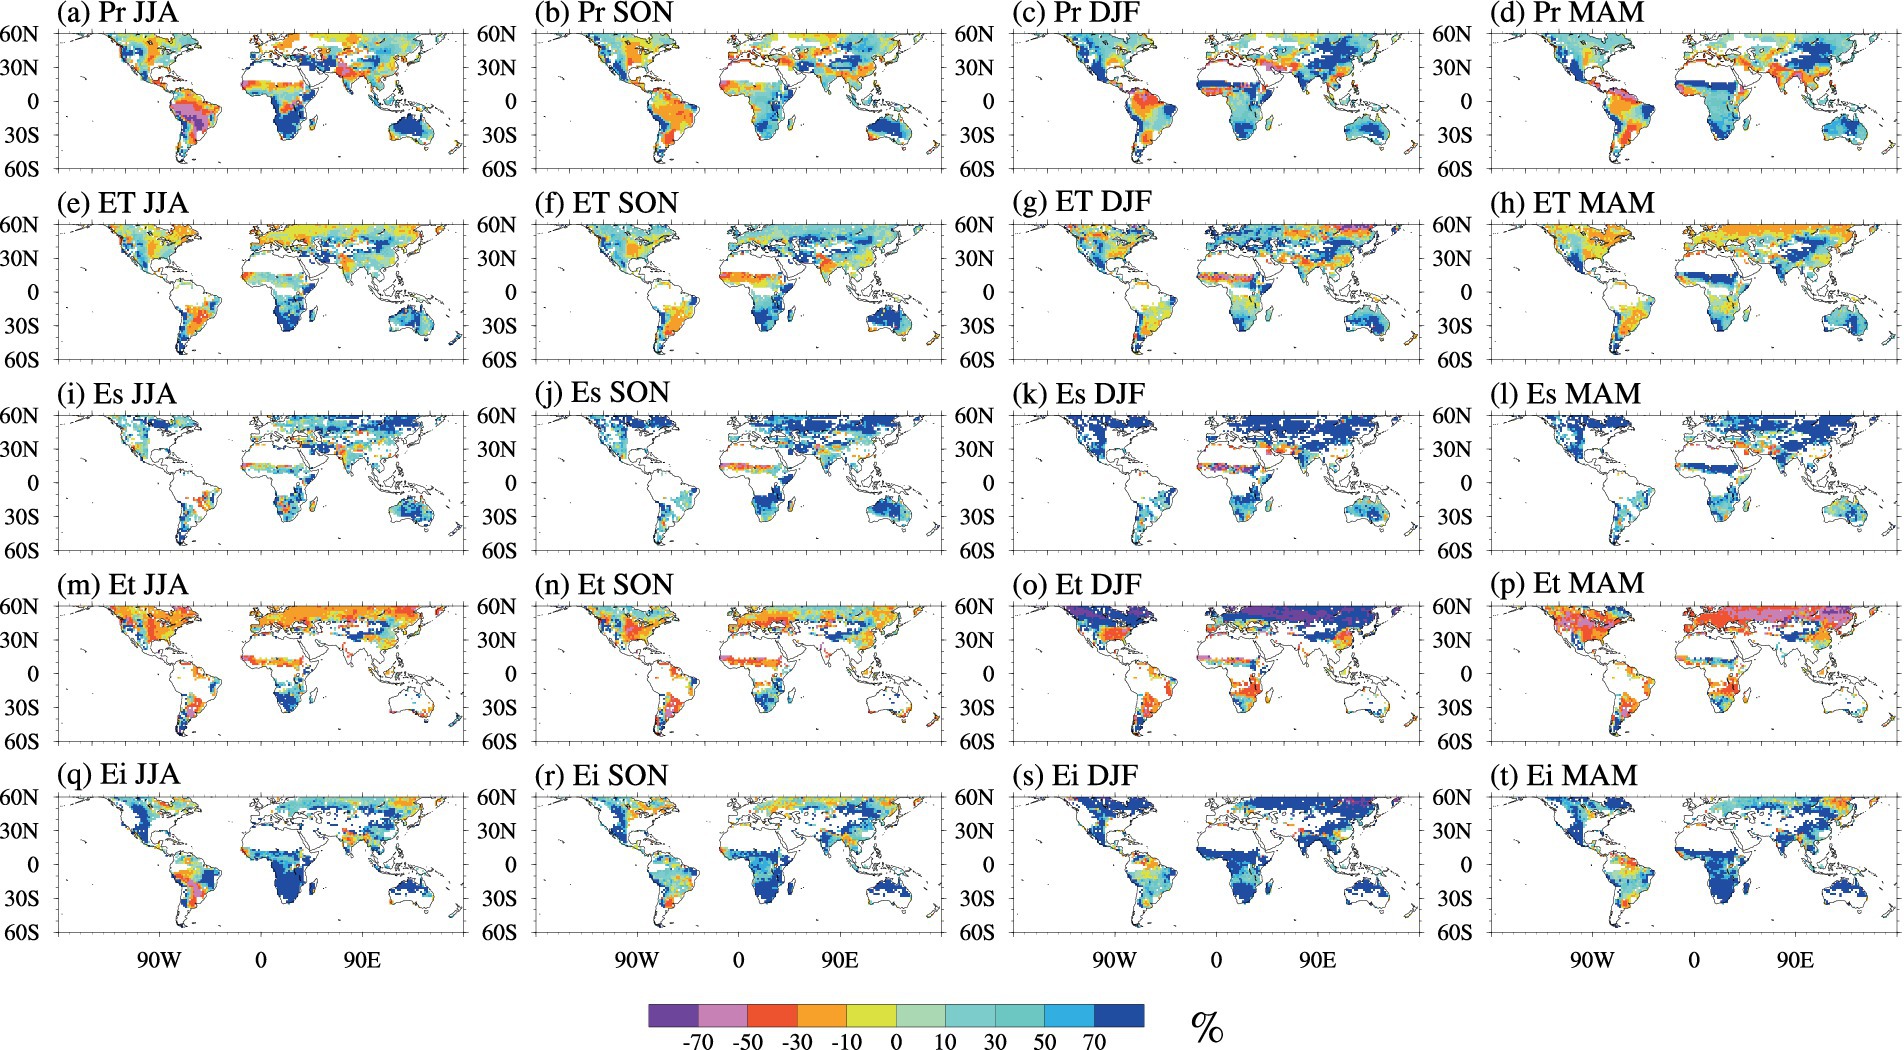
Figure 9. Relative differences (%) between the multi-model mean and observational mean, computed using Equation (2), for the regions shown in Figure S3 (a).(Pr), S4 (a). (ET), Figure 5 (a) (Es), Figure 6 (a) (Et), and Figure 7 (a) (Ei), excluding the gray-shaded areas. Subplots (a–d) correspond to Pr, (e–h) to ET, (i–l) to Es, (m–p) to Et, and (q–t) to Ei.
CMIP6 models generally show a relatively inadequate representation of the mean seasonal cycle of precipitation in deep tropics (Figure 8), despite a high degree of consistency among observation-based datasets shown in Figure 2a. This inadequacy in reconstructing the average annual cycle of tropic precipitation persists in three main generations of CMIP models, as demonstrated by Fiedler et al. (2020). Alternative modeling approaches, such as high-resolution storm-resolving models, might provide an alternative in precipitation variability reconstruction in the tropics (Segura et al., 2022; Paccini and Stevens, 2023; Tian et al., 2024).
Consistency in mean seasonal cycle is largely absent, even among observation-based ET datasets, across most tropical regions. This may be attributed to the limitations of the land surface schemes employed, which inadequately capture the complexity of ET dynamics in the tropics. These dynamics are shown to be influenced by a combination of climatic and terrestrial factors (Burnett et al., 2020). In the Amazon Basin, seasonal ET variations derived using a water-balance approach are driven by both water and energy availability. During the dry season, ET rates are elevated due to deep-rooted vegetation accessing groundwater to compensate for reduced rainfall and soil moisture, combined with increased solar radiation (Miguez-Macho and Fan, 2012; Maeda et al., 2017; Swann and Koven, 2017). Conversely, in the Congo Basin, a data-driven approach reveals that ET peaks during the MAM season rather than the wetter SON season. This pattern arises from higher net radiation, an optimal balance of diffuse and direct photosynthetically active radiation, and vegetation adaptations that enhance water-use efficiency, beyond the influence of soil water availability. These physical processes, critical to accurately representing ET dynamics, are inadequately accounted for in the land surface schemes used to generate these observation-based datasets.
Discrepancies in the physical processes employed in generating different datasets may be exacerbated in tropical regions compared with regions outsides of the tropics, which are characterized by the highest radiation levels, the highest precipitation rates, and the most densely vegetated areas on Earth. For instance, GLEAM v3.3a explicitly accounts for vegetation dynamics and incorporates observation-constrained surface soil moisture (Martens et al., 2017), a feature that is absent in other datasets. In contrast, GLDAS v2.0 is more model-driven, computing surface fluxes primarily based on soil water availability using the Noah3.6 land surface model (Kumar et al., 2006). ERA5-Land derives surface fluxes through a complex data assimilation process that integrates model outputs with observational data (Hersbach et al., 2020). Similarly, MERRA-Land, employing the enhanced catchment land surface model, accounts for topography and subgrid-scale features, thereby providing a more explicit representation of smaller-scale hydrological processes (Reichle et al., 2011). These variations in the physical representation of land hydrology processes are likely to contribute to differences in ET simulations among the datasets.
At the interannual time scale, our study reveals significant discrepancies among gauge-based (CRU4.0), gauge-satellite-combined (GPCP v2.3), and reanalysis (ERA5) precipitation datasets in their ability to reconstruct interannual precipitation variations in tropical regions as shown in Figure 2a. These findings are consistent with previous research on the estimation of tropical rainfall variability using gridded precipitation datasets from different sources. For example, Negrón Juárez et al. (2009) reported notable disagreements in interannual variability between gauge-based and gauge-satellite-combined products in the Amazon and Central Africa, highlighting the ongoing challenges in accurately reconstructing tropical rainfall. Similarly, Camberlin et al. (2019) demonstrated that seven gauge-satellite-combined products face difficulties in capturing interannual variations in Central Africa based on station observations. The sparse distribution of rainfall measurements across the tropics further complicates the comprehensive validation of observation-based precipitation data in these regions (Padrón et al., 2020).
Et dominates ET not only in densely vegetated, humid regions such as the Amazon and Congo Basins (Mu et al., 2013; Wang et al., 2014), but also across most regions globally in general, as indicated by observation-based estimates summarized in Table 2. Studies have demonstrated that Et rates are highly sensitive to plant hydraulic traits, including xylem vulnerability, stomatal conductance, and water potential (Kennedy et al., 2019; Jiménez-Rodríguez et al., 2024; Sun et al., 2024). Observational evidence further highlights the strong influence of groundwater storage on ET, which plays a critical role in regulating interannual variations in tropical regions (Aguilos et al., 2018; Sun et al., 2019; Lee et al., 2023).
Incorporating plant hydraulic processes and groundwater dynamics into land models has been shown to significantly enhance the representation of ET at both seasonal and interannual time scales in land surface models (LSMs) (Yan et al., 2020; Baldocchi et al., 2021; Li L. et al., 2021). Additionally, the long-term memory of soil moisture and the dynamic vegetation are crucial drivers of interannual variability in surface fluxes (Bellucci et al., 2015; Smith et al., 2019). Improved representations of soil moisture dynamics across different layers and vegetation processes in LSMs have the potential to not only improve the interannual variability of ET (Song et al., 2018) but also enhance precipitation simulations in GCMs through land-atmosphere interactions (Gao et al., 2020).
Our study focuses on regions where temporal consistency exists among observation-based estimates and state-of-the-art GCMs. However, alignment among datasets may also result from shared limitations or biases rather than an accurate representation of physical processes. For instance, in regions with precipitation-driven wet and dry seasons, the widely-used soil hydraulic schemes (SHSs) can misrepresent seasonality by overestimating Et during wet seasons and underestimating it during dry seasons due to excessive reliance on soil water availability (Sun et al., 2024; Sun and Verseghy, 2019). This highlights the need for caution when interpreting agreements as indicators of dataset reliability and underscores the importance of addressing these limitations in future research.
With respect to the mean seasonal cycle and interannual variability, this study evaluates the temporal consistency of Pr, Et, and their components—Es, Et, Ei. We utilized three observation-assisted precipitation datasets—gauge-based, satellite-based, and reanalysis data—along with four ET datasets encompassing energy-balance products, reanalysis data products, offline model outputs, and water-balanced model outputs. Our analysis revealed that Pr exhibited the highest spatial consistency, while Es demonstrated the lowest. Most CMIP6 models effectively captured the mean seasonal cycles of Pr, Et, and its three components, particularly within the consensus regions, with the multi-model mean showing the highest overall performance. However, Es had the lowest spatial coverage in these consensus regions, highlighting the challenges associated with accurately simulating this component. At the interannual time scale, the agreement between CMIP6 simulations and observation-based estimates was inconsistent and statistically non-significant. These findings underscore the urgent need for improved representation of interannual variability in both observational datasets and CMIP6 model outputs. Addressing the significant underestimation of Pr in tropical regions across all seasons and the overestimation of Es, and Ei, along with the underestimation of Et in other regions, could enhance the representation of seasonal variations and improve the accuracy of long-term variability modeling in the hydrological cycle.
The original contributions presented in the study are included in the article/Supplementary material, further inquiries can be directed to the corresponding author/s.
SS: Conceptualization, Formal analysis, Methodology, Visualization, Writing – original draft, Writing – review & editing. SX: Methodology, Visualization, Writing – review & editing. LL: Methodology, Visualization, Writing – review & editing. YL: Methodology, Visualization, Writing – review & editing. HL: Writing – review & editing. VM: Writing – review & editing. YX: Writing – review & editing. CF: Writing – review & editing.
The author(s) declare that financial support was received for the research, authorship, and/or publication of this article. SS was supported by the National Natural Science Foundation of China (Grant No. 42005122). SX acknowledges support from the National Natural Science Foundation of China (Grant No. 42101045). YL was funded by the National Natural Science Foundation of China (Grant No. 42275057). HL received support from the National Social Science Foundation of China (Grant No. 23BJY207). YX acknowledges funding from the National Natural Science Foundation of China (Grant No. 42364004).
The authors declare that the research was conducted in the absence of any commercial or financial relationships that could be construed as a potential conflict of interest.
The author(s) declared that they were an editorial board member of Frontiers, at the time of submission. This had no impact on the peer review process and the final decision.
The authors declare that no Gen AI was used in the creation of this manuscript.
All claims expressed in this article are solely those of the authors and do not necessarily represent those of their affiliated organizations, or those of the publisher, the editors and the reviewers. Any product that may be evaluated in this article, or claim that may be made by its manufacturer, is not guaranteed or endorsed by the publisher.
The Supplementary material for this article can be found online at: https://www.frontiersin.org/articles/10.3389/frwa.2025.1520258/full#supplementary-material
Abed-Elmdoust, A., Miri, M.-A., and Singh, A. (2016). Reorganization of river networks under changing spatiotemporal precipitation patterns: an optimal channel network approach. Water Resour. Res. 52, 8845–8860. doi: 10.1002/2015WR018391
Adler, R. F., Huffman, G. J., Chang, A., Ferraro, R., Xie, P.-P., Janowiak, J., et al. (2003). The version-2 global precipitation climatology project (GPCP) monthly precipitation analysis (1979–present). J. Hydrometeorol. 4, 1147–1167. doi: 10.1175/1525-7541(2003)004<1147:TVGPCP>2.0.CO;2
Aguilos, M., Stahl, C., Burban, B., Hérault, B., Courtois, E., Coste, S., et al. (2018). Interannual and seasonal variations in ecosystem transpiration and water use efficiency in a tropical rainforest. Forests 10:14. doi: 10.3390/f10010014
Akinsanola, A. A., Ogunjobi, K. O., Ajayi, V. O., Adefisan, E. A., Omotosho, J. A., and Sanogo, S. (2017). Comparison of five gridded precipitation products at climatological scales over West Africa. Meteorog. Atmos. Phys. 129, 669–689. doi: 10.1007/s00703-016-0493-6
Ault, T. R., Cole, J. E., and St George, S. (2012). The amplitude of decadal to multidecadal variability in precipitation simulated by state-of-the-art climate models. Geophys. Res. Lett. 39:L21705. doi: 10.1029/2012GL053424
Bai, P. (2023). Comparison of remote sensing evapotranspiration models: consistency, merits, and pitfalls. J. Hydrol. 617:128856. doi: 10.1016/j.jhydrol.2022.128856
Baldocchi, D., Ma, S., and Verfaillie, J. (2021). On the inter-and intra-annual variability of ecosystem evapotranspiration and water use efficiency of an oak savanna and annual grassland subjected to booms and busts in rainfall. Glob. Chang. Biol. 27, 359–375. doi: 10.1111/gcb.15414
Balsamo, G., Albergel, C., Beljaars, A., Boussetta, S., Brun, E., Cloke, H., et al. (2015). ERA-interim/land: a global land surface reanalysis data set. Hydrol. Earth Syst. Sci. 19, 389–407. doi: 10.5194/hess-19-389-2015
Bellucci, A., Haarsma, R., Bellouin, N., Booth, B., Cagnazzo, C., Van Den Hurk, B. J. J. M., et al. (2015). Advancements in decadal climate predictability: the role of nonoceanic drivers. Rev. Geophys. 53, 165–202. doi: 10.1002/2014RG000473
Bonavita, M., Hólm, E., Isaksen, L., and Fisher, M. (2016). The evolution of the ECMWF hybrid data assimilation system. Q.J.R. Meteorol. Soc. 142, 287–303. doi: 10.1002/qj.2652
Brown, J. R., Hope, P., Gergis, J., and Henley, B. J. (2016). ENSO teleconnections with Australian rainfall in coupled model simulations of the last millennium. Clim. Dyn. 47, 79–93. doi: 10.1007/s00382-015-2824-6
Burnett, M. W., Quetin, G. R., and Konings, A. G. (2020). Data-driven estimates of evapotranspiration and its controls in the Congo Basin. Hydrol. Earth Syst. Sci. 24, 4189–4211. doi: 10.5194/hess-24-4189-2020
Camberlin, P., Barraud, G., Bigot, S., Dewitte, O., Imwangana, F. M., Mateso, J.-C. M., et al. (2019). Evaluation of remotely sensed rainfall products over Central Africa. Q. J. R. Meteorol. Soc. 145, 2115–2138. doi: 10.1002/qj.3547
Cherchi, A., Fogli, P. G., Lovato, T., Peano, D., Iovino, D., Gualdi, S., et al. (2019). Global mean climate and main patterns of variability in the CMCC-CM2 coupled model. J. Adv. Model. Earth Syst. 11, 185–209. doi: 10.1029/2018MS001369
Cheruy, F., Ducharne, A., Hourdin, F., Musat, I., Vignon, É., Gastineau, G., et al. (2020). Improved near-surface continental climate in IPSL-CM6A-LR by combined evolutions of atmospheric and land surface physics. J. Adv. Model. Earth Syst. 12:e2019MS002005. doi: 10.1029/2019MS002005
Danabasoglu, G., Lamarque, J.-F., Bacmeister, J., Bailey, D. A., DuVivier, A. K., Jim Edwards, L. K., et al. (2020). The community earth system model version 2 (CESM2). J. Adv. Model. Earth Syst. 12:1916. doi: 10.1029/2019MS001916
Dieppois, B., Pohl, B., Rouault, M., New, M., Lawler, D., and Keenlyside, N. (2016). Interannual to interdecadal variability of winter and summer southern African rainfall, and their teleconnections. J. Geophys. Res. Atmos. 121, 6215–6239. doi: 10.1002/2015JD024576
Eyring, V., Bony, S., Meehl, G. A., Senior, C. A., Stevens, B., Stouffer, R. J., et al. (2016). Overview of the coupled model Intercomparison project phase 6 (CMIP6) experimental design and organization. Geosci. Model Dev. 9, 1937–1958. doi: 10.5194/gmd-9-1937-2016
Fiedler, S., Crueger, T., D’Agostino, R., Peters, K., Becker, T., Leutwyler, D., et al. (2020). Simulated tropical precipitation assessed across three major phases of the coupled model intercomparison project (CMIP). Mon. Weather Rev. 148, 3653–3680. doi: 10.1175/MWR-D-19-0404.1
Gao, C., Li, G., Chen, H., and Yan, H. (2020). Interdecadal change in the effect of spring soil moisture over the Indo-China peninsula on the following summer precipitation over the Yangtze River basin. J. Clim. 33, 7063–7082. doi: 10.1175/JCLI-D-19-0754.1
Gehne, M., Hamill, T. M., Kiladis, G. N., and Trenberth, K. E. (2016). Comparison of global precipitation estimates across a range of temporal and spatial scales. J. Clim. 29, 7773–7795. doi: 10.1175/JCLI-D-15-0618.1
Granato-Souza, D., Stahle, D. W., Torbenson, M. C. A., Howard, I. M., Barbosa, A. C., Feng, S., et al. (2020). Multidecadal changes in wet season precipitation totals over the eastern Amazon. Geophysical Res. Letters. 47:e2020GL087478. doi: 10.1029/2020GL087478
Hansen, M., and Song, X. P. (2017). MEaSUREs vegetation continuous fields (VCF) yearly global 0.05 Deg V001. NASA EOSDIS Land Processes DAAC. doi: 10.5067/MEaSUREs/VCF/VCF5KYR.001
Harris, I., Osborn, T. J., Jones, P., and Lister, D. (2020). Version 4 of the CRU TS monthly high-resolution gridded multivariate climate dataset. Scientific Data 7:109. doi: 10.1038/s41597-020-0453-3
Hersbach, H., Bell, B., Berrisford, P., Hirahara, S., Horányi, A., Muñoz-Sabater, J., et al. (2020). The ERA5 global reanalysis. Q. J. R. Meteorol. Soc. 146, 1999–2049. doi: 10.1002/qj.3803
Hersbach, H., Rosnay, P., Bell, B., Schepers, D., Simmons, A., Soci, C., et al. Operational global reanalysis: Progress, future directions and synergies with NWP (ERA report). ERA Report Series. (2018).
Jiménez-Rodríguez, C. D., Sulis, M., and Schymanski, S. (2024). The role of the intraspecific variability of hydraulic traits for modeling the plant water use in different European forest ecosystems. J. Adv. Model. Earth Syst. 16:e2022MS00349. doi: 10.1029/2022MS003494
Juárez, N., Robinson, I., Li, W., Rong, F., Fernandes, K., de Oliveira, A., et al. (2009). Comparison of precipitation datasets over the tropical south American and African continents. J. Hydrometeorol. 10, 289–299. doi: 10.1175/2008JHM1023.1
Kennedy, D., Swenson, S., Oleson, K. W., Lawrence, D. M., Fisher, R., Lola, A. C., et al. (2019). Implementing plant hydraulics in the community land model, version 5. J. Adv. Model. Earth Syst. 11, 485–513. doi: 10.1029/2018MS001500
Koster, R. D., Suarez, M. J., Ducharne, A., Stieglitz, M., and Kumar, P. (2000). A catchment-based approach to modeling land surface processes in a general circulation model: 1. Model structure. J. Geophys. Res. Atmos. 105, 24809–24822.
Kumar, S. V., Peters-Lidard, C. D., Tian, Y., Houser, P. R., James Geiger, S., Olden, L. L., et al. (2006). Land information system: an interoperable framework for high resolution land surface modeling. Environ. Model Softw. 21, 1402–1415. doi: 10.1016/j.envsoft.2005.07.004
Lee, T.-H., Lo, M.-H., Chiang, C.-L., and Kuo, Y.-N. (2023). The maritime continent’s rainforests modulate the local interannual evapotranspiration variability. Commun. Earth Environ. 4:482. doi: 10.1038/s43247-023-01126-4
Li, Z., Liu, T., Huang, Y., Peng, J., and Ling, Y. (2022). “Evaluation of the CMIP6 precipitation simulations over global land. Earth’s Future 10:e2021EF002500. doi: 10.1029/2021EF002500
Li, J., Miao, C., Wei, W., Zhang, G., Hua, L., Chen, Y., et al. (2021). Evaluation of CMIP6 global climate models for simulating land surface energy and water fluxes during 1979–2014. J. Adv. Model. Earth Syst. 13:e2021MS002515. doi: 10.1029/2021MS002515
Li, L., Yang, Z.-L., Matheny, A. M., Zheng, H., Swenson, S. C., Lawrence, D. M., et al. (2021). Representation of plant hydraulics in the Noah-MP land surface model: model development and multiscale evaluation. J. Adv. Model. Earth Syst. 13:e2020MS002214. doi: 10.1029/2020MS002214
Maeda, E. E., Ma, X., Wagner, F. H., Kim, H., Oki, T., Eamus, D., et al. (2017). “Evapotranspiration seasonality across the Amazon Basin.”. Earth Syst. Dynamics 8, 439–454. doi: 10.5194/esd-8-439-2017
Martens, B., Miralles, D. G., Lievens, H., Van Der Schalie, R., De Jeu, R. A. M., Fernández-Prieto, D., et al. (2017). GLEAM v3: satellite-based land evaporation and root-zone soil moisture. Geosci. Model Dev. 10, 1903–1925. doi: 10.5194/gmd-10-1903-2017
Martin, E. R., Thorncroft, C., and Booth, B. B. B. (2014). The multidecadal Atlantic SST—Sahel rainfall teleconnection in CMIP5 simulations. J. Clim. 27, 784–806. doi: 10.1175/JCLI-D-13-00242.1
Miguez-Macho, G., and Fan, Y. (2012). The role of groundwater in the Amazon water cycle: 2. Influence on seasonal soil moisture and evapotranspiration. J. Geophys. Res. Atmos. 117:D15114. doi: 10.1029/2012JD017540
Miralles, D., Gonzalez, C. J., Jung, M., Michel, D., Ali Ershadi, M. F., McCabe, M. H., et al. (2016). The WACMOS-ET project–part 2: evaluation of global terrestrial evaporation data sets. Hydrol. Earth Syst. Sci. 20, 823–842. doi: 10.5194/hess-20-823-2016
Mu, Q., Zhao, M., and Running, S. W. (2013). MODIS global terrestrial evapotranspiration (ET) product (NASA MOD16A2/A3). Algorithm Theoretical Basis Document Collection 5, 381–394.
Nelson, J. A., Walther, S., Gans, F., Kraft, B., Weber, U., Novick, K., et al. (2024). X-BASE: the first terrestrial carbon and water flux products from an extended data-driven scaling framework, FLUXCOM-X. Biogeosci. 21, 5079–5115. doi: 10.5194/bg-21-5079-2024
Noy-Meir, I. (1973). Desert ecosystems: environment and producers. Annu. Rev. Ecol. Syst. 4, 25–51. doi: 10.1146/annurev.es.04.110173.000325
Oleson, K. W., Lawrence, D. M., Bonan, G. B., Drewniak, B., Huang, M., Koven, C. D., et al. (2013). Technical description of version 4.5 of the Community Land Model (CLM). doi: 10.5065/D6RR1W7M
Paccini, L., and Stevens, B. (2023). Assessing precipitation over the Amazon basin as simulated by a storm-resolving model. J. Geophys. Res. Atmos. 128:e2022JD037436. doi: 10.1029/2022JD037436
Padrón, F., Ryan, J. F., Córdova, M., Crespo, P., and Célleri, R. (2020). Rain gauge inter-comparison quantifies deficiencies in precipitation monitoring. La Granja-Revista de Ciencias de la Vida 31, 7–20. doi: 10.17163/lgr.n31.2020.01
Reichle, R. H. (2012). The MERRA-land data product. GMAO office note no. 3 (version 1.2). Greenbelt, MD: NASA Goddard Space Flight Center.
Reichle, R. H., Koster, R. D., De Lannoy, G. J. M., Forman, B. A., Liu, Q., Mahanama, S. P. P., et al. (2011). Assessment and enhancement of MERRA land surface hydrology estimates. J. Clim. 24, 6322–6338. doi: 10.1175/JCLI-D-10-05033.1
Rivera, J. A., and Arnould, G. (2020). Evaluation of the ability of CMIP6 models to simulate precipitation over southwestern South America: climatic features and long-term trends (1901–2014). Atmos. Res. 241:104953. doi: 10.1016/j.atmosres.2020.104953
Rodell, M., Houser, P. R., Jambor, U. E. A., Gottschalck, J., Kieran Mitchell, C.-J., Meng, K. A., et al. (2004). The global land data assimilation system. Bull. Am. Meteorol. Soc. 85, 381–394. doi: 10.1175/BAMS-85-3-381
Segura, H., Hohenegger, C., Wengel, C., and Stevens, B. (2022). Learning by doing: seasonal and diurnal features of tropical precipitation in a global-coupled storm-resolving model. Geophys. Res. Lett. 49:e2022GL101796. doi: 10.1029/2022GL101796
Seland, Ø., Bentsen, M., Olivié, D., Toniazzo, T., Gjermundsen, A., Graff, L. S., et al. (2020). Overview of the Norwegian earth system model (NorESM2) and key climate response of CMIP6 DECK, historical, and scenario simulations. Geosci. Model Dev. 13, 6165–6200. doi: 10.5194/gmd-13-6165-2020
Seiji, Y., Kawai, H., Koshiro, T., Oshima, N., Yoshida, K., Urakawa, S., et al. (2019). The meteorological research institute earth system model version 2.0, MRI-ESM2. 0: description and basic evaluation of the physical component. J. Meteorol. Soc. Japan. Ser. II. 97, 931–965. doi: 10.2151/jmsj.2019-051
Singhal, A., Jaseem, M., Divya, S. S., Prajapati, P., Singh, A., and Jha, S. K. (2024). Identifying potential locations of hydrologic monitoring stations based on topographical and hydrological information. Water Resour. Manag. 38, 369–384. doi: 10.1007/s11269-023-03675-x
Smith, D. M., Eade, R., Scaife, A. A., Caron, L.-P., Danabasoglu, G., DelSole, T. M., et al. (2019). “robust skill of decadal climate predictions.” Npj climate and atmospheric. Science 2:13. doi: 10.1038/s41612-019-0071-y
Song, X.-P., Hansen, M. C., Stehman, S. V., Potapov, P. V., Tyukavina, A., Vermote, E. F., et al. (2018). Global land change from 1982 to 2016. Nature 560, 639–643. doi: 10.1038/s41586-018-0411-9
Sun, L., Baker, J. C. A., Gloor, E., Spracklen, D., Boesch, H., Somkuti, P., et al. (2019). “Seasonal and inter-annual variation of evapotranspiration in Amazonia based on precipitation, river discharge and gravity anomaly data.” Frontiers. Earth Sci. 7:32. doi: 10.3389/feart.2019.00032
Sun, S., Li, L., Yang, Z.-L., Wang, G., McDowell, N. G., Matheny, A. M., et al. (2024). Refining water and carbon fluxes modeling in terrestrial ecosystems via plant hydraulics integration. Agric. For. Meteorol. 359:110256. doi: 10.1016/j.agrformet.2024.110256
Sun, S., and Verseghy, D. (2019). Introducing water-stressed shrubland into the Canadian land surface scheme. J. Hydrol. 579:124157. doi: 10.1016/j.jhydrol.2019.124157
Swann, A. L. S., and Koven, C. D. (2017). A direct estimate of the seasonal cycle of evapotranspiration over the Amazon basin. J. Hydrometeorol. 18, 2173–2185. doi: 10.1175/JHM-D-17-0004.1
Swart, N. C., Cole, J. N. S., Kharin, V. V., Lazare, M., Scinocca, J. F., Gillett, N. P., et al. (2019). The Canadian earth system model version 5 (CanESM5. 0.3). Geosci. Model Dev. 12, 4823–4873. doi: 10.5194/gmd-12-4823-2019
Tang, G., Clark, M. P., Papalexiou, S. M., Ma, Z., and Hong, Y. (2020). Have satellite precipitation products improved over last two decades? A comprehensive comparison of GPM IMERG with nine satellite and reanalysis datasets. Remote Sens. Environ. 240:111697. doi: 10.1016/j.rse.2020.111697
Taylor, K. E., Stouffer, R. J., and Meehl, G. A. (2012). An overview of CMIP5 and the experiment design. Bull. Am. Meteorol. Soc. 93, 485–498. doi: 10.1175/BAMS-D-11-00094.1
Tian, B., and Dong, X. (2020). The double-ITCZ bias in CMIP3, CMIP5, and CMIP6 models based on annual mean precipitation. Geophys. Res. Lett. 47:e2020GL087232. doi: 10.1029/2020GL087232
Tian, J., Zhang, Y., Klein, S. A., Terai, C. R., Caldwell, P. M., Beydoun, H., et al. (2024). How well does the DOE global storm resolving model simulate clouds and precipitation over the Amazon? Geophys. Res. Lett. 51:e2023GL108113. doi: 10.1029/2023GL108113
Volodin, E., and Gritsun, A. (2018). Simulation of observed climate changes in 1850–2014 with climate model INM-CM5. Earth Syst. Dynam. 9, 1235–1242. doi: 10.5194/esd-9-1235-2018
Wagner, W., Dorigo, W. A., de Jeu, R. A. M., Fernández-Prieto, D., Benveniste, J., Haas, E., et al., Fusion of active and passive microwave observations to create an essential climate variable data record on soil moisture, in: Proceedings of the XXII International Society for Photogrammetry and Remote Sensing (ISPRS) Congress, Melbourne, Australia, (2012) 25.
Wang, L., Good, S. P., and Caylor, K. K. (2014). Global synthesis of vegetation control on evapotranspiration partitioning. Geophys. Res. Lett. 41, 6753–6757. doi: 10.1002/2014GL061439
Wang, P. X., Wang, B., Cheng, H., Fasullo, J., Guo, Z. T., Kiefer, T., et al. (2017). The global monsoon across time scales: mechanisms and outstanding issues. Earth Sci. Rev. 174, 84–121. doi: 10.1016/j.earscirev.2017.07.006
Wang, Z., Zhan, C., Ning, L., and Guo, H. (2021). Evaluation of global terrestrial evapotranspiration in CMIP6 models. Theor. Appl. Climatol. 143, 521–531. doi: 10.1007/s00704-020-03437-4
Wu, T., Yixiong, L., Fang, Y., Xin, X., Li, L., Li, W., et al. (2019). The Beijing climate center climate system model (BCC-CSM): the main progress from CMIP5 to CMIP6. Geosci. Model Dev. 12, 1573–1600. doi: 10.5194/gmd-12-1573-2019
Xu, T., Guo, Z., Xia, Y., Ferreira, V. G., Liu, S., Wang, K., et al. (2019). Evaluation of twelve evapotranspiration products from machine learning, remote sensing and land surface models over conterminous United States. J. Hydrol. 578:124105. doi: 10.1016/j.jhydrol.2019.124105
Yan, B., Mao, J., Dickinson, R. E., Thornton, P. E., Shi, X., Ricciuto, D. M., et al. (2020). Modelling tree stem-water dynamics over an Amazonian rainforest. Ecohydrology 13:e2180. doi: 10.1002/eco.2180
Zhang, L., Marshall, M., Vrieling, A., and Nelson, A. (2023). The divergence of energy-and water-balance evapotranspiration estimates in humid regions. J. Hydrol. 624:129971. doi: 10.1016/j.jhydrol.2023.129971
Keywords: land surface fluxes, precipitation, evapotranspiration, soil evaporation, vegetation transpiration, canopy interception loss
Citation: Sun S, Xu S, Li L, Lin Y, Liu H, Maggioni V, Xu Y and Fu C (2025) Global assessment of terrestrial precipitation and evapotranspiration in CMIP6 simulations using observation-based estimates. Front. Water. 7:1520258. doi: 10.3389/frwa.2025.1520258
Edited by:
Alexandra Gemitzi, Democritus University of Thrace, GreeceReviewed by:
Shiblu Sarker, Virginia Department of Conservation and Recreation, United StatesCopyright © 2025 Sun, Xu, Li, Lin, Liu, Maggioni, Xu and Fu. This is an open-access article distributed under the terms of the Creative Commons Attribution License (CC BY). The use, distribution or reproduction in other forums is permitted, provided the original author(s) and the copyright owner(s) are credited and that the original publication in this journal is cited, in accordance with accepted academic practice. No use, distribution or reproduction is permitted which does not comply with these terms.
*Correspondence: Shanshan Sun, c3Vuc0B5bnUuZWR1LmNu
†ORCID: Shanshan Sun, https://orcid.org/0000-0003-0645-8162
Shiqin Xu, https://orcid.org/0000-0002-4899-0598
Lingcheng Li, https://orcid.org/0000-0002-6834-5844
Yihua Lin, https://orcid.org/0000-0002-4271-5640
Hongbo Liu, https://orcid.org/0000-0002-4534-4275
Viviana Maggioni, https://orcid.org/0000-0003-0753-3179
Yan Xu, https://orcid.org/0000-0001-5725-2565
Congsheng Fu, https://orcid.org/0000-0001-7838-1323
Disclaimer: All claims expressed in this article are solely those of the authors and do not necessarily represent those of their affiliated organizations, or those of the publisher, the editors and the reviewers. Any product that may be evaluated in this article or claim that may be made by its manufacturer is not guaranteed or endorsed by the publisher.
Research integrity at Frontiers
Learn more about the work of our research integrity team to safeguard the quality of each article we publish.