 Tianlong Jia
 Andre Jehan Vallendar1,2†
 Rinze de Vries
 Zoran Kapelan
 Riccardo Taormina
- 1Department of Water Management, Faculty of Civil Engineering and Geosciences, Delft University of Technology, Delft, Netherlands
- 2Noria Sustainable Innovators, Delft, Netherlands
Supervised Deep Learning (DL) methods have shown promise in monitoring the floating litter in rivers and urban canals but further advancements are hard to obtain due to the limited availability of relevant labeled data. To address this challenge, researchers often utilize techniques such as transfer learning (TL) and data augmentation (DA). However, there is no study currently reporting a rigorous evaluation of the effectiveness of these approaches for floating litter detection and their effects on the models' generalization capability. To overcome the problem of limited data availability, this work introduces the “TU Delft—Green Village” dataset, a novel labeled dataset of 9,473 camera and phone images of floating macroplastic litter and other litter items, captured using experiments in a drainage canal of TU Delft. We use the new dataset to conduct a thorough evaluation of the detection performance of five DL architectures for multi-class image classification. We focus the analysis on a systematic evaluation of the benefits of TL and DA on model performances. Moreover, we evaluate the generalization capability of these models for unseen litter items and new device settings, such as increasing the cameras' height and tilting them to 45°. The results obtained show that, for the specific problem of floating litter detection, fine-tuning all layers is more effective than the common approach of fine-tuning the classifier alone. Among the tested DA techniques, we find that simple image flipping boosts model accuracy the most, while other methods have little impact on the performance. The SqueezeNet and DenseNet121 architectures perform the best, achieving an overall accuracy of 89.6 and 91.7%, respectively. We also observe that both models retain good generalization capability which drops significantly only for the most complex scenario tested, but the overall accuracy raises significantly to around 75% when adding a limited amount of images to training data, combined with flipping augmentation. The detailed analyses conducted here and the released open source dataset offer valuable insights and serve as a precious resource for future research.
1 Introduction
Litter accumulation in water bodies is a challenging environmental issue that affects global ecosystems, human health and the economy (Panwar et al., 2020). Plastic accounts for most litter pollution in the oceans, due to its widespread use and its persistence in aquatic environments (Lebreton et al., 2018; Borrelle et al., 2020; Bellou et al., 2021). Recent studies suggest that rivers are responsible for transferring most plastics from land to the oceans (Meijer et al., 2021), while concurrently acting as plastic reservoirs (Weideman et al., 2020; van Emmerik et al., 2022). Regardless of the type of waste and its destination in the environment, urban areas are the main source of litter pollution in water bodies. For instance, recent estimates for the city of Amsterdam suggest that around 2.7 million items enter the closely connected IJ river annually (Tasseron et al., 2023).
The detection and quantification of floating litter in urban waterways is thus essential for evaluating pollution levels and informing mitigation actions (van Lieshout et al., 2020). Common methods include human visual counting (van Emmerik et al., 2018; van Calcar and van Emmerik, 2019) and debris sampling (Lechner et al., 2014; Dris et al., 2018). Recently, researchers have suggested using Deep Learning (DL) methods based on Convolutional Neural Networks (CNNs) to replace the time-consuming and labor-intensive traditional approaches (Jakovljevic et al., 2020; van Lieshout et al., 2020; Garcia-Garin et al., 2021). DL is a family of representation learning techniques, that involves using artificial neural networks to learn from and make decisions on vast amounts of unstructured data. DL models can automatically learn feature representation from raw data, avoiding manual feature extraction. This allows DL algorithms to reach state-of-the-art performances in various complex tasks, e.g., image recognition and natural language processing (LeCun et al., 2015). Several previous studies showed the effectiveness of DL-based computer vision for litter detection, including studies on image classification (IC) (Wolf et al., 2020), object detection (van Lieshout et al., 2020; Lin et al., 2021; Putra and Prabowo, 2021; Tharani et al., 2021; Maharjan et al., 2022; Tomas et al., 2022) and image segmentation (Jakovljevic et al., 2020). For example, Wolf et al. (2020) developed two CNN models, PLD-CNN and PLQ-CNN, to classify litter on beaches and rivers using airborne imagery. PLD-CNN classified images into six classes (water, sand, vegetation, litter-low, litter-high, and other), while PLQ-CNN further divided litter items into 11 sub-classes (e.g., water bottles and cups). Both models achieved high overall accuracies of 83 and 71%, respectively. van Lieshout et al. (2020) collected images using cameras mounted on bridges in Jakarta, Indonesia, and employed the Faster R-CNN with InceptionV2 to detect plastic litter with a precision of 68.7%. Jakovljevic et al. (2020) applied a semantic segmentation algorithm to accurately detect three types of plastic material (OPS, Nylon, and PET) from airborne imagery, obtaining high F1-scores of 0.86, 0.88, and 0.92 for OPS, Nylon, and PET, respectively. Tharani et al. (2021) demonstrated that the M2Det(VGG) model could accurately detect trash objects of various sizes from camera images. Four studies (Lin et al., 2021; Putra and Prabowo, 2021; Maharjan et al., 2022; Tomas et al., 2022) showed that models belonging to the YOLO (You Only Look Once) family can successfully detect litter in rivers from camera images, airborne imagery or phone images.
While reported results are encouraging, DL-based detection of floating litter faces several challenges, as recently highlighted by Gnann et al. (2022) and Jia et al. (2023). One major challenge is the need of large annotated datasets to train and validate robust DL models. Acquiring a sufficiently large dataset can be time-consuming, tedious, and costly. To partially address this challenge, researchers often utilize techniques such as transfer learning (TL) and data augmentation (DA).
Transfer learning involves transferring knowledge from a related task to a new task (Pan and Yang, 2009). When applied to DL models, TL involves the reuse of a previously trained model on a large dataset such as ImageNet dataset (Deng et al., 2009), often requiring the assistance of powerful computing resources. Then, the model is fine-tuned from the pre-trained model on the desired dataset to conduct the object task. One common TL strategy is to use the pre-trained model as the feature extractor, where the parameters are kept frozen, while the rest of the model's parameters are updated during fine-tuning. This can reduce the training time and prevent overfitting by providing a better starting point for training. Data augmentation can reduce model overfitting and improve robustness by increasing the quantity of available training data through the transformation of images in the original training dataset (Shorten and Khoshgoftaar, 2019).
Several studies have applied TL and DA methods to develop better DL models for floating litter detection. For example, van Lieshout et al. (2020) and Maharjan et al. (2022) pre-trained the DL models on COCO dataset (Lin et al., 2014) and then fine-tuned models on floating litter datasets on object detection tasks. Jakovljevic et al. (2020), Wolf et al. (2020), and Tharani et al. (2021) pre-trained models using ImageNet, CIFAR-10 (Recht et al., 2018), and Pascal VOC (Everingham et al., 2010) datasets, respectively. On the other hand, van Lieshout et al. (2020) and Wolf et al. (2020) performed horizontal and vertical flipping augmentation to improve model performance. Lin et al. (2021) used mosaic data augmentation and Copy-Paste augmentation, and Tomas et al. (2022) used rotation augmentation (Jia et al., 2023). However, only few studies (van Lieshout et al., 2020; Maharjan et al., 2022) evaluated their benefits compared to alternatives (e.g., training models from scratch or with non-augmented datasets).
TL and DA are particularly important to develop models with good out-of-domain generalization capability, which is essential for deploying large scale monitoring campaigns (Jia et al., 2023). Despite the significance of model generalization across locations and device setups (e.g., camera heights and viewing angles), only a few studies considered it (van Lieshout et al., 2020; Maharjan et al., 2022). For example, van Lieshout et al. (2020) found that a model that performed well for one location in Jakarta, Indonesia, did not generalize well to a different location of the same city, resulting in a drop in precision from 68.7 to 54.0%. This degradation in performance was attributed to the presence of a large amount of organic material (e.g., leaves and branches) in the new images, which was not accounted for during training.
To the best of our knowledge, no study exists on DL-based litter detection reporting a rigorous comparison of TL strategies, DA techniques and their effects on generalization. In this work, we contribute to closing this gap and reduce the issue of data availability by performing a thorough analysis on a novel dataset of floating litter.
The key contributions of this paper can be summarized as follows:
1. We release the “TU Delft—Green Village” (TUD-GV) dataset, a novel labeled dataset of camera and phone images of floating litter collected from semi-controlled experiments in a drainage canal of the TU Delft Campus, the Netherlands;
2. We train and test five deep learning architectures for multi-class image classification (ResNet50, InceptionV3, DenseNet121, MobileNetV2, and SqueezeNet), and evaluate the benefits of multiple TL strategies and DA techniques on detection performance;
3. We perform tailored experiments to investigate and improve the out-of-sample generalization capability of the best performing architectures, considering unseen litter items and new device settings (i.e., increasing the cameras' height and tilting the viewing angle to 45°).
This study is aiming primarily at researchers developing novel DL methods for improved detection and quantification of floating litter in rivers and canals. The insights summarized above can contribute to other stakeholders such as various technology providers, consultants, governmental organizations, and Non-Governmental Organizations (NGOs) to develop more robust DL models for cleaning up campaigns and mitigation of environmental pollution (Jia et al., 2023).
The remainder of the paper is structured as follows. Section 2 describes the novel dataset. Section 3 presents the methodology used in this study, including the DL architectures, TL methods, DA techniques, and proposed approaches to improve generalization capability. Section 4 describes three sets of experiments, including the datasets used, the experimental setup, and performance evaluation. In Section 5, we present and discuss the experimental results. Finally, we summarize the conclusions in Section 6.
2 The TU Delft-Green Village dataset
We created the “TU Delft-Green Village” (TUD-GV) dataset from experiments conducted during 10 days in February and April 2021 in a small drainage canal at The Green Village —a field lab facility in the TU Delft Campus, the Netherlands. Figure 1 shows the monitoring setup. We captured data using two action cameras (GoPro HERO4 and GoPro MAX 360) and a phone (Huawei P30 Pro) mounted on four different locations on a bridge. All devices recorded videos with a resolution of 1,080 p, a linear field of view, and a FPS (frame per second) of 24 (for the action cameras) or 30 (for the phone). We opted for data collection in a semi-controlled environment as it is time-saving and cost-effective. First, we collected the litter objects from canals in Alkmaar (the Netherlands) with the help of volunteers, as well as from household waste from nearby neighborhoods. In total, we gathered 626 items, including plastic bottles, plastic bags, miscellaneous plastic objects, as well as metal tins, paper and cardboard items. Examples of litter objects can be found in Supplementary material. Then, we placed the collected litter on the water surface of the canal at The Green Village and captured images as the floating litter moved on the water surface due to wind. Finally, we used floating barriers (see Figure 1A) to intercept floating litter after data collection to prevent water pollution.
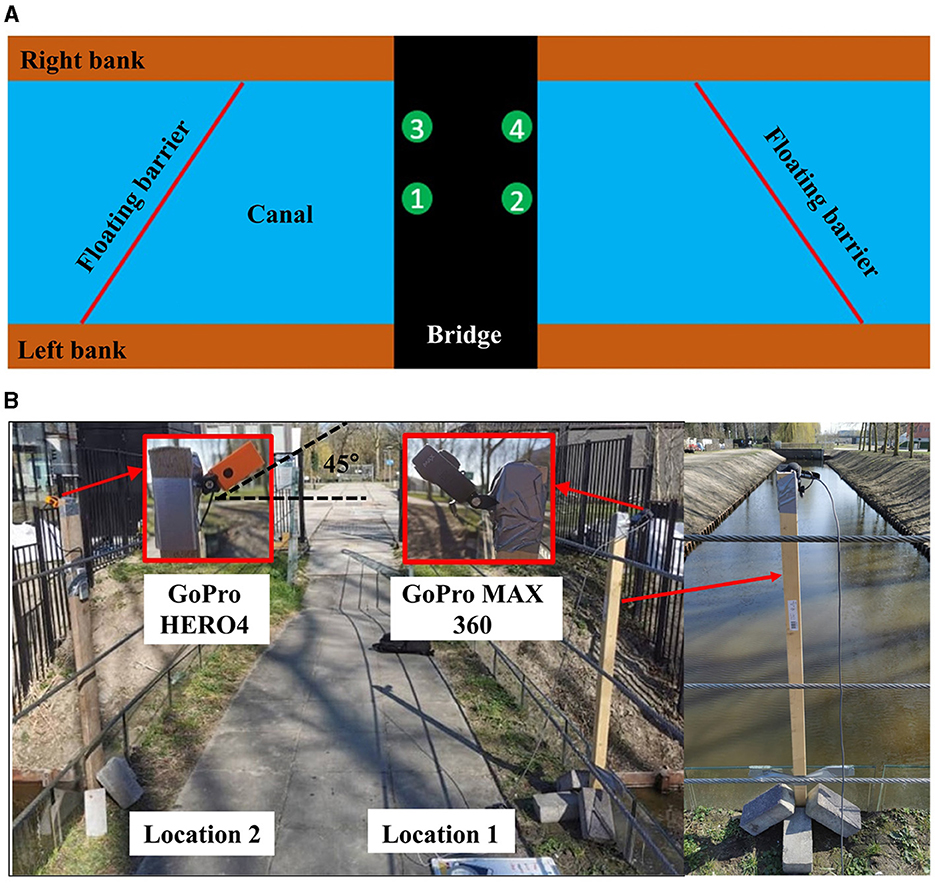
Figure 1. Monitoring setup at The Green Village: (A) view from the top with the four different filming locations (1–4) on the bridge; (B) details of some camera installation on Locations 1 and 2.
Table 1 shows the details of the TUD-GV dataset, including device specifications, weather condition, litter class and the number of images. We recorded a total of 165 videos, from which we selected 9,473 images (703 phone images and 8,770 camera images) to create the TUD-GV dataset. These images contain canal and household floating litter under two different weather conditions (sunny and cloudy), taken from two device heights above the water surface (2.7 and 4.0 m) and two viewing angles (0 and 45 degrees). Figure 2 provides examples of images from different device settings (device height and viewing angle). The collected images reflect all possible combinations of device used, device settings, type of litter, and environmental conditions. The set of household litter from the 2.7 m/45° setup is comprised solely of cloudy weather images, while some images from the 4 m/45° and 4 m/0° setups contain sun glints, as shown in Figures 2C, D. Images from the 4 m/0° setup were cropped to exclude the bridge, as shown in Figure 2C. Inspired by the categorization scheme of CrowdWater (van Emmerik et al., 2020), we manually labeled the images in the TUD-GV dataset into four classes: no litter (0 items), little litter (1–2 items), moderate litter (3–5 items), and lots of litter (6–10 items) according to the number of litter items in images (see Figure 2).
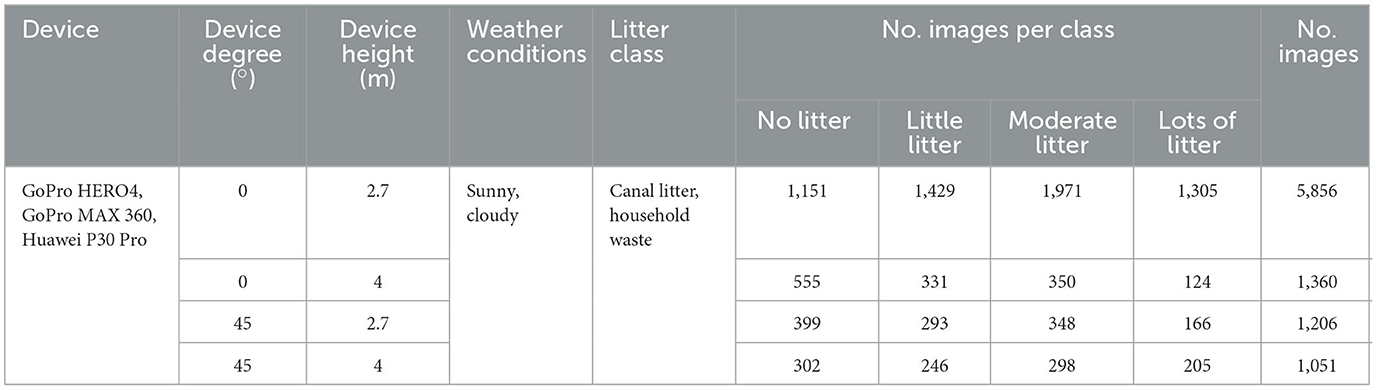
Table 1. TUD-GV dataset details.
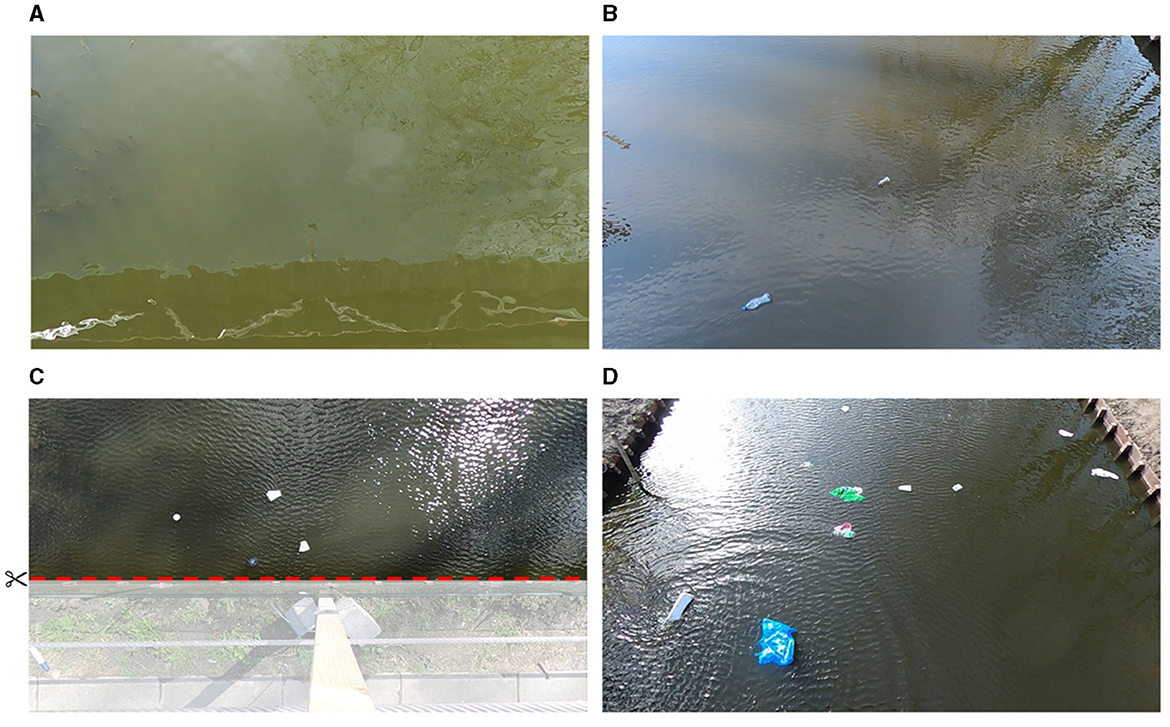
Figure 2. Examples of images from the TUD-GV dataset captured from four device setups including (A) 2.7 m/0°, (B) 2.7 m/45°, (C) 4 m/0°, and (D) 4 m/45°. The captions for the four images are (A) no litter, (B) little litter, (C) moderate litter, and (D) lots of litter, respectively. The image (C) was cropped to omit the bridge.
The TUD-GV dataset described above is one of the most complete and accessible datasets for detecting floating litter using computer vision, and a much needed supplement to existing datasets made available by other researchers (van Lieshout et al., 2020; Wolf et al., 2020).
3 Methodology
3.1 Deep learning architectures
We framed the problem of floating litter detection as a multi-class image classification task. We employed five major CNN architectures that have demonstrated good performance on ImageNet classification: ResNet50 (25.6 M parameters) (He et al., 2016), InceptionV3 (23.9 M) (Szegedy et al., 2016), DenseNet121 (8.1 M) (Huang et al., 2017), MobileNetV2 (3.5 M) (Sandler et al., 2018), and SqueezeNet (1.2 M) (Iandola et al., 2016). The reader is referred to the literature for more details on the employed architectures.
A typical CNN for image classification consists of several convolutional blocks and a classifier. The convolutional blocks are made up of convolutional and pooling layers, which are used to extract features from images. The classifier typically consists of fully connected dense layers that are used to classify images based on the features extracted by the convolutional base (Subramanian et al., 2022). For the purpose of this study, we replaced the original classifier in each CNN architecture with a global average pooling layer followed by a dense layer with a softmax activation function for multi-class classification (i.e., four classes). Global average pooling summarizes the feature maps produced by the convolutional base to reduce overfitting and computational costs.
3.2 Transfer learning
We evaluated the benefits of the most common transfer learning strategies (Guo et al., 2020): (1) fine-tuning the classifier alone (FTC), and (2) fine-tuning all layers (FTAL). We evaluated the effect of transferring features learned on the ImageNet IC task to floating litter detection, a common approach in the field (Jia et al., 2023). The ImageNet dataset is a widely used benchmark dataset for IC tasks, with more than 20,000 categories (e.g., balloon and strawberry) and over 14 million images. In the FTC strategy, we first loaded the model pre-trained on ImageNet, then replaced and fine-tuned the classifier on the TUD-GV dataset while freezing the convolutional base (i.e., weights remain fixed during training). In the FTAL strategy, we fine-tuned all layers of the model on the TUD-GV dataset after loading the ImageNet weights as the starting point and replacing the classifier. We compared the effectiveness of FTC and FTAL against the performances obtained by training the models from scratch, that is with random weight initialization.
3.3 Data augmentation
Data Augmentation normally includes automated procedures performing geometric and color transformations on images. In this study, we evaluated the benefits of four different DA techniques separately, including (1) flipping, (2) brightening, (3) darkening, and (4) adding random salt and pepper noise; we also tested (5) mixing all the four aforementioned techniques, an approached hereafter identified as MIX DA. Flipping has been shown to be effective on benchmark datasets, such as ImageNet and CIFAR-10 (Recht et al., 2018). Since lighting biases often hinder image classification and object detection (Shorten and Khoshgoftaar, 2019), we also assessed the effect of variations in brightness on model performances. Furthermore, adding noise to images can help CNN models discover more robust features in images (Shorten and Khoshgoftaar, 2019). Techniques such as cropping, rotation, or zooming were not assessed because they may cause the omission of original objects of interest in the new images, leading to undesirable label transformations (Shorten and Khoshgoftaar, 2019).
Figure 3 shows examples of each DA technique. We adopted three types of flipping methods: horizontal flipping (i.e., reversing pixels of an image in the horizontal direction), vertical flipping (i.e., reversing pixels in the vertical direction), and combined horizontal and vertical flipping (i.e., reversing pixels in the horizontal direction and then reversing those in the vertical direction). Each type of flipping was performed to generate one new image from one original image. For brightness augmentation, we used the function provided in the Python Imaging Library (Hadi et al., 2016) by changing the brightness parameter. We generated three new images with different brightness levels by using three random brightness parameters [range (1.1, 1.4)]. A brightness parameter value of “0” creates an image with a black color, while a value of “1” returns the original image. Values above “1” create brighter images. Similarly, we employed three random brightness parameters [range (0.6, 0.9)] for darkness augmentation. To add random salt and pepper noise, we used the function provided in the Scikit-image library (van der Walt et al., 2014) by changing noise ratio values. We created three new images with different levels of noise by using three random noise ratio values [range (0.01, 0.15)]. The noise ratio is the proportion of salt-and-pepper noise in the range (0, 1). A higher noise ratio value means that there is more salt noise than pepper noise (Azzeh et al., 2018). Each DA method mentioned above was applied to generate three new images for each original training image. MIX DA includes all images generated by the other four DA methods, resulting in a total of 12 new images for each original training image.
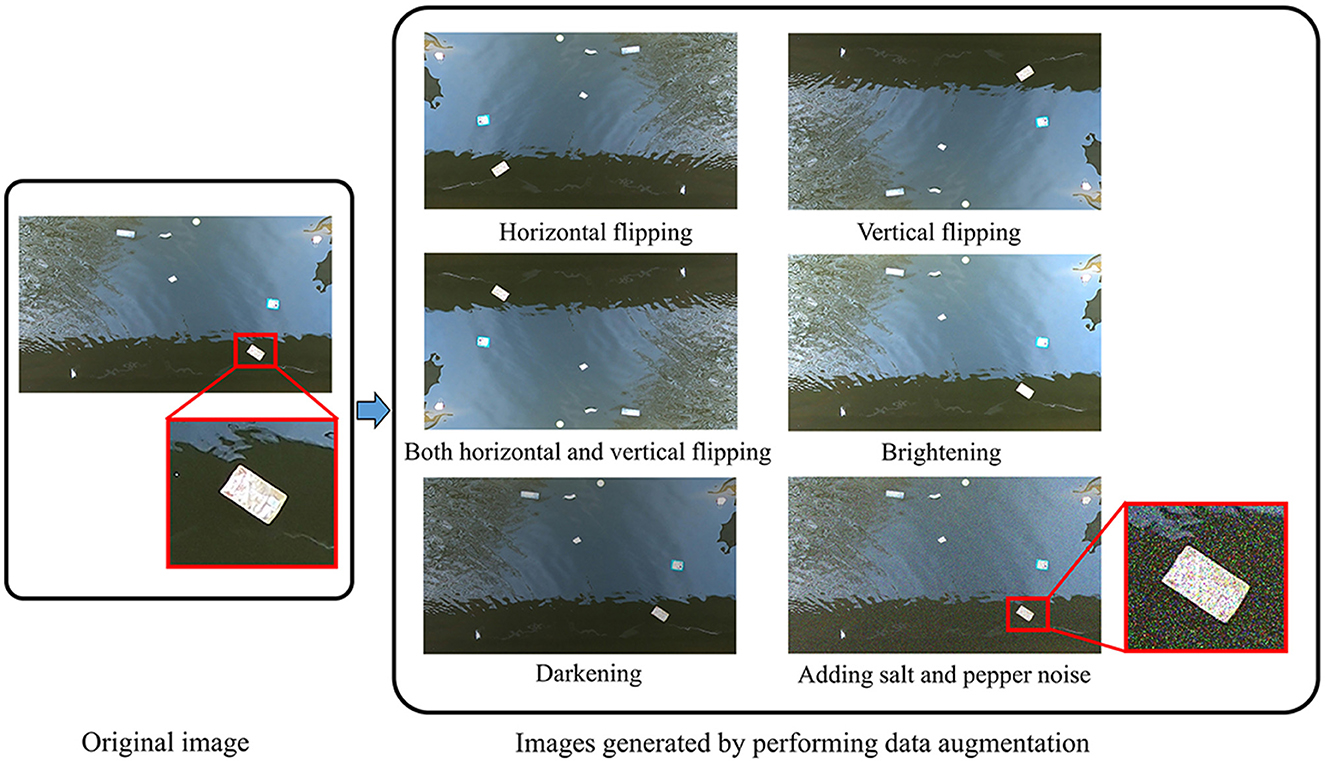
Figure 3. Examples of data augmentation techniques used. (Left) An original image; (Right) images generated by performing horizontal flipping (top row, left), vertical flipping (top row, right), combined horizontal and vertical flipping (middle row, left), brightening (middle row, right), darkening (bottom row, left), and adding salt and pepper noise (bottom row, right).
3.4 Generalization capability
In this study, we tested the generalization capability of the trained models to different types of litter from various device setups (camera height/angle). We trained the models on images of canal litter from the 2.7 m/0° setup, and evaluated their out-of-sample performances on images of household waste from 2.7 m/0°, 2.7 m/45°, 4 m/0°, and 4 m/45° setups, respectively. Next, we applied three methods to improve the models' generalization capability, which are (1) using the best DA method emerging from our study on data augmentation; (2) adding new images to the training dataset (ANI); and (3) using the best DA method after adding new images to the training dataset (ANI-DA). All the new images added to the original training dataset still featured canal litter, but were captured from 2.7 m/45°, 4 m/0°, and 4 m/45° setups to better represent the out-of-sample distributions.
4 Experiments
In this study, we conducted three experiments to: (1) compare the performances of the five DL architectures, with and without transfer learning; (2) assess the performance boost of the five different DA approaches on the two best performing models from (1); and (3) evaluate and improve the generalization capability of the best models for unseen litter (e.g., household waste) and different device setups. Figure 4 shows the flowchart of three experiments.
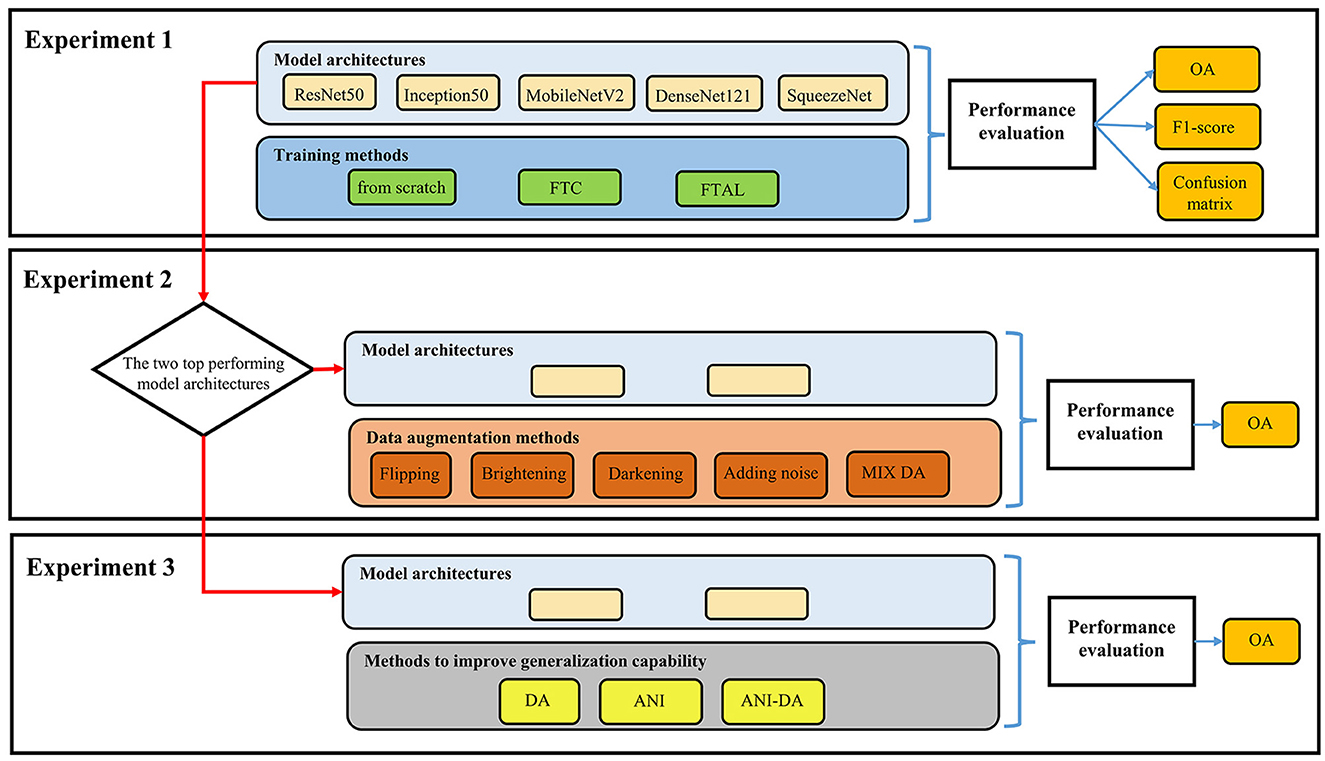
Figure 4. The flowchart of three experiments. FTC, fine-tuning the classifier alone; FTAL, fine-tuning all layers; OA, overall accuracy; MIX DA, mixing all the four aforementioned techniques; DA, data augmentation; ANI, adding new images to original training dataset; ANI-DA, adding new images and performing DA.
4.1 Experiment 1: architectures comparison and transfer learning
With the first experiment we compared the detection performances of the five chosen DL architectures (i.e., ResNet, InceptionV3, DenseNet121, MobileNetV2, and SqueezeNet) and we assessed the benefits of the FTC and FTAL strategies described in Section 3.2. We used a shuffled subset of 4,005 images with canal litter for model development, subdivided into training, validation, and test datasets following the 80/10/10 split detailed in Table 2. Ratios between the different classes is kept constant across the different datasets. All images have been recorded from the action cameras with the 2.7 m/0° setup.
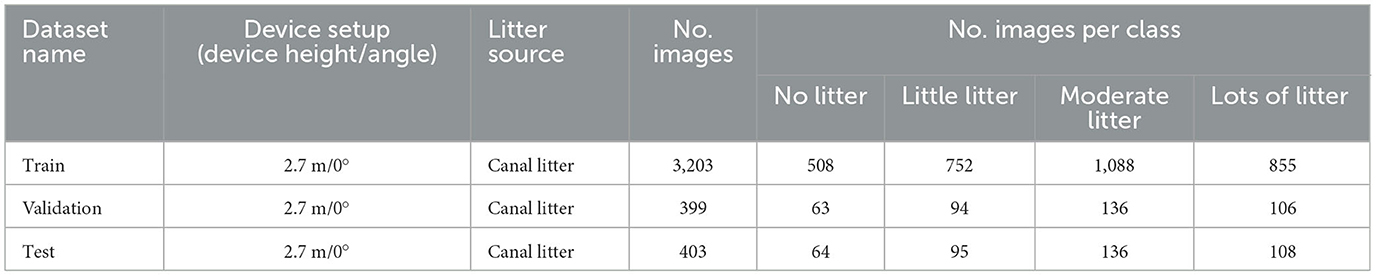
Table 2. Datasets for Experiment 1.
4.2 Experiment 2: data augmentation techniques
We applied the five different DA techniques in Section 3.3 to the two top performing baseline models emerging from Experiment 1. These were retrained on the augmented datasets yielded by applying each DA techniques, resulting in 12,812 or 41,639 training images (MIX DA). For a fair comparison against the baselines, we used the same Validation and Test datasets of Experiment 1 (see Table 2).
4.3 Experiment 3: generalization capability
To assess the generalization capability to unseen litter items and different device setups, we evaluated the two selected baseline models on the four test datasets reported in Table 3. These datasets include camera images of household waste (different from the canal litter present in the original training dataset), filmed with 2.7 m/0°, 2.7 m/45°, 4 m/0°, and 4 m/45° device setups, respectively. We performed a misclassification analysis for the best performing baseline model to better understand which features in the test datasets posed challenges to generalization. Next, we evaluated the effects of the methods proposed in Section 3.4 to improve the generalization capability. We implemented the ANI and ANI-DA methods by retraining the two baseline models on the TrainANI and TrainANI − DA datasets of Table 3, respectively. We created the TrainANI dataset by adding 1,523 images (4,726 total) of canal litter to the Train dataset of Experiment 1, from the three missing device setups (2.7 m/45°, 4.0 m/0°, and 4.0 m/45°). The TrainANI − DA dataset was created by performing DA on TrainANI, resulting in a total of 18,904 training images. We validated the models for both ANI and ANI-DA cases on the ValidationANI dataset, obtained by adding 188 images of canal litter to the Validation dataset of Experiment 1. We compared these models against the baselines of Experiment 1 and the best performing models with DA of Experiment 2.
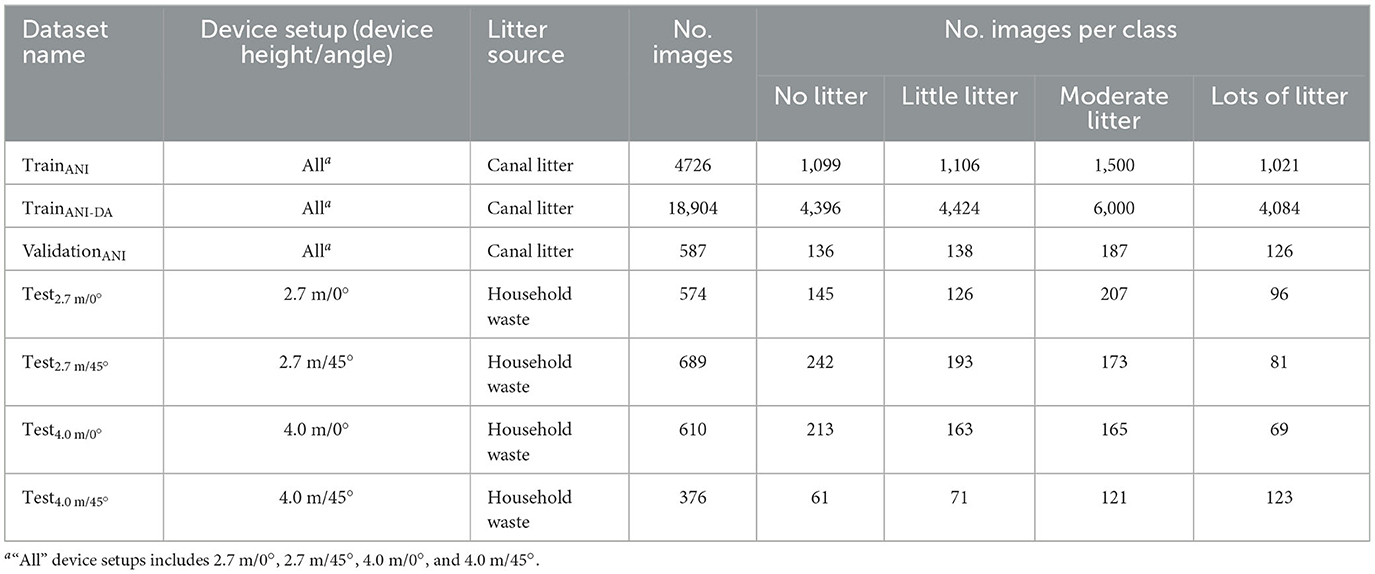
Table 3. Datasets for Experiment 3.
4.4 Implementation of deep learning architectures
We resized the RGB images from their original size of 1,980 × 1,080 × 3 to 224 × 224 × 3 pixels to match the input dimensions of the original pre-trained models. Similarly, we rescaled the input values from a range of 0 to 255 per pixel to a range of 0 to 1. After preliminary trials, we trained all models using a batch size of 16 for 100 epochs. To prevent overfitting, we selected the model parameters from the epoch with the highest validation accuracy. In Experiment 1, we compared five different learning rates (0.1, 0.01, 0.001, 0.0001, and 0.00001) for each model architecture, and only used the best learning rate in Experiments 2 and 3. We introduced class weights to the cross-entropy loss function used during training to address the slightly imbalanced datasets we created (Wolf et al., 2020). The weight of each class was calculated as the ratio of the total number of images to the number of images in that particular class.
To minimize the effect of randomization, we repeated the training 10 times for each model in all experiments. All the results reported in Section 5 are mean values calculated from these runs, unless we discuss the outcomes of misclassification analysis, which we conducted on the best performing models out of the 10 runs.
We implemented the DL architectures using the Python programming language (version 3.8.5) and the Keras DL framework (version 2.6.0). We used the implementations and pre-trained weights from tf.keras.applications for all architectures, except for SqueezeNet.1 Model development was performed on a local NVIDIA GeForce RTX 3090 GPU (24GB).
4.5 Performance evaluation
To evaluate model performances of floating litter detection, we used four metrics commonly employed in multi-class IC tasks: overall accuracy (OA), precision, recall, and F1-score (Jia et al., 2023). We used OA to summarize model performance across all classes. This metric measures the percentage of correctly identified images out of the total images in the dataset. It is calculated as follows:
where N is the total number of images; K represents the number of classes; and Ci, i denotes the number of images that are actually in class i and identified as such.
We used precision, recall and F1-score to assess the performances for each class. Precision for class i is written as follows:
where TPi (True Positive) represents the number of correctly classified images of class i; and FPi (False Positive) represents the number of images misclassified as class i.
Recall for class i is expressed as follows:
where FNi (False Negative) represents the number of images that are actually in class i but classified as other classes. Precision reflects how accurate is the model in identifying relevant samples. It identifies the percentage of correctly identified positive samples over the total identified positive samples. On the other hand, recall represents the model's ability to identify all relevant samples. It is the percentage of correctly identified positive samples over the total positive samples. F1-score combines the two metrics by computing their harmonic mean. It is expressed as follows:
5 Results and discussion
5.1 Experiment 1: architectures comparison and transfer learning
Table 4 reports the average training time and OA on the Test dataset for the five architectures trained from scratch or fine-tuned after transfer learning. In this table, we only reported the learning rate that yields the best average OA on the validation set for each architecture. The full evaluation of the five architectures with all tested learning rates can be found in Supplementary material. The FTAL method consistently outperforms the other methods regardless of the architecture. When using the FTAL method, we obtained OA ranging from 85.0 to 87.6% on the Test set. Training models from scratch performs slightly worse than the FTAL method, with OA ranging between 77.8 and 83.5%. The FTC method performs the worst, with OAs varying between 62.3 and 73.3% depending on the architecture. For example, switching from FTC to FTAL with ResNet50 yields a significant improvement of +22.7% in OA. Although less performing, the FTC method consistently takes the least training time, costing between 2 and 9 s for each training epoch. That is ~2 to 5 times faster than using the FTAL method or training the models from scratch. This is expected since training or fine-tuning the entire network takes significantly more time than fine-tuning the classifier alone.
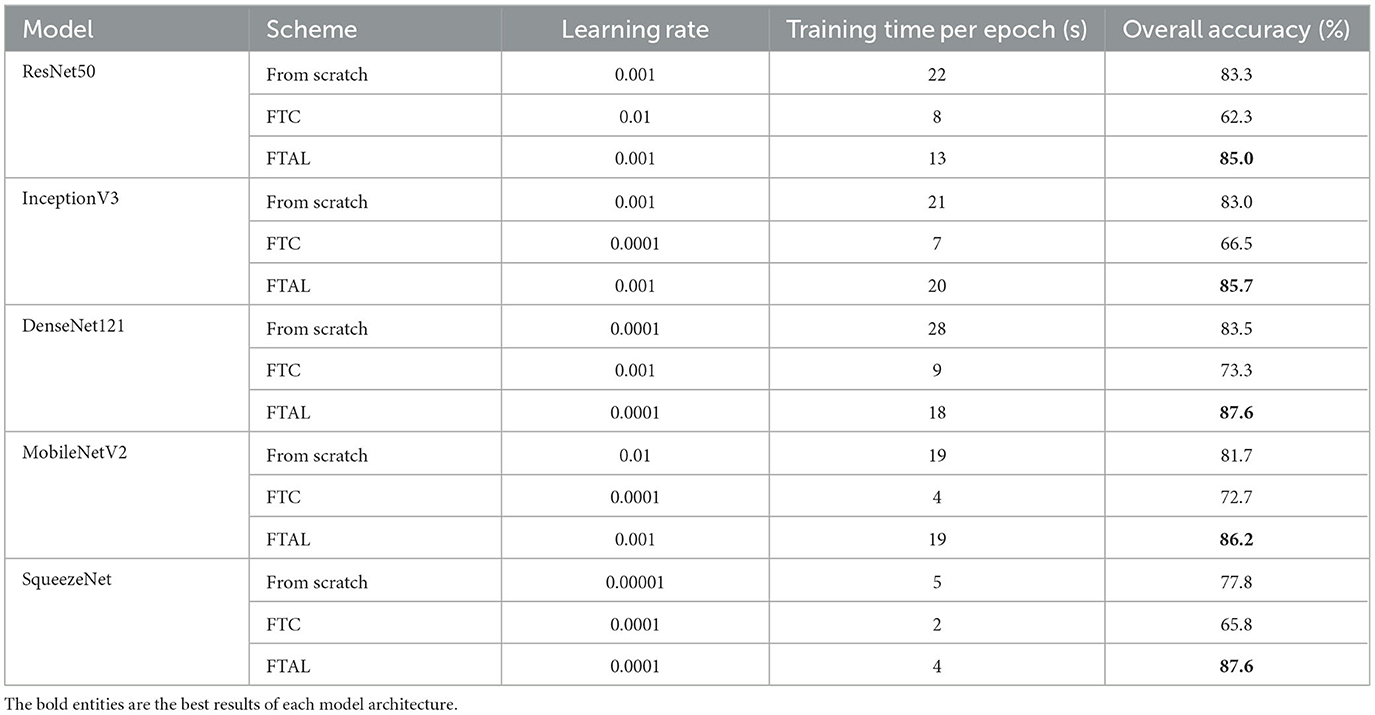
Table 4. Learning rate, training time, and overall accuracy of all architectures for Experiment 1.
These results suggest that, while the features learned from ImageNet may not fully transfer to the task of classifying floating litter, initializing model parameters with pre-trained weights on the ImageNet dataset provides a better starting point for the models than random initialization. Thus, the FTAL method may enable models to achieve better performance faster. This aligns with the findings of other studies demonstrating a decrease in the transferability of learned features when the base task (e.g., classification on ImageNet) differs significantly from the target task (Yosinski et al., 2014).
Our findings are similar to those reported by Marin et al. (2021) for a study on CNN architectures detecting underwater litter. The authors classified images into six classes: glass, metal, plastic, rubber, other trash, and no trash. Even for this case, the FTAL strategy proved more successful than resorting to FTC, with best performance on the test dataset of OA = 91.4% compared to 83.0%.
We found that DenseNet121 outperforms the other architectures, regardless of the the training procedure adopted, with a maximum OA of 87.6%. The superior performances of DenseNet121 may stem from the dense connectivity patterns in its architecture, which favors feature propagation and reuse across layers, while reducing the total number of trainable weights (Huang et al., 2017). Despite having only 1.2 M parameters, SqueezeNet also achieves the highest OA of 87.6%. Due to its size, SqueezeNet is the fastest to train, however its detection performance depends significantly on the training procedure adopted, with a difference of +21.8% between FTC and FTAL. SqueezeNet requires less trainable parameters to achieve high accuracy due to its innovative architecture that makes use of 1 × 1 filters (9X fewer parameters than common 3 × 3 filters) and “fire modules” (Iandola et al., 2016). These results might have practical implications for distributed monitoring of litter on edge computing devices (e.g., Raspberry Pi or other single-board computers connected to a camera), where litter recognition is performed locally using with limited resources (Liu et al., 2021).
Table 5 presents the F1-score per class for the five architectures using the FTAL method. Precision and recall can be found in Supplementary material. All models perform similarly across different classes, showing best performances for “no litter” or “lots of litter” with F1-scores of up to 0.98 and 0.89, respectively. The models show good but lower accuracy for the other two classes, with F1-scores ranging from 0.79 to 0.86. The features for these two intermediate classes may not be highly distinctive, leading to a higher probability of misclassification. For example, Table 6 shows the confusion matrix for DenseNet121 using FTAL. We observed a relatively high number of errors for images belonging to the “moderate litter” class, are sometimes confused with “little litter” (14 case) or “lots of litter” (5 case), resulting in the lowest F1-scores for this class across all architectures, ranging from 0.79 to 0.83.
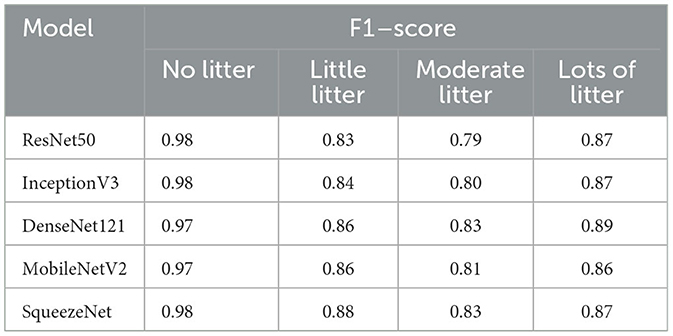
Table 5. F1-score per class of all architectures trained using the FTAL strategy for Experiment 1.
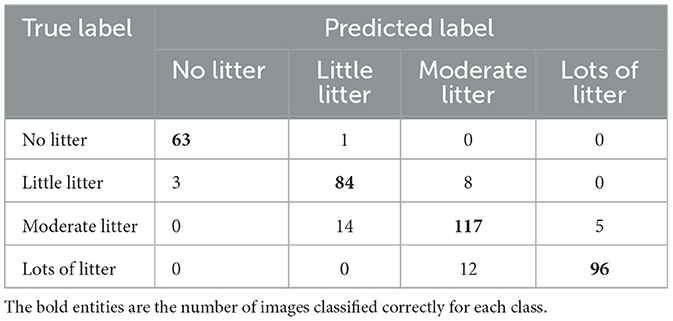
Table 6. Confusion matrix of the best performing DenseNet121 trained with the FTAL strategy for Experiment 1.
5.2 Experiment 2: data augmentation techniques
Figure 5 compares the average performance of the best configurations of SqueezeNet and DenseNet121 from Experiment 1 against the average performances obtained by retraining these baselines using the different DA techniques in Section 3.3. The baseline performance is indicated by a horizontal dashed line at OA = 87.6% since the performances on the Test dataset is the same for both models. The results show that the flipping technique is the most effective in improving model performances, with a significant improvement in OA (+2.0% for SqueezeNet and +4.1% for DenseNet121) compared to the baseline models. This confirms that flipping augmentation is recommended as it does not distort the features in the images with respect to the original label (Jia et al., 2023). The other techniques show a slight increase or decrease in OA (from −0.1 to +0.8%), possibly due to the excessive transformation of the original images (Shorten and Khoshgoftaar, 2019). Although using brightening and darkening techniques should increase model robustness to different lighting conditions, these techniques may not be as effective in this particular case since the original images in the TUD-GV dataset were taken in both sunny and cloudy weather. The MIX DA strategy results in a good increase in OA (+1.9% for SqueezeNet and +3.4% for DenseNet121), however, these gains are lower than those achieved by flipping alone. Additionally, the training times for MIX DA are approximately three times longer (see Supplementary material).
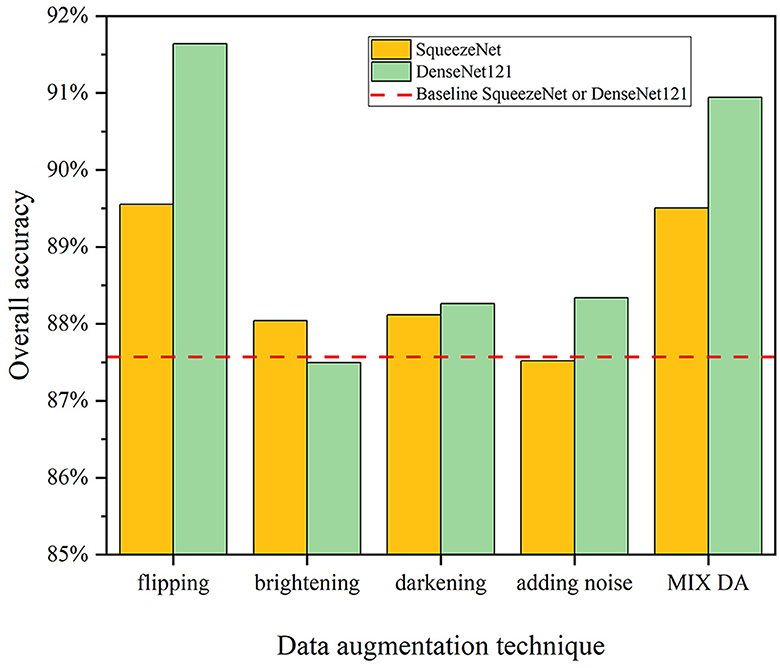
Figure 5. Performances of SqueezeNet and DenseNet121 using different DA techniques for Experiment 2. The horizontal dashed line represents the OA of the baseline models, trained without DA. DA techniques include (1) flipping, (2) brightening, (3) darkening, (4) adding noise, and (5) mixing the four above-mentioned techniques (MIX DA).
DenseNet121 outperforms SqueezeNet when using flipping or MIX DA techniques, with an increase in OA of +2.1 and +1.4%, respectively. The OA of DenseNet121 is also higher when using the other DA techniques, although the difference is not as significant. It is generally accepted that a more complex model, such as DenseNet121, can benefit more when trained on a sufficiently large dataset, as it has more capacity to learn and capture patterns in the data. In comparison, a lightweight model like SqueezeNet may not be able to fully take advantage of additional training data generated through DA (Zhu et al., 2016). Therefore, it may be necessary to increase model complexity in order to fully leverage the benefits of additional training data. However, the training times for DenseNet121 are five to six times longer than for SqueezeNet (see Supplementary material). This trade-off should be considered when choosing a model for a particular specific litter detection task.
5.3 Experiment 3: generalization capability
Figure 6 compares the out-of-sample generalization performances of the baseline models against that of the models modified using three approaches described in Section 3.4. We implemented DA and ANI-DA by applying flipping augmentation alone, due to its demonstrated effectiveness in Experiment 2. The results show that both SqueezeNet and DenseNet121 trained on data with canal litter captured with the 2.7 m/0° setup (i.e., Train dataset in Table 2) can generalize well to household waste litter under the same device setup (i.e., Test2.7m/0° of Table 3), achieving OA of 84.4 and 85.3%, respectively. Although the generalization capability in this case is already satisfactory, it can be further improved. Specifically, DenseNet121 models trained with DA and ANI-DA show significant increases is OA of +5.4 and +6.2%, respectively, while ANI alone does not provide a similar boost. Lesser improvements are also measured for SqueezeNet. Although ANI-DA performs the best, it requires the time-consuming and costly collection of new data. Therefore, simple flipping augmentation may be the most cost-effective method to improve the generalization capability under the same device setup.

Figure 6. Out-of-sample generalization performances of SqueezeNet (A) and DenseNet121 (B) on Experiment 3, featuring baseline models and models leveraging techniques for improved generalization. Comparison performed on datasets of four device setups (2.7 m/0°, 2.7 m/45°, 4 m/0°, and 4 m/45°) with household litter. DA, data augmentation; ANI, adding new images to original training dataset; ANI-DA, adding new images and performing DA.
The SqueezeNet and DenseNet121 baselines exhibit good performances on Test2.7m/45°, with OA of 90.7 and 83.8%, respectively. Overall, results are similar or better than for the simpler Test2.7m/0° because Test2.7m/45° consists exclusively of images taken in cloudy weather. Sunny weather images are harder to classify due to the presence of sun glints (Jakovljevic et al., 2020). The three approaches significantly improve the generalization capability of DenseNet121, with OA = 94.1% for ANI-DA. On the other hand, we could not improve the performances of SqueezeNet further, suggesting that this small architecture cannot incorporate larger amount of data effectively. Nonetheless, SqueezeNet still retains good generalization capability with OAs above 86.7%.
The generalization of the baseline models drops significantly for the more complex device setups, i.e., Test4m/0° and Test4m/45°. SqueezeNet achieves an OA of 69.8 and 63.1% on these test datasets, respectively; while DenseNet121 obtains an OA of 78.1 and 64.2%. To gain insight into the factors contributing to these poor performances, we conducted a qualitative inspection of 192 and 147 images misclassified by the best baseline SqueezeNet model. Figure 7 shows common errors, including (a) identifying sun glints as extra litter (126 cases in Test4m/0°), (b) undetected items of small size (41 and 79 cases in Test4m/0° and Test4m/45°, respectively), and (c) unseen objects during training (e.g., a PVC pipe and a wood stick, 40 cases in Test4m/45°). DL models are known to suffer from sun glints, changes in the scale and in the distribution of items (Singh and Davis, 2018; Jakovljevic et al., 2020; van Lieshout et al., 2020).
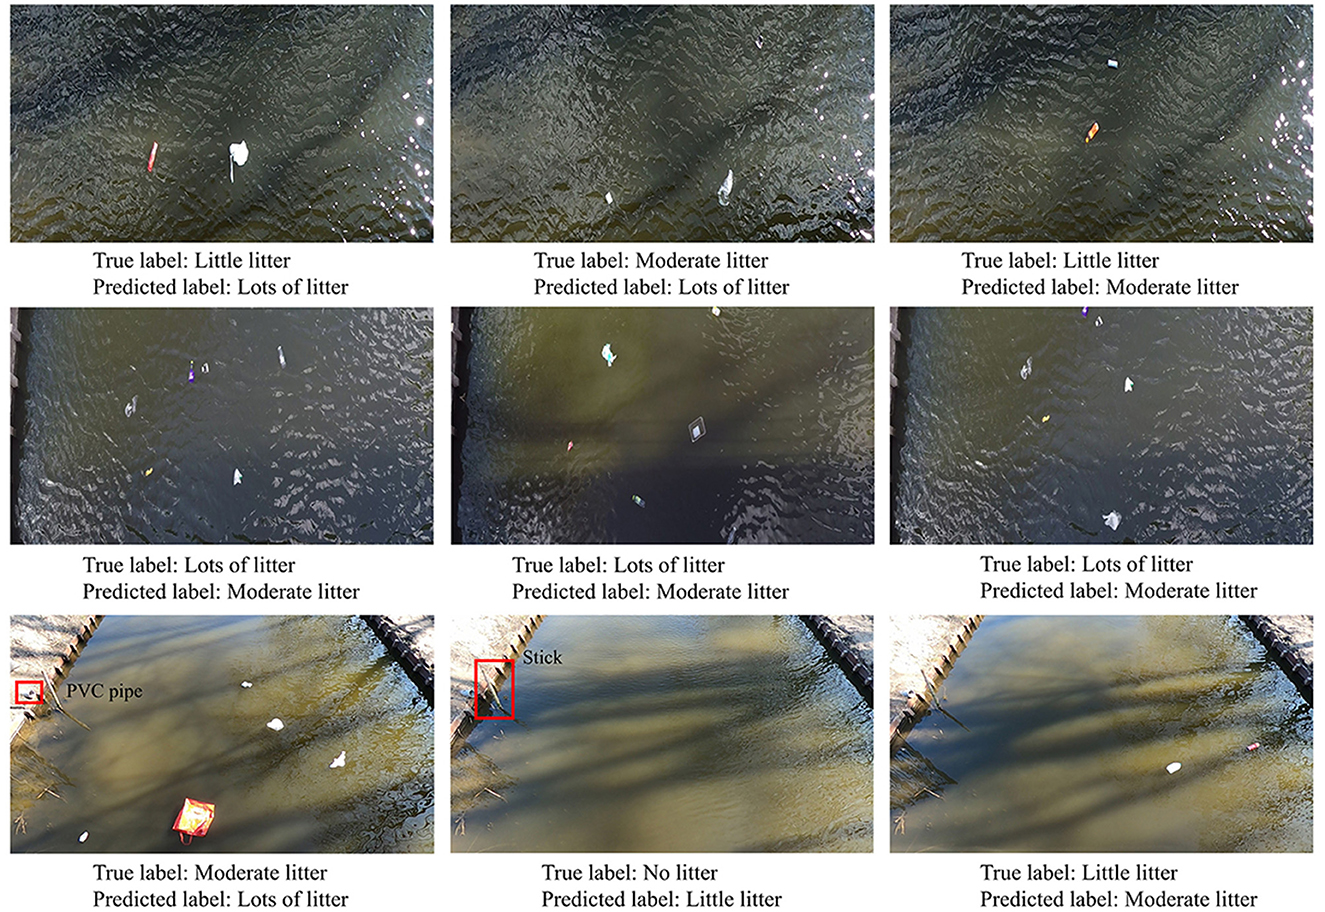
Figure 7. Common misclassified examples in the Test4m/0° and the Test4m/45° datasets for the best baseline SqueezeNet model. Common misclassification include identifying sun glints as litter, failure to detect small-sized litter, and detection of background objects or external items.
The ANI method outperforms simple flipping augmentation on these harder datasets, with improvements of around +11% for both architecture in each setup. While flipping grants significant increases of up to +9.4% in Test4m/0°, it fails to support generalization for the more complex Test4m/45°. This suggests that simple data augmentation fails to boost generalization when the out-of-sample distribution is significantly different from the training one (e.g., different items, camera heights, and viewing angle). In these cases, collecting new data from the new setup is necessary to achieve satisfactory performances. Performing DA after gathering new images can result in further improvements, as demonstrated in Test4m/0° for both SqueezeNet and DenseNet121 (i.e., OA of 87.2 and 93.4%, respectively) and in Test4m/45° for DenseNet121 (OA = 77.7%).
5.4 Limitations
We acknowledge some limitations in our dataset and approach that necessitate further developments for real-world applications. First, although the TUD-GV dataset features items collected from canals, the level of litter degradation does not fully represent the situation encountered in many real contexts. Second, the current research does not account for the interference of vegetation and natural debris, that are intrinsically present in real-world scenarios. Similarly, images gathered from our semi-controlled experiments in a stagnant canal—although representative of urban areas—do not account for the complexity of dynamic environments such as rivers and coastal areas where litter interaction with flow, waves, and other factors is commonplace. Third, the current dataset does not include images collected during nighttime, thus it cannot be used for developing models to detect and quantify the floating litter items during nighttime. Fourth, this study does not focus on maximizing model performance by pre-processing the raw input images before data augmentation. Tiling images into smaller patches (e.g., 224*224) will likely boost performances by retaining the original image quality (Wolf et al., 2020), although this would require relabeling all tiles. Lastly, real-world applications demand more sophisticated computer vision tasks than the image classification performed here. Object detection and image segmentation methods are preferred approaches to identify, quantify and track floating litter in water bodies from images or videos (Jia et al., 2023). In this regard, the TUD-GV dataset can be used to pretrain the CNN backbones of methods such as Faster R-CNN (van Lieshout et al., 2020) and Mask R-CNN (Deng et al., 2021), providing more meaningful context than ImageNet or other general purpose datasets. Therefore, the development of these models can benefit directly from the insights provided by this study.
6 Conclusions and future work
Supervised Deep Learning methods are increasingly used for automatic detection of floating litter in aquatic environments. These methods require large amounts of carefully labeled data to reach satisfactory performances and exhibit strong generalization capability. However, there is a major lack of available datasets for researchers and practitioners willing to develop and test their models. In this work, we introduced the “TU Delft-Green Village” (TUD-GV) dataset, a collection of almost 10,000 labeled images of different floating litter recorded from semi-controlled experiments on a small drainage canal in the TU Delft Campus, the Netherlands. We demonstrated the usefulness of our data by carrying out a thorough comparison of different DL architectures, transfer learning methods, data augmentation techniques, and approaches to improve out-of-sample generalization for unseen litter and device setups. The main findings of our work are as follows:
(1) DenseNet121 and SqueezeNet proves the most successful architectures thanks to their innovative designs that allow for efficient feature discovery for floating litter classification with limited trainable parameters.
(2) We obtained the highest accuracy by loading models pre-trained on ImageNet, replacing the classifier, and fine-tuning the entire network on floating litter images. The benefits of this approach in terms of detection performance outweigh the shorter training times required by fine-tuning the classifier alone. Transferring the convolutional base from ImageNet seems a better approach than training the models from scratch, at least for our experiments.
(3) We recommend flipping data augmentation (DA) to improve model detection performances at relatively low cost, since the additional images are easy to generate, and maintain high fidelity to the original labels while providing extra training information. On the other hand, brightening, darkening, and adding noise do not show a significant improvement in detecting floating litter.
(4) The trained models generalize well to similar conditions, such as detecting unseen litter items from images captured at the same height, but with different viewing angles (i.e., 45°). Flipping data augmentation may boost generalization performance in these circumstances, but it is insufficient when transferring to more complex scenarios (e.g., different camera heights and different viewing angle). We demonstrated that adding a limited amount of images from these new settings to the original training dataset can substantially improve generalization in these cases.
We believe the novel TUD-GV dataset is a valuable resource for the community. To overcome some of the limitations in our work, we aim to build on the released version by providing individual labels for each item as well as bounding boxes to perform object detection for better litter quantification. This should increase the usability of the TUD-GV dataset for real-world applications. Nonetheless, we encourage using the released dataset for pretraining the CNN backbones of models for object detection and image segmentation such as Faster-RCNN and Mask R-CNN (van Lieshout et al., 2020; Deng et al., 2021), especially for real-time detection of floating litter in videos. To accurately estimate litter fluxes, we need the information of the spatio-temporal variation of floating litter provided by real-time detection approaches. This can be realized by combining the CNNs with a tracker such as DeepSORT (Wojke et al., 2017). The number of such application is expected to increase in the future. Other explorations could focus on more advanced DA techniques (Jia et al., 2023). For instance, scaling and perspective skewing transformations may improve generalization for the most complex scenario featured in TUD-GV. This investigation should be paired with an in-depth analysis to evaluate the variation of litter detection performance with respect to item size and camera inclination. Multi-scale data augmentation can also improve generalization performances for applications using cameras with different resolutions.
Data availability statement
The code for this study is available on https://github.com/TianlongJia/deep_plastic. The “TU Delft-Green Village” dataset is available for download from Zenodo at https://doi.org/10.5281/zenodo.7636124.
Author contributions
TJ: Conceptualization, Data curation, Formal analysis, Funding acquisition, Methodology, Project administration, Software, Validation, Visualization, Writing—original draft, Writing—review & editing. AV: Conceptualization, Data curation, Formal analysis, Methodology, Software, Visualization, Writing—original draft, Writing—review & editing. RV: Conceptualization, Methodology, Supervision, Writing—review & editing, Resources. ZK: Funding acquisition, Supervision, Writing—review & editing. RT: Conceptualization, Formal analysis, Funding acquisition, Methodology, Project administration, Supervision, Writing—original draft, Writing—review & editing.
Funding
The author(s) declare financial support was received for the research, authorship, and/or publication of this article. This work was supported by China Scholarship Council (No. 202006160032) and the Directorate-General for Public Works and Water Management of The Netherlands (Rijkswaterstaat).
Conflict of interest
AV and RV were employed by Noria Sustainable Innovators.
The remaining authors declare that the research was conducted in the absence of any commercial or financial relationships that could be construed as a potential conflict of interest.
Publisher's note
All claims expressed in this article are solely those of the authors and do not necessarily represent those of their affiliated organizations, or those of the publisher, the editors and the reviewers. Any product that may be evaluated in this article, or claim that may be made by its manufacturer, is not guaranteed or endorsed by the publisher.
Supplementary material
The Supplementary Material for this article can be found online at: https://www.frontiersin.org/articles/10.3389/frwa.2023.1298465/full#supplementary-material
Footnotes
References
Azzeh, J., Zahran, B., and Alqadi, Z. (2018). Salt and pepper noise: effects and removal. Int. J. Inf. Visualiz. 2, 252–256. doi: 10.30630/joiv.2.4.151
Bellou, N., Gambardella, C., Karantzalos, K., Monteiro, J. G., Canning-Clode, J., Kemna, S., et al. (2021). Global assessment of innovative solutions to tackle marine litter. Nat. Sustain. 4, 516–524. doi: 10.1038/s41893-021-00726-2
Borrelle, S. B., Ringma, J., Law, K. L., Monnahan, C. C., Lebreton, L., McGivern, A., et al. (2020). Predicted growth in plastic waste exceeds efforts to mitigate plastic pollution. Science 369, 1515–1518. doi: 10.1126/science.aba3656
Deng, H., Ergu, D., Liu, F., Ma, B., and Cai, Y. (2021). An embeddable algorithm for automatic garbage detection based on complex marine environment. Sensors 21, 6391. doi: 10.3390/s21196391
Deng, J., Dong, W., Socher, R., Li, L.-J., Li, K., and Fei-Fei, L. (2009). “Imagenet: a large-scale hierarchical image database,” in 2009 IEEE Conference on Computer Vision and Pattern Recognition (Miami, FL: IEEE), 248–255.
Dris, R., Gasperi, J., Rocher, V., and Tassin, B. (2018). Synthetic and non-synthetic anthropogenic fibers in a river under the impact of paris megacity: Sampling methodological aspects and flux estimations. Sci. Total Environ. 618, 157–164. doi: 10.1016/j.scitotenv.2017.11.009
Everingham, M., Van Gool, L., Williams, C. K., Winn, J., and Zisserman, A. (2010). The pascal visual object classes (voc) challenge. Int. J. Comput. Vis. 88, 303–338. doi: 10.1007/s11263-009-0275-4
Garcia-Garin, O., Monleón-Getino, T., López-Brosa, P., Borrell, A., Aguilar, A., Borja-Robalino, R., et al. (2021). Automatic detection and quantification of floating marine macro-litter in aerial images: Introducing a novel deep learning approach connected to a web application in R. Environ. Pollut. 273, 116490. doi: 10.1016/j.envpol.2021.116490
Gnann, N., Baschek, B., and Ternes, T. (2022). Close-range remote sensing-based detection and identification of macroplastics on water assisted by artificial intelligence: a review. Water Res. 222, 118902. doi: 10.1016/j.watres.2022.118902
Guo, Y., Li, Y., Wang, L., and Rosing, T. (2020). “Adafilter: adaptive filter fine-tuning for deep transfer learning,” in Proceedings of the AAAI Conference on Artificial Intelligence, Vol. 34 (New York, NY), 4060–4066.
Hadi, Z., Sulaiman, N., Halin, I. A., and Yunus, N. A. M. (2016). “Implementation of image enhancement techniques based on intel edison platform,” in 2016 1st International Conference on Information Technology, Information Systems and Electrical Engineering (ICITISEE) (Yogyakarta: IEEE), 17–20.
He, K., Zhang, X., Ren, S., and Sun, J. (2016). “Deep residual learning for image recognition,” in Proceedings of the IEEE Conference on Computer Vision and Pattern Recognition (Las Vegas, NV), 770–778.
Huang, G., Liu, Z., Van Der Maaten, L., and Weinberger, K. Q. (2017). “Densely connected convolutional networks,” in Proceedings of the IEEE Conference on Computer Vision and Pattern Recognition (Honolulu, HI), 4700–4708.
Iandola, F. N., Han, S., Moskewicz, M. W., Ashraf, K., Dally, W. J., and Keutzer, K. (2016). Squeezenet: Alexnet-level accuracy with 50x fewer parameters and <0.5 mb model size. arXiv [preprint]. doi: 10.48550/arXiv.1602.07360
Jakovljevic, G., Govedarica, M., and Alvarez-Taboada, F. (2020). A deep learning model for automatic plastic mapping using unmanned aerial vehicle (uav) data. Remote Sens. 12, 1515. doi: 10.3390/rs12091515
Jia, T., Kapelan, Z., de Vries, R., Vriend, P., Peereboom, E. C., Okkerman, I., et al. (2023). Deep learning for detecting macroplastic litter in water bodies: a review. Water Res. 231, 119632. doi: 10.1016/j.watres.2023.119632
Lebreton, L., Slat, B., Ferrari, F., Sainte-Rose, B., Aitken, J., Marthouse, R., et al. (2018). Evidence that the great pacific garbage patch is rapidly accumulating plastic. Sci. Rep. 8, 1–15. doi: 10.1038/s41598-018-22939-w
Lechner, A., Keckeis, H., Lumesberger-Loisl, F., Zens, B., Krusch, R., Tritthart, M., et al. (2014). The danube so colourful: a potpourri of plastic litter outnumbers fish larvae in europe's second largest river. Environ. Pollut. 188, 177–181. doi: 10.1016/j.envpol.2014.02.006
LeCun, Y., Bengio, Y., and Hinton, G. (2015). Deep learning. Nature 521, 436–444. doi: 10.1038/nature14539
Lin, F., Hou, T., Jin, Q., and You, A. (2021). Improved yolo based detection algorithm for floating debris in waterway. Entropy 23, 1111. doi: 10.3390/e23091111
Lin, T.-Y., Maire, M., Belongie, S., Hays, J., Perona, P., Ramanan, D., et al. (2014). “Microsoft coco: common objects in context,” in European Conference on Computer Vision (Zurich: Springer), 740–755.
Liu, G., Shi, H., Kiani, A., Khreishah, A., Lee, J., Ansari, N., et al. (2021). Smart traffic monitoring system using computer vision and edge computing. IEEE Transact. Intell. Transport. Syst. 23, 12027–12038. doi: 10.1109/TITS.2021.3109481
Maharjan, N., Miyazaki, H., Pati, B. M., Dailey, M. N., Shrestha, S., and Nakamura, T. (2022). Detection of river plastic using uav sensor data and deep learning. Remote Sens. 14, 3049. doi: 10.3390/rs14133049
Marin, I., Mladenović, S., Gotovac, S., and Zaharija, G. (2021). Deep-feature-based approach to marine debris classification. Appl. Sci. 11, 5644. doi: 10.3390/app11125644
Meijer, L. J., van Emmerik, T., van der Ent, R., Schmidt, C., and Lebreton, L. (2021). More than 1000 rivers account for 80% of global riverine plastic emissions into the ocean. Sci. Adv. 7, eaaz5803. doi: 10.1126/sciadv.aaz5803
Pan, S. J., and Yang, Q. (2009). A survey on transfer learning. IEEE Trans. Knowl. Data Eng. 22, 1345–1359. doi: 10.1109/TKDE.2009.191
Panwar, H., Gupta, P., Siddiqui, M. K., Morales-Menendez, R., Bhardwaj, P., Sharma, S., et al. (2020). Aquavision: automating the detection of waste in water bodies using deep transfer learning. Case Studi. Chem. Environ. Eng. 2, 100026. doi: 10.1016/j.cscee.2020.100026
Putra, F. F., and Prabowo, Y. D. (2021). Low resource deep learning to detect waste intensity in the river flow. Bull. Elect. Eng. Inf. 10, 2724–2732. doi: 10.11591/eei.v10i5.3062
Recht, B., Roelofs, R., Schmidt, L., and Shankar, V. (2018). Do cifar-10 classifiers generalize to cifar-10? arXiv [preprint]. doi: 10.48550/arXiv.1806.00451
Sandler, M., Howard, A., Zhu, M., Zhmoginov, A., and Chen, L.-C. (2018). “Mobilenetv2: inverted residuals and linear bottlenecks,” in Proceedings of the IEEE Conference on Computer Vision and Pattern Recognition (Salt Lake City, UT), 4510–4520.
Shorten, C., and Khoshgoftaar, T. M. (2019). A survey on image data augmentation for deep learning. J. Big Data 6, 1–48. doi: 10.1186/s40537-019-0197-0
Singh, B., and Davis, L. S. (2018). “An analysis of scale invariance in object detection snip,” in Proceedings of the IEEE Conference on Computer Vision and Pattern Recognition (Salt Lake City, UT), 3578–3587.
Subramanian, M., Shanmugavadivel, K., and Nandhini, P. (2022). On fine-tuning deep learning models using transfer learning and hyper-parameters optimization for disease identification in maize leaves. Neural Comp. Appl. 34, 1–18. doi: 10.1007/s00521-022-07246-w
Szegedy, C., Vanhoucke, V., Ioffe, S., Shlens, J., and Wojna, Z. (2016). “Rethinking the inception architecture for computer vision,” in Proceedings of the IEEE Conference on Computer Vision and Pattern Recognition (Las Vegas, NV), 2818–2826.
Tasseron, P., Begemann, F., Joosse, N., van der Ploeg, M., van Driel, J., and van Emmerik, T. (2023). Amsterdam urban water system as entry point of river plastic pollution. Environ. Sci. Pollut. Res. 1–10. doi: 10.1007/s11356-023-26566-5
Tharani, M., Amin, A. W., Rasool, F., Maaz, M., Taj, M., and Muhammad, A. (2021). “Trash detection on water channels,” in International Conference on Neural Information Processing (Sanur; Bali: Springer), 379–389.
Tomas, J. P. Q., Celis, M. N. D., Chan, B. T. K., and Flore, J. A. (2022). “Trash detection for computer vision using scaled-yolov4 on water surface,” in The 11th International Conference on Informatics, Environment, Energy and Applications (Xi'an), 1–8.
van Calcar, C. V., and van Emmerik, T. V. (2019). Abundance of plastic debris across european and asian rivers. Environ. Res. Lett. 14, 124051. doi: 10.1088/1748-9326/ab5468
van der Walt, S., Sch'́onberger, J. L., Nunez-Iglesias, J., Boulogne, F., Warner, J. D., Yager, N., et al. (2014). scikit-image: image processing in python. PeerJ 2, e453. doi: 10.7717/peerj.453
van Emmerik, T., Kieu-Le, T.-C., Loozen, M., van Oeveren, K., Strady, E., Bui, X.-T., et al. (2018). A methodology to characterize riverine macroplastic emission into the ocean. Front. Mar. Sci. 5, 372. doi: 10.3389/fmars.2018.00372
van Emmerik, T., Mellink, Y., Hauk, R., Waldschläger, K., and Schreyers, L. (2022). Rivers as plastic reservoirs. Front. Water 3, 212. doi: 10.3389/frwa.2021.786936
van Emmerik, T., Seibert, J., Strobl, B., Etter, S., Den Oudendammer, T., Rutten, M., et al. (2020). Crowd-based observations of riverine macroplastic pollution. Front. Earth Sci. 8, 298. doi: 10.3389/feart.2020.00298
van Lieshout, C., van Oeveren, K., van Emmerik, T., and Postma, E. (2020). Automated river plastic monitoring using deep learning and cameras. Earth Space Sci. 7, e2019EA000960. doi: 10.1029/2019EA000960
Weideman, E. A., Perold, V., and Ryan, P. G. (2020). Limited long-distance transport of plastic pollution by the orange-vaal river system, south africa. Sci. Total Environ. 727, 138653. doi: 10.1016/j.scitotenv.2020.138653
Wojke, N., Bewley, A., and Paulus, D. (2017). “Simple online and realtime tracking with a deep association metric,” in 2017 IEEE International Conference on Image Processing (ICIP) (Beijing: IEEE), 3645–3649.
Wolf, M., van den Berg, K., Garaba, S. P., Gnann, N., Sattler, K., Stahl, F., et al. (2020). Machine learning for aquatic plastic litter detection, classification and quantification (aplastic-q). Environ. Res. Lett. 15, 114042. doi: 10.1088/1748-9326/abbd01
Yosinski, J., Clune, J., Bengio, Y., and Lipson, H. (2014). How transferable are features in deep neural networks? Adv. Neural Inf. Process. Syst. 27, 3220–3228. doi: 10.48550/arXiv.1411.1792
Keywords: artificial intelligence, computer vision, image classification, environmental monitoring, pollution, plastics
Citation: Jia T, Vallendar AJ, de Vries R, Kapelan Z and Taormina R (2023) Advancing deep learning-based detection of floating litter using a novel open dataset. Front. Water 5:1298465. doi: 10.3389/frwa.2023.1298465
Received: 21 September 2023; Accepted: 14 November 2023;
Published: 06 December 2023.
Edited by:
Guangtao Fu, University of Exeter, United KingdomReviewed by:
Mohamed ElSaadani, University of Louisiana at Lafayette, United StatesSalim Heddam, University of Skikda, Algeria
Copyright © 2023 Jia, Vallendar, de Vries, Kapelan and Taormina. This is an open-access article distributed under the terms of the Creative Commons Attribution License (CC BY). The use, distribution or reproduction in other forums is permitted, provided the original author(s) and the copyright owner(s) are credited and that the original publication in this journal is cited, in accordance with accepted academic practice. No use, distribution or reproduction is permitted which does not comply with these terms.
*Correspondence: Tianlong Jia, dC5qaWFAdHVkZWxmdC5ubA==
†These authors have contributed equally to this work and share first authorship