
94% of researchers rate our articles as excellent or good
Learn more about the work of our research integrity team to safeguard the quality of each article we publish.
Find out more
ORIGINAL RESEARCH article
Front. Water, 12 May 2023
Sec. Environmental Water Quality
Volume 5 - 2023 | https://doi.org/10.3389/frwa.2023.1148379
This article is part of the Research TopicPlastics Pollution in Water Environments: Occurrence, Transport, Fate, and BehaviourView all 3 articles
 Nimitha Choran
 Banu Örmeci*
Microplastics (MPs) are emerging contaminants that have recently gained global attention. Current identification and quantification methods are known to be time-consuming, labor-intensive, and lack consensus on protocol standardization. This study explored the potential of micro-flow imaging (MFI) technology for rapid and in-situ identification and enumeration of MPs in water using two (2) MFI-based particle counters. Advantages, limitations, and recommendations for using MFI for MPs analysis were discussed. MPs with diverse physical (i.e., microbeads, fragments, fibers, and films) and surface (i.e., reflectivity, microporosity, color) characteristics were analyzed to understand the detection capabilities and limitations of MFI technology. Results demonstrated that MFI effectively automates most manually obtained particle features, such as size, color, object intensity and shape descriptors. It imparts consistency and reduces the subjective nature of results, thus enabling reliable comparison of the generated data. The particles can be further categorized based on their circularity and aspect ratio providing further insight into the shape and potential erosion of MPs in the environment. Transparent particles, often missed with other techniques such as microscopy, were detected by the MFI technology. The ability to assign particle IDs to MPs was an important advantage of the MFI technology that enabled the further investigation of selected MPs of interest. The limitations of the MFI technology were apparent in samples with high particle concentrations, with reflective MPs, and in the presence of bubbles. The color of the background against which the image was captured also influenced the detection accuracy. Procedural modifications during sample analysis and improvements in image analysis can assist in overcoming these challenges. MFI requires minimal sample preparation and gives real-time imaging data, making it a prime candidate for field monitoring in surface water systems in addition to laboratory analysis. With the potential application of machine learning and similar developments in the future, MFI-based particle counters are well-positioned to meet an important need in in-flow and real-time identification and enumeration of MPs.
Microplastics (MPs) pollution is a global concern and gaining interest due to its potential implications for all ecosystems. The presence of MPs is felt across all spheres of life, ranging from the air we breathe (Gasperi et al., 2018) to remote areas with virtually no human activity (Bergmann et al., 2017). MPs are also reported in drinking water, suggesting that water treatment processes do not completely remove this emerging pollutant (Eerkes-Medrano et al., 2019).
MPs have vast implications for the aquatic ecosystem (Foley et al., 2018) and may potentially harm humans. The ubiquitous nature of MPs increases their bioavailability to aquatic species and trophic transfer to humans (Wang et al., 2019). Although adequate evidence about the risk associated with human exposure is yet to be established, their potential effects, such as neurotoxicity and immune dysfunction, cannot be entirely ruled out (Prata et al., 2020). Therefore, there is a growing need for technologies that help monitor MPs in drinking water and surface waters.
Several countries around the globe are undertaking measures to tackle the issue of MPs, such as banning microbeads in cosmetics, one-time-use plastics, and limiting unnecessary packaging (Government of the United States of America, 2015; United Nations Environment Programme, 2018; ECCC, 2022). European Union provisionally approved routine monitoring of drinking water for MPs (European Union, 2020), highlighting the concerns for not only the environment but also human health. At present, the identification and detection of MPs are still in their infancy, lacking standardization and consistency. Standardization of procedures is key to developing regulatory policies and monitoring MPs (Yusuf et al., 2022). In the past decade, numerous methods have been developed to detect MPs quantitatively and qualitatively. The first step usually involves isolating the MPs from the sample. Studies have used either chemical agents (i.e., acids, alkali, peroxide, enzymes) to digest the organics (Li et al., 2018; Pivokonsky et al., 2018; Olesen et al., 2019; Uurasjärvi et al., 2020) and/or flotation agents (i.e., NaCl, ZnCl2, NaI, oil) to separate them (Lahens et al., 2018; Rodrigues et al., 2018; Chaudhari and Samnani, 2022). Once the MPs are separated from the matrix, they are further analyzed to quantify and characterize the isolated particles chemically and physically. Physical characterization involves defining the morphological features, while chemical characterization examines the composition and structure. Chemical characterization is conducted using both non-destructive and destructive techniques. Non-destructive techniques include FTIR and Raman spectroscopy (Harrison et al., 2012; Leoni et al., 2021), while destructive techniques include GC-MS, pyrolysis-GC-MS, and thermal extraction desorption-GC-MS (Hendrickson et al., 2018; Sorolla-Rosario et al., 2023). Spectroscopic techniques require samples to be free of any impurities hindering the polymer identity, including the IR active water. Chromatographic methods can handle only a small amount of particles per run, and the database is limited to a few polymers to match with (Li et al., 2018).
Visual identification is a cheap, rapid, and easy way to identify larger MPs (1 mm to 5 mm) using physical attributes such as size, shape, and color. These features are also vital for ecotoxicological studies and the ingestion patterns in the aquatic ecosystem (Zarfl, 2019). Although the absence in the sample cannot be ascertained as the chances of missing the smaller MPs are higher, it is a simple way of identification that only requires short-term training (Xiong et al., 2019). Microscopy is commonly used to aid the visual identification of MPs utilizing enhanced surface morphology and structure details through magnified images (Shim et al., 2017). The accuracy of this technique decreases with smaller fractions, particularly with MPs of no distinctive color and shape (Käppler et al., 2015; Song et al., 2015). Simple light microscopy is adequate for detecting large MPs; however, it is time-consuming and sometimes inconclusive due to the limitations of light microscopy. Scanning electron microscopy (SEM) has been used in some studies combined with energy-dispersive X-ray spectroscopy (EDS) for MPs identification. In addition to being expensive, SEM and EDS require extensive sample preparation placing a cap on the number of samples that can be analyzed in a given time (Vianello et al., 2013; Shim et al., 2017).
Most current protocols require elaborate sample preparation steps, making the process time-consuming and tedious (Huppertsberg and Knepper, 2018). Conversely, monitoring approaches require time and cost-effective techniques while maintaining accuracy as they deal with large samples in short periods (Hengstmann and Fischer, 2019). Therefore, the currently available methods and technologies are generally suitable for laboratory research rather than field measurements.
Micro-flow imaging (MFI) is a continuous-flow microscopy technique employed in some particle counters to quantify the particles and record their physical properties. Numerous industries, including pharmaceutical and petrochemical industries and water treatment plants, have employed in-line particle counters for quality control. Light obscuration, flow microscopy, and the Coulter principle are the most used approaches to analyze and classify particles larger than 2 μm. Unlike flow imaging technology, light obscuration and Coulter counters only approximate the size of the particles without insight into morphological information, such as their shape (Demeule et al., 2010). MFI is also more responsive than light obscuration toward transparent objects as well as samples with a reduced difference in refractive index between the media and particle of interest (Huang et al., 2009; Demeule et al., 2010; Zölls et al., 2013a).
Flow-imaging particle counters capture successive bright-field images when the sample passes through a flow cell and analyze a wide range of particle properties such as number, size, length, shape, and opaqueness using image analysis software. A digital camera with an extended depth field and ample magnification is utilized for this purpose (Sharma et al., 2010; Ripple and DeRose, 2018). Coagulation-flocculation studies (Ball et al., 2011) and differentiating silicone oil droplets from protein particles (Sharma et al., 2009) are a few of the common applications of this technology. With no sample preparation, MFI directly analyses the liquid and categorizes the particles based on their morphological features along with the data on particle distribution. It also has lower maintenance requirements and provides more frequent measurements (Højris et al., 2016; Koppanen et al., 2022), making it an ideal candidate for in-situ monitoring of water samples.
This study explored the potential of MFI technology to quantify and classify MPs in water with an emphasis on in-situ application and identified the advantages, limitations, and prospects. Two (2) MFI-based particle counters (PC1 and PC2) were evaluated to understand the detection capabilities using MPs with different physical characteristics, color, shape, size, and surface reflectivity. Filtered surface water and distilled water spiked with polystyrene microbeads (3.2 μm and 25 μm) were used for the experiments in PC1. Fibers and fragments of different colors and transparent films and fragments with reflective surfaces were used in PC2 to discern the identification capabilities. The study focused primarily on the ability of MFI technology to detect, quantify and categorize MPs using their morphological features in a flow-through system without any sample preparation and also identified areas of improvement for more sensitive testing. MFI-based MP quantification and identification technology, with some further developments, would be useful for laboratory and field testing, provide results in real-time, and could be employed by researchers and non-experts such as citizen scientists.
Two (2) particle counters with MFI capability were used in this study.
This is a well-established instrument that has been in the market for 20 years. The sample flows through a vertical flow cell (Figure 1A), where a segment is illuminated, and an enlarged image is captured using a DPA camera. The software assesses each captured frame to define suspended particles' physical characteristics. The images are black and white, and the data generated can be exported in various formats and graphically represented with trend charts, scatter plots, and histograms. DPA4100 particle analyzer offers two (2) magnification settings: “high” and “low”. Each set point requires a different flow cell and hardware configuration for optimal performance (see Supplementary Table S1).
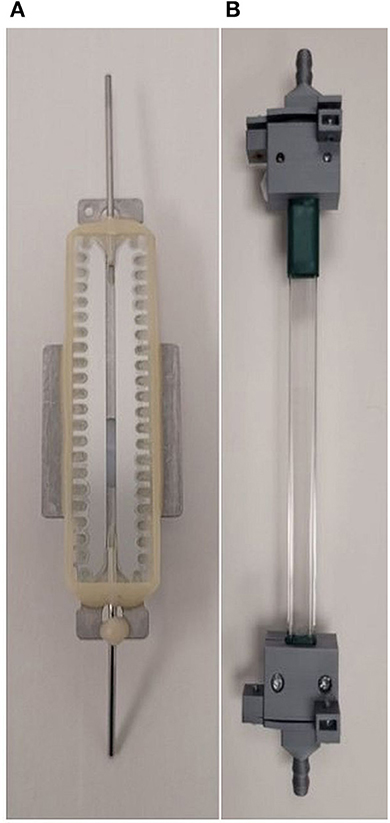
Figure 1. (A) Flow cell of PC1 (B) flow tube of PC2.
This recently developed instrument was exclusively built for MPs research and monitoring. It is a 3-D printed prototype that is compact and can be easily assembled and transported, making it ideal for field use. The sample flows through a horizontal flow cell of a rectangular cross-section. A color camera captures images in the flow cell (Figure 1B) illuminated against a black background. Although the inlet has a larger diameter of 7 mm, the pump connections have a smaller diameter of 4.3 mm, thus limiting the particle size. A peristaltic pump is used to intake the samples, and the user can adjust its speed using the software.
The particle counters provide information on the quantity and morphological characteristics of the samples. Their software allows selecting the bin size of interest and provides graphical representations of the measured data. Table 1 shows the parameters that are computed by PC1 and PC2. In PC1, the user can set the sample volume to be analyzed, while the analysis time can be customized in PC2. There is the flexibility of setting any value by the user, and PC1 offers the choice of offsetting some initial designated volume from the analysis. Effective circular diameter (ECD) and circularity values of the detected particles are not readily accessible in PC2, but they can be computed by applying simple mathematical operations to the available data. PC1 also measures the feret diameter and object intensity of the particles analyzed. Feret diameter is defined as the distance between the two farthest points on the projected area of the particle or can be referred to as the maximum diameter (DraŽić et al., 2016). Object intensity is a measure of the porosity of the particles detected, and the instrument computes the mean, maximum and minimum object intensities. Intensity is related to the porosity of the particle and assumes a value between 0 and 255. Values equal to or greater than 255 are identified as the carrier medium, in this case, water. The device detects those that fall below 255 as particles.
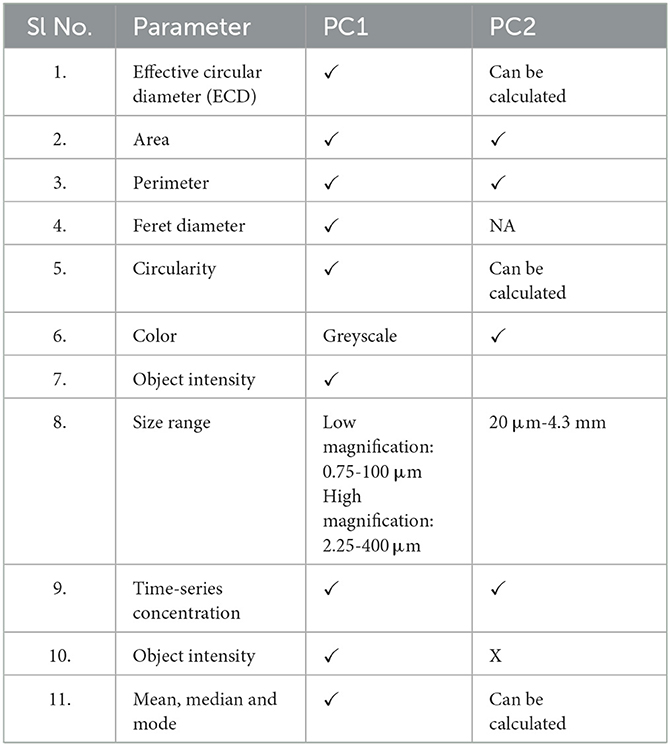
Table 1. Parameters computed by the software in each particle counter.
Since PC1 is limited to smaller size particles due to the width of the flow cell (100 μm and 400 μm depending on the flow cell type, Supplementary Table S1), laboratory-grade polystyrene beads were used for the experiment. The samples were run in a low magnification setting with a flow cell of an upper limit of 400 μm (Model no. BP-4100-FC-400-U). Polystyrene latex particles (Thermo Scientific, California, USA) of sizes 3.2 μm and 25 μm (see Table 2 for properties) were used for the experiments. In this experiment, surface water was spiked with MPs (polystyrene microbeads) to evaluate the detecting capabilities of the device. 20 μL of the latex solution was diluted to 25 mL using distilled water, and 10 mL of this solution was used for sample analysis. Surface water was obtained from the Rideau River in Ottawa, Ontario and filtered through a 53 μm stainless steel sieve (Endecotts Ltd, London, England) before use. 10 mL of the filtered surface water was used to run the unspiked sample. For the spiked sample, 2 mL of the diluted MPs sample was mixed with 8 mL of the filtered surface water. PC1 comes with a mixing apparatus and the samples are mixed before detection.

Table 2. Properties of the polystyrene latex particles.
Four (4) MP types with varying physical characteristics were obtained from post-consumer products (Table 3). Polymer type was not the focus of the current study, but they were analyzed using ATR-FTIR to ensure they were plastics. Each MPs was shredded into small pieces using stainless steel scissors to reduce the size to the MP range. The prepared samples were sieved using a steel sieve of 4.75 mm to obtain particles in the range of the instrument to avoid clogging the device connections. 20 MPs of each type were mixed in 250 mL distilled water separately in 400 mL beakers. The samples were placed in a magnetic stirrer, and the mixing speed was adjusted as required. If necessary, a drop of soap solution was added to the surface to bring down the floating particles, and the inlet pipe was always kept submerged in the beaker. Priming was done before running the sample with distilled water alone, and a blank sample was run to see if there were any significant interferences.
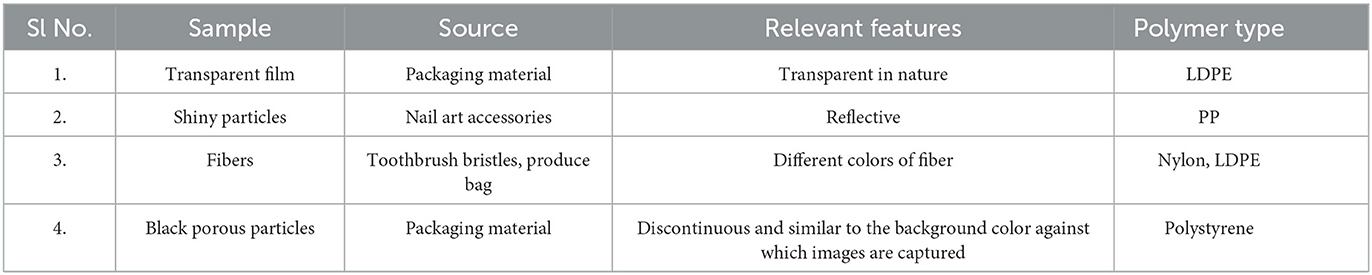
Table 3. MP samples prepared for the experiments with PC2.
The results from particle counters were generated both as histograms and Excel sheets. The histograms provided a quick preview of results and particle size distribution. Using the Excel sheet, it was possible to analyze the particle data further and isolate or calculate the parameters of interest.
Figures 2A–F shows the images captured by PC1 in different samples. The images can only be captured in greyscale, which limits the device's identifying capability to a great extent. The MPs were spherical and could be differentiated by their circular shape amongst other particles in surface water.
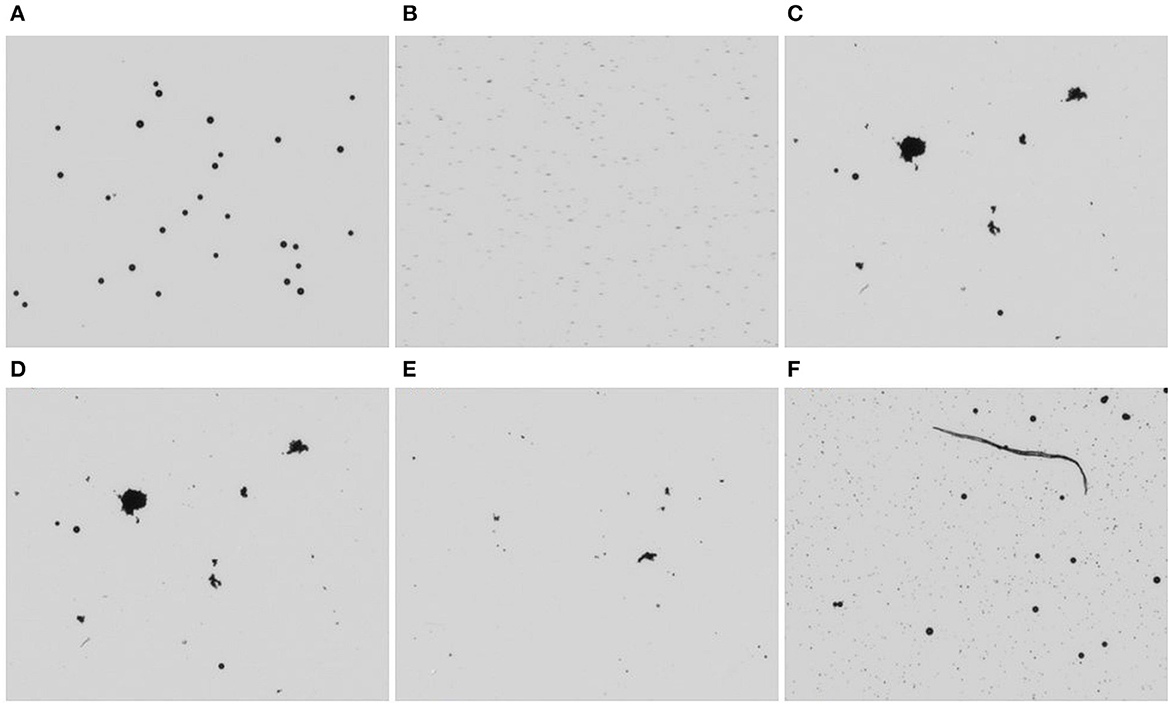
Figure 2. Images from PC1 (A) 25 μm MPs in distilled water (B) 3.2 μm MPs in distilled water (C) filtered surface water without MPs addition (D) 25μm MPs in surface water (E) 3.2 μm MPs in surface water (F) filtered surface water spiked with 3.2 μm and 25 μm MPs.
During the preliminary analysis, PC1 generated the ECD range against the particle count and the concentration. Figures 3A–D shows the particles detected by the instrument against the bin size (of ECD) defined after spiking the distilled and surface water samples with 3.2 μm and 25 μm MPs. PC1 could accurately detect the size and counts of spiked particles, and the surface water contained a large number of small particles (<10 μm) as expected. The number of images that need to be stored was specified before the sample analysis. The image analysis may not have included the analysis of every particle detected by the instrument but those from the images stored. In addition to particle size distribution, various other parameters were tabulated in the Excel sheet, and the relevant ones were plotted.
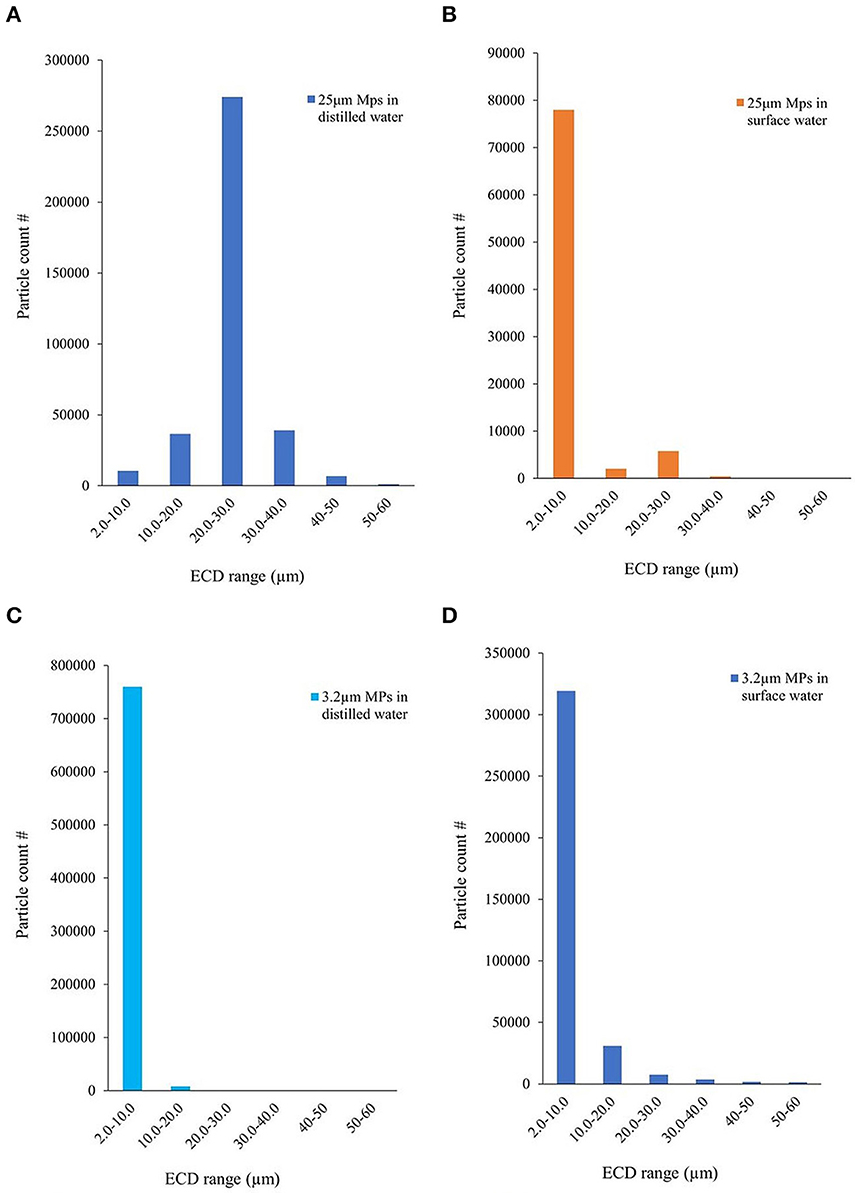
Figure 3. Particle size distribution histogram: 25μm and 3.2μm MPs dispersed in (A, C) distilled water and (B, D) surface water.
Circularity measures the degree to which the shape of the particle resembles that of a circle. It is the ratio between the circumference of the circle with equivalent particle area to its perimeter. It ranges from 0 to 1, where closer to 1 implies more roundness and vice versa. Image analysis by PC1 computes the circularity of the particles in the image stored. The majority of surface water particles had circularity in the range of 0.7 to 1 (Figure 4A). This held true for the spherical microbeads (Figure 2) used in this experiment (Figures 4B, C). No significant differences were observed between the circularity of the MPs and the surface water particles. Therefore, circularity may not be a defining parameter to distinguish round-shaped MPs from the surface water matrix, although it is an important physical parameter in defining particles. MPs in natural water samples can initially be of any shape (i.e., rectangular, triangular), but they retain a rounder shape after exposure to environmental erosion. Therefore, many MPs have similar sizes and shapes to the organic and inorganic particles in water.
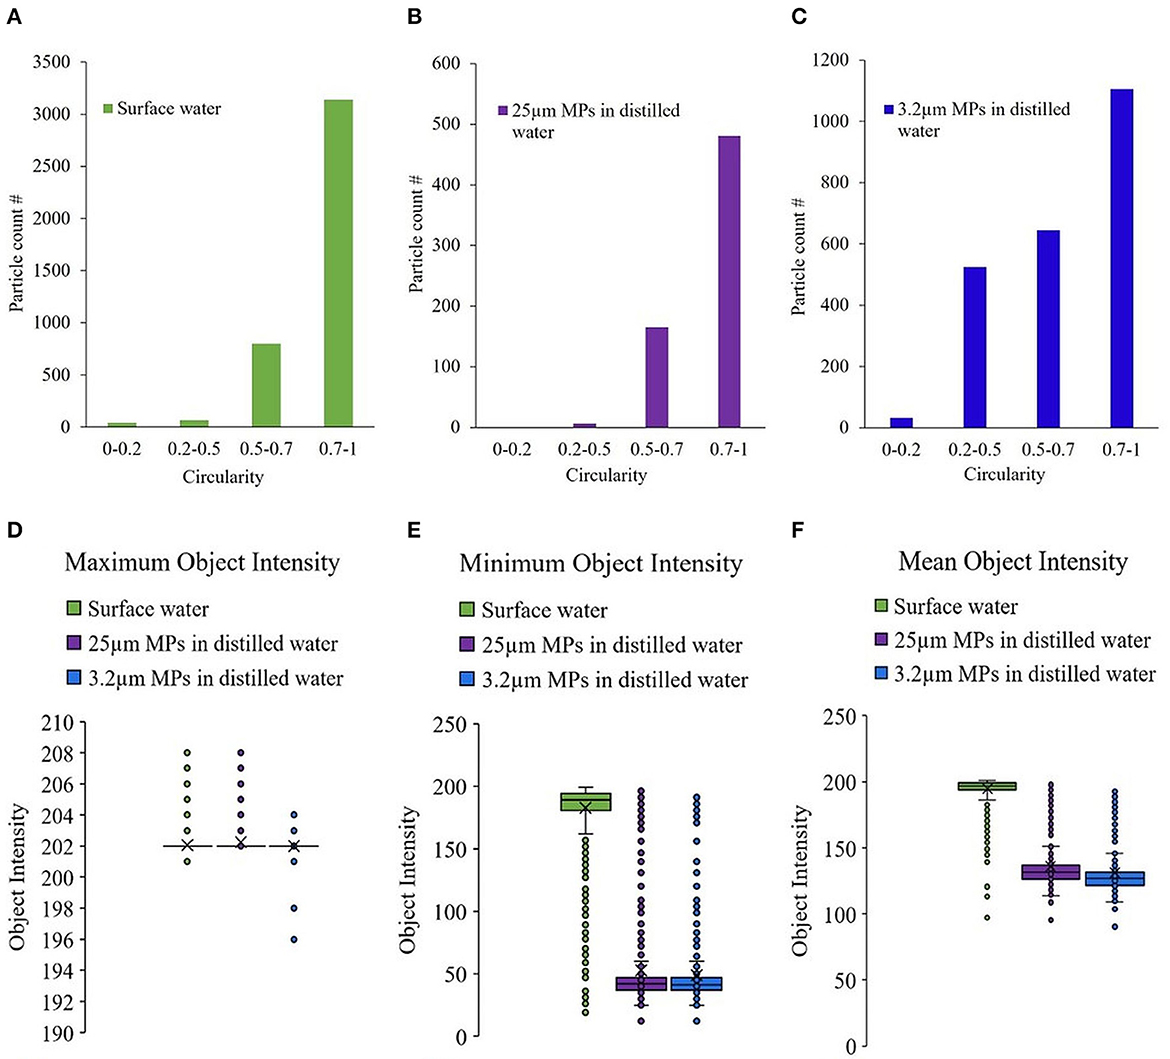
Figure 4. Circularity of the particles detected in different samples (A) filtered surface water without MPs addition, (B) 25 μm MPs in distilled water (C) 3.2 μm MPs in distilled water. (D) Maximum, (E) minimum and (F) mean object intensity of the particles detected in different samples-filtered surface water without MPs addition, 25 μm and 3.2 μm MPs in distilled water.
Object intensity measures the light that reaches the detector after passing through the object, and the closer the value is to 255, the more porous the particle is (Kollu and Örmeci, 2015). Object intensities are described in three formats, minimum and maximum intensities correspond to the lowest and highest intensities, while the mean refers to the average of all pixel intensities. MPs are expected to be denser with less porosity compared to organic particles in water, and this might be a feature that can help to distinguish MPs.
From the box and whiskers plot (Figure 4), it could be observed that the MPs were overall less porous (denser) compared to the particles in surface water. 3.2 μm and 25 μm MPs had a mean object intensity of approximately 130 when the mean object density of surface water particles was approximately 195 (Figure 4F), indicating a substantial difference. A larger difference was observed in the minimum object intensity parameter, which was approximately 190 for surface water particles and 40 for MPs (Figure 4E). However, the maximum object intensity was 202 for all three samples (Figure 4D), indicating minimum or mean object intensity may be more useful parameters for MP detection. The outliers in all the cases need further investigation, but the lack of particle ID in PC1 hinders the same. Although several outliers exist in both cases, these parameters are worth exploring to ascertain if they could be one of the distinguishing properties of MPs against the entities present in surface or drinking water.
PC2 visualizes the data in histograms for a quick review of the particle size distribution (Figure 5A), concentration plot (Figure 5B), and time-series concentration graph (Figure 5C). The bin sizes are automatically chosen depending on the sample, unlike PC1, which has the option to customize the bin size. Nevertheless, the particle size of interest could be isolated and plotted from the Excel sheet data. The concentration plot (Figure 5B) shows the number of frames with the corresponding concentration range of MPs on the X-axis.

Figure 5. Plots from PC2 (A) particle size distribution and (B) concentration plot for blue microfibres (C) time series particle concentration for blue microfibres from PC.
PC2 captures several images analyzed by the software to extract pertinent information about the particles. A unique particle ID is assigned to every object detected by PC2, and the object characteristics are displayed against this ID in an Excel sheet. Particles can thus be located using the image file name and the bounding box (bbox) coordinates that are shown against the particle ID in the Excel sheet. Data also includes the dimensions of the box in which the particle is enclosed, RGB (red-green-blue) value with the corresponding color, area, and perimeter of the object in pixels.
The total particle count can be computed from the particle size distribution chart (Figure 5A). The total number of MPs computed by PC2 was higher than that were actually present in the sample. On further investigation, it was observed that a single particle was sometimes segmented into several smaller objects, and each was assigned a particle ID. The segmentation of the particles can be due to various reasons, such as uneven illumination of the object and software analysis issues. The real-time concentration of the particles was described through time series particle concentration plot (Figure 5C), which depicted the number of particles in each frame captured in chronological order, along with the moving average of the data. The moving average was computed at a 7-frame interval. Sudden high concentration peaks were observed in some frames while the subsequent frame was empty. Moving average smoothened the data and gave a more precise measure of the particle concentration than the concentration in a single frame/image captured.
Fibers are defined as those with an aspect ratio (length/diameter) >3. The detection of fibers is generally difficult due to their smaller size, and it gets more complicated to distinguish between synthetic and natural polymers. The application of optical microscopy to identify MP fibers was reported to be particularly challenging (Jung et al., 2021). Figures 6A, D shows the blue and orange fibers used for the study. Blue (Figures 6B, C) and orange (Figures 6E, F) MP fibers were detected by the PC2. The color of the fibers was also defined by PC2 against each particle ID. MP color may be one of the features that can be combined with other parameters to separate MPs from natural particles. Since the dimension of the box enclosing each particle are measured by PC2, these data can be used to compute the aspect ratio, which can be further used to classify the particles into fibers.
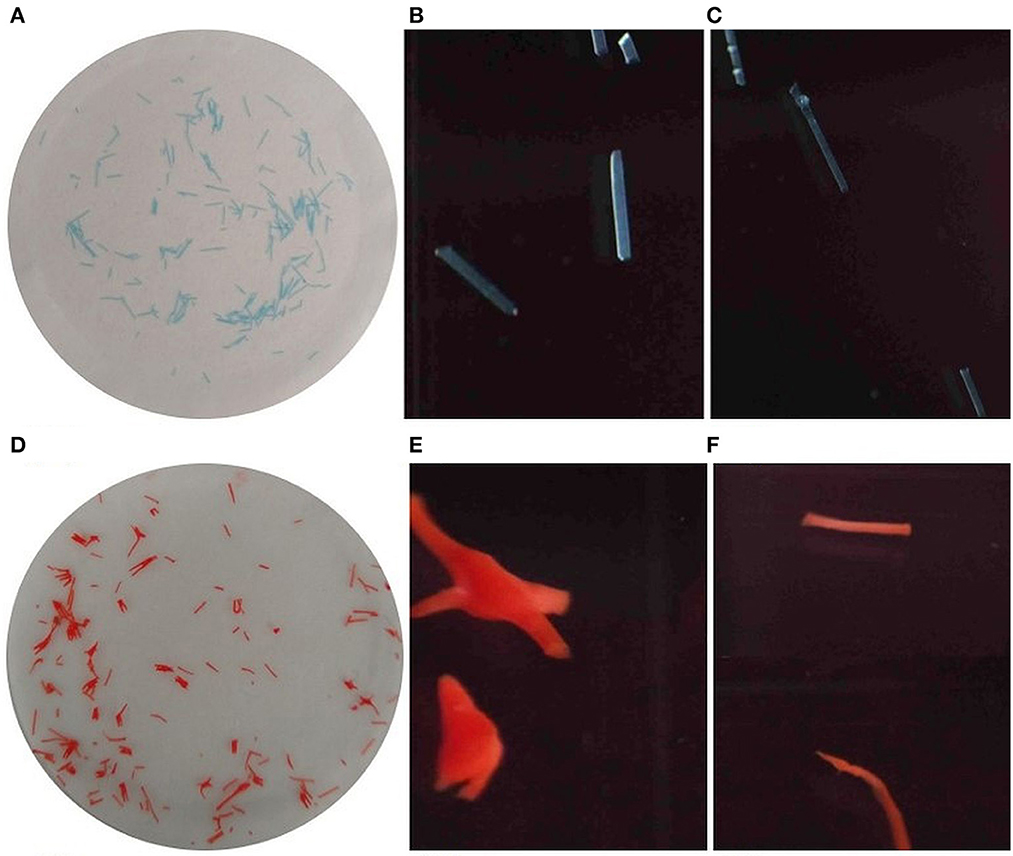
Figure 6. Blue and orange fibers used for the experiment (A, D) and as imaged by PC2 (B, C) and (E, F) respectively.
Black-colored MPs (Figure 7A) were chosen to provide a challenge since the background against which the images were captured was also black. The detection capability of the instrument was hence tested in this case. The particles used were also porous (containing micropores) to reflect the similarities of environmental samples.
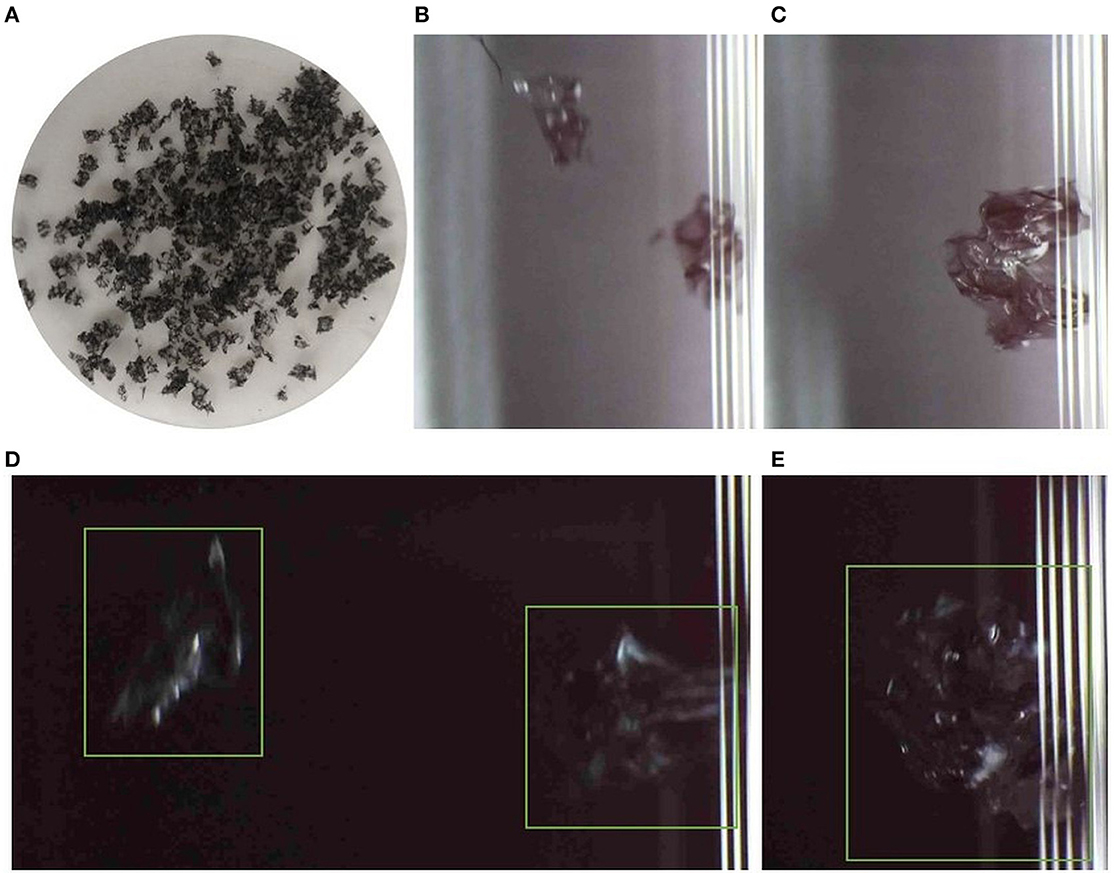
Figure 7. (A) Black MPs used in the experiment. Images from PC2: (B, C) shows the detected MPs against the white background while (D, E) are those against black background (the green box indicates the particle).
Although samples were detected against the black background, poor visibility in the images captured suscepts it to extract erroneous data on the physical features of particles, such as size (Figures 7D, E). The color was accurately designated with both white (Figures 7B, C) and black backgrounds. Since the fragments contained pores, each fragment was identified as two or more particles (separated by pores), subsequently increasing the particle count and leading to inaccurate information on features.
MPs with reflective properties such as glitters are widely found in the environment ranging from sewage sludge (Lusher et al., 2017) to river sediments (Hurley et al., 2018). Glitters are known to evade detection during extraction procedures such as Fenton treatment and density separation and are underestimated (Yurtsever, 2019). When MP particles that appear shiny (Figure 8A) are analyzed via MFI, the reflectance may lead to estimating one particle as several particles. Some areas appear lighter than others (Figure 8B), and darker areas are detected as separate objects within the bigger object. Most of these issues can be resolved by improving image analysis. This can be achieved through excluding the detection of smaller particles within a larger object and training the image analysis software.
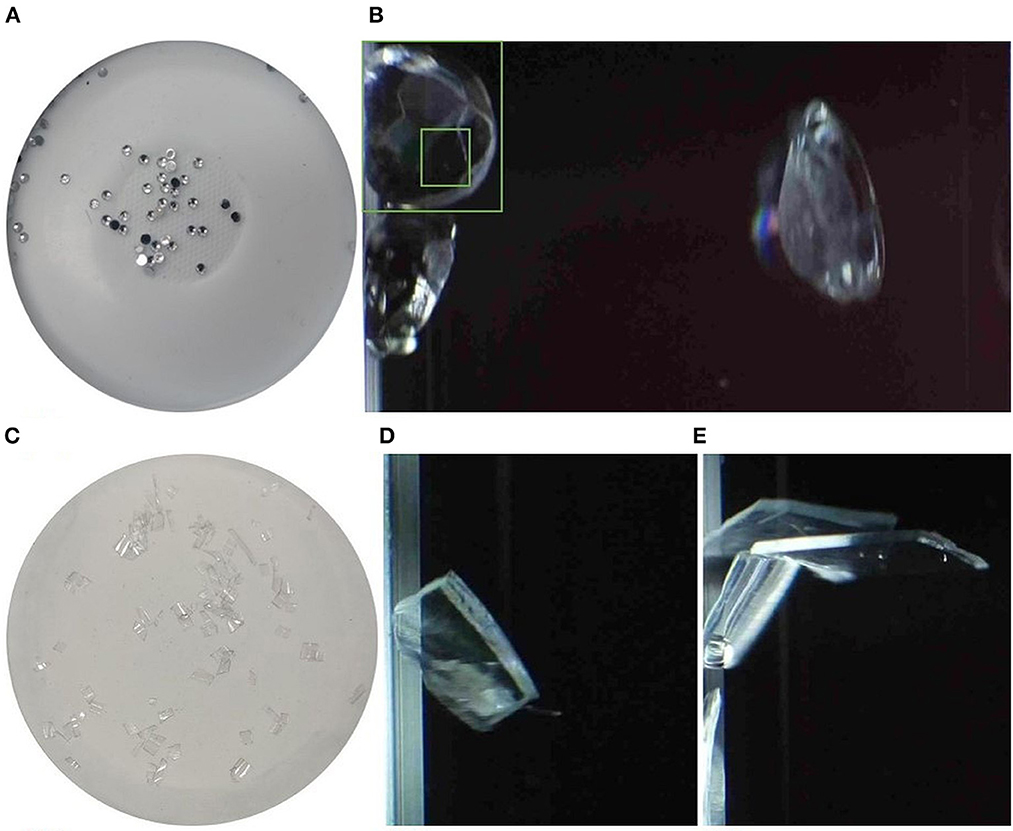
Figure 8. (A, C) Reflective particles and transparent films used in experiment, (B) reflective particles detected by PC2, (D, E) transparent films as detected by the PC2.
Transparent MPs were reported as the most prevalent type in freshwater and drinking water systems (Yin et al., 2019; Campanale et al., 2020; Shruti et al., 2020; Xu et al., 2021). They are likely to have originated from using agricultural plastic sheets and plastic packaging materials meant for disposal after short-term use (Xiong et al., 2018; Campanale et al., 2020). The opacity of the MPs was reported to play a vital role in their detection. Transparent MP particles are harder to detect, reducing the likelihood of accurate characterization of MP types in environmental samples and further leading to underestimation (Song et al., 2015; Nel et al., 2021). It is, therefore, necessary to develop methodologies with technologies that have the capability to detect particles with varied opacity. In this study, PC2 detected the MP films, although the color was misidentified as it was matched from light gray to black depending on the illumination against the black background (Figures 8D, E). The films were overestimated due to their reflective nature, similar to the issue with reflective MPs discussed in 3.2.1. Hence, improvements in imaging techniques are necessary to enhance the accurate estimation of transparent MPs and films.
The color of MPs is a salient feature that is often a decisive factor in separating them from the environmental matrix. Additionally, color may be correlated to the exposure time of the plastic to the seawater (Ogata et al., 2009) and the degree of photodegradation and weathering (Turner and Holmes, 2011). Most of the time, color classification is done visually, which may be biased, time-consuming and inconsistent (Nuelle et al., 2014; Shim et al., 2017). To illustrate, some studies used a more specific class to define color that included the opacity of the MP particle along with the perceived color, while others restricted to the conventional categories of color (Fiore et al., 2022; Wu et al., 2022). Brighter hues are readily separated during the preliminary step, while dull ones may be missed, possibly introducing a bias (Hidalgo-Ruz et al., 2012). MFI-based particle counters can automate this process rendering more uniformity to the process. However, transparent particles may be incorrectly labeled as the same color as the background. PC2 generated color images, while PC1 was limited to greyscale images. Image analysis software of PC2 uses the RGB (Red, Green, Blue) value to match the color to 17 hues, of which 5 are lighter/darker shades of the background.
The background against which the image is captured has an evident effect on defining the color of MPs, with special emphasis on transparent particles. It may be expected to have poor visibility of the particles of the same shade against which the image is captured. However, dark-colored particles were detected against the black background by PC2 (Figures 7D, E). Nonetheless, image analysis may be rendered more complicated in cases where particles are barely visible against the background. Particles may be missed or partially detected, leading to misappropriation and reduced efficiency. Therefore, running the samples against light and dark backgrounds is recommended to ensure accuracy while automating the entire process to make the analysis time efficient.
PC1 has three basic modes of analysis: “Standard Mode” represents the particle size distribution as a histogram plot of concentration against size while offering the option of image storage. “Time-Resolved Sampling” measures the acquisition time for each image while generating size distribution charts. These two modes also have an option for image storage. The “shape analysis” mode analyses the image stored to evaluate the morphological characteristics of the particles captured. It also generates images along with an Excel sheet containing particle count and concentration against the corresponding ECD range. The image analysis function can be applied after the procedure by setting the required parameters, such as aspect ratio and ferret diameter, in the software and exporting to Excel format rendering more flexibility. The results can be expected in a few minutes with the graphical representation of the data acquired.
PC2 is more user-friendly in terms of both equipment use and the software interface. In contrast to PC1, PC2 has a particle ID attached to every particle identified, also indicated in the images captured by the camera. Particle ID makes it possible to distinguish the particles from each other and get a closer look at the object of interest. The results can be retrieved as a zip file within a few minutes of analysis and accessed in a browser on a laptop or cellphone, making it compatible with field use. To rule out counting the same particle more than once, the particles with similar shape, color, and size in successive frames are identified as the same and labeled with the same particle ID. In addition to these parameters, the location of the particle in the frame is also included to identify the duplicates. This is important because there may be distinct particles with similar morphological features, and excluding the location factor may lead to misappropriations. However, the possibility of underestimating MPs with similar appearances cannot be completely ruled out.
PC1 also measures the object intensity and circularity, which are essential parameters in filtering out the air bubbles entrapped during the operation of the instrument. Some MFI software has an image recognition feature that classifies the image based on the baseline set by the user to identify a similar image (Zölls et al., 2013b). MFI is widely employed to discriminate the protein aggregates by combining numerous parameters such as aspect ratio, circularity, and object intensity (Strehl et al., 2012). Similar features for the MPs could be identified to distinguish them from the rest of the sample for the proficient use of this technology.
A precautionary approach to minimize human exposure is recommended until more conclusive evidence on the MPs consumption is established (Danopoulos et al., 2020; Leslie and Depledge, 2020). This approach involves regular monitoring, among other mitigation techniques recommended by the State of California (Wyer et al., 2020). Currently, there is a lack of standard protocols for monitoring and identifying MPs in raw and treated water samples. Most studies are limited to larger (mm size range) MPs due to the difficulty in isolation, recovery and analytical detection of small MPs (micron and sub-micron size range). These challenges undermine the effectiveness and efficiency of MPs monitoring in drinking water, particularly in treated effluent, since the treatment processes can remove particles as small as 45 μm (Na et al., 2021; Frond et al., 2022).
One feature that makes the particle counter a prime candidate for field monitoring is its potential to generate real-time analysis results. Time is a vital constraint to the monitoring process. On average, it takes around 41 h for sample preparation and extraction of MPs from the water before polymer identification through spectroscopy (Frond et al., 2022). Therefore, more research is required to develop faster and more cost-efficient techniques. MFI may find application in MPs identification due to the rapid generation of results. The fact that most of the process is automated and generates time-series analysis results is an added advantage. For example, PC2 generates a continuous particle count histogram in chronological order (Figure 5C). The results can be enhanced and improved by combining image analysis with computer vision and machine learning. With continued improvement in image analysis techniques, particle counter could be a promising technique in MPs detection and monitoring (section 3.6).
Shape is an important feature of MPs that plays a crucial role in their removal in WWTP (McCormick et al., 2014). Mukhanov et al. (2019) classified the MP particles isolated from the marine environment into four (4) broad categories: elongated, round, fibers and irregular, using feret diameter, circularity and area. PC1 extracts the features mentioned above along with perimeter, aspect ratio and ECD from the image analysis performed after sample analysis. The values are indicated against each image captured with object numbers in the Excel sheet. Using the “sort” function in Excel, isolating the particles of required features can be done easily. One of the main drawbacks of PC1 is that one cannot ascertain which features belong to a particular object in the indicated image. On the other hand, PC2 has the particle ID feature, as discussed in 3.3, which enables to ID the particle in question and isolates the same for further investigation if necessary. Hence, these features are essential for developing a more robust analysis technique.
Size fractionation is carried out by filtering through filters of decreasing pore sizes. Size categorization of the MPs varies significantly in the previous publications, including the method or type of filter paper used (Hanvey et al., 2017). Lack of standardization and consistency in the methodology and reporting of final results in MPs identification and analysis renders the comparison and replicability of published works difficult, hindering the development of a database for MPs evaluation (Besley et al., 2017; Müller et al., 2020). MFI generates information on the size, shape, and color of every particle detected, among other details, enhancing the data intercomparability and flexibility to adapt to future classification and protocols developed.
Researchers often quantify isolated MPs as the number of MPs per volume or mass. The mass of MPs or their volume is less popular due to difficulty in computation. The size range of the particles via sieving may be used to express the “size parameter” rather than evaluating the diameter of each particle. Color is reported by subjective evaluation of the MP particles (Hartmann et al., 2019). All these factors point to the need for a systematic categorization and to reduce the subjective nature of the result. MFI combined with image analysis could eliminate this bias while gathering more data on all the isolated particles in a much shorter time.
While MFI may provide a number of morphological characteristics of the MPs in a short span, there are certain limitations to employing this technology. With careful precautions and considerations, errors in measurements can be minimized.
Several factors affect the accuracy of the data obtained from the MFI technique. Some particles may be missed, while others may be counted more than once. Overestimating particles is one of the most common errors in MFI. Since the particles are quantified from the images taken, there is a risk of overestimating the particles as the same particle may be caught in consecutive frames and counted more than once. Image analysis should be accounted for to rule out duplicates and improve accuracy (See section 3.3).
MPs can stick or overlap with one another, underestimating quantity and misrepresenting their physical characteristics. Figure 9 shows more than two (2) 25 μm MPs sticking together, presenting as one single MP fragment. As shown in the figure, the shape and size of this cluster are very different from the individual microbeads. Furthermore, the MPs can also get attached to the tubing of the device and around the submerged inlet pipe. When more than one particle is counted as one when they simultaneously occupy the same sensing volume, the particles are underestimated, referred to as a coincidence error. Coincidence error is one of the leading causes of error in particle counters (Pisani and Thomson, 1971). This effect may be more pronounced in samples with high particle concentrations, and dilution may be necessary for those scenarios (Brightwell Technologies Inc, 2007). These factors must be considered to understand the accuracy of the technology.
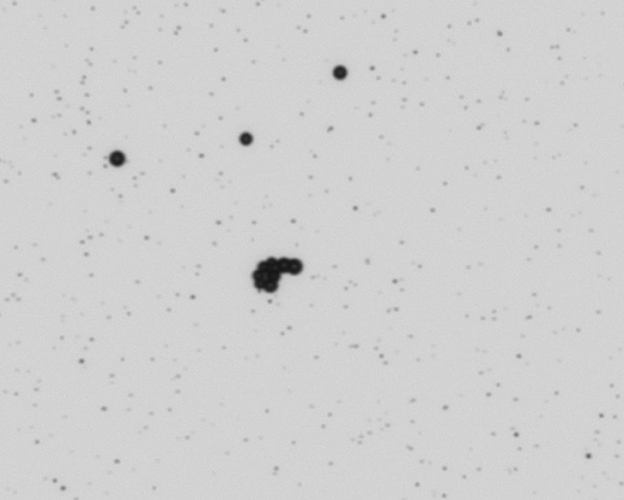
Figure 9. 25 μm MPs sticking to each other.
Identifying any bottleneck along pipes and junctions starting from the inlet is crucial to avoid clogging issues. In addition to the camera magnification, the minimum diameter of the entire system of connections should be analyzed to ascertain the maximum particle size that can enter the inlet. For example, although the inlet pipe diameter of the PC2 is 7 mm, it reduces to 4.3 mm at the junction connecting to the pump, resulting in clogging on the entry of larger particles at the inlet (Figure 10). Furthermore, it is recommended to maintain the same cross-section throughout the conduit and junctions. Particles traveling parallel or too close to each other may result in clogging on sudden reduction of the cross-section. The sample may require appropriate pore-size filtering to eliminate any blocking across the equipment conduits. It should also be noted that blocking out large MPs from the measured sample would lead to not only clogging but also errors in counting.
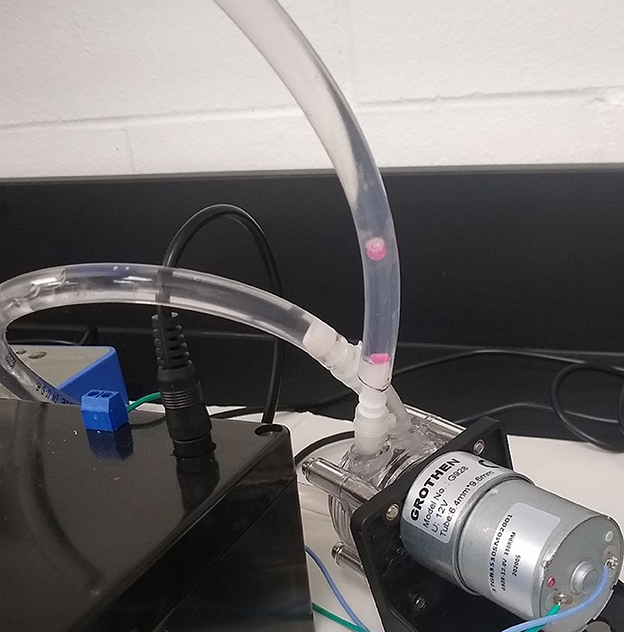
Figure 10. Clogging of the connection tubes by the MP particles.
Bubbles may also entrap other particles and remain stagnant in the tubing for the rest of the analysis. Figure 11A shows a few of the black MPs trapped in the bubble prior to the imaging section of the device. Therefore, the ones trapped were never imaged and analyzed. This further leads to underrepresentation and underestimation of the MPs in the sample. Hence, care should be taken to avoid the generation of bubbles by proper priming at the beginning and ensuring the inlet is submerged at all times to minimize errors in analysis.
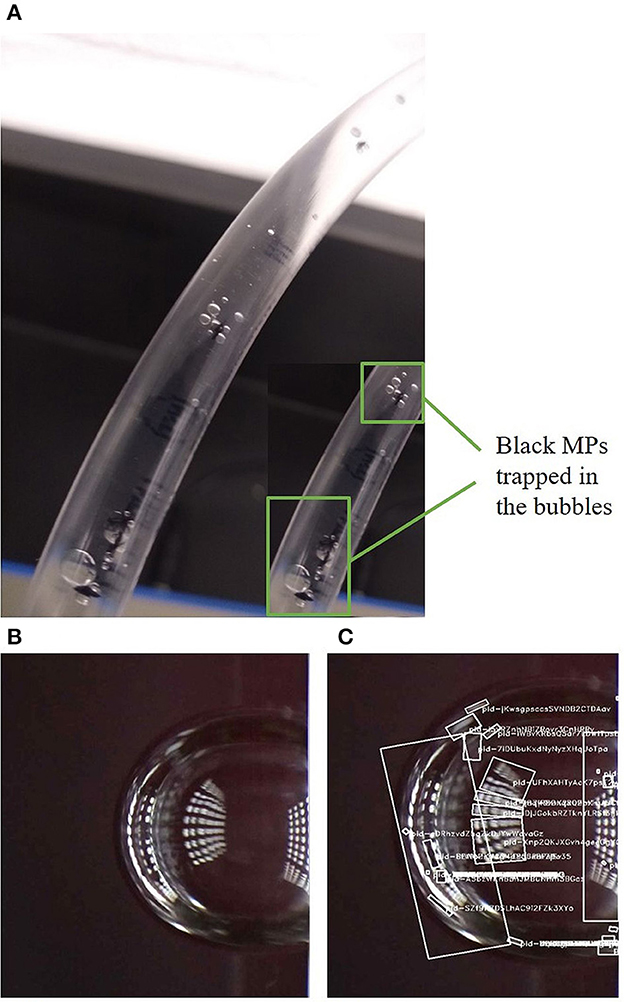
Figure 11. (A) MPs trapped in the bubbles in the tubing (B, C) bubbles detected as particles in PC2.
Air bubbles are formed predominantly during mixing or due to insufficient priming at the startup of the equipment. Bubbles may have several implications for the quantification of MPs. One of them is bubbles being detected and analyzed as particles. Due to its reflectance, a single bubble may be estimated as several individual particles. This is clearly depicted in Figures 11B, C, where PC2 designated several particle IDs to one air bubble, leading to a drastic increase in particle count. Also, since bubbles travel slower than other particles, they may be duplicated in consecutive frames. All these factors ultimately contribute to the overestimation of particles. With machine learning, it may be possible to detect and eliminate the bubbles from being counted as they have a very different appearance and shape compared to MPs and other commonly found particles in the matrix. Classifiers can be created with bubble images to filter them out. PC1 uses the object intensity feature to identify the transparent air bubbles and exclude them from being quantified as particles. In biopharmaceutical formulation studies, individual air bubbles were separated using a circularity filter, while a filter with an intensity/aspect ratio was used for the bubble clusters (Sharma et al., 2010).
Most MPs tend to float on water due to their low density (Supplementary Figure S1A), which poses a problem as they are not sucked into the sample measured by the MFI instruments. Therefore, a mixing unit is advised to mitigate the problem, and caution should be taken to avoid introducing bubbles during the process. A magnetic stirrer may be used to mix the samples, which was used with PC2 in this study to bring the spiked MPs into the solution Supplementary Figure S1B). If the real-time concentration is not of prime importance, adding a few drops of soap to negate the surface tension can help sink the MPs and allow them to the inlet pipe. However, caution is advised as soap addition may generate bubbles. Since PC1 works with a smaller sample volume, a mechanical stirrer is used in a syringe setup for uniform mixing of the sample (Supplementary Figure S1C).
Image recognition can be enhanced through machine learning. Using the artificial neural network, MFI has proved to be an effective tool for differentiating silicone oil droplets, air bubbles, and protein aggregates (Gambe-Gilbuena et al., 2020). Along similar lines, it is worth exploring the use of these tools to develop classifiers for the MP particles against the commonly found contaminants in the water environment (Lin et al., 2022). A comprehensive training set is required to achieve good accuracy for identification. There is a growing interest in automating the labor-intensive task of MPs screening by visual means and classifying them according to their morphological characteristics. New techniques are being developed using a deep learning approach and computer vision that can analyze the images of MPs taken with a digital camera or a mobile phone. These produced outcomes remarkably close to that assessed by human experts half the time and free from the error resulting from fatigue. These techniques were applied to pretreated samples in a non-mobile environment for MPs monitoring (Lorenzo-Navarro et al., 2020, 2021). Integrating these methods into continuously generated images captured by MFI systems offers promising prospects for detecting, quantifying, and identifying MPs in water environments in-situ and in real-time.
This study investigated the potential of MFI-based particle counters to identify MPs in water. Results from the MFI included information on common particle descriptors such as effective circular diameter (ECD), ferret diameter, circularity (from PC1), and color (from PC2). Furthermore, the shape of the detected particles was defined using circularity and aspect ratio. Automating the extraction of these features enhances the intercomparability of the data for future studies. The object intensity parameter can be one of the parameters used to differentiate MPs from lighter organic particles in natural waters. Particle ID was identified as an important feature that makes MFI a more versatile technology and enables further investigation if necessary. Time series particle concentration plots aid utilizing MFI in field applications for MP identification. MFI also presents certain challenges, such as coincidence error, overlap, and overestimation of particles that affect the accuracy of the analysis. Operational precautionary measures can control some of these challenges, such as the formation of bubbles that affect the enumeration efficiency. While it may not eliminate the bubbles completely, image analysis features such as intensity can significantly improve accuracy. With further research and advances in image analysis techniques and machine learning, MFI can be a suitable in-line and real-time monitoring option for MPs in water environments both in the laboratory and in the field.
The raw data supporting the conclusions of this article will be made available by the authors, without undue reservation.
BÖ and NC contributed to conception and design of the study. NC wrote the first draft of the manuscript. All authors contributed to manuscript revision, read, and approved the submitted version.
This study was funded by the Environment and Climate Change Canada (ECCC) under the Zero Plastic Waste Initiative program.
We would like to thank Particuleye Technologies Inc. for loaning the instrument during the study and Dr. Michael Beck for technical assistance and feedback.
The authors declare that the research was conducted in the absence of any commercial or financial relationships that could be construed as a potential conflict of interest.
The handling editor is currently organizing a Research Topic with BÖ.
All claims expressed in this article are solely those of the authors and do not necessarily represent those of their affiliated organizations, or those of the publisher, the editors and the reviewers. Any product that may be evaluated in this article, or claim that may be made by its manufacturer, is not guaranteed or endorsed by the publisher.
The Supplementary Material for this article can be found online at: https://www.frontiersin.org/articles/10.3389/frwa.2023.1148379/full#supplementary-material
Ball, T., Carrière, A., and Barbeau, B. (2011). Comparison of two online flocculation monitoring techniques for predicting turbidity removal by granular media filtration. Environ. Technol0 32, 1095–1105. doi: 10.1080/09593330.2010.528041
Bergmann, M., Wirzberger, V., Krumpen, T., Lorenz, C., Primpke, S., Tekman, M. B., et al. (2017). High quantities of microplastic in arctic deep-sea sediments from the hausgarten observatory. Environ. Sci. Technol. 51, 11000–11010. doi: 10.1021/acs.est.7b03331
Besley, A., Vijver, M. G., Behrens, P., and Bosker, T. (2017). A standardized method for sampling and extraction methods for quantifying microplastics in beach sand. Mar. Pollut. Bull. 114, 77–83. doi: 10.1016/j.marpolbul.2016.08.055
Brightwell Technologies Inc (2007). DPA4100 Particle Analysis System Operation Manual. Ottawa: Brightwell Technologies Inc.
Campanale, C., Stock, F., Massarelli, C., Kochleus, C., Bagnuolo, G., Reifferscheid, G., et al. (2020). Microplastics and their possible sources: the example of Ofanto river in southeast Italy. Environ. Pollut. 258, 113284. doi: 10.1016/j.envpol.2019.113284
Chaudhari, S., and Samnani, P. (2022). Determination of microplastics in pond water. Mater Today Proc. 77, 91–98. doi: 10.1016/j.matpr.2022.10.141
Danopoulos, E., Twiddy, M., and Rotchell, J. M. (2020). Microplastic contamination of drinking water: a systematic review. PLoS ONE 15, 838. doi: 10.1371/journal.pone.0236838
Demeule, B., Messick, S., Shire, S. J., and Liu, J. (2010). Characterization of particles in protein solutions: reaching the limits of current technologies. AAPS J. 12, 708–715. doi: 10.1208/s12248-010-9233-x
DraŽić, S., Sladoje, N., and Lindblad, J. (2016). Estimation of Feret's diameter from pixel coverage representation of a shape. Pattern Recognit. Lett. 80, 37–45. doi: 10.1016/j.patrec.2016.04.021
ECCC (2022). Single-use Plastics Prohibition Regulations: Overview. Available online at: https://www.canada.ca/en/environment-climate-change/services/managing-reducing-waste/reduce-plastic-waste/single-use-plastic-overview.html (accessed March 15, 2023).
Eerkes-Medrano, D., Leslie, H. A., and Quinn, B. (2019). Microplastics in drinking water: a review and assessment. Curr. Opin. Environ. Sci. Health 7, 69–75. doi: 10.1016/j.coesh.2018.12.001
European Union (2020). Directive (Eu) 2020/2184 of the European Parliament and of the Council of 16 December 2020 on the quality of water intended for human consumption. Off. J. Eur. Union 435, 1–62. Available online at: https://eur-lex.europa.eu/eli/dir/2020/2184/oj
Fiore, L., Serranti, S., Mazziotti, C., Riccardi, E., Benzi, M., Bonifazi, G., et al. (2022). Classification and distribution of freshwater microplastics along the Italian Po river by hyperspectral imaging. Environ. Sci. Pollut. Res. 29, 48588–48606. doi: 10.1007/s11356-022-18501-x
Foley, C. J., Feiner, Z. S., Malinich, T. D., and Höök, T. O. (2018). A meta-analysis of the effects of exposure to microplastics on fish and aquatic invertebrates. Science Total Environ. 631–632 550–559. doi: 10.1016/j.scitotenv.2018.03.046
Frond, d. e., Thornton Hampton, H., Kotar, L., Gesulga, S., Matuch, K., Lao, C. W., et al. (2022). Monitoring microplastics in drinking water: an interlaboratory study to inform effective methods for quantifying and characterizing microplastics. Chemosphere 298, 134282. doi: 10.1016/j.chemosphere.2022.134282
Gambe-Gilbuena, A., Shibano, Y., Krayukhina, E., Torisu, T., and Uchiyama, S. (2020). Automatic identification of the stress sources of protein aggregates using flow imaging microscopy images. J Pharm Sci 109, 614–623. doi: 10.1016/j.xphs.2019.10.034
Gasperi, J., Wright, S. L., Dris, R., Collard, F., Mandin, C., Guerrouache, M., et al. (2018). Microplastics in air: are we breathing it in? Curr. Opin. Environ. Sci. Health 1, 1–5. doi: 10.1016/j.coesh.2017.10.002
Government of the United States of America (2015). H.R.1321 - 114th Congress (2015-2016): Microbead-Free Waters Act of 2015. Available online at: https://www.congress.gov/bill/114th-congress/house-bill/1321 (accessed March 15, 2023).
Hanvey, J. S., Lewis, P. J., Lavers, J. L., Crosbie, N. D., Pozo, K., Clarke, B. O., et al. (2017). A review of analytical techniques for quantifying microplastics in sediments. Anal. Methods 9, 1369–1383. doi: 10.1039/C6AY02707E
Harrison, J. P., Ojeda, J. J., and Romero-González, M. E. (2012). The applicability of reflectance micro-Fourier-transform infrared spectroscopy for the detection of synthetic microplastics in marine sediments. Sci. Total Environ. 416, 455–463. doi: 10.1016/j.scitotenv.2011.11.078
Hartmann, N. B., Hüffer, T., Thompson, R. C., Hassellöv, M., Verschoor, A., Daugaard, A. E., et al. (2019). Are we speaking the same language? Recommendations for a definition and categorization framework for plastic debris. Environ. Sci. Technol. 53, 1039–1047. doi: 10.1021/acs.est.8b05297
Hendrickson, E., Minor, E. C., and Schreiner, K. (2018). Microplastic abundance and composition in western lake superior as determined via microscopy, Pyr-GC/MS, and FTIR. Environ. Sci. Technol. 52, 1787–1796. doi: 10.1021/acs.est.7b05829
Hengstmann, E., and Fischer, E. K. (2019). Nile red staining in microplastic analysis—proposal for a reliable and fast identification approach for large microplastics. Environ Monit Assess 191, 612. doi: 10.1007/s10661-019-7786-4
Hidalgo-Ruz, V., Gutow, L., Thompson, R. C., and Thiel, M. (2012). Microplastics in the marine environment: a review of the methods used for identification and quantification. Environ. Sci. Technol. 46, 3060–3075. doi: 10.1021/es2031505
Højris, B., Christensen, S. C. B., Albrechtsen, H. J., Smith, C., and Dahlqvist, M. (2016). (2016). A novel, optical, on-line bacteria sensor for monitoring drinking water quality. Sci. Rep. 6, 1. 6, 1–10. doi: 10.1038/srep23935
Huang, C. T., Sharma, D., Oma, P., and Krishnamurthy, R. (2009). Quantitation of protein particles in parenteral solutions using micro-flow imaging. J. Pharm. Sci. 98, 3058–3071. doi: 10.1002/jps.21575
Huppertsberg, S., and Knepper, T. P. (2018). Instrumental analysis of microplastics—benefits and challenges. Anal. Bioanal. Chem. 410, 6343–6352. doi: 10.1007/s00216-018-1210-8
Hurley, R., Woodward, J., and Rothwell, J. J. (2018). Microplastic contamination of river beds significantly reduced by catchment-wide flooding. Nat. Geosci. 11, 251–257. doi: 10.1038/s41561-018-0080-1
Jung, S., Cho, S.-. H, Kim, K-, H., and Kwon, E. E. (2021). Progress in quantitative analysis of microplastics in the environment: a review. Chem. Eng. J. 422, 130154. doi: 10.1016/j.cej.2021.130154
Käppler, A., Windrich, F., Löder, M. G. J., Malanin, M., Fischer, D., Labrenz, M., et al. (2015). Identification of microplastics by FTIR and Raman microscopy: a novel silicon filter substrate opens the important spectral range below 1300 cm−1 for FTIR transmission measurements. Anal. Bioanal. Chem. 407, 6791–6801. doi: 10.1007/s00216-015-8850-8
Kollu, K., and Örmeci, B. (2015). Monitoring simulated bioflocculation: application of micro-flow imaging technology. Water Air Soil Pollut. 226, 1–13. doi: 10.1007/s11270-015-2299-4
Koppanen, M., Kesti, T., Kokko, M., Rintala, J., and Palmroth, M. (2022). An online flow-imaging particle counter and conventional water quality sensors detect drinking water contamination in the presence of normal water quality fluctuations. Water Res. 213, 118149. doi: 10.1016/j.watres.2022.118149
Lahens, L., Strady, E., Kieu-Le, T. C., Dris, R., Boukerma, K., Rinnert, E., et al. (2018). Macroplastic and microplastic contamination assessment of a tropical river (Saigon River, Vietnam) transversed by a developing megacity. Environ. Pollut. 236, 661–671. doi: 10.1016/j.envpol.2018.02.005
Leoni, B., Frezzotti, M. L., and Nava, V. (2021). Raman spectroscopy for the analysis of microplastics in aquatic systems. Appl Spectr. 75, 1341–1357. doi: 10.1177/00037028211043119
Leslie, H. A., and Depledge, M. H. (2020). Where is the evidence that human exposure to microplastics is safe? Environ. Int. 142, 105807. doi: 10.1016/j.envint.2020.105807
Li, J., Liu, H., and Paul Chen, J. (2018). Microplastics in freshwater systems: a review on occurrence, environmental effects, and methods for microplastics detection. Water Res. 137, 362–374. doi: 10.1016/j.watres.2017.12.056
Lin, J., yu Liu, H., and tao, Zhang, J. (2022). Recent advances in the application of machine learning methods to improve identification of the microplastics in environment. Chemosphere 307, 136092. doi: 10.1016/j.chemosphere.2022.136092
Lorenzo-Navarro, J., Castrillón-Santana, M., Sánchez-Nielsen, E., Zarco, B., Herrera, A., Martínez, I., et al. (2021). Deep learning approach for automatic microplastics counting and classification. Sci. Total Environ. 765, 142728. doi: 10.1016/j.scitotenv.2020.142728
Lorenzo-Navarro, J., Castrillon-Santana, M., Santesarti, E., Marsico, d. e., Martinez, M., Raymond, I. E., et al. (2020). SMACC: A system for microplastics automatic counting and classification. IEEE Access 8, 25249–25261. doi: 10.1109/ACCESS.2020.2970498
Lusher, A., Hurley, R., Vogelsang, C., Nizzetto, L., and Olsen, M. (2017). Mapping Microplastics in Sludge. Oslo: Norsk Institutt for Vannforskning
McCormick, A., Hoellein, T. J., Mason, S. A., Schluep, J., and Kelly, J. J. (2014). Microplastic is an abundant and distinct microbial habitat in an urban river. Environ Sci. Technol. 48, 11863–11871. doi: 10.1021/es503610r
Mukhanov, V. S., Litvinyuk, D. A., Sakhon, E. G., Bagaev, A., Veerasingam, S., and Venkatachalapathy, R. (2019). A new method for analyzing microplastic particle size distribution in marine environmental samples. Ecol. Montenegrina 23, 77–86. doi: 10.37828/em.2019.23.10
Müller, Y. K., Wernicke, T., Pittroff, M., Witzig, C. S., Storck, F. R., Klinger, J., et al. (2020). Microplastic analysis—are we measuring the same? Results on the first global comparative study for microplastic analysis in a water sample. Anal. Bioanal. Chem. 412, 555–560. doi: 10.1007/s00216-019-02311-1
Na, S.-H., Kim, M.-J., Kim, J. T., Jeong, S., Lee, S., Chung, J., et al. (2021). Microplastic removal in conventional drinking water treatment processes: Performance, mechanism, and potential risk. Water Res. 202, 117417. doi: 10.1016/j.watres.2021.117417
Nel, H. A., Chetwynd, A. J., Kelleher, L., Lynch, I., Mansfield, I., Margenat, H., et al. (2021). Detection limits are central to improve reporting standards when using Nile red for microplastic quantification. Chemosphere 263, 127953. doi: 10.1016/j.chemosphere.2020.127953
Nuelle, M. T., Dekiff, J. H., Remy, D., and Fries, E. (2014). A new analytical approach for monitoring microplastics in marine sediments. Environ. Pollut. 184, 161–169. doi: 10.1016/j.envpol.2013.07.027
Ogata, Y., Takada, H., Mizukawa, K., Hirai, H., Iwasa, S., Endo, S., et al. (2009). International Pellet Watch: Global monitoring of persistent organic pollutants (POPs) in coastal waters. 1. Initial phase data on PCBs, DDTs, and HCHs. Mar. Pollut. Bull 58, 1437–1446. doi: 10.1016/j.marpolbul.2009.06.014
Olesen, K. B., Stephansen, D. A., van Alst, N., and Vollertsen, J. (2019). Microplastics in a Stormwater Pond. Water 11, 1466. doi: 10.3390/w11071466
Pisani, J. F., and Thomson, G. H. (1971). Coincidence errors in automatic particle counters. J. Phys. E 4, 359. doi: 10.1088/0022-3735/4/5/006
Pivokonsky, M., Cermakova, L., Novotna, K., Peer, P., Cajthaml, T., Janda, V., et al. (2018). Occurrence of microplastics in raw and treated drinking water. Sci. Environ. 643, 1644–1651. doi: 10.1016/j.scitotenv.2018.08.102
Prata, J. C., Costa, D. A., Lopes, J. P., Duarte, I. A. C., and Rocha-Santos, T. (2020). Environmental exposure to microplastics: an overview on possible human health effects. Sci. Total Environ. 702, 134455. doi: 10.1016/j.scitotenv.2019.134455
Ripple, D. C., and DeRose, P. C. (2018). Primary determination of particle number concentration with light obscuration and dynamic imaging particle counters. J. Res. Natl. Inst. Stand Technol. 123, 123002. doi: 10.6028/jres.123.002
Rodrigues, M. O., Gonçalves, A. M. M., Gonçalves, F. J. M., Nogueira, H., Marques, J. C., Abrantes, N., et al. (2018). Effectiveness of a methodology of microplastics isolation for environmental monitoring in freshwater systems. Ecol. Indic. 89, 488–495. doi: 10.1016/j.ecolind.2018.02.038
Sharma, D. K., King, D., Oma, P., and Merchant, C. (2010). Micro-flow imaging: flow microscopy applied to sub-visible particulate analysis in protein formulations. AAPS J 12, 455–464. doi: 10.1208/s12248-010-9205-1
Sharma, D. K., Oma, P., and Krishnan, S. (2009). Silicone microdroplets in protein formulations—detection and enumeration. Pharm. Technol. 33, 74–79.
Shim, W. J., Hong, S. H., and Eo, S. E. (2017). Identification methods in microplastic analysis: a review. Anal. Methods 9, 1384–1391. doi: 10.1039/C6AY02558G
Shruti, V. C., Pérez-Guevara, F., and Kutralam-Muniasamy, G. (2020). Metro station free drinking water fountain—A potential “microplastics hotspot” for human consumption. Environ. Pollut. 261, 114227. doi: 10.1016/J.envpol.2020.114227
Song, Y. K., Hong, S. H., Jang, M., Han, G. M., Rani, M., Lee, J., et al. (2015). A comparison of microscopic and spectroscopic identification methods for analysis of microplastics in environmental samples. Mar. Pollut. Bull. 93, 202–209. doi: 10.1016/j.marpolbul.2015.01.015
Sorolla-Rosario, D., Llorca-Porcel, J., Pérez-Martínez, M., Lozano-Castell,ó, D., and Bueno-López, A. (2023). Microplastics' analysis in water: easy handling of samples by a new thermal extraction desorption-gas chromatography-mass spectrometry (TED-GC/MS) methodology. Talanta 253, 123829. doi: 10.1016/j.talanta.2022.123829
Strehl, R., Rombach-Riegraf, V., Diez, M., Egodage, K., Bluemel, M., Jeschke, M., et al. (2012). Discrimination between silicone oil droplets and protein aggregates in biopharmaceuticals: a novel multiparametric image filter for sub-visible particles in microflow imaging analysis. Pharm Res. 29, 594–602. doi: 10.1007/s11095-011-0590-7
Turner, A., and Holmes, L. (2011). Occurrence, distribution and characteristics of beached plastic production pellets on the island of Malta (central Mediterranean). Mar. Pollut. Bull 62, 377–381. doi: 10.1016/j.marpolbul.2010.09.027
United Nations Environment Programme (2018). Legal Limits on Single-Use Plastics and Microplastics: A Global Review of National Laws and Regulations. Available online at: https://wedocs.unep.org/xmlui/handle/20.500.11822/27113 (accessed March 15, 2023).
Uurasjärvi, E., Hartikainen, S., Setälä, O., Lehtiniemi, M., and Koistinen, A. (2020). Microplastic concentrations, size distribution, and polymer types in the surface waters of a northern European lake. Water Environ. Res. 92, 149–156. doi: 10.1002/wer.1229
Vianello, A., Boldrin, A., Guerriero, P., Moschino, V., Rella, R., Sturaro, A., et al. (2013). Microplastic particles in sediments of Lagoon of Venice, Italy: First observations on occurrence, spatial patterns and identification. Estuar Coast Shelf Sci. 130, 54–61. doi: 10.1016/j.ecss.2013.03.022
Wang, W., Gao, H., Jin, S., Li, R., and Na, G. (2019). The ecotoxicological effects of microplastics on aquatic food web, from primary producer to human: a review. Ecotoxicol. Environ. Saf. 173, 110–117. doi: 10.1016/j.ecoenv.2019.01.113
Wu, Y., Chen, X., Wen, L., Li, Z., Peng, M., Wu, H., et al. (2022). Linking human activity to spatial accumulation of microplastics along mangrove coasts. Sci. Total Environ. 825, 154014. doi: 10.1016/j.scitotenv.2022.154014
Wyer, H., Polhemus, D., Moore, S., Weisberg, S. B., Coffin, S., Rochman, C. M., et al. (2020). Steps scientists can take to inform aquatic microplastics management: a perspective informed by the california experience. Appl Spectrosc. 74, 971–975. doi: 10.1177/0003702820946033
Xiong, X., Tu, Y., Chen, X., Jiang, X., Shi, H., Wu, C., et al. (2019). Ingestion and egestion of polyethylene microplastics by goldfish (Carassius auratus): influence of color and morphological features. Heliyon 5, e03063. doi: 10.1016/j.heliyon.2019.e03063
Xiong, X., Zhang, K., Chen, X., Shi, H., Luo, Z., Wu, C., et al. (2018). Sources and distribution of microplastics in China's largest inland lake – Qinghai Lake. Environ. Pollution 235, 899–906. doi: 10.1016/j.envpol.2017.12.081
Xu, Y., Chan, F. K. S., Johnson, M., Stanton, T., He, J., Jia, T., et al. (2021). Microplastic pollution in Chinese urban rivers: The influence of urban factors. Resour. Conserv. Recycl. 173, 105686. doi: 10.1016/J.resconrec.2021.105686
Yin, L., Jiang, C., Wen, X., Du, C., Zhong, W., Feng, Z., et al. (2019). Microplastic pollution in surface water of Urban Lakes in Changsha, China. Int. J. Environ. Res. Public Health. 16, 1650. doi: 10.3390/ijerph16091650
Yurtsever, M. (2019). Tiny, shiny, and colorful microplastics: are regular glitters a significant source of microplastics? Mar Pollut. Bull. 146, 678–682. doi: 10.1016/j.marpolbul.2019.07.009
Yusuf, A., Sodiq, A., Giwa, A., Eke, J., Pikuda, O., Eniola, J. O., et al. (2022). Updated review on microplastics in water, their occurrence, detection, measurement, environmental pollution, and the need for regulatory standards. Environ. Pollut. 292, 118421. doi: 10.1016/j.envpol.2021.118421
Zarfl, C. (2019). Promising techniques and open challenges for microplastic identification and quantification in environmental matrices. Anal. Bioanal. Chem. 411, 3743–3756. doi: 10.1007/s00216-019-01763-9
Zölls, S., Gregoritza, M., Tantipolphan, R., Wiggenhorn, M., Winter, G., Friess, W., et al. (2013a). How subvisible particles become invisible—Relevance of the refractive index for protein particle analysis. J. Pharm. Sci 102, 1434–1446. doi: 10.1002/jps.23479
Keywords: particle counter, real-time monitoring, microplastics (MPs), micro-flow imaging (MFI), quantification, characterization
Citation: Choran N and Örmeci B (2023) Micro-flow imaging for in-situ and real-time enumeration and identification of microplastics in water. Front. Water 5:1148379. doi: 10.3389/frwa.2023.1148379
Received: 20 January 2023; Accepted: 25 April 2023;
Published: 12 May 2023.
Edited by:
Vahid Pilechi, National Research Council Canada (NRC), CanadaReviewed by:
Temitope O. Sogbanmu, University of Lagos, NigeriaCopyright © 2023 Choran and Örmeci. This is an open-access article distributed under the terms of the Creative Commons Attribution License (CC BY). The use, distribution or reproduction in other forums is permitted, provided the original author(s) and the copyright owner(s) are credited and that the original publication in this journal is cited, in accordance with accepted academic practice. No use, distribution or reproduction is permitted which does not comply with these terms.
*Correspondence: Banu Örmeci, YmFudW9ybWVjaUBjdW5ldC5jYXJsZXRvbi5jYQ==
Disclaimer: All claims expressed in this article are solely those of the authors and do not necessarily represent those of their affiliated organizations, or those of the publisher, the editors and the reviewers. Any product that may be evaluated in this article or claim that may be made by its manufacturer is not guaranteed or endorsed by the publisher.
Research integrity at Frontiers
Learn more about the work of our research integrity team to safeguard the quality of each article we publish.