 Deena Hannoun*
 Todd Tietjen
- Regional Water Quality, Southern Nevada Water Authority, Las Vegas, NV, United States
Extended drought in the twenty-first century has led to loss of volume for lakes and reservoirs across the globe. In the Colorado River Basin, USA, Lakes Powell and Mead have experienced a 68 and 71% decline in volume, respectively, since 2000. Lake Mead is important to the Las Vegas Valley as it accounts for 90–100% of the source water used to serve the 2.2 million residents and 43 million annual tourists. Lake Powell is also vital to maintaining water quality in Lake Mead as it is located upstream and provides 97% of the water entering Mead. As Lakes Powell and Mead are projected to continue decreasing in volume over the next 5 years, it is important to understand the effects of loss of lake volume on water quality in this highly-managed system. Here, the effects of lake drawdown on water quality parameters that affect disinfection byproduct (DBP) formation in the source water for the Las Vegas Valley are projected over the next 5 years using Federal flow projections, regression modeling to project influent temperature from Lake Powell into Lake Mead, and a three-dimensional hydrodynamic and water quality model for Lake Mead. Results from these modeling efforts include projections for changes in values of water temperature, bromide, and total organic carbon (TOC) at the modeled cell that contains the Las Vegas Valley's urban drinking water intake. Raw water bromide was found to have little change across modeled scenarios; however, raw water temperature is projected to increase because of falling lake surface elevations. Raw water TOC is projected to increase three-fold in the simulated scenario that includes the most loss of volume but remains close to historic values in the remaining simulated scenarios. With these raw water quality projections, water managers can better plan for alterations to the water treatment processes, including mitigation of DBP formation.
Introduction
Disinfection in drinking water has been used since the beginning of the twentieth century to remove and inactivate pathogens from potable water (Sadiq and Rodriguez, 2004). One concern with the disinfection process, however, is the formation of disinfection byproducts (DBPs) in treated water. In the United States, some DBPs are regulated by the Environmental Protection Agency (United States Environmental Protection Agency, 1998), as they are known to have deleterious health effects in humans (Sadiq and Rodriguez, 2004).
It is also well-established that increases not only in water temperature (Valdivia-Garcia et al., 2019) but also in DBP-forming constituents (Valade and Fulton, 2012) lead to increases in DBP concentrations in finished drinking water. In this study, future projections for water availability in the Colorado River Basin, USA, are run through a series of models to project future water temperatures as well as concentrations of constituents that contribute to the formation of DBPs.
A research gap in this field exists on several notable fronts. The system studied in this paper is a chain of large, highly-managed reservoirs, and it is not well-understood how management of upstream reservoirs may affect raw water quality in downstream reservoirs. Further, reduction of flow in the entire basin is projected over the next 5 years as a result of climate change (United States Bureau of Reclamation, 2022b). While it is well-established that lower lake elevations will lead to submerged structures, such as drinking water intakes, moving closer to the water surface and thus being susceptible to seasonal stratification (Hannoun et al., 2021), the specific effects of official flow projections on water quality for the basin have not been studied. Finally, the constituents that contribute to the formation of DBPs have not been considered in previous modeling efforts.
This study is novel in two ways. First, the effects of projected warmer inflows from upstream Lake Powell into Lake Mead are quantified using regression-based machine learning model. While past efforts (Wright et al., 2009; Dibble et al., 2020) have successfully predicted water temperatures entering Lake Mead, the model presented in this paper is much simpler, relying only on Lake Powell's elevation and Julian date as inputs, and historic temperature profile data for training and validation, while showing excellent performance in both a hindcast and forecast. The use of machine learning models to project surface water temperature is well-documented, and literature on this subject shows that simple models are adequate to describe and project surface water temperatures using historical data (Yousefi and Toffolon, 2022), and that these models can accurately project the thermal structures of highly-stratified lakes (Zhu et al., 2020). The simple model presented in this study is highly adaptable and can be used by researchers who seek to project water temperatures in submerged structures, such as drinking water intakes or dam outlets, with minimal calibration data. These water temperature projections are then related to downstream temperatures and incorporated into the three-dimensional hydrodynamic and water quality model for Lake Mead.
The second novel approach highlighted in this study utilizes a three-dimensional hydrodynamic and water quality model for Lake Mead, the Lake Mead Model (LMM), to project values of water quailty parameters related to DBP formation. This three-dimensional modeling framework is well-established to provide projections for water quality parameters in lakes and reservoirs (Chung et al., 2009, 2014; Anderson and Schwab, 2011; Marti et al., 2016; Allan et al., 2017; Gao et al., 2018; Saber et al., 2020; Amadori et al., 2021; Zamani et al., 2021), and Lake Mead specifically (Preston et al., 2014a,b; Hannoun et al., 2021). This study expands upon previous efforts for Lake Mead as it incorporates Reclamation's inflow and outflow projections for Lake Mead (where previous studies used historic data), and also uses the regression model developed in this paper to incorporate influent water temperature projections into the LMM (again, historic temperatures have been used in previous efforts).
The entirety of this modeling effort yields projections for raw water quality in the modeled cell that contains the drinking water intake in Lake Mead for future water management conditions that are being independently generated. Values of the parameters that govern the formation of DBPs, including water temperature, bromide, and total organic carbon (TOC) are projected for the 5-year period from 2022 to 2026. These projections allow water managers to plan for potential changes to the water treatment processes before changes are detected at the intake.
Materials and methods
Study area
The Colorado River Basin is a crucial engineered storage and delivery system that directly impacts an estimated 40 million people (Milly and Dunne, 2020). Snowmelt from the Rocky Mountains feeds the Colorado River (Bales et al., 2006), which then flows through the Upper Basin states before reaching Arizona, Nevada, and California, and Mexico, discharging to the Gulf of California. The Colorado River Basin is highly regulated and consists of 17 reservoirs that are managed based on Federal, interstate, and intrastate regulations, guidelines, agreements, and optimal hydropower generation. Lakes Powell and Mead (Figure 1) are the two largest reservoirs in the United States and are both part of the Colorado River system. Lake Powell is located in the Upper Colorado River Basin. It is dendritic and has a large surface area—653 km2 with potential storage volume of 32.1 km3 (Hueftle and Stevens, 2001). Lake Powell is mostly fed by regulated Colorado, Green, San Juan, and Escalante Rivers inflow upstream and is contained by Glen Canyon Dam (GCD). The next reservoir downstream from Lake Powell and GCD is Lake Mead. Colorado River water enters Lake Mead after flowing through the Grand Canyon. Lake Mead has a surface area of 600 km2 and potential volume of 36.7 km3 (LaBounty and Burns, 2005). Ninety-seven percent of inflow to Lake Mead is released from upstream GCD. Lake Mead is contained by Hoover Dam. Both Lakes Powell and Mead have a low trophic state and are phosphorus-limited, generally resulting in high water quality (Hueftle and Stevens, 2001; LaBounty and Burns, 2005). Because these reservoirs are so closely linked, changes to water quality in Lake Powell are expected to affect water quality downstream in Lake Mead, potentially changing the ecosystem and native fish populations (Wright et al., 2009; Dibble et al., 2020).
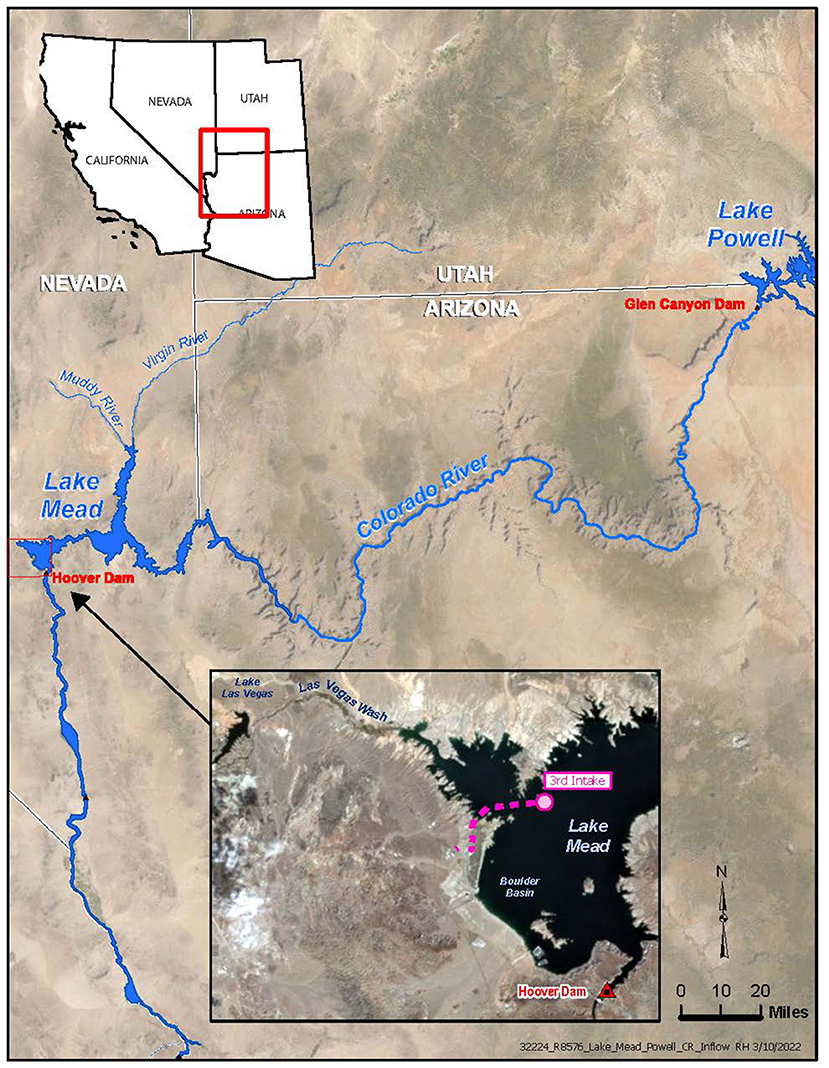
Figure 1. Map of Lakes Powell and Mead.
The Las Vegas Valley relies on Lake Mead to provide reliable, high-quality water to consumers, including over 2 million residents and 43 million annual tourists (Hannoun et al., 2021). Raw water is withdrawn from Intake 3, located deep in Boulder Basin, which is the most downstream basin in Lake Mead. Intake 3 was constructed at the considerable expense of $1.4 billion USD and brought online in 2016 to ensure longevity and water access security of the Las Vegas Valley's water delivery system. Previously, two intakes located closer to the water surface were used (Figure 2). At full capacity, Lake Mead has an elevation of 1,221 ft (371.9 m) above sea level. When Intakes 1 and 2 were constructed, Lake Mead's elevation was significantly higher than it is today; therefore, the intakes withdrew high-quality water from deep in the water column. At the current lake elevation, Intake 1 is above the water surface. Intake 2, while no longer used, would withdraw epilimnetic water during most of the summer due to lower lake surface elevations from extended drought and the deepening of the surface layer of the lake seasonally.
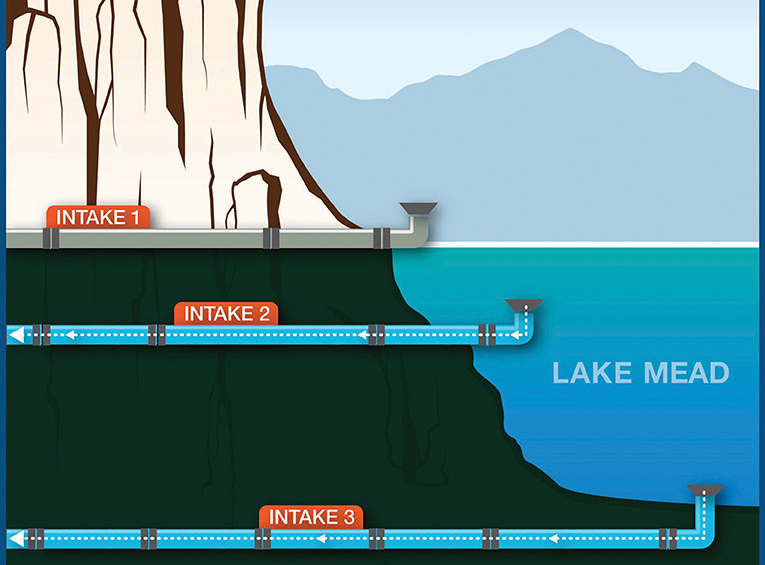
Figure 2. Intake withdrawal depths.
The Colorado River Basin has experienced an extended drought since the year 2000, leading to a decline in elevation of both Lakes Powell and Mead. Further, future climate scenarios are projected to weaken the correlation between Colorado River snowpack and streamflow, leading to less available water in the basin (Udall and Overpeck, 2017; Milly and Dunne, 2020). A decline in available water may impact water quality in the basin in several ways. First, as Lake Powell's elevation declines, releases from GCD may shift from cool, stable hypolimnetic releases to seasonally variable, warmer epilimnetic releases (Wang et al., 2022). Second, raw water withdrawn at Intake 3 may also come from epilimnetic regions of the water column and be subject to higher seasonal variability, again as a result of loss of volume (Hannoun et al., 2021). Finally, with less available water passing through Lake Mead for dilution, precursor constituents that contribute to the formation of DBPs, such as bromide and TOC, may increase in concentration, which could then yield a change in water treatment processes and DBP mitigation strategies.
Ensemble flow projections for the Colorado River Basin
The extended drought in the Colorado River Basin is expected not only to weaken the link between snowpack and available water, but also to reduce the volume of water available in the system (Milly and Dunne, 2020). To quantify the effects of these changes in the basin on raw water quality, projected flows for the Colorado River Basin were taken from Reclamation's 24-Month Study (24MS; United States Bureau of Reclamation, 2022b).
For this study, historic flow traces were replaced with projected traces. Selected traces include the most probable, probable minimum, and probable maximum scenarios. The minimum scenario is the driest hydrologic state evaluated which is similar to a scenario that would probabilistically be exceeded 90% of the time. Consequently, it yields the most pessimistic flow regime simulated in this study, leading to a significant decrease in Lake Mead's water surface elevation level over the 5-year period. The most probable scenario is median hydrologic scenario. The maximum flow scenario is similar to a scenario that would probabilistically be exceeded 10% of the time, and it results in the highest elevation of Lake Mead at the end of the simulation period. There is about an 80% probability that future flow scenarios will fall between the minimum and maximum traces (Wang et al., 2022).
The 24MS is initialized using previous end-of-month reservoir elevations in the basin. The most probable trace uses the 50% Colorado Basin River Forecast Center (CBRFC) projected flow in the Upper Basin for year one and the second year is derived from 50% of historical flows (1991–2020). The minimum and maximum traces use the 10 and 90% CBRFC forecasts for year one, respectively, and then 25 and 75% of historical flows for year two. Because the 24MS only projects out for 24 months and the effects over a 5-year period were needed, the 24MS derived projection data for years 3–5 that represent a repeat of the year two unregulated inflow hydrology in the Upper Basin was used. The model takes water demand into account implicitly in the Upper Basin by using the unregulated inflow forecast and explicitly in the Lower Basin by incorporating demand schedules from the Lower Basin states and Mexico. The model complies with all Colorado River Policies, including the 2007 Interim Guidelines, the Lower Basin Drought Contingency Plan, and Minute 323 (United States Bureau of Reclamation, 2022a).
Reclamation's model projections are used in two ways in this study (1) forecasting inflow and outflow volumes for Lake Mead (2) projecting inflow temperature into Lake Mead based on Lake Powell's elevation projections.
Machine learning temperature model for Glen Canyon Dam
The temperature of water released from GCD and entering Lake Mead has become an important point of discussion for researchers studying the Colorado River Basin. As Lake Powell's elevation falls, the surface of the lake moves closer to the release depth for GCD, resulting in the potential for the water to become warmer and subject to wider intra-seasonal fluctuations (Wright et al., 2009; Zamani, 2014; Glen Canyon Dam Adaptive Management Program, 2022). Currently, releases from GCD are hypolimnetic and the water quality is relatively constant year-round. Warmer releases from GCD and changes to seasonal regimes are expected to affect the ecosystem downstream, including native fish populations in Grand Canyon (Wright et al., 2009). These changes to GCD release temperatures are also expected to affect water quality in Lake Mead.
Previously, thermodynamic models have been constructed to project downstream release temperatures for GCD; the model takes air temperature, dam release temperature, mean flow volume, and distance from GCD as inputs. The model output is projected temperature at a user-specified distance downstream from GCD. Forecasted release volumes and temperatures from Reclamation can be incorporated into the model to yield future projections (Wright et al., 2009; Dibble et al., 2020). This thermodynamic model has been validated and is extremely useful when studying how temperatures can change as a function of distance from GCD; however, these model projections are only as robust as the release temperature and volume projections. As part of this study, a robust machine learning model to project water temperature entering Lake Mead is constructed. In previous studies, temperature projections at GCD were generated using the 2D CE-QUAL-W2 model for Lake Powell; however, to operate the model proposed in this paper, temperature projections at GCD are not needed. The framework for a new statistical temperature model proposed as part of this study uses historical water column temperature data to train the model and yields water temperature projections at GCD using only Lake Powell's projected elevation (from Reclamation) and Julian date. This statistical model overcomes some typical shortcomings of machine learning models by incorporating training data from a nearby deep water sampling site located in Lake Powell, close to GCD.
Machine learning models have recently become popular due to their robustness and relative ease of implementation. In this study, a type of machine learning model called a random forest model is used. The random forest model is named because it uses a classification and regression tree (CART) algorithm that examines data for potential split points, with the resulting visualization of the model looking like a tree. Optimal splits are calculated using a nonlinear least squares algorithm, with the goal of minimizing the difference between the model output and the training data output. The algorithm terminates splitting when the child nodes are pure, meaning it contains only elements from one predictor (Brieman et al., 1984). The machine learning framework is implemented in MATLAB using the TreeBagger function (Taylor et al., 2021; Mathworks, 2022). A number of regression modeling frameworks were tested as part of this study, and the TreeBagger function was selected with an optimal number of trees that minimize model error.
There are advantages and disadvantages to the different modeling frameworks considered in this paper. Thermodynamic models, such as (Wright et al., 2009; Dibble et al., 2020), are consistent with the laws of physics and conserve mass and energy, yielding defensible and physically sound results (Moran et al., 2014). However, as mentioned earlier, when these models incorporate outputs from other models as predictor variables, they are highly dependent on the quality of the incorporated projections. Further, these models can propagate uncertainty in initial projections yielding unrealistic projections (Smith, 2014). Statistical models also have similar concerns. Statistical models have the advantage of being relatively easy to understand, modify/update and implement. One disadvantage of using a statistical model is that these models ignore the underlying physics of the processes they are seeking to model and may not conserve mass or energy. Further, statistical models are limited by their training data sets. Machine learning models are notorious for having poor out of bag (OOB) performance, meaning that phenomena not incorporated in the model training data will yield wildly inaccurate model output.
The machine learning model presented as part of this study overcomes the poor OOB performance typically associated with these types of models by increasing the training set to not only include historic GCD release temperatures, but also thermodynamic data taken from a deep water site located upstream from GCD. It is assumed that the water profile from this sampling site is representative of the water column thermodynamics at the location of the dam. Consequently, the machine learning model presented incorporates potential temperature scenarios where the dam intake is located in the epilimnion or metalimnion, instead of simply limiting the training data to historic hypolimnetic releases, which tend to be cooler and relatively stable year-round. Further, the machine learning model incorporates Julian day as an input while training so that seasonal air temperature effects are organically incorporated into the model. The model projects the inflow temperature of water entering Lake Mead at its confluence with the Colorado River as a function of Lake Powell elevation and time of year. This model is extremely robust as it can account for inflow temperatures in any release scenario using GCD's main outlet. Further, this model can serve as a basis for utilities or lake managers that are concerned with changes in dam release dynamics. As long as temperature data is available for both the dam outlet and a nearby sampling site representative of dam thermodynamics, this relatively simple model can be constructed, validated, and used to make future projections.
Relational polynomial model
Water temperature is projected to change as the water leaves GCD and flows ~300 miles to Lake Mead (Wright et al., 2009; Dibble et al., 2020). For purposes of the LMM, temperature data from the Grand Canyon Monitoring and Research Center, Diamond Creek near Peach Springs (United States Geological Survey, 2022), located upstream from the confluence of Lake Mead and the Colorado River, is incorporated as a boundary forcing value for Colorado River water inflow temperature (Hannoun et al., 2021). Therefore, a relational model between recorded temperatures at GCD and the Diamond Creek gauge was constructed. A polynomial was chosen this time as there was a limited range of historic temperature data available at Diamond Creek and OOB error from a random forest model was a concern. The Akaike and Bayesian information criterion (O'Sullivan and Chen, 2020) were used to select and construct a second-order polynomial that relates Julian date and water temperature at GCD. The polynomial model was constructed in MATLAB using polyfitn (D'Errico, 2022).
In this study, the temperature projections at Diamond Creek are incorporated into a hydrodynamic and water quality model for Lake Mead. After the Lake Mead Model is run to completion, the output parameters are analyzed at the cell containing the drinking water intake for the Las Vegas Valley, Intake 3. This allows water managers to determine what potential changes to the treatment process may be necessary to ensure continued delivery of high-quality water to consumers.
Lake Mead hydrodynamic and water quality model
A three-dimensional hydrodynamic and water quality model for Lake Mead is used to simulate quantities of interest over a five-year timeframe, 2022–2026, consistent with the projection period from Reclamation's 24MS model. The LMM is implemented in Aquatic Ecosystem Model 3D (AEM3D), which approximates quantities of interest by solving the Reynolds-averaged Navier-Stokes equations with a wind-forced mixing model and turbulent eddy closure (Hydronumerics, 2020). The model solves for hydrodynamic and water quality parameters in each grid cell, including, but not limited to, temperature, dissolved oxygen (DO), conductivity, chlorophyll a, suspended sediment, conservative and decay tracers, zooplankton, phytoplankton, and chemical parameters such as phosphorus, nitrogen, and carbon (Hodges and Dallimore, 2013). The LMM was calibrated to measured data to ensure model accuracy and minimization of error as a future planning tool (Hannoun et al., 2021).
Inflows into the LMM are primarily dominated by the Colorado River (97%), which is released from upstream GCD. The remaining inflow comes from the upstream Virgin and Muddy Rivers, and the Las Vegas Wash, which is primarily comprised of recycled treated wastewater effluent from the Las Vegas Valley. Most outflow from Lake Mead is released downstream via Hoover Dam, with minor outflow from the drinking water intake (Figure 3).

Figure 3. LMM bathymetry and grid cell size.
Seven simulations using the LMM were conducted as part of this study (Table 1). First, a historic 5-year simulation was conducted for comparison to projected future scenarios. This simulation used both historic inflow and outflow volumes as measured at Lake Mead, as well as historic inflow temperatures from the Colorado River into Lake Mead. Three simulations used Reclamation's projected inflow and outflow volumes for the most probable, minimum, and maximum flow scenarios. The corresponding scenarios were also incorporated into the machine learning model to unite Colorado River inflow temperature projections with Reclamation flow projections. Finally, three simulations were run with Reclamation's projected inflow and outflow volumes for the most probable, minimum, and maximum flow scenarios; however, historic inflow temperatures were used to quantify the effects of the updated temperature model.
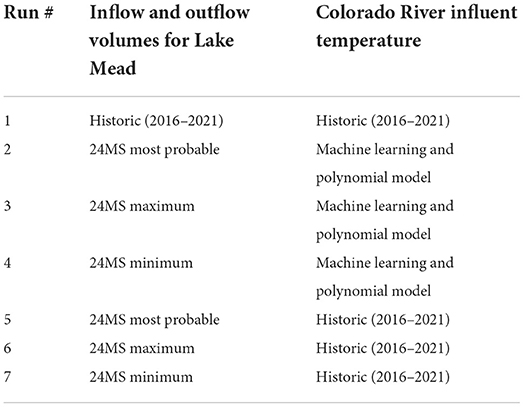
Table 1. Summary of LMM simulations.
In all seven simulations, historic measurements were used for the remaining boundary conditions, such as meteorological parameters, remaining tributary inflow volumes and characteristics, and Colorado River inflow conditions such as DO and nutrients. Results from the LMM in this paper are presented at the modeled cell that contains the drinking water intake.
The entire three-part modeling framework, including inputs and outputs, is outlined in Figure 4.
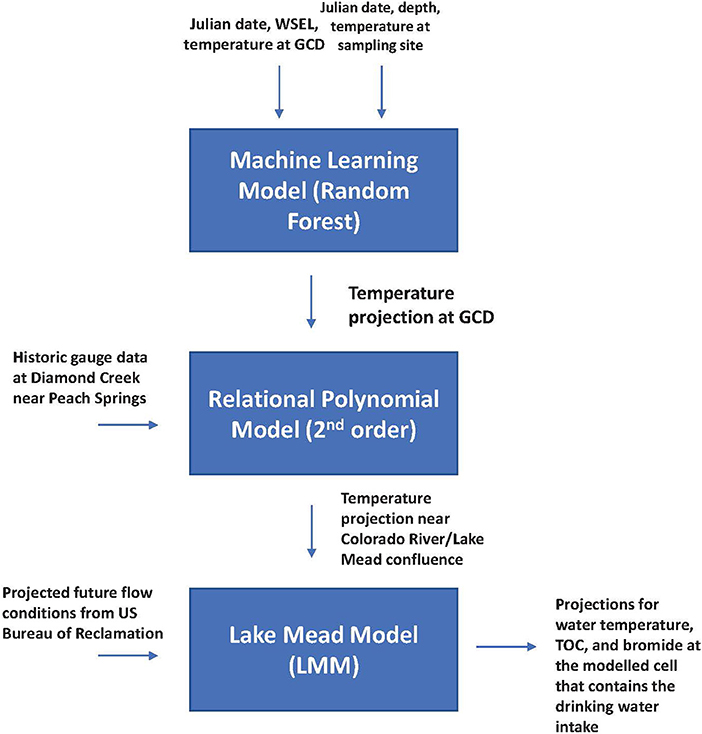
Figure 4. Three-part modeling framework.
F-test
The F-test is used in this analysis to quantify the contributions of predictor variables, in this case lake elevation and Colorado River influent temperature, on the resulting projected temperature at Intake 3 determined by the LMM. The F-test assigns p-values to each predictor, with a small p-value meaning the predictor is important. The algorithm reports -log(p) as scores, so higher scores again indicate more importance for the predictor (Rasmussen et al., 1996). The scores are summed and normalized to yield a percent contribution of each predictor to projected Intake 3 water temperature (Hannoun et al., 2021).
Results
Machine learning and polynomial models: Construction and validation
The random forest model for inflow temperature into Lake Mead was developed using training data from both historic GCD outflows and a sampling site located close to GCD. The model training set was taken as 50% of the available data at both sites from 2000 to 2019, and the remaining data was reserved as test data (Hegde et al., 2019). Model fit to training data yields an excellent R2-value of 0.962; the R2-value for the model applied to the test data nearly equals the test set at 0.945. These metrics show that the machine learning model is not only an excellent fit to historic data, but also a robust tool for future projections.
The relational polynomial model computes water temperature at Diamond Creek from 2010 to 2019 with an R2-value of 0.896. Convergence plots for both the machine learning and relational polynomial models are provided in Supplementary materials.
To further validate the temperature model, a hindcast, where the model is run and compared to a concrete historic event (Evans and Shen, 2021), was performed for the random forest temperature model from 2016 to 2019. Further, model projections for 2020 are included and are OOB as this year was not included in the test or training sets. The model shows excellent agreement to data for both locations per measures of mean absolute error (MAE), root mean square error (RMSE), and R2, even for OOB data (Figure 5; Table 2).
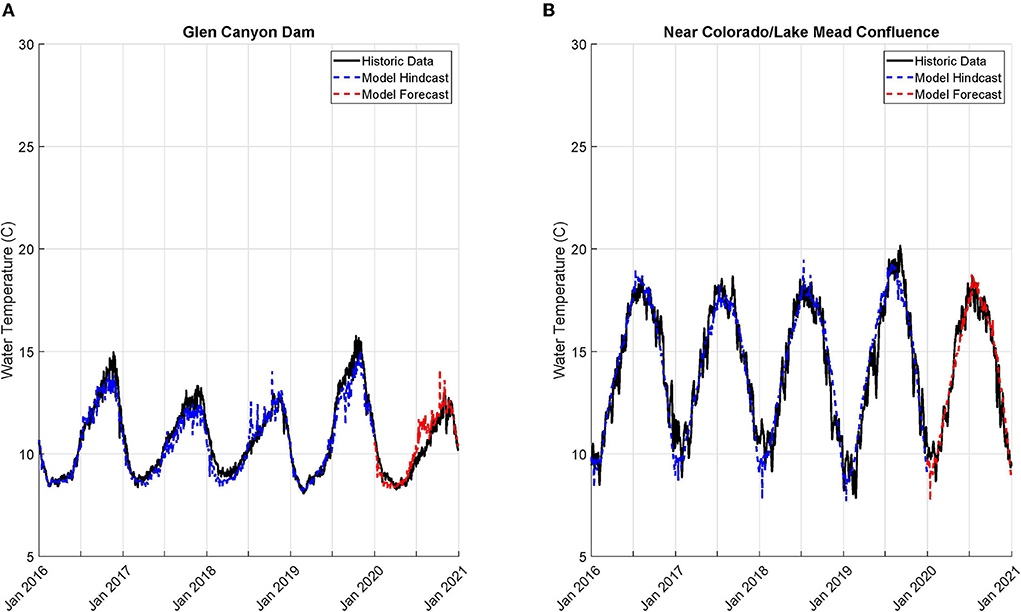
Figure 5. Hindcast and forecast for temperature model located at (A) GCD; and (B) downstream Diamond Creek.
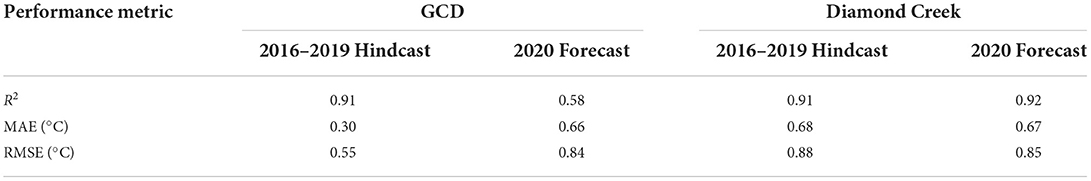
Table 2. Performance metrics for temperature model.
Machine learning and polynomial models: Projections
The temperature model is used to generate projections for water temperature based on Reclamation's 24MS predictions from 2022 to 2026. Model projections show seasonal trends present at Diamond Creek near the inflow to Lake Mead, with the minimum scenario producing the most warming, followed by the most probable and maximum (Figure 6).
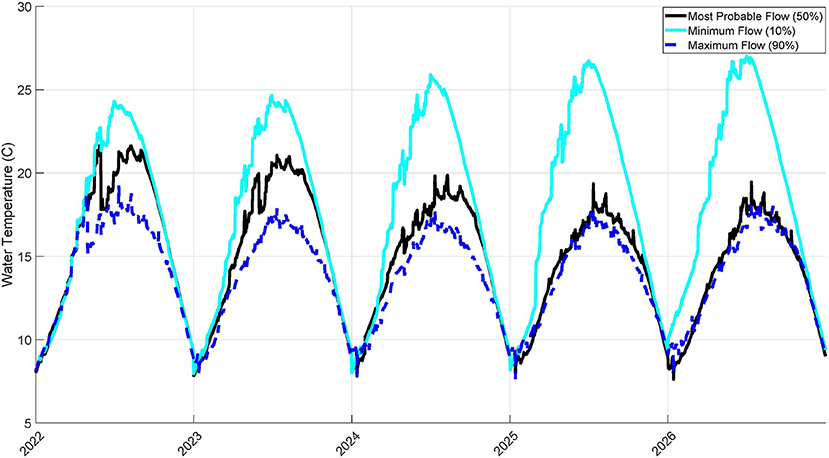
Figure 6. Projected inflow temperature entering Lake Mead.
These projected inflow temperatures are input into the LMM along with the corresponding projected inflow and outflow volumes from the 24MS model.
Lake Mead model
24MS flow scenarios
The results of Runs 2–4 represent a comprehensive view of projected future raw water quality at the modeled cell that contains the drinking water intake as a result of both loss of volume in Mead and potential warmer releases from GCD. Raw water temperature (Figure 7), bromide (Figure 8), and TOC (Figure 9) are compared across the 5-year simulation period. Historic baseline simulations (Run 1) are provided for comparison.
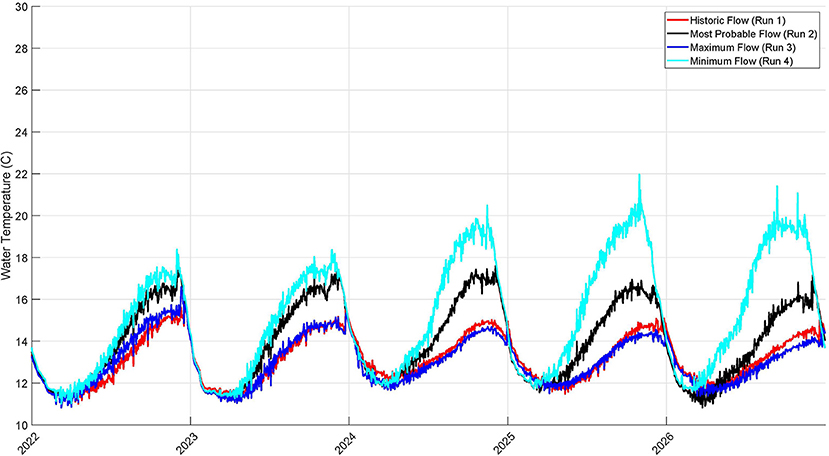
Figure 7. Projected raw water temperatures at Intake 3.

Figure 8. Projected raw water bromide at Intake 3.
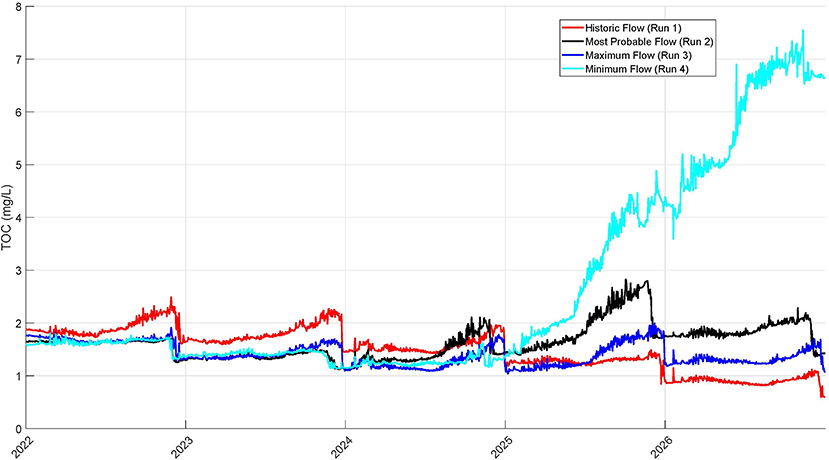
Figure 9. Projected raw water TOC at Intake 3.
Historic vs. projected inflow temperature
A pairwise comparison of simulations where the flow scenario is held constant and Colorado River inflow temperature into Mead is varied (historic vs. projected) shows that large changes to raw water temperature occur in the minimum scenario (Figure 10).
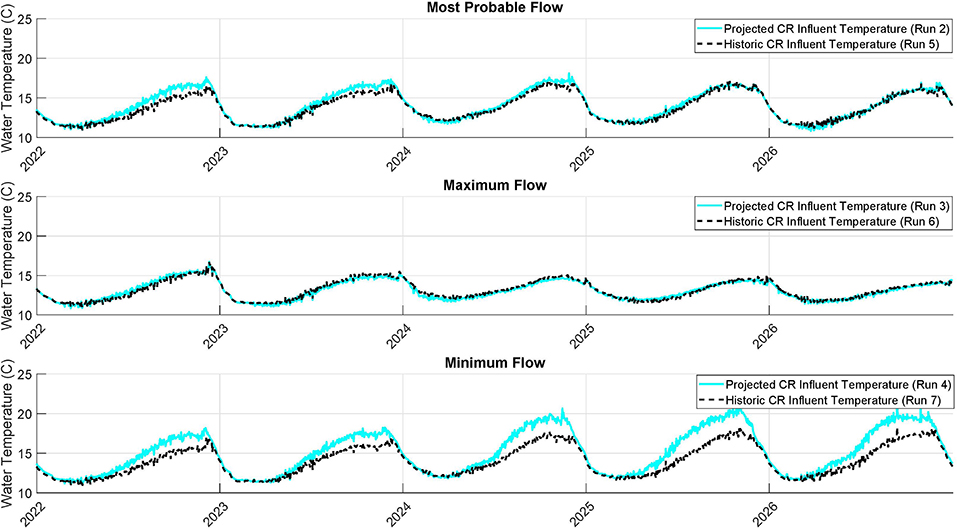
Figure 10. Effects of Colorado River temperature model on raw water temperatures at Intake 3.
F-test analysis
Results of the F-test algorithm show that lake elevation dominates water temperature at Intake 3, with contributions from Colorado River influent temperature becoming more important as more lake loss of volume occurs (Table 3).
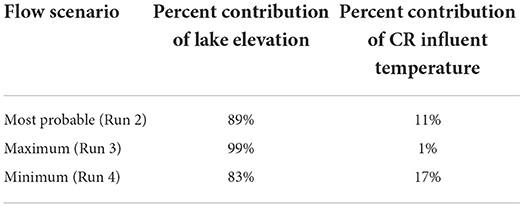
Table 3. F-test results to quantify the effect of predictors (lake elevation and Colorado River influent temperature) on intake 3 water temperature.
Discussion
This study presents a concrete replicable framework for projecting water temperature near a submerged structure such as an intake or dam outlet if one has water temperature profile data available nearby. The machine learning model presented here is validated through both a forecast and hindcast and overcomes traditional OOB error-related shortcomings by incorporating profile data in both the test and training data. Further, the relational polynomial model provides a framework for relating release temperature from a structure downstream based on a historic data set. Both models show strong agreement to calibration data and are suitable for incorporation into a forecast generated by a hydrodynamic and water quality model.
A three-dimensional hydrodynamic and water quality model, the LMM, is then used to project DBP risk at an urban drinking water intake. Water temperature values and bromide and TOC concentrations are projected from 2022 to 2026 as they contribute to DBP formation. This model is used for general future operations guidance as there is some uncertainty associated with model projections, not only from 24MS projections, but also from associated model error.
The LMM does not project changes in bromide in any scenario modeled as part of this study. Raw water temperature is projected to increase as a result of loss of volume in Lake Mead. The maximum scenario is consistent with historic raw water temperatures. The most probable scenario yields slightly warmer raw water temperatures; however, these temperatures are within the range of what the existing water treatment plants are capable of handling without major changes to the treatment process or significant infrastructure changes. The raw water temperatures projected under the minimum scenario project significant warming that could affect treatment processes, potentially increasing chemical costs. The F-test shows that Colorado River influent temperature into Lake Mead has a larger effect on raw water temperature with loss of volume from both Powell and Mead.
TOC maintains relatively constant and near historic levels in the maximum and most probable scenarios; however, a three-fold increase in TOC is projected in the minimum scenario in 2025 and 2026. An investigation of TOC dynamics at lower lake levels shows that below lake elevations of 1,017 ft (310 m), an inflection point appears where TOC begins to accumulate in the Colorado arm of Lake Mead (see Supplementary materials), directly below where the Colorado River enters Lake Mead. This accumulated TOC enters Boulder Basin by way of the Narrows as in interflow in the top and/or middle of the water column. This TOC is mostly comprised of dissolved labile organic carbon, and the model projects this accumulation as a result of both the relatively high background TOC in the Colorado River coupled with the shallower (<10 m) mean depth of the Colorado arm. Mean depth in the Colorado arm and mean maximum TOC in the Colorado arm are highly correlated (Spearman's rho: −80%; p < 0.01). This TOC plume is projected to propagate downstream to the drinking water intake, where there is still a strong negative correlation between mean depth in the Colorado arm and TOC concentration at the modeled cell that contains the intake (Spearman's rho: −64%; p < 0.01). If this phenomenon projected by the LMM occurs, warmer water coupled with a three-fold increase in TOC could potentially increase DBP formation and prompt re-evaluation of existing DBP mitigation strategies.
Data availability statement
The original contributions presented in the study are included in the article/Supplementary material, further inquiries can be directed to the corresponding author.
Author contributions
DH created the machine learning and polynomial temperature models and performed simulations and post-processing for the Lake Mead Model. TT contributed model conceptualization, data acquisition, and interpretation of results. All authors contributed with writing and editing, contributed to the article, and approved the submitted version.
Funding
This project was supported and funded by the Southern Nevada Water Authority.
Acknowledgments
The authors would like to thank Seth Shanahan for his support and guidance in constructing the machine learning and polynomial temperature models. They would also like to thank Daniel Chan, Robert Devaney, and Todd Pickle for assistance in understanding the treatment processes.
Conflict of interest
The authors declare that the research was conducted in the absence of any commercial or financial relationships that could be construed as a potential conflict of interest.
Publisher's note
All claims expressed in this article are solely those of the authors and do not necessarily represent those of their affiliated organizations, or those of the publisher, the editors and the reviewers. Any product that may be evaluated in this article, or claim that may be made by its manufacturer, is not guaranteed or endorsed by the publisher.
Supplementary material
The Supplementary Material for this article can be found online at: https://www.frontiersin.org/articles/10.3389/frwa.2022.983257/full#supplementary-material
References
Allan, M. G., Hamilton, D. P., and Muraoka, K. (2017). A Coupled Hydrodynamic-Ecological Model to Test Management Options for Restoration of Lakes Onoke and Wairarapa. Environmental Research Report No. 111, Hamilton: University of Waikato.
Amadori, M., Giovannini, L., Toffolon, M., Piccolroaz, S., Zardi, D., Brescani, M., et al. (2021). Multi-scale evaluation of a 3D lake model forced by an atmospheric model. Environ. Model. Software 139, 105017. doi: 10.1016/j.envsoft.2021.105017
Anderson, E. J., and Schwab, D. J. (2011). Relationships between wind-driven and hydraulic flow in Lake St. Clair and the St. Clair River Delta. J. Great Lakes Res. 37, 147–158. doi: 10.1016/j.jglr.2010.11.007
Bales, R. C., Molotch, N. P., Painter, T. H., Dettinger, M. D., Rice, R., Dozier, J., et al. (2006). Mountain hydrology of the western United States. Water Resour. Res. 42, 1–13. doi: 10.1029/2005WR004387
Brieman, L., Friedman, J., Olshen, R., and Stone, C. (1984). Classification and Regression Trees. Boca Raton, FL: CRC Press.
Chung, S. W., Hipsey, M. R., and Imberger, J. (2009). Modelling the propagation of turbid density inflows into a stratified lake: daecheong Reservoir, Korea. Environ. Model. Soft. 24, 1467–1482. doi: 10.1016/j.envsoft.2009.05.016
Chung, S. W., Imberger, J., Hipsey, M. R., and Lee, H. S. (2014). The influence of physical and physiological processes on the spatial heterogeneity of a Microcystis bloom in a stratified reservoir. Ecol. Model. 289, 133–149. doi: 10.1016/j.ecolmodel.2014.07.010
D'Errico, J. (2022). polyfitn. Available online at: https://www.mathworks.com/matlabcentral/fileexchange/34765-polyfitn (accessed June 30, 2022).
Dibble, K. L., Yackulic, C. B., Kennedy, T. A., Bestgen, K. R., and Schmidt, J. C. (2020). Water storage decisions will determine the distribution and persistence of imperiled river fishes. Ecol. Appl. 31, 2279. doi: 10.1002/eap.2279
Evans, F. H., and Shen, J. (2021). Long-term hindcasts of wheat yield in fields using remotely sensed phenology, climate data and machine learning. Remote Sens. 13, 2345. doi: 10.3390/rs13132435
Gao, Q., He, G., Fang, H., Bai, S., and Huang, L. (2018). Numerical simulation of water age and its potential effects on the water quality in Xiangxi Bay of Three Gorges Reservoir. J. Hydrol. 566, 484–499. doi: 10.1016/j.jhydrol.2018.09.033
Glen Canyon Dam Adaptive Management Program (2022). Temperature. Available online at: https://gcdamp.com/index.php?title=TEMPERATURE (accessed February 22, 2022).
Hannoun, D., Tietjen, T., and Brooks, K. (2021). The potential effects of drawdown on a newly constructed drinking water intake: study case in Las Vegas, NV. Water Utility J. 1, 1–13. Available online at: http://www.ewra.net/wuj/pdf/WUJ_2021_27_01.pdf
Hegde, C., Millwater, H., Pyrcz, M., Daigle, H., and Gray, K. (2019). Rate of penetration (ROP) optimization in drilling with vibration control. J. Natl. Gas Sci. Eng. 67, 71–81. doi: 10.1016/j.jngse.2019.04.017
Hodges, B., and Dallimore, C. (2013). Estuary, Lake, and Coastal Ocean Model: ELCOM v2, 2. Science Manual. Crawley, University of Western Australia.
Hueftle, S. J., and Stevens, L. E. (2001). Experimental flood effects on the limnology of lake powell reservoir, Southwestern USA. Ecol. Appl. 11, 644–656. doi: 10.1890/1051-0761(2001)011[0644:EFEOTL]2.0.CO;2
Hydronumerics (2020). AEM3D Overview. Available online at: http://www.hydronumerics.com.au/software/aquatic-ecosystem-model-3d (accessed June 17, 2022).
LaBounty, J. F., and Burns, N. M. (2005). Characterization of Boulder Basin, Lake Mead, Nevada-Arizona, USA – based on analysis of 34 limnological parameters. Lake Reser. Manag. 21, 277–307. doi: 10.1080/07438140509354435
Marti, C. L., Imberger, J., Garibaldi, L., and Leoni, B. (2016). Using time scales to characterize phytoplankton assemblages in a deep subalpine lake during the thermal stratification period: Lake Iseo, Italy. Water Resour. Res. 52, 1762–1780. doi: 10.1002/2015WR017555
Mathworks (2022). Documentation: TreeBagger. Available online at: https://www.mathworks.com/help/stats/treebagger.html (accessed June 17, 2022).
Milly, P. C. D., and Dunne, K. A. (2020). Colorado river flow dwindles as warming-driven loss of reflective snow energizes evaporation. Science 367, 1252–1255. doi: 10.1126/science.aay9187
Moran, M. J., Shapiro, H. N., Boettner, D. D., and Bailey, M. B. (2014). Fundamentals of Engineering Thermodynamics. New York, NY: Wiley and Sons.
O'Sullivan, D., and Chen, Y. (2020). CWITools: A Python3 Data Analysis Pipeline for the Cosmic Web Imager Instruments. Pasadena, CA: CWITools.
Preston, A., Hannoun, I. A., List, E. J., Rackley, I., and Tietjen, T. (2014a). Three-dimensional management model for Lake Mead, Nevada, part 1: model calibration and validation. Lake Reserv. Manag. 30, 285–302. doi: 10.1080/10402381.2014.927941
Preston, A., Hannoun, I. A., List, E. J., Rackley, I., and Tietjen, T. (2014b). Three-dimensional management model for Lake Mead, Nevada, Part 2: Findings and applications. Lake Reserv. Manag. 30, 303–319. doi: 10.1080/10402381.2014.927942
Rasmussen, C. E., Neal, R. M., Hinton, G. E., van Camp, D., Revow, M., Ghahramani, Z., et al. (1996). The DELVE Manual. Toronto, ON.
Saber, A., James, D. E., and Hannoun, I. A. (2020). Effects of lake water level fluctuation due to drought and extreme winter precipitation on winter mixing and water quality on an alpine lake, case study: Lake Arrowhead, California. Sci. Total Environ. 714, 136762. doi: 10.1016/j.scitotenv.2020.136762
Sadiq, R., and Rodriguez, M. J. (2004). Disinfection by-products (DBPs) in drinking water and the predictive models for their occurrence: a review. Sci. Total Environ. 321, 21–46. doi: 10.1016/j.scitotenv.2003.05.001
Smith, R. C. (2014). Uncertainty Quantification: Theory, Implementation, and Applications. Philadelphia, PA: SIAM.
Taylor, J., Hondzo, M., and Voller, V. R. (2021). Abiotic Drivers of a Deep Cyanobacteria Layer in a Stratified and Eutrophic Lake. Water Resour. Res. 57, 987. doi: 10.1029/2020WR027987
Udall, B., and Overpeck, J. (2017). The twenty-first century Colorado River hot drought and implications for the future. Water Resour. Res. 53, 2404–2418. doi: 10.1002/2016WR019638
United States Bureau of Reclamation (2022a). Colorado River System Projections Overview. Available online at: https://www.usbr.gov/lc/region/g4000/riverops/crss-5year-projections.html (accessed February 16, 2022).
United States Bureau of Reclamation (2022b). 5-Year Probabilistic Projections. Available online at: https://www.usbr.gov/lc/region/g4000/riverops/crss-5year-projections.html (accessed June 29, 2022).
United States Environmental Protection Agency (1998). Final Stage 1 DBPR. Washington, DC: United States Environmental Protection Agency
United States Geological Survey (2022). National water information system: Colorado River above Diamond Creek near Peach Springs, AZ. Available online at: https://www.gcmrc.gov/discharge_qw_sediment/station/GCDAMP/09404200 (accessed February 23, 2022).
Valade, M. T., and Fulton, G. P. (2012). “Master planing and treatment process selection,” in Water Treatment Plan design, ed. American Water Works Association (Denver: McGraw Hill).
Valdivia-Garcia, M., Weir, P., Graham, D. W., and Werner, D. (2019). Predicted impacts of climate change on trihalomethanes formation in drinking water treatment. Sci. Rep. 9, 9967. doi: 10.1038/s41598-019-46238-0
Wang, J., Udall, B., Kuhn, E., Wheeler, K., and Schmidt, J. C. (2022). Evaluating the Accuracy of Reclamation's 24-Month Study Lake Powell Projections. White Paper No. 7, Logan, UT: Center for Colorado River Studies.
Wright, S. A., Anderson, C. R., and Voichick, N. (2009). A simplified water temperature model for the Colorado River below Glen Canyon Dam. River Res. Appl. 25, 675–686. doi: 10.1002/rra.1179
Yousefi, A., and Toffolon, M. (2022). Critical factors for the use of machine learning to predict lake surface water temperature. J. Hydrol. 606, 127418. doi: 10.1016/j.jhydrol.2021.127418
Zamani, B., Koch, M., and Hodges, B. R. (2021). A potential tipping point in the thermal regime of a warm monomictic reservoir under climate change using three-dimensional hydrodynamic modeling. Inland Waters 11, 315–334. doi: 10.1080/20442041.2021.1918510
Zamani, K. (2014). Effect of Glen Canyon Dam on the Temperature Regime of Colorado River. (PhD thesis). University of California, Davis, USA.
Keywords: AEM3D, source water, water quality, drought, machine learning, modeling
Citation: Hannoun D and Tietjen T (2022) A three-part coupled statistical and physical model to monitor water quality parameters governing disinfection byproduct risk at an urban drinking water intake. Front. Water 4:983257. doi: 10.3389/frwa.2022.983257
Received: 30 June 2022; Accepted: 16 August 2022;
Published: 16 September 2022.
Edited by:
Ali Saber, University of Toronto, CanadaReviewed by:
Alban Kuriqi, Universidade de Lisboa, PortugalSalim Heddam, University of Skikda, Algeria
Copyright © 2022 Hannoun and Tietjen. This is an open-access article distributed under the terms of the Creative Commons Attribution License (CC BY). The use, distribution or reproduction in other forums is permitted, provided the original author(s) and the copyright owner(s) are credited and that the original publication in this journal is cited, in accordance with accepted academic practice. No use, distribution or reproduction is permitted which does not comply with these terms.
*Correspondence: Deena Hannoun, ZGVlbmEuaGFubm91bkBzbndhLmNvbQ==