- Department of Electrical, Information and Bioengineering, Politecnico di Milano, Milan, Italy
Objective: This study aims to investigate the impact of stimulus environments (Virtual Theatre vs Monitor) and error probabilities (
Approach: EEG signals were recorded using different protocols, and features were extracted for subsequent analysis from single-trial response and attention level was computed from the second preceding error processing stimulation.
Results: The results indicate significant differences across conditions: the Monitor environment consistently elicited higher and faster ErrP responses and elevated attentional states compared to Virtual Theatre. Additionally, classification performance in the Monitor environment outperformed Virtual Theatre consistently. Further analysis revealed that the
Relevance: These findings underscore the importance of considering stimulus environments and error probabilities in cognitive neuroscience research and machine learning applications. Understanding these factors can inform experimental design and model development, ultimately advancing our comprehension of cognitive processes and enhancing real-world applications of machine learning algorithms.
1 Introduction
In recent years, significant progress has been made in the development of Brain-Computer Interfaces (BCIs) that enable the control of external devices by interpreting brain activity (Wolpaw et al., 2000). The electroencephalographic (EEG) signal plays a crucial role in this process, but it is inherent complexity and stochastic nature make reliable and accurate classification of brain activity challenging. Consequently, BCI systems may misinterpret user intentions, leading to errors (Lotte et al., 2018). Such misclassifications can have a detrimental impact on system performance and easily frustrate users (Spuler et al., 2012).
To address these challenges and improve the accuracy of BCI systems, researchers have investigated the use of Error Potentials (ErrP) (Buttfield et al., 2006; Chavarriaga et al., 2010). ErrP is an evoked potential that occurs when a subject perceives an error, whether self-generated, generated by another subject, or by an external device such as a BCI system (Falkenstein et al., 2000; Fu et al., 2023). Detecting ErrP during a BCI experiment enhances classification accuracy, enabling the system to repeat tasks that resulted in erroneous outcomes. For instance, Dal Seno et al. (2010) utilized detected ErrP signals to correct the output of a P300 speller, and their study demonstrated improved classification performance of the overall BCI system.
The ErrP is an innate response to erroneous events whose characteristic waveform features a negative peak at around 250 m after the error, followed by a positive peak at 320 m and a subsequent negative peak at 450 m. In terms of frequency content, the EEG signal recorded after an error event is particularly prominent in the delta (1–3 Hz) and theta (5–8 Hz) brain rhythms Ferrez et al. (2008). However, the extent to which cognitive abilities affect the temporal and frequency characteristics of ErrP signals remains unclear (Farabbi and Mainardi, 2022). Specifically, limited research has investigated whether a subject’s level of attention during ErrP-based BCI experiments can influence the evoked ErrP response to errors.
Moreover, the influence of environmental factors on ErrP elicitation remains poorly understood, despite the growing integration of Augmented or Virtual Reality environments in modern BCI systems. Vourvopoulos et al. (2019) utilized a virtual reality (VR) setup to simulate rowing a boat and facilitate upper limb Motor Imagery in stroke patients. Similarly, Škola and Liarokapis (2018) employed VR to enhance Motor Imagery in a video game contest, leading to a more engaging protocol and a heightened sense of embodiment for the participants. Those studies investigate Motor Imagery but, considering the rising interest in VR/AR environments for BCI systems, it becomes also crucial to investigate the impact of such environments on innate brain responses, such as ErrP, which currently remains unclear.
Several studies have investigated the impact of virtual reality environments on cognitive processing and task performance. Of particular relevance to our research, Szpak et al. (2019) demonstrated that VR exposure can induce significant alterations in visual processing and cognitive performance that persist beyond the immediate VR experience. These effects were found to be independent of traditional cybersickness symptoms, suggesting a distinct cognitive adaptation mechanism to virtual environments, especially in subjects with few experience in using VR systems. Additionally, Mittelstadt et al. (2019) explored how VR-based training environments affect cognitive load and task performance, finding that the virtual environment itself can impose additional cognitive demands on users, potentially affecting their ability to process and respond to stimuli effectively.
One study by Falkenstein et al. (1995) investigated the effects of error feedback probability on event-related brain potentials (ErrP) and attentional mechanisms. The researchers found that when participants were less likely to receive erroneous feedback, there was a significant increase in the amplitude of the ErrP component, suggesting heightened neural responses to errors. This enhanced ErrP response was indicative of greater attentional resources being allocated towards error processing. Similar findings were found in the studies by Feng et al. (2020).
Furthermore, another study by Hajcak et al. (2003) explored the impact of varying error feedback probabilities on attentional mechanisms. They observed that lower error rates led to improved performance on subsequent tasks requiring error monitoring, indicating a beneficial effect of increased error feedback probability on cognitive control strategies.
In addition, research by Gehring and Fencsik (2001) studied the neural mechanisms underlying error processing in the context of different error feedback probabilities. They proposed that variations in error feedback likelihood could modulate the activity of the anterior cingulate cortex, a brain region implicated in error monitoring and cognitive control. Specifically, higher error rates were associated with greater activation in the anterior cingulate cortex, suggesting a link between error feedback probability, neural responses to errors, and attentional mechanisms.
In other Evoked Potentials stimulations, as visual P300 elicitation, it is usually implemented an oddball paradigm, where an odd (less likely stimulus) is alternated with a standard stimulus (more likely stimulus). Various studies affirm that odd stimuli are able to elicit a more pronounced response as reported in Verleger and Śmigasiewicz (2020) and De Venuto and Mezzina (2021).
In view of the aforementioned considerations, this study investigates if variations in attention and engagement levels (provided by different environments) can modulate the brain’s response to error and potentially affect its perception. To accomplish this, we devised an innovative protocol called “Racing Mistakes” to elicit ErrP within a gaming environment. The protocol was implemented in two distinct settings: a conventional monitor-based setup and an immersive VR room. Subsequently, only in the Monitor setting, the protocol was tested again lowering the probability of giving an erroneous feedback to
Based on the previous considerations, we hypothesize that both the experimental environment and error probability will significantly influence subjects’ brain responses to errors. Specifically, we expect that the VR environment will produce a dual effect: while increased immersiveness should enhance attention and potentially strengthen error detection mechanisms, subjects’ limited familiarity with VR technology might introduce additional cognitive load, potentially interfering with error processing and distracting the user from the task. Additionally, we hypothesize that reducing error probability to 20% will enhance the amplitude of the ErrP response, similar to the increased neural responses observed in other evoked potentials under oddball paradigms. Both factors are expected to modulate subjects’ attention levels throughout the experimental protocols.
This research aims to shed light on the potential impact of environmental factors, probability of erroneous feedback and attention on the processing of errors and the subjective perception thereof.
2 Materials and methods
2.1 ErrP stimulation protocols
To investigate the differences in ErrP response and attentional states introduced by different environments and the probability of erroneous events a specific experimental protocol was designed. A cohort of 17 university students (7 male, mean age:
Each participant experienced a total of 20 checkpoints during the data acquisition process. The stimuli were presented in two distinct environments across two different sessions in a within participants experimental design in order to assess differences between environments. We randomised which session each participant completed first to prevent order effects from biasing the results. One session occurred in a laboratory setting, where participants viewed the video on a high-quality RGB monitor (resolution of 1,280 × 1,024 and an 8-bit intensity) ensuring optimal visual presentation. The other session occurred in a Virtual Theatre (VT) equipped with Virtual Reality technology. The VT is designed as a
The participants were tested three times consecutively throughout each session with a 2-minute break between each acquisition. The diagram of the complete protocol is depicted in Figure 1. The complete experimental procedure lasted approximately 1 hour per participant. This included 20 min for EEG setup and subject preparation, 10 min for computer setup, and approximately 15 min for the experimental trials. The trial period consisted of three 3-minute trials, with 2-minute breaks between each trial.
Following the acquisition in both settings, the decision was made to expand our protocol within Monitor environment to another group with identical numbers, but with a
All participants signed an informed consent before participating in the study and the protocol was approved by Ethics Committee of Politecnico di Milano (Opinion n.29/2021).
2.2 Data acquisition and pre-processing
During each session, the EEG signals were recorded (512 Hz, sampling rate) using a cuff equipped with 64 electrodes and conductive gel, which were carefully placed on the subject’s scalp. The EBNeuro BE Plust LTM amplifier (EBNEURO, Florence, Italy) was used to acquire the signals and to transmit them to a PC via Bluetooth. In order to achieve accurate synchronization of the EEG signals with specific events, such as the timing of erroneous or correct movements of the car, the timing of the trigger was sent to the PC using the Lab Streaming Layer protocol.
The recorded EEG signal underwent several pre-processing steps. First, the signal was band-pass filtered (1–40 Hz) using a 5th-order Butterworth filter to attenuate high-frequency components associated with muscle activity and to preserve frequency information relevant for our analysis. Subsequently, channels exhibiting poor quality were identified and eliminated. These channels may have been affected by electrode issues, resulting in little or no detectable activity. To address artefacts originating from various sources such as blinking or saccadic eye movements, Independent Component Analysis (ICA) was employed. To mitigate the influence of common noise shared across channels, the Common Average Rereferencing technique was utilized. As a final step, the previously removed channels were treated as missing data and introduced into the EEG data through spatial interpolation.
2.3 Single trial estimation
To extract single-trial ErrP responses, we employed a single–sweep analysis based on the Subspace Regularization method (Vauhkonen et al., 1998). The method represents the recorded EEG signal (
where the source signal is estimated as a linear combination of basis vectors (i.e.,
where
2.4 Data analysis
The EEG signal was comprehensively analyzed in temporal, frequency, and spatial domains to gain a thorough understanding of the brain’s response following erroneous stimulation and to compare these responses between the two environments.
2.4.1 Time and frequency domain features
Time and frequency domain features were extracted from the sources
In the frequency domain, the Power Spectral Density (PSD) of the ErrP (segments long 1s after error stimulus onset) was calculated using the Welch method, and the amplitudes of the highest peaks in the
2.4.2 Time-frequency features
Event-Related Spectral Perturbation (ERSP) (Makeig, 1993) was computed for the ErrP trials in both environments to provide a simultaneous description of the ErrP-related response in both the time and frequency domains. ERSP describes the average changes in power with respect to a baseline level. The Wavelet Transform, specifically the Morlet wavelet, was employed to extract frequency information over time. The ERSP was calculated for all channels using the formula in Equation 3:
where
2.4.3 Spatial features
Spatial features were analyzed to examine the spatial characteristics of the ErrP response. The ERSP averaged across the
2.4.4 Attention features
In this study, we analyzed attentional features gleaned from previously published literature (Lutsyuk et al., 2006; Ke et al., 2021; Braboszcz and Delorme, 2010; Bacigalupo and Luck, 2019; Ogrim et al., 2012; Gola et al., 2013; Barry et al., 2003). The primary objective of the chosen studies was to quantitatively evaluate the attentional states of individuals without cognitive disorders while engaging in various tasks, such as those encountered in work or educational settings. Conversely, certain studies aimed to explore differences in these parameters between individuals without cognitive disorders and those with attention-related cognitive impairments. The selected parameters are delineated in Table 1, wherein each parameter specifies the frequency band under analysis, the measurement zone, and the correlation between the parameter and attention levels. These features were derived from the frequency analysis of Section 2.4.1 and were computed in the second preceding the erroneous stimulus.
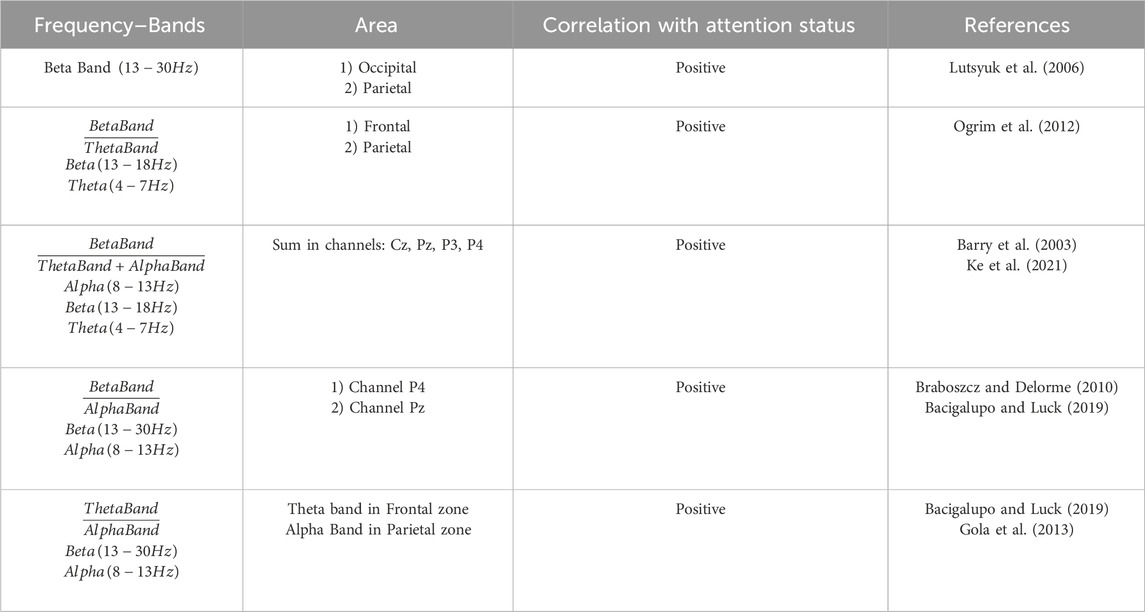
Table 1. Parameters for quantitative assessment of attention status. The frequency bands considered, the measurement area and the correlation with the attention state are shown.
2.4.5 Statistical analysis
To evaluate the differences between the two environments, as the data did not adhere to normal distributions, we employed the Mann-Whitney rank-sum test. This statistical test was utilized to assess significant differences between the environments and between surprise levels specifically in relation to the temporal and frequency domains of electrodes FCz and Cz.
Permutation statistics were employed to focus the analysis solely on significant values of the ERSP. This involved zeroing out non-significant features in the output plots, enabling a more targeted investigation. All statistical comparisons were performed using MATLAB R2021a, with a significance level set at
2.5 ErrP classification
The examination of ErrP elicitation differences has extended to assessing classification performance in discerning between erroneous and correct events. To achieve this objective, an LDA classifier will be trained for each environment and each level of surprise, utilizing ErrP temporal and frequency domain features outlined in Section 2.4.1.
Model validation is executed through a 5-fold cross-validation approach. Balancing of the training set is accomplished utilizing the ARX method expounded in Farabbi et al. (2022). The ARX model combines background EEG activity with characteristic error-related waveforms and can be expressed as in Equation 4:
where
Model identification is performed by estimating the coefficients through least squares optimization as described in Equation 5:
where
For data augmentation, we generate synthetic epochs by applying three distinct modifications to the exogenous input. First, as reported in Equation 6, amplitude scaling modifies the waveform magnitude:
Second, we introduce additive white noise with zero mean and variable standard deviation as in Equation 7:
Finally, in Equation 8, temporal warping is applied to modify the signal timing:
These transformations, applied individually or in combination, generate diverse yet physiologically plausible synthetic ErrP epochs while maintaining the essential characteristics of the original signals.
We evaluate model performance comprehensively using balanced accuracy, precision, recall, and F1-score on both validation and test data.
3 Results
This section presents the outcomes of the comparison between two distinct environments for ErrP elicitation, namely, the Monitor and VT, followed by a comparison based on the probability of error occurrence (i.e.,

Figure 2. Grand Averages of ErrP trials for one subject in the Monitor (left) and VT (right) environments for electrodes Cz (blue) and FCz (orange) with the related confidence interval.
3.1 Monitor vs. Virtual Theatre
3.1.1 Neurophysiological response
The observed qualitative differences in the Grand Averages are further supported by the distribution of computed time domain features, as presented in Figure 3A. This figure provides information on the medians, 25th and 75th quartiles of each feature’s distribution in the Monitor and VT environments, specifically for electrodes FCz and Cz. All the reported features show significant differences in the two environments
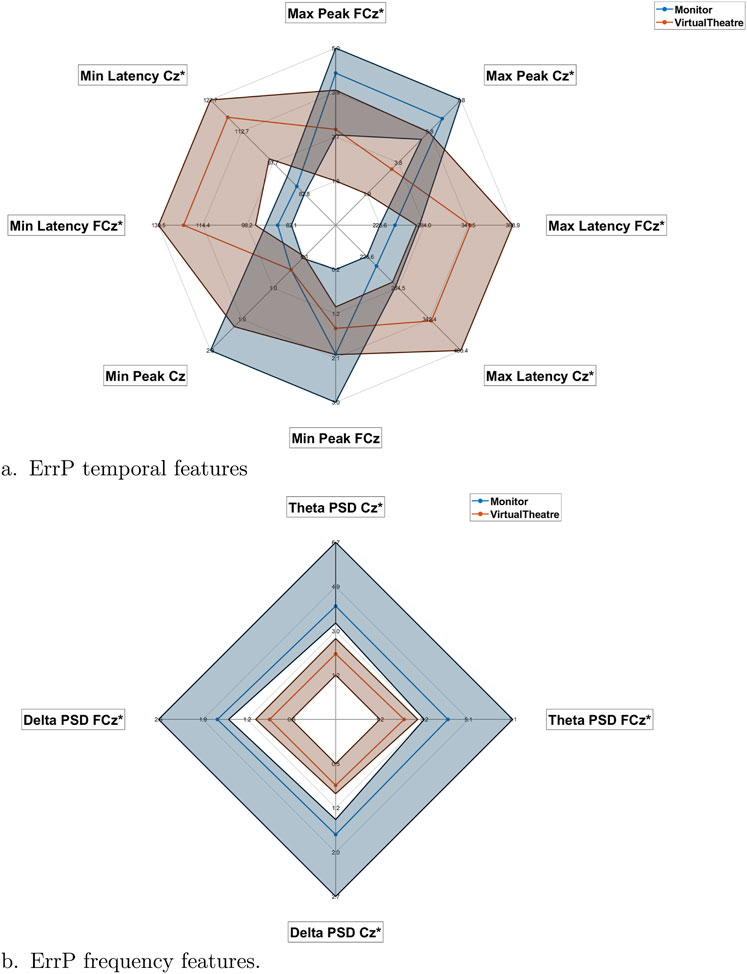
Figure 3. Radar plots of the temporal (A) and frequency (B) features for the Monitor (blue) and VT (orange). For both classes and each feature is reported shaded the interquartile range.
The frequency domain features further substantiate the presence of differences between the two environments. The comparison of average PSD values in the
The results of ERSP analysis of electrodes Cz and FCz in both environments is depicted in Figures 4A, B. These figures provide insights into the observed activation patterns and differences between the two environments. In the Monitor environment, notable activation is observed in the expected frequency bands and latencies. Furthermore, after 400 ms, this activation extends to the alpha band. Conversely, in the VT environment, the activation is nearly absent in electrode FCz, and there is a delay in activation observed in electrode Cz. Both plots also include a representation of the difference in activation between the Monitor and VT environments. The image supports the findings reported before, with a higher activity in the Monitor environment. Figure 5 illustrates the spatial ERSP at 100, 300 and 500 ms in the two different stimulation environments, as well as for the
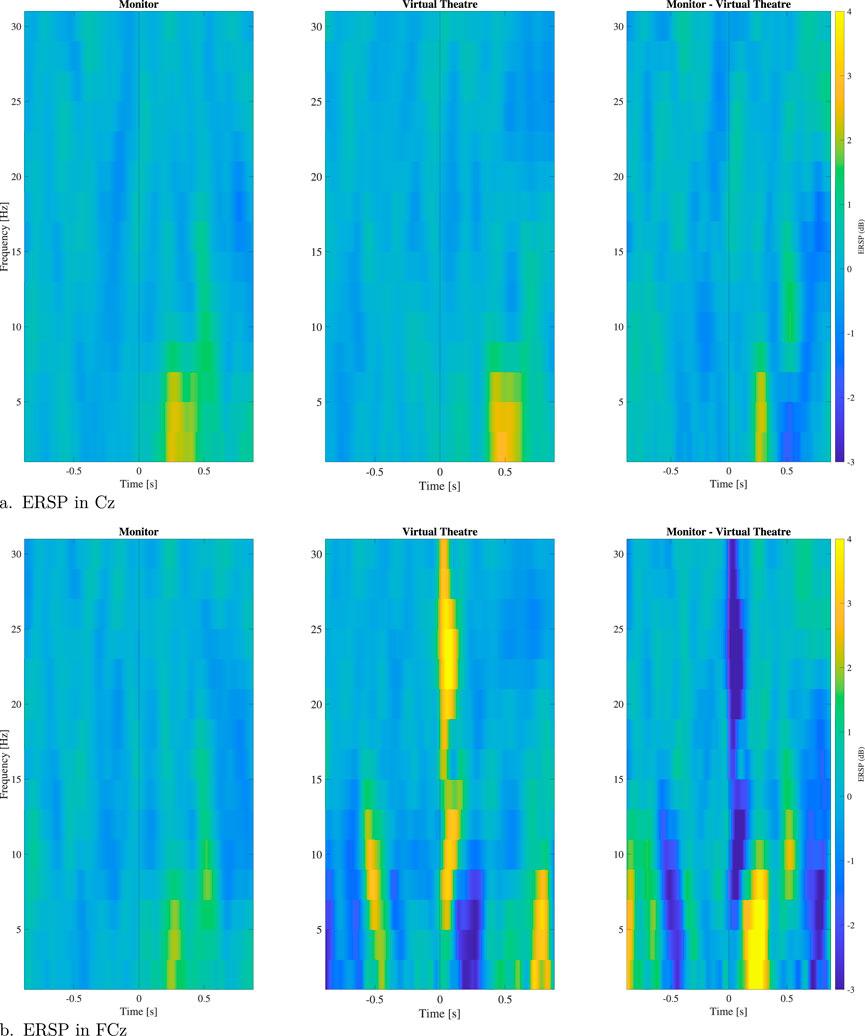
Figure 4. ERSP for electrodes Cz (A) and FCz (B) in the VT and Monitor environments and difference of the two environments. In the plot are reported just significant values along trials.

Figure 5. Topoplots of ERSP at 300 ms (left) and 500 ms (right) after the stimulus in Monitor and VT environments and in the
Concerning the difference in the attentional state between the two environments, the violinplots showing significant differences for each considered attention related feature are reported in Figure 6. We can notice that for all features the Monitor stimulation resulted in a significantly higher attentional state if compared to the VT environment.
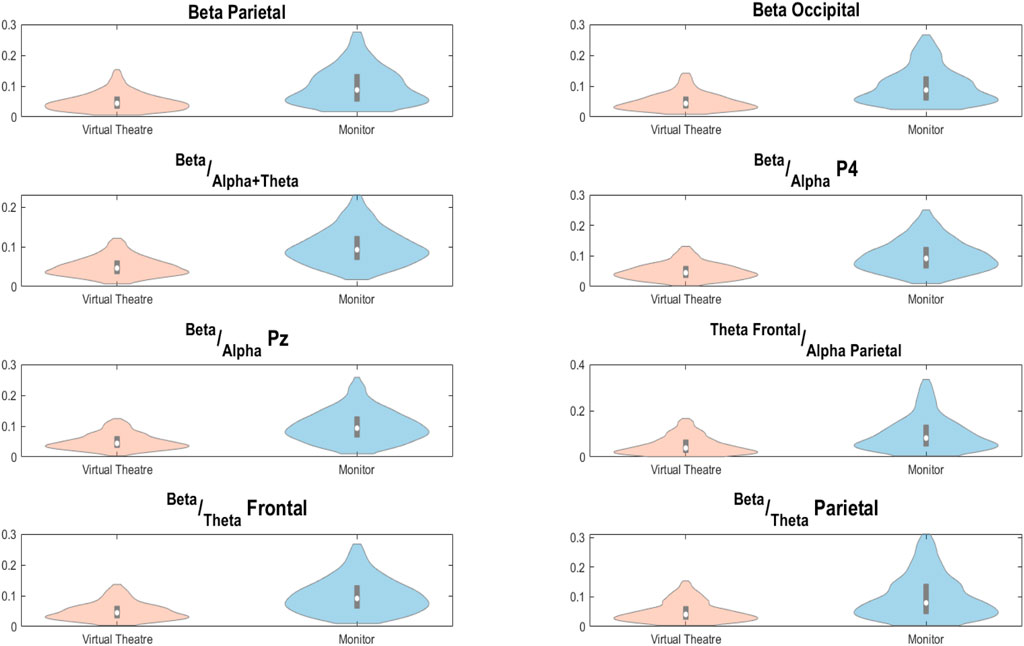
Figure 6. Distributions of examined attention related features for the VT (in orange) and the Monitor (in blue) environments.
3.1.2 Classification performance
The performance of the LDA classifier in discriminating between ErrP and Non-ErrP epochs can be observed in both Monitor (blue) and VT (orange) environments for validation and test sets (cf. Figure 7). It is worth noticing that for all the considered metrics the Monitor environment results in better performance both in validation and test set. Moreover, the Monitor environment always resulted in performance over the
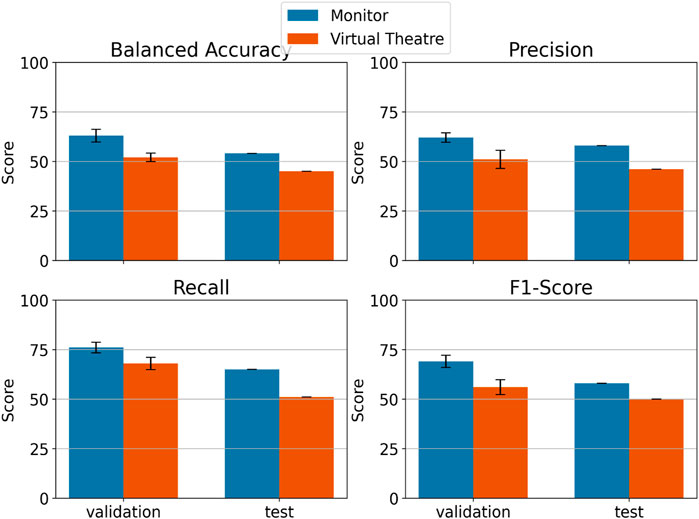
Figure 7. LDA classification performance in distinguishing between ErrP and Non–ErrP epochs using data coming from VT (in orange) and Monitor (in blue) environments. For validation set is reported the mean of the 5 folds cross validation and the standard deviation.
3.2 Surprise effect on ErrP realization
The results presented for the two environment now will be presented for the two levels of probability of error happening (i.e.,:
3.2.1 Neurophysiological response
Also when comparing the protocols with different probabilities of erroneous outcomes some differences can be noticed.
Illustrated in Figure 8, the ErrP Grand Average for one subject as an example, reveals the attainment of typical ErrP responses in both protocols across different surprise levels. Notably, the latencies of ErrP characteristic peaks for electrodes Cz (left) and FCz (right) approximate
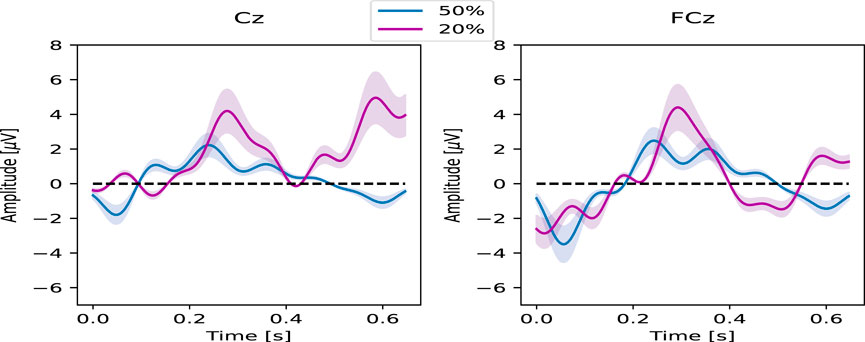
Figure 8. Grand Averages of ErrP trials for one subject in the 20% (in purple) and 50% (in blue) probability for electrodes Cz (left) and FCz (right) with the related confidence interval.
Details of the ErrP characteristics in time and frequency domains for the single trials are reported in Figure 9. In particular from Figure 9A can be observed that significantly higher peaks, both positive and negative, are obtained in the protocol with a
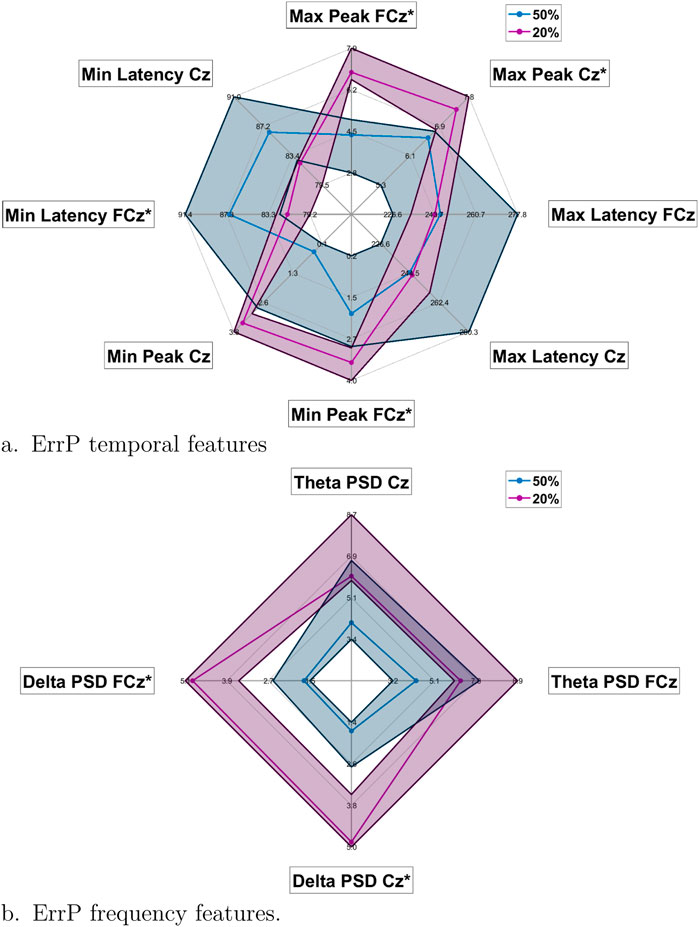
Figure 9. Radar plots of the temporal (A) and frequency (B) features for 20% probability of error events protocol (purple) and the 50% one (blue). For both classes and each feature is reported shaded the interquartile range.
The results of the time-frequency analysis in the two different protocols are reported as spectrograms in Figure 10 in terms of ERSP. Both for electrodes Cz and FCz no main differences are reported with a slightly more pronounced activation in the
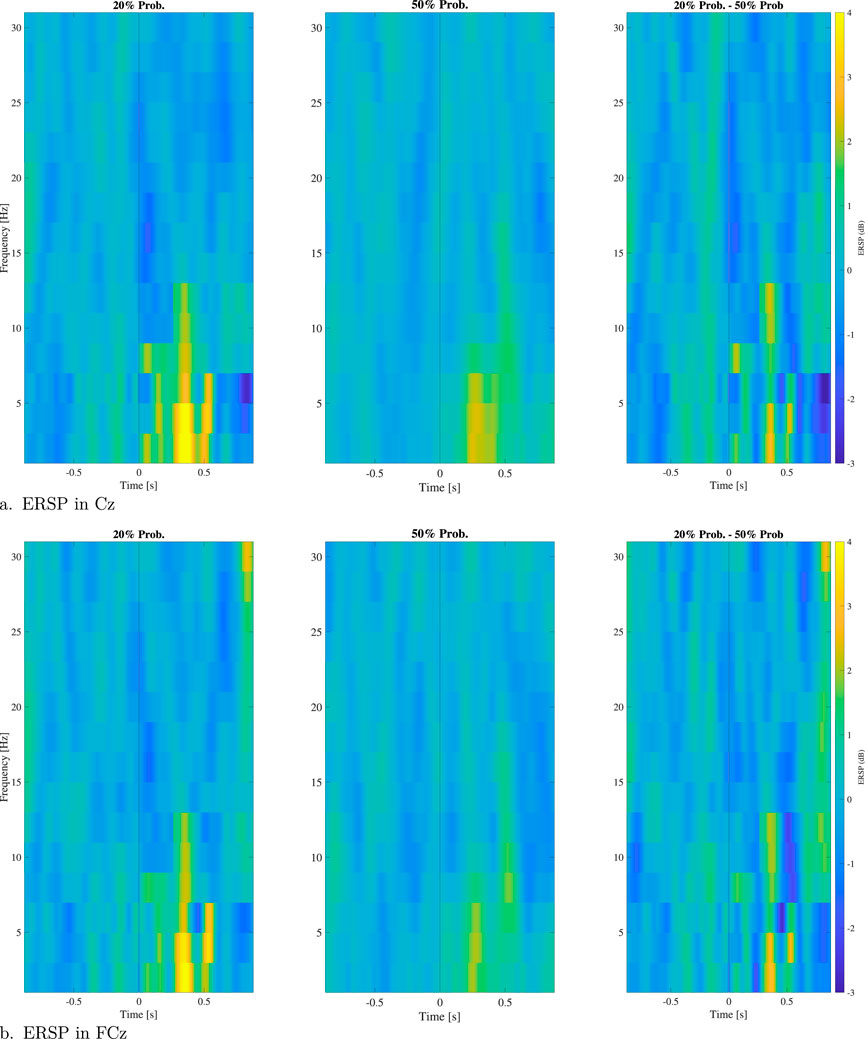
Figure 10. ERSP for electrodes Cz (A) and FCz (B) in the 20% probability of error events protocol and the 50% one and difference of the two environments. In the plot are reported just significant values along trials.

Figure 11. Topoplots of ERSP at 300 ms (left) and 500 ms (right) after the stimulus in the two protocols with different probability of error events and in the
The analysis of the attention levels during the two protocols with different error probabilities is reported in Figure 12 using violin plots.
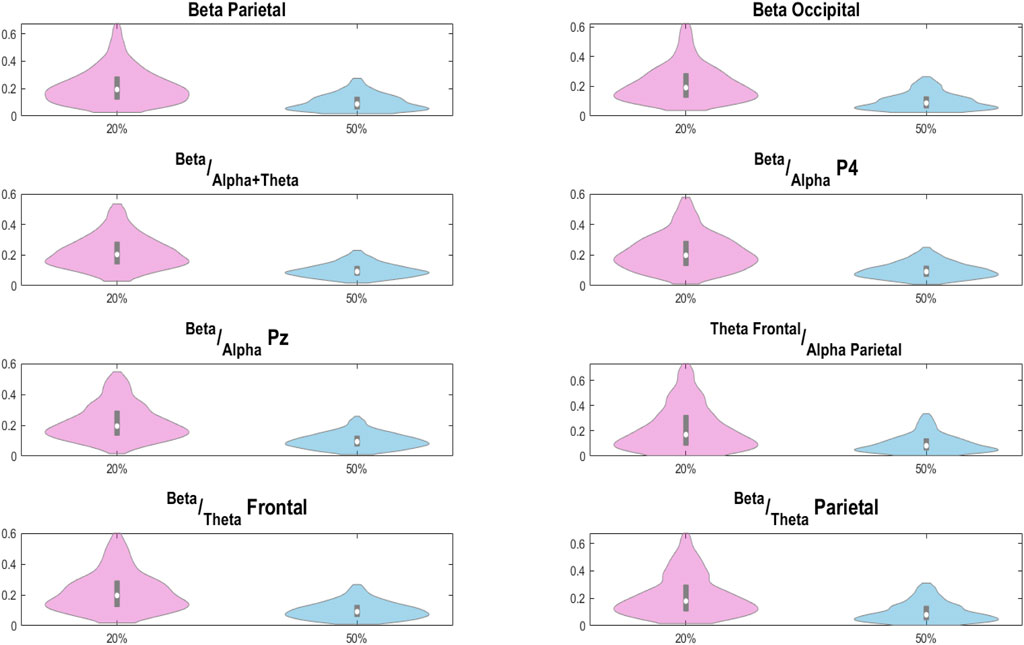
Figure 12. Distributions of examined attention related features for the 20% probability of error events protocol (in purple) and the 50% one (in blue).
In this case, for all the attention–related features examined, when using a
Table 2 reports the significant

Table 2. Significant correlation values between ErrP characteristics and EEG attention–related features in the 20% protocol.
3.2.2 Classification performance
Figure 13 displays the performance of an LDA classifier tasked with distinguishing between ErrP and Non-ErrP epochs in the context of the 20% error probability (depicted in blue) and the 50% probability (depicted in orange) protocols across validation and test sets.
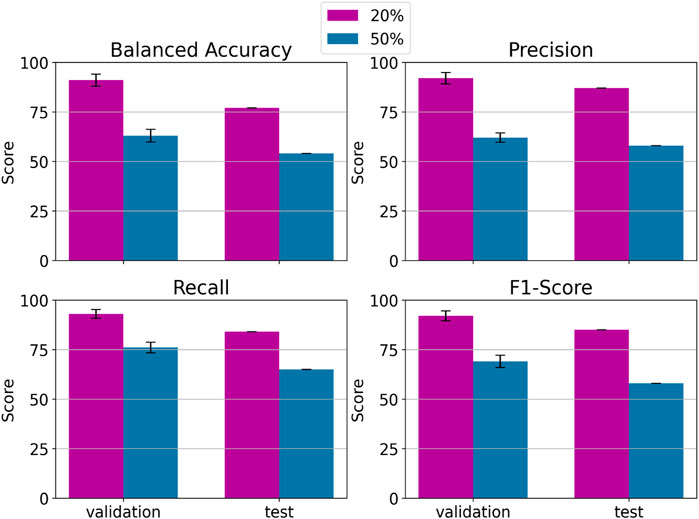
Figure 13. LDA classification performance in distinguishing between ErrP and Non–ErrP epochs using data coming from the 20% probability of error events protocol (in purple) and the 50% one (in blue). For validation set is reported the mean of the 5 folds cross validation and the standard deviation.
It is noteworthy that, across all evaluated metrics, the 20% error probability protocol consistently yields superior performance in both validation and test sets. Specifically, the 20% error probability protocol consistently achieves performance surpassing the
4 Discussions
In this paper, we examined two comparisons centered around the ErrP response and attention levels. The first of these comparisons analyzes the influence of the stimulation environment, specifically putting the Monitor environment against the VT setting in a within participants experimental design. Both environments utilized a crafted Unity stimulation protocol featuring a car-driving game where participants faced the prospect of missing targets. Remarkably, despite the correctness of the ErrP stimulation in both environments, distinctions emerged.
Within the Monitor environment, a discernibly higher amplitude of ErrP response unfolded across various dimensions: time, frequency, space, and time-frequency. This was accentuated by a faster and more pronounced response when compared to the VT environment. While these findings are preliminary due to our limited sample size the implications of this variance point towards the possibility that subjects, not used and untrained in the use of VR systems, may have exhibited different neural responses in these distinct environments. These results align with previous research investigating the relationship between VR usage and cognitive performance. While the literature shows some variability in results, several studies provide evidence supporting our observations. Notably, Szpak et al. (2019) demonstrated that VR environments can induce cognitive aftereffects independent of traditional cybersickness symptoms, leading to decreased task performance and increased reaction times. Similarly, Mittelstadt et al. (2019) observed that cognitive processing in VR environments can be compromised even in the absence of motion sickness or physical discomfort, suggesting that the cognitive load of virtual environments itself may influence task performance.
Moreover, the higher attention levels observed in the Monitor environment further underline the potential impact of subjects’ unfamiliarity with VR systems on cognitive engagement. The hypothesis that participants were not habituated to VR experiences seems plausible as their attention-related features manifested differently in the Monitor environment. The application of an LDA classifier to discern between erroneous and correct events substantiated this trend, with the Monitor environment demonstrating better performance. This suggests that the ErrP characteristics captured in the Monitor environment were not only more robust but also more easily differentiable.
Moving to the second comparison, which scrutinized the impact of error probability, events with a
The discovery of correlations between ErrP characteristics and specific attention features adds a layer of complexity to the relationship between ErrP and attention. Our analysis revealed significant positive correlations between the P300 amplitude of the ErrP response and sustained attention metrics, suggesting that stronger error detection mechanisms may be associated with enhanced attentional resources. Additionally, we observed a noteworthy negative relationship between the error-related negativity (ERN) latency and attention switching capacity. These findings align with previous research by Klimesch (2014), who demonstrated that attention-related oscillatory activity can modulate error processing mechanisms. Similarly, Datta et al. (2017) found that variations in attention levels can significantly impact the amplitude and timing of error-related potentials.
Our findings have particular relevance for the design and implementation of AR/VR protocols aimed at cognitive state stimulation. The observed differences in attention and ErrP responses between monitor and VR environments suggest that careful consideration must be given to the choice of interface when designing cognitive training or assessment protocols. The potential impact of environmental familiarity on cognitive engagement indicates that AR/VR protocols may need to incorporate adaptation periods or account for individual differences in technology experience.
Future studies would benefit significantly from incorporating standardized psychological attention assessments to provide a more comprehensive understanding of attentional processes. The Test of Variables of Attention (TOVA) Braverman et al. (2010) could offer valuable insights into sustained attention and response inhibition, while the Attention Network Test (ANT) Fan et al. (2002) would help differentiate between alerting, orienting, and executive attention networks. Additionally, the Multiple Object Tracking (MOT) paradigm Cavanagh and Alvarez (2005) could provide crucial data about divided attention capabilities in virtual environments. These established measures would complement our EEG-based attention metrics and potentially reveal how different aspects of attention interact with error processing in various virtual environments.
5 Conclusion
In conclusion, these dual comparisons highlight the interplay between stimulation environments, error probabilities, ErrP responses, and attention levels. The intricate nuances uncovered in these experiments underscore the importance of carefully considering these factors when designing experimental protocols and interpreting results, particularly in the dynamic realms of BCIs and virtual reality applications. Further research and in-depth analyses will undoubtedly contribute to a more comprehensive understanding of the interdependencies within these neural and cognitive phenomena.
Despite the promising findings, it is essential to acknowledge the limitations of our study. The relatively small sample size necessitates cautious interpretation of our results, and replication with larger populations is needed to validate these findings. Moreover, we only examined two specific environments, and additional research is needed to generalize these findings to other settings. Future studies could explore the potential benefits and drawbacks of various AR/VR environments and their effects on the ErrP response and attentional processes.
Our findings have significant implications for the development of AR/VR-based cognitive training protocols and therapeutic interventions. The observed relationship between environmental factors and cognitive responses suggests that careful attention must be paid to the design of virtual environments to optimize cognitive engagement and learning outcomes. Future research should focus on establishing standardized protocols for assessing attention and error processing in virtual environments, potentially incorporating multiple attention assessment tools to capture different aspects of cognitive function. This multi-modal approach would provide a more comprehensive understanding of how virtual environments influence cognitive processing and could lead to more effective and personalized AR/VR interventions.
Data availability statement
The raw data supporting the conclusions of this article will be made available by the authors, without undue reservation.
Ethics statement
The studies involving humans were approved by the Ethics Committee of Politecnico di Milano. The studies were conducted in accordance with the local legislation and institutional requirements. The participants provided their written informed consent to participate in this study. Written informed consent was obtained from the individual(s) for the publication of any potentially identifiable images or data included in this article.
Author contributions
AF: Conceptualization, Data curation, Formal Analysis, Investigation, Methodology, Software, Writing–original draft, Writing–review and editing. LM: Conceptualization, Data curation, Formal Analysis, Investigation, Supervision, Writing–review and editing.
Funding
The author(s) declare that no financial support was received for the research, authorship, and/or publication of this article.
Conflict of interest
The authors declare that the research was conducted in the absence of any commercial or financial relationships that could be construed as a potential conflict of interest.
Publisher’s note
All claims expressed in this article are solely those of the authors and do not necessarily represent those of their affiliated organizations, or those of the publisher, the editors and the reviewers. Any product that may be evaluated in this article, or claim that may be made by its manufacturer, is not guaranteed or endorsed by the publisher.
References
Bacigalupo, F., and Luck, S. J. (2019). Lateralized suppression of alpha-band eeg activity as a mechanism of target processing. J. Neurosci. 39, 900–917. doi:10.1523/JNEUROSCI.0183-18.2018
Barry, R. J., Clarke, A. R., and Johnstone, S. J. (2003). A review of electrophysiology in attention-deficit/hyperactivity disorder: I. qualitative and quantitative electroencephalography. Clin. Neurophysiol. 114, 171–183. doi:10.1016/S1388-2457(02)00362-0
Braboszcz, C., and Delorme, A. (2010). Lost in thoughts: neural markers of low alertness during mind wandering. NeuroImage 54, 3040–3047. doi:10.1016/j.neuroimage.2010.10.008
Braverman, E., Chen, A., Chen, T., Schoolfield, J., Notaro, A., Braverman, D., et al. (2010). Test of variables of attention (TOVA) as a predictor of early attention complaints, an antecedent to dementia. Neuropsychiatr. Dis. Treat. 6, 681–90. doi:10.2147/NDT.S12243
Buttfield, A., Ferrez, P. W., del, R., and Millan, J. (2006). Towards a robust bci: error potentials and online learning. IEEE Trans. Neural Syst. Rehabilitation Eng. 14, 164–168. doi:10.1109/tnsre.2006.875555
Cavanagh, P., and Alvarez, G. A. (2005). Tracking multiple targets with multifocal attention. Trends Cognitive Sci. 9, 349–354. doi:10.1016/j.tics.2005.05.009
Chavarriaga, R., del, R., and Millan, J. (2010). Learning from eeg error-related potentials in non invasive brain-computer interfaces. IEEE Trans. Neural Syst. Rehabilitation Eng. 18, 381–388. doi:10.1109/tnsre.2010.2053387
Clayton, M. S., Yeung, N., and Cohen Kadosh, R. (2018). The roles of cortical oscillations in sustained attention. Trends Cognitive Sci. 22, 347–356. doi:10.1016/j.tics.2018.02.004
Dal Seno, B., Matteucci, M., and Mainardi, L. (2010). Online detection of p300 and error potentials in a bci speller. Comput. Intell. Neurosci. 2010, 1–5. doi:10.1155/2010/307254
Datta, A., Cusack, R., Hawkins, K., Heutink, J., Rorden, C., Robertson, I. H., et al. (2017). The p300 as a marker of waning attention and error propensity. Comput. Intell. Neurosci. 2017, 3409749. doi:10.1155/2017/3409749
De Venuto, D., and Mezzina, G. (2021). A single-trial p300 detector based on symbolized eeg and autoencoded-(1d)cnn to improve itr performance in bcis. Sensors 21, 3961. doi:10.3390/s21123961
Duffy, F. H., Burchfiel, J. L., and Lombroso, C. T. (1979). Brain electrical activity mapping (beam): a method for extending the clinical utility of eeg and evoked potential data. Ann. Neurology 5, 309–321. doi:10.1002/ana.410050402
Falkenstein, M., Hohnsbein, J., and Hoormann, J. (1995). Event-related potential correlates of errors in reaction tasks. Electroencephalogr. Clin. neurophysiology. Suppl. 44, 287–296.
Falkenstein, M., Hoormann, J., Christ, S., and Hohnsbein, J. (2000). Erp components on reaction errors and their functional significance: a tutorial. Biol. Psychol. 51, 87–107. doi:10.1016/s0301-0511(99)00031-9
Fan, J., McCandliss, B. D., Sommer, T., Raz, A., and Posner, M. I. (2002). Testing the efficiency and independence of attentional networks. J. Cognitive Neurosci. 14, 340–347. doi:10.1162/089892902317361886
Farabbi, A., Aloia, V., and Mainardi, L. (2022). Arx-based eeg data balancing for error potential bci. J. Neural Eng. 19, 036023. doi:10.1088/1741-2552/ac6d7f
Farabbi, A., and Mainardi, L. (2022). Eeg analysis of selective attention during error potential bci experiments. 2022 IEEE 21st Mediterranean Electrotechnical Conference (MELECON) 420–423. doi:10.1109/MELECON53508.2022.9842955
Feng, L., Xiaoyu, L., Fei, W., Deng Yong, Z., Yi, X., and Yi, H. (2020). A novel P300 classification algorithm based on a principal component analysis-convolutional neural network. Appl. Sci. 10, 1546. doi:10.3390/app10041546
Ferrez, P., del, R., and Millan, J. (2008). Error-related eeg potentials generated during simulated brain-computer interaction. IEEE Trans. bio-medical Eng. 55, 923–929. doi:10.1109/tbme.2007.908083
Fu, Z., Sajad, A., Errington, S. P., Schall, J. D., and Rutishauser, U. (2023). Neurophysiological mechanisms of error monitoring in human and non-human primates. Nat. Rev. Neurosci. 24, 153–172. doi:10.1038/s41583-022-00670-w
Gehring, W. J., and Fencsik, D. E. (2001). Functions of the medial frontal cortex in the processing of conflict and errors. J. Neurosci. 21, 9430–9437. doi:10.1523/JNEUROSCI.21-23-09430.2001
Gola, M., Magnuski, M., Szumska, I., and Wrobel, A. (2013). Eeg beta band activity is related to attention and attentional deficits in the visual performance of elderly subjects. Int. J. Psychophysiol. 89, 334–341. doi:10.1016/j.ijpsycho.2013.05.007
Hajcak, G., McDonald, N., and Simons, R. (2003). To err is autonomic: error-related brain potentials, ans activity, and post-error compensatory behavior. Psychophysiology 40, 895–903. doi:10.1111/1469-8986.00107
Ke, J., Zhang, M., Luo, X., and Chen, J. (2021). Monitoring distraction of construction workers caused by noise using a wearable electroencephalography (eeg) device. Automation Constr. 125, 103598. doi:10.1016/j.autcon.2021.103598
Klimesch, W. (2014). Alpha-band oscillations, attention, and controlled access to stored information. Trends Cognitive Sci. 18, 606–617. doi:10.1016/j.tics.2012.10.007
Lotte, F., Bougrain, L., Chichokia, A., Clerk, M., Congedo, M., Rakotomamonjy, A., et al. (2018). A review of classification algorithms for eeg-based brain–computer interfaces: a 10 year update. J. Neural Eng. 15, 031005. doi:10.1088/1741-2552/aab2f2
Lutsyuk, N., Eismont, E., and Pavlenko, V. (2006). Correlation of the characteristics of eeg potentials with the indices of attention in 12-to 13-year-old children. Neurophysiology 38, 209–216. doi:10.1007/s11062-006-0048-4
Makeig, S. (1993). Auditory event-related dynamics of the eeg spectrum and effects of exposure to tones. Electroencephalogr. Clin. Neurophysiology 86, 283–293. doi:10.1016/0013-4694(93)90110-H
Michel, C. M., and Murray, M. M. (2012). Towards the utilization of eeg as a brain imaging tool. Neuroimage 61, 371–385. doi:10.1016/j.neuroimage.2011.12.039
Mittelstadt, J., Wacker, J., and Stelling, D. (2019). Vr aftereffect and the relation of cybersickness and cognitive performance. Virtual Real. 23, 143–154. doi:10.1007/s10055-018-0370-3
Ogrim, G., Kropotov, J., and Hestad, K. (2012). The quantitative eeg theta/beta ratio in attention deficit/hyperactivity disorder and normal controls: sensitivity, specificity, and behavioral correlates. Psychiatry Res. 198, 482–488. doi:10.1016/j.psychres.2011.12.041
Ranta-aho, P., Koistinen, A., and Ollikainen, J. (2003). Subspace regularization method for the single trial estimation of multi channel evoked potential measurements. IEEE Trans. Biomed. Eng. 46, 1–9. doi:10.1109/TBME.2002.807654
Škola, F., and Liarokapis, F. (2018). Embodied vr environment facilitates motor imagery brain–computer interface training. Comput. Graph. (Pergamon) 75, 59–71. doi:10.1016/j.cag.2018.05.024
Spuler, M., Bensch, M., Kleih, S., Rosenstiel, W., Bogdan, M., and Kubler, A. (2012). Online use of error-related potentials in healthy users and people with severe motor impairment increases performance of a P300-BCI. Clin. Neurophysiol. 123, 1328–1337. doi:10.1016/j.clinph.2011.11.082
Szpak, A., Michalski, S. C., Saredakis, D., Chen, C. S., and Loetscher, T. (2019). Beyond feeling sick: the visual and cognitive aftereffects of virtual reality. IEEE Access 7, 130883–130892. doi:10.1109/ACCESS.2019.2940073
Vauhkonen, M., Vadasz, D., Karjalainen, P. A., Somersalo, E., and Kaipio, J. P. (1998). Tikhonov regularization and prior information in electrical impedance tomography. IEEE Trans. Med. Imaging 17, 285–293. doi:10.1109/42.700740
Verleger, R., and Śmigasiewicz, K. (2020). Effects of relevance and response frequency on p3b amplitudes: review of findings and comparison of hypotheses about the process reflected by p3b. Psychophysiology 57, e13542. doi:10.1111/psyp.13542
Vourvopoulos, A., Pardo, O. M., Lefebvre, S., Neureither, M., Saldana, D., Jahng, E., et al. (2019). Effects of a brain-computer interface with virtual reality (vr) neurofeedback: a pilot study in chronic stroke patients. Front. Hum. Neurosci. 13, 210. doi:10.3389/fnhum.2019.00210
Keywords: brain computer interfaces, electroencephalography, error related potential, signal processing, virtual reality, machine learning
Citation: Farabbi A and Mainardi L (2024) Assessing the impact of stimulation environment and error probability on ErrP EEG response, detection and subject attention: an explorative study. Front. Virtual Real. 5:1433082. doi: 10.3389/frvir.2024.1433082
Received: 15 May 2024; Accepted: 27 November 2024;
Published: 20 December 2024.
Edited by:
Gaetano Tieri, Unitelma Sapienza University, ItalyReviewed by:
Bethany McCurdy, Iowa State University, United StatesGiacinto Barresi, University of the West of England, United Kingdom
Amir Jahanian Najafabadi, University of Bielefeld, Germany
Roshan Venkatakrishnan, University of Florida, United States
Copyright © 2024 Farabbi and Mainardi. This is an open-access article distributed under the terms of the Creative Commons Attribution License (CC BY). The use, distribution or reproduction in other forums is permitted, provided the original author(s) and the copyright owner(s) are credited and that the original publication in this journal is cited, in accordance with accepted academic practice. No use, distribution or reproduction is permitted which does not comply with these terms.
*Correspondence: Andrea Farabbi, YW5kcmVhLmZhcmFiYmlAcG9saW1pLml0
 Andrea Farabbi
 Luca Mainardi